 Sebastian Sandoval Olascoga1
 Evelyn Shu
 Jeremy Porter
- 1Independent Researcher, First Street, New York City, NY, United States
- 2American Institutes for Research, Washington, DC, United States
- 3The City University of New York, New York, NY, United States
Introduction: Exposure to flood risk has been linked to property value decreases, negative health/well-being, and both short and long-term population displacement. That being said, our understanding of these consequences is generally limited by geographic scope, due to an overreliance on aggregated case studies of flood exposure, and research design, due to the lack of access to repeated property-level transaction data.
Methods: Using a nationwide high-resolution historic flood exposure event database and longitudinal residential property-level transaction information, this research identifies relationships between neighborhood exposure to flooding and property valuation. Furthermore, this analysis introduces a market component by accounting for the context of growth, and decline, in populations in the area to account for the potentially confounding effect of housing demand.
Results: The results of the longitudinal, within-property, analysis indicate the average treatment effect of flood exposure on property values is both negative and persistently impactful over time. When paired with future population and flood exposure forecasts, this research further identifies the potential impact of increasing flood exposure on increases in property devaluation 30 years into the future.
Discussion: Finally, the elasticity of these negative effects is modeled against property-derived tax revenues and indicates that in some areas of the country, decreasing property values due to flood exposure have had an important impact on community finances and the ability to fund projects related to risk adaptation.
Introduction
Nearly all of the world's population is exposed to weather events that have been exacerbated by climate change (Callaghan et al., 2021). These extreme weather events have intensified in recent years and are only expected to become more severe. Furthermore, these impacts have been directly connected to impacts on human systems, including economic, social, and political crises (Ide et al., 2020). At the same time, humans have concurrently settled in areas at risk of climate impacts and areas that were previously thought to have low or no exposure (Tedesco et al., 2020). Adding to the complexity of disentangling the various impacts on human systems, different areas are exposed to different climate hazards (i.e., flood, wildfire, extreme heat, drought, etc.), but it is important to highlight the fact that flood is by far the most impactful climate hazard in regard to both areas exposed and economic damages [NOAA National Centers for Environmental Information (NCEI), 2022]. In fact, since 1980, nearly half of the damages associated with the 300+ disaster events responsible for $2.3 trillion in damages across the US can be attributed to flooding and tropical cyclones [NOAA National Centers for Environmental Information (NCEI), 2022].
There are additional impacts arising from actual or perceived flood risk, which have significant financial consequences for households, communities, and markets across the US (McAlpine and Porter, 2018; Bakkensen and Barrage, 2017; Shu et al., 2022; Porter et al., 2022). In fact, several studies have shown that properties located in the Federal Emergency Management Association's (FEMA) 1% annual chance floodplain (the SFHA) sell at a discount, and the discount tends to be most pronounced in the aftermath of a major flood event (Atreya et al., 2013; Bin and Landry, 2013; Bin et al., 2008; Ortega and Taṣpınar, 2018; Shu et al., 2022). In New York City, (Ortega and Taṣpınar 2018) found that in the aftermath of Hurricane Sandy, undamaged homes located in the SFHA persistently sold at discounts that reached 8% in 2017 and that the trend did not show signs of abating. In Miami-Dade County, FL, Shu et al. (2022) similarly found a reduction in price appreciation for single-family homes of $2.82 per square foot annually even when actual risk was controlled for, showing the role of the perception of nearby risk. In Dougherty County, GA, (Atreya et al. 2013) found that a major flood in 1994 caused property values in flood zones to drop significantly but that the impact was relatively short-lived, disappearing within a decade. In similar studies of Carteret County, NC (Bin et al., 2008), and Pitt County, NC (Bin and Polasky, 2004), researchers similarly found that location within the SFHA has a significant negative impact on property value.
While these economic shifts are most definitely connected to the observed damage incurred by properties and communities exposed to flood risk, other indirect factors impact these shifts as well. Shu et al. (2023) highlight one of those emerging trends in the form of residential preference and the role that increasing awareness around flood risk is playing in that decision making process. Even independent of climate risk, population changes can have a significant impact on regional economic activity. When the population in an area grows, it can lead to an increase in demand for goods and services, which can stimulate economic activity and lead to job creation. This, in turn, can lead to further population growth as more people are attracted to the area due to the availability of jobs. On the other hand, a decrease in the population can have the opposite effect. As the number of people in an area decreases, there may be less demand for goods and services, leading to a decrease in economic activity and job losses. This can create a downward spiral, as the loss of jobs can lead to more people leaving the area, which can further decrease the population and economic activity. If a city is unable to attract and retain residents, it may struggle to support businesses and provide essential services, which can have negative consequences for the local economy and quality of life. Moreover, a slowing population can lead to declining property values, which can affect the city's tax base and ability to fund important services.
Building on this narrative, this study aims to test the relationship between flood exposure and changes in property values by implementing a research design which takes advantage of repeated sales in a national, property-level, transaction record file through a comparison of differences in sales among properties exposed to flooding in between the transactions (treatment group) and those not exposed to flooding between transactions (control group). This approach builds on the current literature in this space, which is primarily focused on the estimation of property value impacts from a hedonic pricing perspective (see McAlpine and Porter, 2018 for instance) and allows for a more directly causal understanding of the impact of flood exposure on changing property values. Furthermore, this study integrates a proxy for larger community health by integrating population trends as a contextual variable into the analysis. The original hypotheses driving these analyses are that; (1) properties exposed to flood risk in between sales records are likely to see a negative impact on property valuation relative to properties not exposed to flooding in between recorded translations and (2) the negative impacts of flooding in growing communities (per population change prior to flood exposure) we see a muted effect of flooding on property values which will likely correct do to associated market demand in the area.
Providing further support, recent work by (Contat et al. 2024) provides a very recent comprehensive survey of the literature at the intersection of climate risk and real estate, documenting a substantial and growing body of research that evaluates how climate-related hazards—especially flooding—affect property markets. Their review emphasizes that many studies have moved beyond static flood risk maps and now utilize actual flood events to estimate the impact of hazard exposure on housing values. These studies typically apply hedonic pricing or repeat-sales methods to assess short- and medium-term price effects following major flood events, often focusing on specific cities or regions. Contat et al. also highlight important methodological innovations in identifying both direct and indirect market responses to flood risk, including changes in mortgage lending, insurance coverage, and consumer behavior.
Our research builds upon and extends this literature by employing a high-resolution, nationwide panel of residential property transactions and linking them with a longitudinal record of observed flood events spanning over two decades. While much of the empirical work reviewed in (Contat et al. 2024) is geographically or temporally localized, our study leverages a unified research design—namely a repeated-sales, difference-in-differences framework—to estimate the persistent effects of flood exposure across the full United States. Additionally, we explicitly incorporate local demographic trends (i.e., population change) to assess how underlying demand conditions moderate the market response to flood events. In doing so, we complement the regional studies described by Contat et al., by offering a scalable, national perspective on flood-induced price adjustments and their interaction with long-term socioeconomic dynamics.
Purpose
This article contributes to the existing peer-reviewed literature on climate risk and property values by offering a detailed, property-level analysis of how flood exposure influences residential real estate transactions over time. While previous research has often relied on aggregated data or localized case studies, this study utilizes a large, nationwide dataset of over 8 million individual property transactions, matched with tract-level records of historic flood events. By applying a repeated-sales design and an event study framework using difference-in-differences estimation, the authors are able to more directly assess the relationship between flood exposure and changes in property values. This methodological approach strengthens the causal interpretation of the findings and adds a layer of granularity that complements more traditional hedonic pricing models used in earlier studies.
Beyond its empirical approach, the study also incorporates broader demographic trends by analyzing the role of population change in moderating property market responses to flood exposure. The findings suggest that flood-related price impacts are more pronounced and persistent in areas experiencing population decline, while growing areas may exhibit more limited or temporary effects. The authors further connect these valuation changes to potential fiscal implications, estimating how reduced property values may translate into declines in local property tax revenues. Finally, by integrating future projections of flood risk and population dynamics, the article extends its relevance to forward-looking policy and planning discussions. Taken together, the study adds nuance and scale to the understanding of how climate-related hazards interact with local housing markets and municipal finance.
Background
Flood exposure and property value impacts
Flooding has a significant and multifaceted impact on property values, leading to both immediate and long-term devaluation of affected properties. In the short term, properties that have experienced flooding or are located in flood-prone areas often see a marked decrease in value due to the heightened risk and cost associated with potential flood damage (Bin and Polasky, 2004). The financial burden of repairs, the necessity of higher insurance premiums, and the potential for recurring damage deter prospective buyers, resulting in decreased demand and consequently lower property prices (Atreya et al., 2013). Additionally, the psychological impact on potential buyers, who may fear the disruption and loss associated with flooding, further depresses property values in these areas.
The long-term impact of flooding on property values extends beyond immediate damage. Repeated flooding events can lead to a perception of an area as undesirable, resulting in prolonged depreciation of property values (Lamond et al., 2009). This perception is often reinforced by negative media coverage and increased public awareness of flood risks, which can stigmatize affected areas and deter potential buyers for years to come. Moreover, the financial markets can react negatively to repeated flooding events, affecting the broader real estate market in flood-prone regions and contributing to a long-term decline in property values (Pope, 2008).
In addition to the direct damage and long-term devaluation, flooding can also impact property values through changes in policy and insurance practices. The implementation of stricter building codes and zoning laws in response to flooding can increase construction and renovation costs, further affecting property values (Bin et al., 2008). These regulations, while aimed at reducing future flood risk, can make it more expensive to buy, sell, or maintain properties in flood-prone areas. Higher insurance premiums and limited availability of flood insurance can also make properties less attractive to potential buyers, contributing to lower market values (Kousky, 2010).
Finally, the social and community impacts of flooding contribute to the overall devaluation of property values. Flooding often disrupts local economies, displaces residents, and damages infrastructure, leading to a decline in the overall desirability of a neighborhood or community (Bagstad et al., 2007). The loss of community amenities, such as schools, parks, and businesses, can have a lasting impact on property values, as prospective buyers consider not only the individual property but also the quality of the surrounding area. In sum, the impact of flooding on property values is profound and multifaceted, affecting not only the immediate financial aspects of property ownership but also the long-term desirability and stability of communities.
Flood exposure and population change
Some projections estimate that up to 216 million people may migrate due to climate change by 2050 (Clement et al., 2021) and that increased risk due to sea level rise could lead to large migrations as communities move away from rising risk (Hauer, 2017; Robinson et al., 2020; Strauss et al., 2015). Recent research has documented an observed association between such exposure and the shifting demographics of an area as drivers of an emerging phenomenon termed “climate gentrification” (Keenan et al., 2018), or “climate migration” (Shu et al., 2023).
With 21.8 million properties currently at risk of flooding within the Contiguous United States, and 23.5 million expected to have flood risk by the middle of the century (Armal et al., 2020), it is important to understand the community and economic impacts of increased flood exposure to inform decisions around community and infrastructure planning, mitigation and adaptation opportunities, and industry investments to match changes to demand (Hauer, 2017; Black et al., 2011; Mueller et al., 2014; Hugo, 2011). While there is a growing body of research in the area of understanding how climate risk and exposure manifest in a variety of social, economic, and political consequences, there is still debate on the timing, magnitude, and scale. For example, there is considerable debate on issues including population responses to changing coastlines, variations in risk from tidal and storm inundation (Keenan et al., 2018; Hauer, 2017), what adaptation may be feasible and undertaken (Hinkel et al., 2014; Nicholls and Cazenave, 2010), and how much mitigation may impact the realization of global sea level risk (SLR) (Strauss et al., 2015).
When considering adaptation projects to reduce risk, the costs are often justified by estimating future property values and the overall economic return of protected places (Fu et al., 2016). Traditionally, projected estimates of property values to be impacted are conducted by estimating the amount of property value that will be permanently inundated after 1, 2, 3, or more feet of SLR. Additionally, most research is focused on these impacts at aggregate geographic levels and neglects to understand the hyperlocal variations in exposure, risk, and property characteristics. These approaches also underestimate, or fail to capture, that in the most at-risk communities, negative economic impacts are already being identified (for example, see McAlpine and Porter, 2018), which may give a better understanding of what's to come as flood risk continues to expand under a changing climate.
More important to this research, many of the drivers linking flood exposure and market responses are indirectly tied to mechanisms of demand. More specifically, exposure to flood events and the subsequent population dynamics associated with those shifts have direct and indirect impacts on property values. Directly, the damages from exposure, increased insurance rates, and rising awareness of risk all impact the demand for housing in the area. More indirectly, the shifting character of the population and community following flood disasters can impact commercial business opportunities/viability and local government funding (Gourevitch et al., 2022). However, this research does little to inform our understanding of the intersection of population change and property valuation in the context of exposure to flood risk. It is at this intersection that one might expect an amplification, or protection, effect of larger market conditions in the relationship of catastrophic climate exposure on property valuation.
Understanding these relationships is further complicated by the pull-factors associated with coastal and urban amenities as well as the large labor and housing markets that have historically been located in some of those areas with plentiful water resources. Disentangling the negative impact of flood exposure from the positive impact of water proximity has been the focus of a number of researchers, with results that indicate that buyers are increasingly considering elevation and flood risk when purchasing homes (Keenan et al., 2018; Keys and Mulder, 2020; McAlpine and Porter, 2018; Shu et al., 2023). Within the intricate interplay of pull factors, such as migration, and push factors, including extreme weather events, the literature has debated the housing market's response to flooding events. On one side of the debate, it is argued that flooding disasters lead to decreased property values in affected areas. This perspective suggests that both sellers and buyers, increasingly aware of disaster risks, drive down property values after events like hurricanes and floods (Kousky, 2010; Ortega and Taṣpınar, 2018). In contrast, an opposing narrative posits that disasters can actually boost property values in affected areas. This occurs through the creation of a rent gap and the stimulation of gentrification in the affected region, resulting in upward movements in both housing values and rents (Van Holm and Wyczalkowski, 2019; Vigdor, 2008).
Moreover, the impact of flooding events on property values has a cascading effect on the fiscal health of local governments. Flood events and extreme weather events can also impact property taxes and, consequently, local revenues (Heipertz and Nickel, 2008; Lis and Nickel, 2010). The impact of flooding events on property values has broader implications for local government finances. Floods may lead to a significant drop in property values due to physical damage and perceived flood risks. This decline can result in lower property tax revenue for municipalities, creating challenges in funding essential services during the post-flood recovery phase. Understanding and exploring these dynamics is crucial for policymakers and communities as it informs strategies for resilience planning, disaster recovery, and ensuring the sustainability of local government operations in the face of climate-related challenges.
Theoretical framework
This study draws on and extends the conceptual foundation articulated by Tobin and Newton (1986), who proposed a theoretical framework for understanding how flood events affect urban land values. Their model identifies a range of direct and indirect pathways through which flood exposure can alter the perceived and actual value of land, including physical damage, increased insurance and financing costs, changes in regulatory frameworks, and shifts in buyer perceptions and risk tolerance. Importantly, their framework emphasizes that the impact of flooding on land values is not uniform but depends on a set of mediating factors such as location desirability, public investment in mitigation, and market dynamics.
Building on this foundation, the present study operationalizes many of Tobin and Newton's theoretical concepts within a modern empirical framework, using longitudinal transaction-level data to isolate the price effects of flood exposure over time. The repeated-sales difference-in-differences approach employed here is particularly suited to test Tobin and Newton's assertion that flood impacts are dynamic and context-dependent. The inclusion of population change as a moderating variable aligns with their notion of market conditions as a key driver of post-flood value adjustments. In areas with growing populations, the demand for housing may buffer the negative effects of flood exposure, whereas in shrinking markets, those same exposures may accelerate value declines due to diminished buyer interest and investor confidence.
Moreover, the study incorporates the broader economic implications of flood-induced devaluation by linking property value changes to municipal revenue systems—a logical extension of Tobin and Newton's argument that land value changes can reverberate through urban systems. In this way, the theoretical framework guiding this research acknowledges the multi-scalar effects of flooding—from parcel-level pricing to regional fiscal stability—and highlights the importance of temporal and spatial context in shaping these outcomes. By embedding this empirical analysis within a conceptual model rooted in land economics and urban risk theory, the study offers both theoretical reinforcement and methodological advancement to the literature on climate risk and property markets.
Data and methods
This research builds on that work by examining historic risk exposure, property valuation, and tax revenue changes since 2000. It aims to address the dynamic interplay between flood exposure, property valuation, and local tax revenue since 2000 at the hyper-local level of census tracts. By focusing on smaller geographic units, this study seeks to provide a more granular understanding of how flood risk impacts residential property values. This analysis reveals a clear and observable relationship between flood exposure at the census tract level and the transaction values of associated residential properties. Understanding these nuanced connections is of paramount importance in the face of a changing climate, where extreme weather events and flooding are expected to become increasingly severe. Not only do such events have direct impacts on property values, but they also influence population dynamics, migration patterns, and local government finances. Moreover, as communities grapple with the complexities of adaptation and mitigation strategies, this research offers valuable insights into the economic and social consequences of flood exposure.
A central contribution of this study lies in the scope and structure of the dataset used, which distinguishes it from much of the existing literature. While prior studies—many of which are cited in (Contat et al. 2024)—typically analyze flood impacts in the context of specific disasters or limited geographic areas, our analysis draws on a nationally standardized, property-level transaction dataset encompassing over 8 million sales across the contiguous United States. This allows for a consistent, longitudinal examination of flood exposure impacts at a national scale. Furthermore, our use of the (Lai et al. 2022) dataset for flood event identification offers a novel approach to spatially and temporally link observed flooding to property transactions using a natural language processing pipeline. While we acknowledge that this method does not capture flood intensity or depth, it provides broad spatial coverage and allows for the construction of high-resolution, tract-level flood exposure histories over two decades—features that make it particularly well suited for nationwide longitudinal analysis. Together, these elements offer a more comprehensive view of market responses to flood events than many earlier case-based studies.
Data sources
In this manuscript, we have undertaken an integration of various datasets to analyze the interplay between historic flood exposure, population demographics, residential property valuations, and tax collection. This multidimensional approach allows us to gain a nuanced understanding of the complex factors influencing property transactions and values. The property transaction data come from LightBox, which compiles residential sales records from over 3,000 county assessor offices, covering the period from 2000 to 2020 at the property level. Flood exposure data are drawn from two sources: NOAA's Storm Events Database and the tract-level event database developed by (Lai et al. 2022), both of which provide annual event-level coverage for the contiguous U.S. over the same period. Population data are sourced from the U.S. Census (2000 and 2010) and block group-level population projections from Shu et al. (2023) aligned to the SSP framework. Property tax revenue and composition data come from the U.S. Census Bureau's State and Local Government Finance Survey, reported annually at the county level.
This analysis only makes use of residential properties identified in the Lightbox dataset as “single family residential”. For these residential properties, only transactions for properties that meet certain criteria are used in the analysis. The International Residential Code (IRC), which is the most widely adopted residential building code in the US, requires that all homes have at least one room with 70 square feet of habitable space (International Code Council, Inc., 2021). Additionally, to reduce noise from outliers as well as potential data errors, an upper limit of 6,000 square feet was chosen to represent the maximum size of a single-family residential property. As such, and as property values are operationalized in this manuscript as transaction price by square foot, any property records with under 70 square feet or over 6,000 square feet are removed from the sample. An additional limit for the number of units associated with a property is also added, with only properties kept that have 5 or fewer units reported. This process resulted in a final dataset comprising 8,148,080 property transactions, all of which met the specified criteria. In areas with decreasing populations, there are 6,115,403 transactions. In areas with increasing populations, there are 1,956,173 transactions.
Historic flood exposure was accounted for using tract-level data from the sources detailed in (Lai et al. 2022), and from the NOAA Storm Events Database. These two sources capture the recording of flood events over the time period of 2000–2020 and allow for the geographic placement of those flood events in specific census tracts. By geolocating these flood events, we are able to link specific property transactions from the Lightbox data mentioned above to specific points in time directly preceding and flooding the identification of a flood event. By leveraging these sources, we are able to construct a foundation for assessing flood-related risks at a high resolution for the Contiguous United States, while accounting for neighborhood exposures and their impact on property transactions. The author's wish to note that while these datasets give good geographic coverage of historic flood exposure (Lai et al., 2022, in particular), they do not provide insight into the magnitude of the flood event. However, given the methods of data collection an assumption has been made here that if the flood event were prominent enough to be captured in the public sources being investigated, it would have at least a moderate flood impact on the community, with more severe local impacts.
The modeling procedures discussed below all took place at the property transaction level. However, it's essential to note that while certain data elements, such as historical flooding data, were aggregated at a higher level of geographic granularity, like the Census Tract, they were treated as “repeated measures” for all properties within the same higher-level unit. This approach ensures that the broader context of geographic regions and their historical flood exposure is considered when examining individual property transactions. In order to understand the downstream implications of changing property values, local tax revenue data, including sources of that revenue, are provided through the US Census Bureau's State and Local Government Finance Survey (United States Census Bureau, 2023). These data provide sub-housing market indicators of the proportion of all local revenue directly tied to property valuation. The data further allow for an understanding of the elasticity of tax revenues in their relationships to shifting property values. For properties located in tracts with multiple flood events, we assign treatment based on the first observed flood event within the study period to preserve temporal consistency in cohort assignment. Each transaction is matched to its corresponding pre- or post-flood period relative to that initial exposure. We note that robustness checks comparing outcomes for properties affected by a single vs. multiple events are a valuable extension and propose them for future research.
Materials and methods
Impact of historical flood exposure on the housing market
Main estimand
We aim to understand how past exposure to floods affects property transactions over time. In other words, we aim to estimate the average treatment effect on the treated (ATT) of historic flood exposure on a property transaction, i, valuation dynamics, Y, for cohort, g, at event time e≡t−g, which is defined as:
Where, E [·], is the expected value operator, Yi, t + e (g), is the observed outcome of interest for a treated property transaction, i, located within a census tract impacted by a flood event, during event time, e. Yi, t + e (×) is the observed outcome of interest for a control property transaction, i. Note that ATTg, e identifies the average treatment effect on the treated cohort, g, at event time e ≡ t − g, and we are interested in the ATT across treated cohorts for a given event time, i.e., ATTe, which we obtain as the weighted mean of each ATTg, e:
represents the number of properties in the cohort g, whereas, , is the number of properties that received treatment at one point in time. Thus, when aggregating ATTg, e to ATTe, estimates from cohorts with a higher number of treated units will receive a higher weight.
In our framework, treatment cohorts (denoted as g) are defined based on the year in which a census tract first experiences a flood event during the study period. All properties within that tract are assigned to that cohort if they transact at any time before or after the event. Thus, the cohort reflects the timing of exposure rather than the transaction year, allowing us to estimate dynamic treatment effects relative to the event year. Equation 2 aggregates cohort-specific average treatment effects by weighting each cohort-event-time estimate by the proportion of observations in that cohort. These weights reflect the relative size of treated units and ensure that more populated cohorts contribute proportionally to the aggregated ATT estimates.
We acknowledge that the decision to transact may itself be influenced by flood exposure or by anticipated market conditions—raising the possibility of selection into treatment. This is a limitation shared by many observational studies of disaster impacts, including event studies. While our use of repeated-sales data helps mitigate this concern by conditioning on prior sales behavior, we cannot entirely rule out the possibility that post-flood sale decisions differ systematically from non-flooded areas. We note this as a potential source of bias and recommend further research using complementary designs (e.g., propensity score weighting or first-stage models of transaction likelihood) to explicitly test for selection effects. Nonetheless, we argue that the repeated-sales design and the inclusion of property-level fixed effects reduce susceptibility to omitted variable bias relative to cross-sectional approaches.
Estimator
To identify the ATTe, we rely on Sun and Abraham's (2021) generalized difference-in-differences event study estimator, which has as a unit of observation the property transaction, i, in the year, t, taking the following empirical form:
Where ln(Yit) is the natural logarithm of outcome of the transaction, i, in the year, t. Cohort i = e} is an event study dummy that takes the value of 1 if the unit is, e, periods away from the treatment (i.e., being located within a census tract impacted by a flood event) and 0 otherwise. Period e = −1 is the baseline. λi and θt are property and year/month fixed-effects, respectively. Property-level fixed effects control for all time-invariant characteristics of a property, whereas year/month fixed-effects control for year characteristics impacting the whole United States, such as economic shocks or consumer sentiment and for seasonal effects. Standard errors are clustered at the census tract level. To go from to βe, we use the weight, ϱg, e, defined in Equation 2 for event time, e. The causal identifying assumption for βe = ATTe is that outcomes within census tracts impacted by a flood event would have continued along the same trajectory without exposure. To formally test this assumption, we jointly test the null hypothesis: β−7 =... = β− 2.
In our application of Sun and Abraham's (2021) estimator, Equation 3 models the log sale price per square foot of individual residential properties as a function of time since flood exposure in the census tract where the property is located. Each property is assigned to a treatment cohort based on the year of first flood exposure in its tract, and dynamic effects are estimated for each event time relative to that year. Property fixed effects control for unchanging characteristics of each home (e.g., structure type, location), while time fixed effects account for national trends and seasonality. Equation 2 aggregates these cohort-specific treatment effects across cohorts using weights proportional to the number of treated properties in each group, ensuring that larger cohorts contribute more to the overall estimates. This approach allows us to estimate how the effect of flood exposure on property values evolves over time while controlling for heterogeneity in treatment timing and impact.
To situate our methodological approach within the existing literature, we note that several recent studies analyzing flood-related property value impacts have also employed event-study frameworks based on (Sun and Abraham 2021). While these studies primarily focus on regional markets or discrete flood events, our application of the estimator is distinct in that it leverages a national, longitudinal property-level dataset and a repeated-sales design. This combination enables us to estimate heterogeneous treatment effects of flood exposure across space and time while controlling for unobserved, time-invariant property characteristics. Our approach builds on the strengths of Sun and Abraham's methodology—particularly its ability to address bias in staggered adoption settings—while extending its application to the context of real estate markets affected by recurring environmental hazards. Unlike prior applications that typically rely on cross-sectional or single-sale datasets, our repeated-sales structure enhances causal inference by anchoring changes in valuation within the same property across time.
In selecting the estimator from (Sun and Abraham 2021), we aimed to address well-documented limitations of traditional two-way fixed effects (TWFE) models in settings with staggered treatment timing and treatment effect heterogeneity. Unlike TWFE, which can produce biased estimates when treatment effects vary over time or across units, Sun and Abraham's approach explicitly models these dynamics and recovers cohort-specific treatment effects before aggregating them using transparent weighting. This is particularly important in our context, where flood events occur in different tracts and years, and their impacts likely vary by local housing market conditions. We recognize that this estimator still assumes no selection into treatment and parallel pre-treatment trends within cohorts—assumptions that warrant careful interpretation. While alternative approaches such as (Callaway and Sant'Anna 2021) or (de Chaisemartin and D'Haultfoeuille 2020) also address heterogeneity in panel data settings, we opted for Sun and Abraham's framework due to its direct compatibility with an event-study structure and its interpretability for long-run dynamic effects, which are central to our analysis.
Pre-flood migration
To assess how pre-flood migration patterns impact the trajectory of property sale prices following a flood event, we begin by calculating the difference between the population counts in the 2010 and 2000 decennial censuses at the tract level. This calculation helps determine whether property transactions occur within census tracts experiencing population growth or decline. We then estimate separately Equation 3 for properties located in growing and declining census tracts.
Property tax implications of housing price declines
To evaluate the potential consequences of declining property values on property tax revenues following flood events, we operate under the assumption that either every property within a county is impacted by flooding or that there is a ripple effect on property values in a county due to properties affected by flooding. We then employ the following three-step methodology to estimate the potential decrease in property tax revenues due to flooding events:
1. As we lack access to an annual nationwide historical parcel tax assessments database, we depend on aggregated county-level historical data concerning tax collections and sale prices to estimate the elasticity of tax revenue in response to changes in sale prices, using the following empirical form:
Where, ln(Yst) and ln( Xst), are the natural logarithm of the mean sale price of residential properties and total property tax collection in state, s, during year, t, respectively. θt represents year fixed-effects. Standard errors are clustered at the county level. The coefficients of interest are, ξs, which tells us the elasticity of property tax revenue to sale price fluctuations for state, s. Running separate regressions for each state provides flexible elasticity measures specific to each state, helping to account for differences in tax policies, property tax rates, and assessment practices.
2. Using the estimated elasticity of tax revenue to sale prices, , from Equation 4 and the impact of flood exposure on a property transaction, , from Equation 3, we estimate the potential downfall, DC, in annual property tax collection, PTc, in county, c, from a flooding event as . To better understand the relative impact of a decline in property taxes, we present the potential downfalls as percentage decreases of both total tax collections and total revenues.
Equation 4 assumes, for simplicity, that both property tax rates and transaction volumes remain stable in the aftermath of flooding events. We acknowledge that these components may also be affected by flooding, which limits the causal interpretation of the results. As such, we frame this analysis as an exploratory illustration of potential revenue sensitivity, rather than a definitive fiscal impact estimate. The authors offer this extension of the property value analysis as a way of better understanding the community impacts of property level valuation impacts. However the lack of spatial and temporal granularity in the tax revenue data only allow for a superficial examination of these relationships. Future research should extend this analysis with higher resolution data to obtain a more actionable understanding of the impacts.
Exploring the dynamics of future flood risk, migration, and property valuations
To gain insight into the evolving effects of flood risk, future migration, and other factors on residential property values, we combine future population projections at the block group level (Shu et al., 2023), future flood inundation projections (First Street Foundation, 2020), and estimates derived from Equation 3. This comprehensive set of data and estimates collectively reveals the dynamic landscape of flood risk exposure and migration, allowing us to assess its supplementary impact on residential property valuation changes over time.
The flood inundation projections, part of our comprehensive analysis, provide estimates of the percentage of properties expected to be inundated based on various return periods, and these estimates are calculated at the tract level. The data encompasses return periods of 5, 20, 100, and 500 years for both the present scenario and 30 years into the future under SSP245. To maintain a conservative approach, we assume that all existing flood risk is already accounted for in current property valuation growth or decline rates. Consequently, the primary focus of our future projections lies in assessing the alteration of this flood risk over the 30-year timeframe. This assessment is quantified as the absolute change in the percentage of properties expected to be inundated. An area is deemed to have an increased risk if the absolute change in the proportion of inundated properties is 0.1% or greater.
Future population projections are available at 10-year intervals, ranging from 2020 to 2100, and encompass all Shared Socioeconomic Pathways (SSPs). Given that the flood future projections data extend ~30 years into the future (~2053), we've confined our use of future population projections to 2050 and 2060, incorporating their average to create our future population scenario. Subsequently, we assign a binary indicator, which signifies whether an area is expected to experience population growth or decline in the future.
For calculating future flood probabilities related to each return period, we leverage the probability of encountering a flood over the 30-year period as a weighting factor for the estimates in Equation 3. This probability is defined as
Here, P(x) represents the probability of no flood occurring each year, determined by the annual probabilities corresponding to each return period. The popgrowth variables refer to the respective positive or negative population growth set of estimates, with “a” and “b” representing the scenarios “after a flood experience” and “without a flood experience,” respectively.
Hypotheses
This study is guided by three central hypotheses, each grounded in prior research on flood risk, property valuation, and demographic trends:
• Flood Exposure Hypothesis: Properties located within census tracts that experience flood events will, on average, exhibit a statistically significant and persistent decrease in sale price per square foot compared to otherwise similar properties in non-flooded areas.
• Population Moderation Hypothesis: The negative effect of flood exposure on property values will be more pronounced in areas experiencing population decline and relatively muted in areas experiencing population growth, due to underlying differences in housing demand and market resilience.
• Fiscal Consequences Hypothesis: Declines in property values following flood exposure will, under certain assumptions, translate into measurable reductions in local property tax revenues, with implications for municipal fiscal capacity and service provision.
Results
Descriptive statistics
Table 1 presents descriptive statistics for our main outcome of interest: sale prices per square foot, focusing on two distinct subpopulations—census tracts with positive and negative net migration between 2010 and 2000. Notably, over the studied period, census tracts experiencing a decline in population tend to correspond with lower sale prices across most segments of the sale price distribution. This observation underscores the relationship between migration trends and property values, a connection that will be further explored in the subsequent sections of this study.
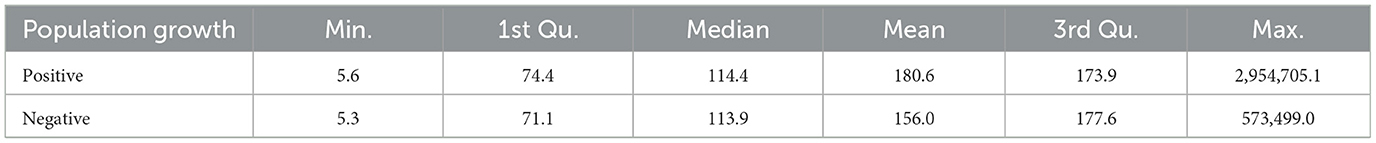
Table 1. Sale prices by square foot.
Figure 1 highlights the differences among properties that were impacted by flooding at any time in the data record with a focus on population change. Interestingly, the only place where we see a differential, and statistically significant effect, is in the time period preceding the exposure to flood risk. The results show that areas with positive population growth saw on average a 3% increase in property value in the time period preceding exposure, vs. properties in areas with declining population which saw an average of about a 1% decline in property values in over. Given that this repeated sales analysis was restricted to only properties that sold multiple times before flood exposure, these results can be seen as more directly tied to population change, independent of flood. Immediately following the flood exposure the average impact on property values was negative for both growing and declining areas (as measured by population change), but those differences for areas with positive growth were not statistically significant. On the other hand, in areas that were affected by floods, both positive and negative population change areas saw a negative impact on property value, but the two were not statistically different from one another.
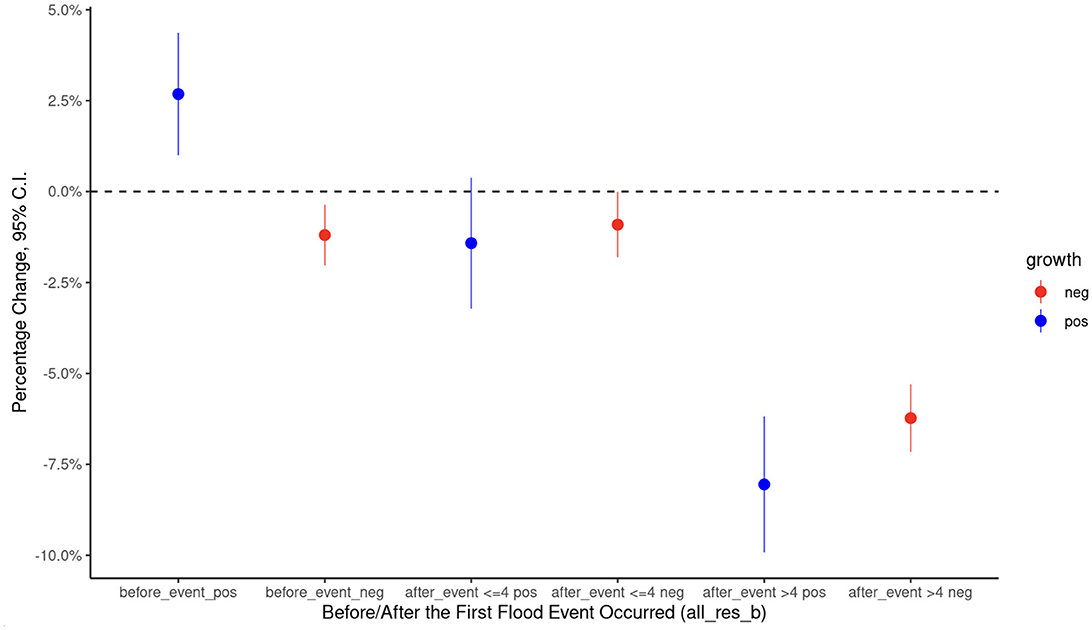
Figure 1. Property value impacts of population change preceding exposure (0–4 year before), immediately following exposure (1–4 years after), and persist effects following exposure (5+ years after).
Flood exposure and housing prices
Flood events may reshape the landscape of housing sale prices and property assessments. The aftermath of a flood typically depicts a picture of damaged structures, compromised foundations, and long-term questions regarding the viability of the affected location. As potential buyers factor in the costs of repairs, renovations, and the looming uncertainty of insuring properties in flood-prone zones, they may bid lower prices for affected properties. Consequently, properties in areas that have recently experienced flooding may experience a decrease in their sale prices, which may generate negative externalities on neighboring non-affected properties. This change in sale price could come from immediate physical damage, the expectation around future flood risks, an adjustment in insurance premiums, and the sustainability of investments and public services in these regions.
Our analysis shows that following a flooding event, properties within an impacted census tract sell at lower prices per square foot (Figure 2). The change in sale prices per square foot keeps decreasing as years pass. Three years after a flooding event occurred, properties get sold at −2.53% less (p = 0.0001), relative to identical properties located within non-flooding census tracts, whereas, 10 years after the flooding event occurred, the difference reaches −18.90% (p < 0.0001). In other words, a property that would have been sold for $1,000,000 without a flooding event will be sold instead for $811,000 12 years later. That is, we find a $189,000 flood price penalty.
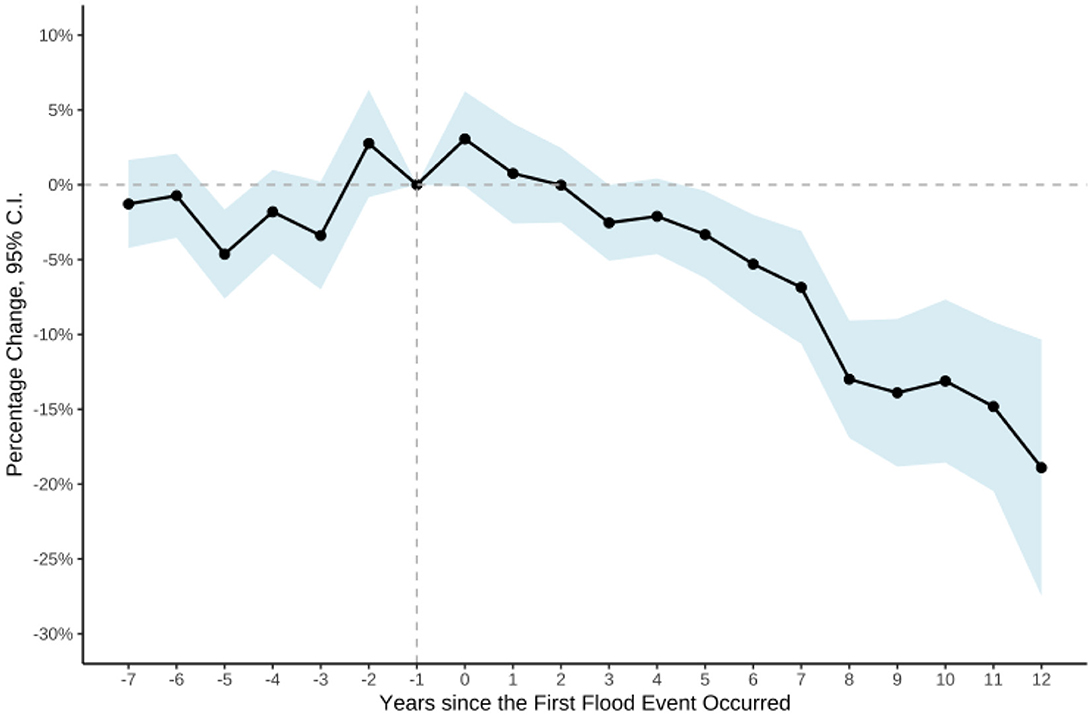
Figure 2. Flooding events and sale prices per square feet: percentage change relative to period, one year prior to exposure (−1). Estimates presented in this graph come from Equation 3, using the year when the flooding event occurred as the cohort g. Pre-trends p-value = 0.6.
The pre-flood migration patterns of an affected region can influence the trajectory of property sale prices after a flood event. In areas with positive pre-flood migration, newcomers typically signify a thriving economy, desirable amenities, or other attractive characteristics that pull individuals to relocate. When such areas experience a flood, the inherent demand for property, coupled with the region's underlying attractiveness, can act as a buffer against dramatic decreases in property values. Newcomers, driven by optimism or the initial reasons for migration, might be more willing to invest in post-flood reconstruction and view any price drops as temporary or buying opportunities. Conversely, in areas with negative pre-flood migration, underlying issues—economic decline, lack of amenities, or other negative factors—may already be depressing property values. A flood event in such regions can exacerbate this decline, as flood damages compound the existing challenges. The dwindling population may be less invested in rebuilding, leading to a steeper drop or permanently depressed post-disaster property sales. Based on these potential paths, we proceed to empirically evaluate them.
When separate models are run for transactions in areas that have seen positive population growth vs. negative population growth, distinct patterns emerge for residential properties. Following a flooding event, properties within an impacted census tract sell at lower prices per square foot for both declining and growing areas (as seen in Figures 3A, B). However, as years pass, the decline in property prices behaves differently. On the one side, as seen in Figure 3A, property transactions in tracts with positive population growth are ~0.7% lower about five years after a flood event and 17.8% lower than 8 years after a flood event. Still, they bounced back 11 years back to 8.7% lower. On the other side, transactions in tracts with negative population growth that period are ~4.8% lower 5 years following a flood event and are 15.0% lower 11 years following a flood event. Relative to census tracts with positive migration, flooded properties within census tracts with negative migration rates do not bounce back, and their sale prices keep declining as years pass.
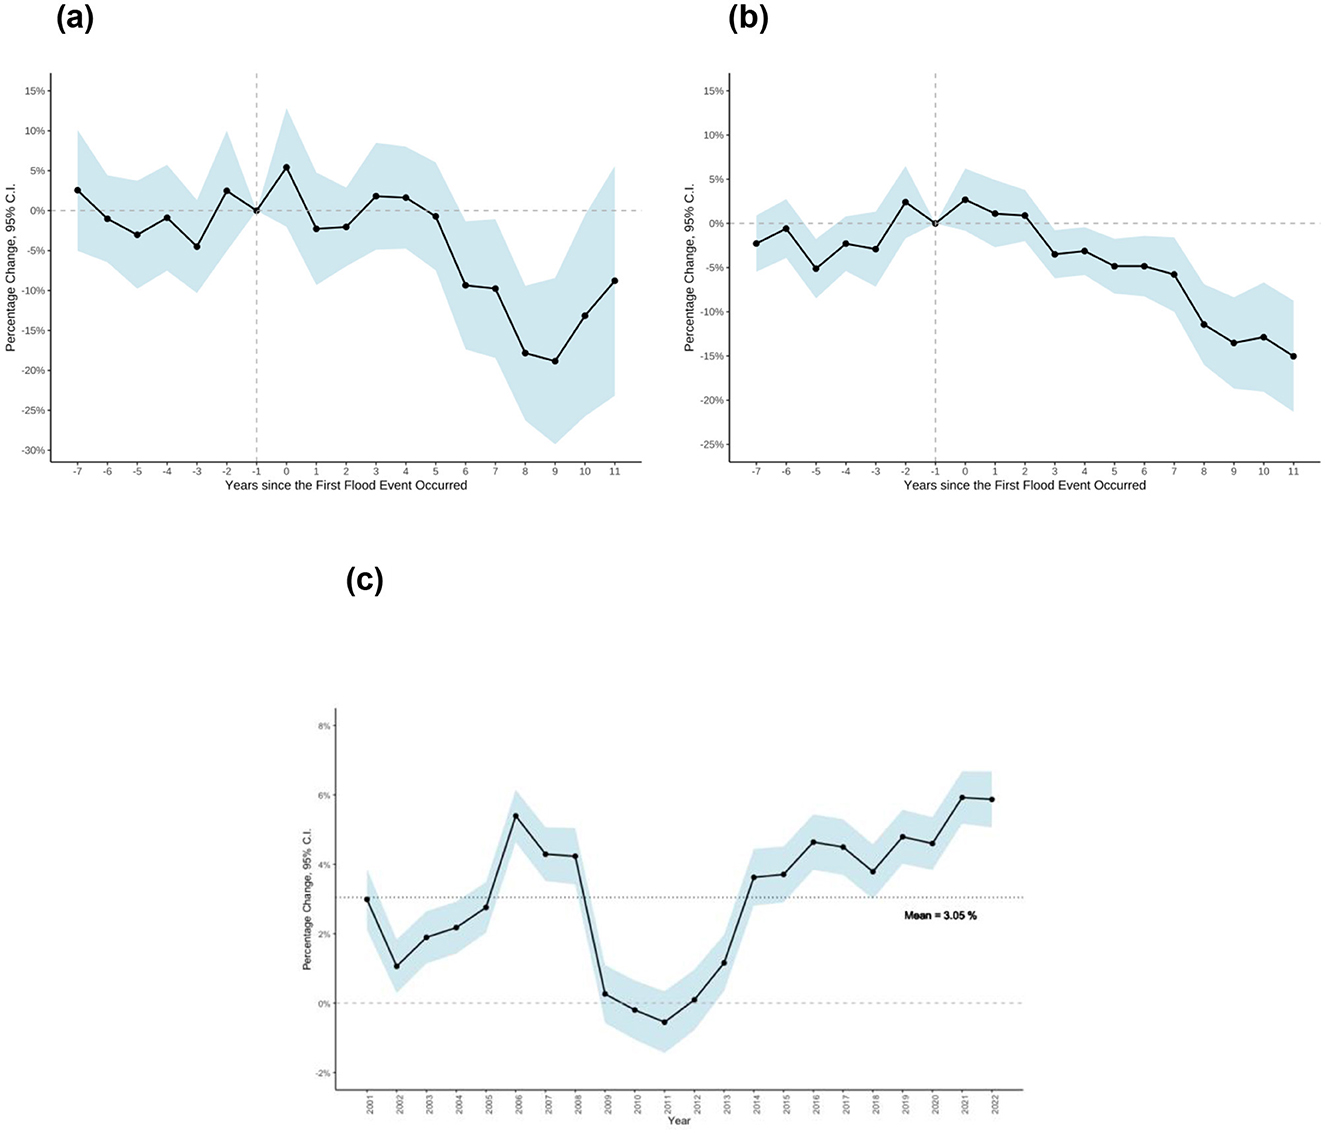
Figure 3. Flooding events and sale prices per square feet, by pre-flooding migration: percentage change relative to period, 1 year prior to exposure (−1). (a) Pre-Flooding, Positive Migration. Estimates presented in this graph come from Equation 3, using the year when the flooding event occurred as the cohort g and for those census tracts with positive migration pre-flood. Pre-trends p-value = 0.83. (b) Pre-flooding, negative migration. Estimates presented in this graph come from Equation 3, using the year when the flooding event occurred as the cohort g and for those census tracts with negative migration pre-flood. Pre-trends p-value = 0.41. (c) Difference in the Growth of Sale Prices (between non-flooded census tracts with positive migration and non-flooded ones with negative migration). Estimates presented in this graph come from the interaction between the year fixed-effects in Equation 3 and a binary variable denoting whether the census tract in which the property is located had positive migration rates between 2010 and 2000.
In our analysis, flood events represent a push force that impacts sale prices. However, this phenomenon is context-dependent, as it interacts with pre-flood migration rates. Areas with higher migration rates tend to experience a “pull” effect, which we further explore for places that were not affected by flooding. In Figure 3C, yearly estimates are presented by plotting the interaction between the year fixed-effects in Equation 3 and a binary variable denoting whether the census tract in which the property is located had positive migration rates between 2010 and 2000. Essentially, these estimates indicate whether there was an annual variation in sale prices between non-flooded census tracts with positive migration and non-flooded census tracts with negative migration, illustrating the “pull” effect. We find that, on average, there is an average yearly difference of +3.05% in sale prices between non-flooded census tracts with positive migration and non-flooded ones with negative migration during the 2001 and 2022 periods. Every year the difference was statistically significant at the 1% level except during the Financial Crisis period of 2009 and 2012, and it kept increasing since then, reaching +5.8% in 2022.
Property taxes and flood events
Flood events can also impact property taxes and, consequently, local revenues. When a region is hit by a flood, property values often experience a significant drop due to both the tangible damage to structures and the perceived risk of future flood events. This decrease in property values could lead to lower sale prices when these properties transact. As property tax assessments are typically based on properties' assessed value or sale price, municipalities may witness a substantial dip in their property tax collections post-flood. This revenue shortfall can pose challenges for local governments as they struggle to fund essential public services when the community's restoration and rebuilding demands peak.
Using the exploratory methodology described in subsection 2, we then explore the potential impact that flood events could have on property taxes. After estimating Equation 4 for each state, s, we find elasticities of tax revenue to sale price fluctuations (i.e., ) ranging from 0.016 (p-value = 0.01) in Alabama all the way to 3.00 (p-value = 0.001) in Delaware and a nationwide one of 0.71 (p-value = 0.001). For the nationwide one, this implies that a 1% reduction in sales prices would, on average, result in a 0.71% decrease in property tax revenue. By combining the elasticity estimate for each state, , with our estimate of the impact on housing prices from flooding events, , derived from Equation 3, we project potential long-run (i.e., 12-years) downfalls, DC, in annual property tax collection for a specific county.
Figure 4A shows how our projections of DC would change, in percentage terms, the yearly total taxes collected. The heterogeneity across localities is explained by the different state elasticities of tax revenue to sale price fluctuations and the differential dependence on revenue streams of each county—from property taxes to departmental revenues, excises, fines, interest, and licenses. Those counties relying heavily on property tax revenues face higher potential local tax shortfalls. The estimated impact on total tax revenue at the county level exhibits a range of variation, spanning from 2.7% to as high as 24.5% of the total annual taxes. The average impact is 12.1%, with a standard deviation of 6.0%.
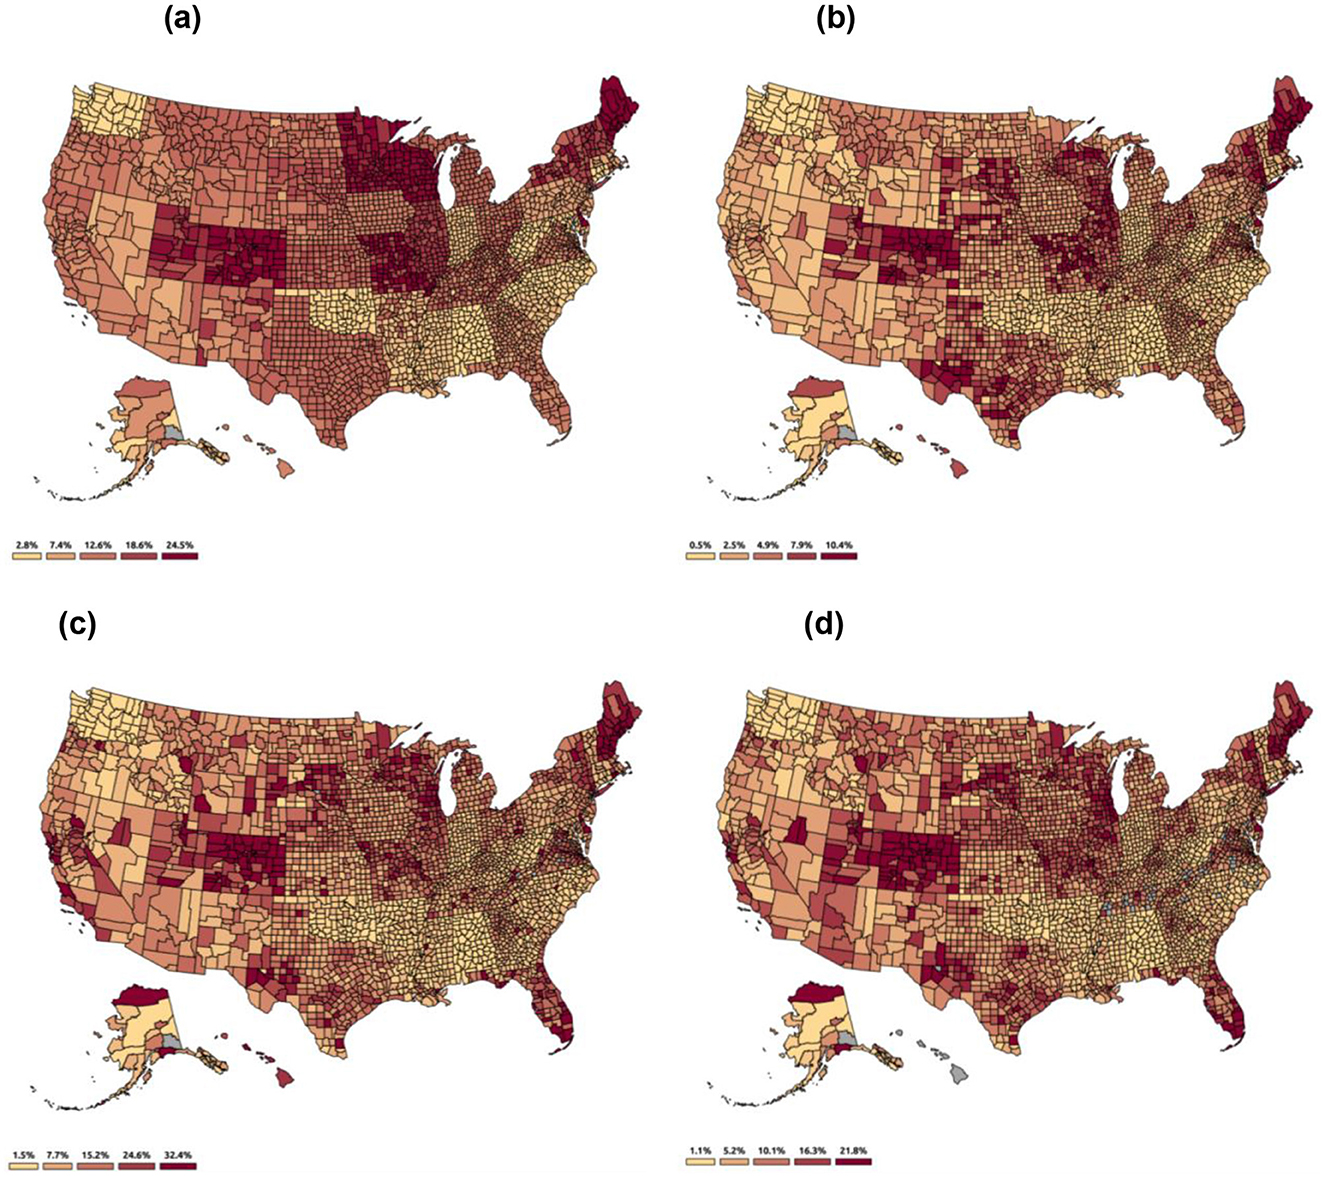
Figure 4. Expected decrease in property taxes after 12 years of a flood event. As a percentage of (a) total taxes collected, (b) total revenue collected, (c) expenditure on salaries and wages, (d) expenditure on education. Counties in gray have missing tax data.
On another level, localities can also exhibit heterogeneity in their revenue collected depending on how much they rely on property taxes relative to other sources of revenue. Those relying more on state or federal transfers might be cushioned against property tax losses from a flood event. Figure 4B shows how our projections of DC would change, in percentage terms, the yearly total revenue collected. The estimated impact on total revenue at the county level exhibits a range of variation, spanning from 0.5% to as high as 10.4% of the total annual taxes. The average impact is 3.9%, with a standard deviation of 2.7%.
Property tax collections are essential for funding local government services and public goods. Figures 4C, D contextualize the potential property tax losses due to flood events in relation to salaries paid to local officials and the total expenditure on education at the county level. The estimated impact on property taxes resulting from a flood event could be substantial, reaching up to 32.3% of the total expenditure on salaries and wages or 21.83% of the overall education expenditure at the county level.
Future projections
When the relationship estimates are paired with future projections of population counts and flood exposure, we may project how property values may change due to flood exposure and demand impacts from increased or decreased population in an area. For areas that do experience some risk of flooding in any of the given return periods, the current risk is conservatively assumed to be capitalized within the existing growth rates. As such, the increase in flood risk is of primary concern, and a threshold is established where a tract will consider the additional flood risk if the increase is equal to or greater than an additional 0.1% of properties inundated in a given return period. This is a conservative assumption, as it is likely that the current flood risk is not fully capitalized in existing markets through growth rates and migration, and it assumes rational actors and complete market information.
In areas with positive expected population growth, a higher estimate of property value appreciation rates is anticipated. Firstly, positive population growth often signifies increased demand for housing and real estate properties. This heightened demand tends to drive property values upward as individuals and families seek suitable homes and properties within the growing community. This demand-supply dynamics, influenced by a burgeoning population, often results in increased property values over time. Moreover, as the population expands, it may attract investments in infrastructure, amenities, and services, further enhancing the desirability of the area and, subsequently, property values. Conversely, areas with negative population change are expected to exhibit lower property value appreciation rates. A declining population may indicate several economic and demographic challenges, such as outmigration, aging populations, or economic downturns. In such areas, demand for properties may wane, leading to stagnation or even depreciation of property values. Fewer potential buyers or renters in the housing market can result in properties staying on the market longer and selling at lower prices, further affecting property value trends negatively.
For areas with either no flood risk or a small increase in flood risk over the next 30 years, the estimated impact of positive population growth on sale prices is ~3.05% higher than for areas with negative population growth. However, there is an additional interplay between population growth and flood risk. When assessing property value appreciation over time, results indicate that all areas are expected to have lower property value appreciation when there is an increase in flood risk over the 30-year period compared to the current risk. This is intuitive, as the prospect of more frequent or severe flood events can deter potential property buyers or investors.
However, this is generally most extreme for areas with both flood risk and negative population growth. In areas with flood risk and positive population growth, the impact of increased flood risk may be as extreme as to lead to a −2.47% annual appreciation (for the 20-year return period, see Table 2). In areas with both flood risk and negative population growth, the confluence of a declining population and heightened flood risk creates a particularly challenging environment for property values. Consequently, property value depreciation is most extreme in these areas, as they face the dual challenge of reduced demand due to population decline and increased uncertainty and potential damage associated with recurrent flooding events. These areas may see as much as an additional −4.31% impact on property value appreciation rates.
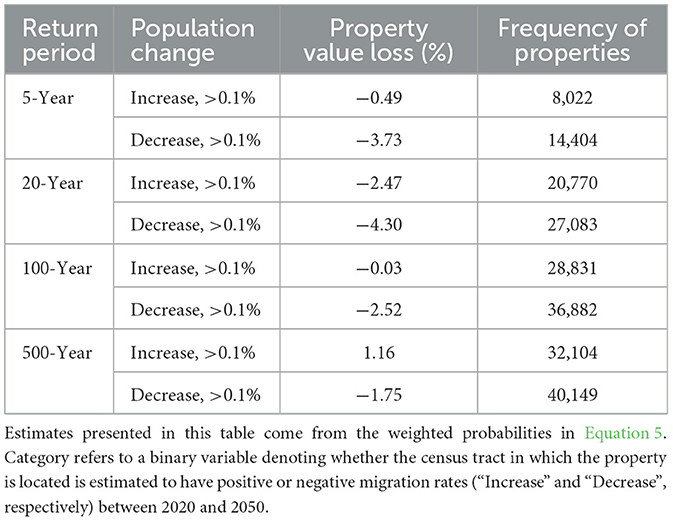
Table 2. Frequency of property value impacts for properties in tracts with increased flood exposure.
Turning our attention to future projections, our analysis takes into account the intricate relationship between population changes and flood exposure on property values. By combining relationship estimates with forecasts of population counts and flood exposure, we gain insights into how these factors collectively influence property values in the years to come.
In areas where flood risk is present, our analysis conservatively assumes that current flood risk is already factored into existing growth rates. The focus shifts to additional flood risk, where it's considered significant if the increase meets a predetermined threshold. This approach acknowledges that current flood risk may not be fully integrated into current markets, making assumptions about rational actors and complete market information. The results shed light on the complex dynamics between population growth, flood risk, and property values, offering valuable insights into future property value trends.
Discussion
One of the primary contributions of this study is the identification of a price penalty associated with properties affected by floods, captured as decreased sale price by square footage. This suggests that prospective buyers are willing to pay less for properties in flood-prone areas, reflecting the perceived risks and inconveniences associated with such properties. Furthermore, this research finds a temporal aspect to this price penalty. The reduction in sale prices per square footage tends to intensify over time following a flood event. This finding implies that the negative impact of flooding on property values is not short-lived but can persist and even worsen as time passes. This is a significant extension on the current literature in this space as most of the research around the impact of flooding on property value is focused on community level property value change, total value change (vs. price per square foot), and modeled in a traditional hedonic pricing model. In comparison, this analysis used a repeated sales approach at the property level using the price per square foot as the primary metric. The research design allowed for a more causal understanding of the impact of flooding on property values, and ultimately a more definitive set of results linking the two.
The estimated long-run price effects are substantial: properties in flood-affected tracts sell for nearly 19% less 12 years after exposure, relative to similar properties in non-affected areas. This magnitude is larger than the short-term discounts (typically 5–10%) found in prior studies such as (Bin et al. 2008) and (Ortega and Taṣpınar 2018), suggesting that the market response to flood exposure can deepen over time. Our contribution lies in identifying these persistent, rather than immediate, devaluation patterns at the national scale. The findings imply that the economic consequences of flooding may compound across years, especially in markets facing concurrent demographic or fiscal decline.
The research further contributes to a growing literature focusing on the impact of flood risk, flood exposure, and property value responses. (Zhang 2016) found that properties in flood zones sold at a discount relative to properties outside of the flood zone, but following a flood, property value spiked, with a quick correction back downwards. Similarly, Shu et al. (2022) found a similar price discount for properties following a zoning into a flood zone, following the implementation of new FEMA flood zones in Miami-Dade County. Both of those studies highlight the price discount associated with risk, but the Zhang paper is interesting in that it shows a positive response following a flood, whereas our current analysis shows an immediate discount on property values. The difference in the two sets of results can be distilled down to the research design, which answer two qualitatively different questions. The (Zhang 2016) piece highlights the response of property values following a flood relative to their level prior to that event.
The results of the current analysis take a control-treatment approach to understanding the changes in property values, relative to properties that were not impacted by the flood event (vs. their own levels in previous years). There are a number of reasons why property values may spike following an event, with most revolving around the investment in recovery that comes from disaster declaration and insurance coverage, however, those spikes are not directly examined in the current work, but instead the relative growth of property values are investigated. The results indicate that while an area may see a spike in investment post-event, there is still an overall lack of property value appreciation relative to places that were not exposed to a flood event within the same timeframe. Ultimately, the prices in both areas could be growing, but the results indicate that they would grow more slowly in areas exposed to flood events.
This manuscript goes beyond this general trend and introduces an additional layer of complexity by considering the role of population growth rates in the decade when property transactions occurred. By segmenting the data into two distinct models based on population growth rates, this research provides a more nuanced understanding of how flood events impact property values. In areas experiencing significant population growth during the decade of the transaction, the price penalty associated with flooding may be mitigated or potentially offset by other factors, such as increased demand for housing due to population influx. In contrast, in areas with declining populations, the price penalty may be more pronounced as there may be fewer buyers willing to overlook the flood risk. Overall, this research underscores the intricate interplay between flood events, property values, and demographic changes.
Overall, not only does this study find a price penalty for properties with flood exposure, but results indicate that this price penalty differs depending on whether the property is in an area with an increasing vs. decreasing population. Not only do property prices differ following a flood event, but they also differ prior to a flood event. In short, this essentially hints at the fact that both flood exposure and the larger market conditions are important in determining the ultimate impact on property values. Future research should further investigate the close relationship between area desirability, as proxied in this study by population change, and economic market impacts, including property value impacts.
Finally, the influence of flood events on property taxes is a significant aspect of our investigation. Flooding can lead to declining property values due to structural damage and heightened flood risk perception, ultimately impacting property tax assessments that are often based on property values or sale prices. Consequently, local governments may grapple with a considerable reduction in property tax revenue, creating challenges for funding essential public services during the post-flood recovery phase. Our analysis delved into the potential ramifications of flood events on property taxes. We find that the effects vary across states, highlighting the intricate relationship between tax revenue and fluctuations in property sale prices. The implications of this phenomenon extend to local government finances, and these findings underscore the importance of proactive strategies to address the fiscal challenges posed by flood events on the funding of crucial public services.
The findings from this study have practical relevance for policymakers, planners, and local officials involved in climate adaptation, land use, and fiscal management. By identifying a measurable and lasting decline in property values following flood exposure—particularly in areas with stagnant or declining populations—the research underscores the need for place-based approaches to flood resilience planning. These results suggest that in communities already facing demographic and economic headwinds, flood events may exacerbate existing vulnerabilities, further constraining their tax base and financial capacity to invest in recovery or long-term adaptation. Integrating this understanding into local planning efforts can help target resources more effectively, prioritize high-risk zones for mitigation, and support equitable development strategies that account for both environmental and socioeconomic risk factors.
Moreover, the study's projections of future property value trends under scenarios of increasing flood risk and shifting population patterns can be useful for long-term infrastructure and investment planning. Local governments and regional authorities might use these insights to evaluate the return on investment for flood protection measures, reassess zoning and development incentives, or anticipate potential fiscal shortfalls due to declining property tax revenues. At the state or federal level, the results could inform the design of support programs or funding formulas to ensure that communities with the greatest exposure and least fiscal resilience are not left behind in broader climate adaptation efforts.
Conclusions
This study provides new empirical evidence on the relationship between flood exposure and residential property values across the United States, using a repeated-sales approach and a large, property-level dataset spanning over two decades. The analysis reveals that properties located in census tracts affected by flooding tend to experience persistent and statistically significant declines in sale price per square foot, with effects that deepen over time. These negative impacts are further conditioned by underlying demographic trends; areas experiencing population decline are more vulnerable to lasting property value depreciation following flood events, while growing areas may experience relatively more resilient market responses.
In addition to housing market implications, the study connects property value changes to local fiscal health by estimating the elasticity of property tax revenues with respect to sale prices. The results suggest that flood-related declines in property values can reduce local tax collections, with the potential to impact public services and adaptation capacity—especially in counties highly dependent on property tax revenue. By combining historical data with future projections of flood risk and population change, the research offers a framework for anticipating where future devaluation pressures may emerge, supporting long-term planning and resource allocation.
While the findings offer important insights, several limitations should be acknowledged. First, the analysis relies on tract-level flood exposure data that may not capture variation in flood intensity or property-level damage. Second, property tax impacts are estimated using aggregate county-level data, which limits spatial precision and may mask within-county disparities. Additionally, while the study uses population change as a proxy for broader market conditions, other factors such as economic restructuring, insurance availability, or infrastructure investments may also play a role in shaping property values and warrant further exploration.
Future research can build on these findings by incorporating higher-resolution flood intensity and damage assessments, improving spatial granularity in fiscal data, and evaluating the role of adaptation investments in mitigating property value loss. Moreover, further work is needed to explore equity considerations in these dynamics, particularly regarding how lower-income or historically marginalized communities may face disproportionate exposure to both flood risk and its economic consequences. As climate-related hazards intensify, a more complete understanding of these complex interactions will be essential to support evidence-based policy and planning at all levels of government.
Data availability statement
The data analyzed in this study is subject to the following licenses/restrictions: Data are proprietary and portions may be shared upon request. Requests to access these datasets should be directed to amVyZW15QGdjLmN1bnkuZWR1.
Author contributions
SS: Data curation, Methodology, Conceptualization, Validation, Writing – review & editing, Investigation, Formal analysis, Visualization, Writing – original draft. ES: Validation, Conceptualization, Writing – review & editing, Investigation, Data curation, Methodology, Writing – original draft, Visualization, Formal analysis. JP: Investigation, Writing – original draft, Supervision, Conceptualization, Methodology, Writing – review & editing.
Funding
The author(s) declare that no financial support was received for the research and/or publication of this article.
Conflict of interest
The authors declare that the research was conducted in the absence of any commercial or financial relationships that could be construed as a potential conflict of interest.
Generative AI statement
The author(s) declare that no Gen AI was used in the creation of this manuscript.
Publisher's note
All claims expressed in this article are solely those of the authors and do not necessarily represent those of their affiliated organizations, or those of the publisher, the editors and the reviewers. Any product that may be evaluated in this article, or claim that may be made by its manufacturer, is not guaranteed or endorsed by the publisher.
References
Armal, S., Porter, J. R., Lingle, B., Chu, Z., Marston, M. L., Wing, O. E., et al. (2020). Assessing property level economic impacts of climate in the US, new insights and evidence from a comprehensive flood risk assessment tool. Climate 8:116. doi: 10.3390/cli8100116
Atreya, A., Ferreira, S., and Kriesel, W. (2013). Forgetting the flood? An analysis of the flood risk discount over time. Land Econ. 89, 577–596. doi: 10.3368/le.89.4.577
Bagstad, K. J., Stapleton, K., and D'Agostino, J. R. (2007). Taxes, subsidies, and insurance as drivers of United States coastal development. Ecol. Econ. 63, 285–298. doi: 10.1016/j.ecolecon.2006.09.019
Bakkensen, L. A., and Barrage, L. (2017). Flood Risk Belief Heterogeneity and Coastal Home Price Dynamics: Going Under Water? (No. w23854). Cambridge, MA: National Bureau of Economic Research. doi: 10.3386/w23854
Bin, O., Kruse, J. B., and Landry, C. E. (2008). Flood hazards, insurance rates, and amenities: evidence from the coastal housing market. J. Risk Insur. 75, 63–82. doi: 10.1111/j.1539-6975.2007.00248.x
Bin, O., and Landry, C. E. (2013). Changes in implicit flood risk premiums: empirical evidence from the housing market. J. Environ. Econ. Manage. 65, 361–376. doi: 10.1016/j.jeem.2012.12.002
Bin, O., and Polasky, S. (2004). Effects of flood hazards on property values: evidence before and after Hurricane Floyd. Land Econ. 80, 490–500. doi: 10.2307/3655805
Black, R., Bennett, S. R., Thomas, S. M., and Beddington, J. R. (2011). Migration as adaptation. Nature 478, 447–449. doi: 10.1038/478477a
Callaghan, M., Schleussner, C. F., Nath, S., Lejeune, Q., Knutson, T. R., Reichstein, M., et al. (2021). Machine-learning-based evidence and attribution mapping of 100,000 climate impact studies. Nat. Clim. Change 11, 966–972. doi: 10.1038/s41558-021-01168-6
Callaway, B., and Sant'Anna, P. H. C. (2021). Difference-in-differences with multiple time periods. J. Econom. 225, 200–230. doi: 10.1016/j.jeconom.2020.12.001
Clement, V., Rigaud, K. K., de Sherbinin, A., Jones, B., Adamo, S., Schewe, J., et al. (2021). Groundswell Part 2: Acting on internal climate migration. Washington, DC: World Bank.
Contat, J., Suandi, M., and Mejia, L. (2024). When climate meets real estate : a survey of the literature. Real Estate Econ. 52, 618–659. doi: 10.1111/1540-6229.12489
de Chaisemartin, C., and D'Haultfoeuille, X. (2020). Two-way fixed effects estimators with heterogeneous treatment effects. American Economic Review 110, 2964–2996. doi: 10.1257/aer.20181169
First Street Foundation (2020). First Street Foundation Technical Documentation. Available online at: https://assets.firststreet.org/uploads/2020/06/FSF_Flood_Model_Technical_Documentation.pdf (Accessed June 28, 2023).
Fu, X., Song, J., Sun, B., and Peng, Z. R. (2016). “Living on the edge”: Estimating the economic cost of sea level rise on coastal real estate in the Tampa Bay region, Florida. Ocean Coast. Manag. 133, 11–17. doi: 10.1016/j.ocecoaman.2016.09.009
Gourevitch, J. D., Diehl, R. M., Wemple, B. C., and Ricketts, T. H. (2022). Inequities in the distribution of flood risk under floodplain restoration and climate change scenarios. People Nat. 4, 415–427. doi: 10.1002/pan3.10290
Hauer, M. E. (2017). Migration induced by sea-level rise could reshape the US population landscape. Nat. Clim. Change 7, 321–325. doi: 10.1038/nclimate3271
Heipertz, M., and Nickel, C. (2008). Climate change brings stormy days: case studies on the impact of extreme weather events on public finances. Available online at: https://ssrn.com/abstract=1997256 (Accessed July 23, 2025).
Hinkel, J., Lincke, D., Vafeidis, A. T., Perrette, M., Nicholls, R. J., Tol, R. S., et al. (2014). Coastal flood damage and adaptation costs under 21st century sea-level rise. Proc. Natl. Acad. Sci. 111, 3292–3297. doi: 10.1073/pnas.1222469111
Hugo, G. (2011). Future demographic change and its interactions with migration and climate change. Global Environ. Change 21, S21–S33. doi: 10.1016/j.gloenvcha.2011.09.008
Ide, T., Fröhlich, C., and Donges, J. F. (2020). The economic, political, and social implications of environmental crises. Bull. Am. Meteorol. Soc. 101, E364–E367. doi: 10.1175/BAMS-D-19-0257.1
International Code Council, Inc. (2021). “R304.2,” in 2021 IRC: International Residential Code for One- and Two-Family Dwellings. Washington, DC: International Code Council.
Keenan, J. M., Hill, T., and Gumber, A. (2018). Climate gentrification: from theory to empiricism in Miami-Dade County, Florida. Environ. Res. Lett. 13:054001. doi: 10.1088/1748-9326/aabb32
Keys, B. J., and Mulder, P. (2020). Neglected no More: Housing Markets, Mortgage Lending, and Sea Level Rise (No. w27930). Cambridge, MA: National Bureau of Economic Research.
Kousky, C. (2010). Learning from extreme events: risk perceptions after the flood. Land Econ. 86, 395–422. doi: 10.3368/le.86.3.395
Lai, K., Porter, J. R., Amodeo, M., Miller, D., Marston, M., Armal, S., et al. (2022). A natural language processing approach to understanding context in the extraction and geocoding of historical floods, storms, and adaptation measures. Inform. Process. Manag. 59:102735. doi: 10.1016/j.ipm.2021.102735
Lamond, J., Proverbs, D., and Hammond, F. (2009). Accessibility of flood risk insurance in the UK: confusion, competition and complacency. J. Risk Res. 12, 825–841. doi: 10.1080/13669870902768614
Lis, E. M., and Nickel, C. (2010). The impact of extreme weather events on budget balances. Int. Tax and Public Fin. 17, 378–399. doi: 10.1007/s10797-010-9144-x
McAlpine, S. A., and Porter, J. R. (2018). Estimating recent local impacts of sea-level rise on current real-estate losses: a housing market case study in Miami-Dade, Florida. Popul. Res. Policy Rev. 37, 871–895. doi: 10.1007/s11113-018-9473-5
Mueller, V., Gray, C., and Kosec, K. (2014). Heat stress increases long-term human migration in rural Pakistan. Nat. Clim. Change 4, 182–185. doi: 10.1038/nclimate2103
Nicholls, R. J., and Cazenave, A. (2010). Sea-level rise and its impact on coastal zones. Science 328, 1517–1520. doi: 10.1126/science.1185782
NOAA National Centers for Environmental Information (NCEI) (2022). U.S. Billion-Dollar Weather and Climate Disasters. Available online at: https://www.ncei.noaa.gov/access/billions/ (Accessed July 23, 2025).
Ortega, F., and Taṣpınar, S. (2018). Rising sea levels and sinking property values: Hurricane Sandy and New York's housing market. J. Urban Econ. 106, 81–100. doi: 10.1016/j.jue.2018.06.005
Pope, J. C. (2008). Do seller disclosures affect property values? Buyer information and the hedonic model. Land Econ. 84, 551–572. doi: 10.3368/le.84.4.551
Porter, J. R., Shu, E. G., Amodeo, M. F., Freeman, N., Bauer, M., Almufti, I., et al. (2022). Commercial real-estate at risk: an examination of commercial building and economic impacts in the United States using a high-precision flood risk assessment tool. Front. Water 4:875995. doi: 10.3389/frwa.2022.875995
Robinson, C., Dilkina, B., and Moreno-Cruz, J. (2020). Modeling migration patterns in the USA under sea level rise. PLoS ONE 15:e0227436. doi: 10.1371/journal.pone.0227436
Shu, E. G., Porter, J. R., Hauer, M. E., Sandoval Olascoaga, S., Gourevitch, J., Wilson, B., et al. (2023). Integrating climate change induced flood risk into future population projections. Nat. Commun. 14:7870 doi: 10.1038/s41467-023-43493-8
Shu, E. G., Porter, J. R., Wilson, B., Bauer, M., and Pope, M. L. (2022). The economic impact of flood zone designations on residential property valuation in Miami-Dade county. J. Risk Fin. Manag. 15:434. doi: 10.3390/jrfm15100434
Strauss, B. H., Kulp, S., and Levermann, A. (2015). Carbon choices determine US cities committed to futures below sea level. Proc. Natl. Acad. Sci. 112, 13508–13513. doi: 10.1073/pnas.1511186112
Sun, L., and Abraham, S. (2021). Estimating dynamic treatment effects in event studies with heterogeneous treatment effects. J. Econometr. 225, 175–199. doi: 10.1016/j.jeconom.2020.09.006
Tedesco, M., McAlpine, S., and Porter, J. R. (2020). Exposure of real estate properties to the 2018 Hurricane Florence flooding. Nat. Haz. Earth Syst. Sci. 20, 907–920. doi: 10.5194/nhess-20-907-2020
United States Census Bureau (2023). Annual Survey of State and Local Government Finances. Available online at: https://www.census.gov/data/datasets/2021/econ/local/public-use-datasets.html (Accessed August 2023).
Van Holm, E. J., and Wyczalkowski, C. K. (2019). Gentrification in the wake of a hurricane: New Orleans after Katrina. Urban Stud. 56, 2763–2778. doi: 10.1177/0042098018800445
Vigdor, J. (2008). The economic aftermath of Hurricane Katrina. J. Econ. Perspect. 22, 135–154. doi: 10.1257/jep.22.4.135
Keywords: climate change, flood risk, climate migration, property value, event analysis
Citation: Sandoval Olascoga S, Shu E and Porter J (2025) Flood risk and property value changes: understanding the impact of climate event exposure in the context of population change. Front. Environ. Econ. 4:1615802. doi: 10.3389/frevc.2025.1615802
Received: 21 April 2025; Accepted: 18 July 2025;
Published: 07 August 2025.
Edited by:
Angeliki N. Menegaki, Hellenic Mediterranean University Research Centre, GreeceReviewed by:
S. Sariffuddin, Diponegoro University, IndonesiaGeorge Ekonomou, Hellenic Open University, Greece
Copyright © 2025 Sandoval Olascoga, Shu and Porter. This is an open-access article distributed under the terms of the Creative Commons Attribution License (CC BY). The use, distribution or reproduction in other forums is permitted, provided the original author(s) and the copyright owner(s) are credited and that the original publication in this journal is cited, in accordance with accepted academic practice. No use, distribution or reproduction is permitted which does not comply with these terms.
*Correspondence: Jeremy Porter, anBvcnRlckBnYy5jdW55LmVkdQ==