Abstract
Introduction:
This study investigates earthquake preparedness among homeowners in eight states affected by the New Madrid Seismic Zone, using the 2024 NAIC earthquake survey data.
Methods:
Applying weighted Ordinary Least Squares (OLS) and quantile regression analyses, the research explores how risk perception, community engagement, and earthquake awareness influence preparedness across varying readiness levels.
Results:
Results highlight community engagement as the strongest predictor across all preparedness quantiles, emphasizing its role particularly at higher preparedness levels. Significant interaction effects were observed between earthquake awareness and home value, with heightened preparedness evident among informed, higher-value property owners. Conversely, the interaction between income and tenure indicates diminishing preparedness among higher-income, long-term residents, suggesting complacency effects.
Discussion:
These findings underscore the need for differentiated preparedness strategies that accommodate varying socioeconomic conditions and preparedness levels. This nuanced approach offers policymakers critical insights for enhancing resilience by tailoring interventions to specific homeowner segments, thereby addressing overlooked non-linear and interactive effects often masked by traditional average-based methods.
1 Introduction
Earthquake preparation planning is fundamental to disaster risk reduction, seeking to alleviate seismic effects on populations and infrastructure by risk assessment, information distribution, and resilient construction methodologies (Rezabeigi Davarani et al., 2023; Miyamoto et al., 2023). Notwithstanding established standards for emergency supplies, insurance procurement, and evacuation strategies (FEMA, 2024b), major gaps remain in converting knowledge into practical preparedness–especially among homeowners, who face disproportionate financial liabilities. Seventy-two percent of U.S. households recognize the risks of earthquakes; nevertheless, hardly 14% have undertaken structural retrofits, and insurance acquisition in high-risk areas such as the New Madrid Seismic Zone (NMSZ) has decreased by 18% since 2010 (Rabinovici et al., 2020). This discrepancy highlights a significant research deficiency: the absence of cohesive frameworks that investigate the interplay of attitudinal, behavioral, and socioeconomic components across different readiness levels in influencing mitigation activities.
Despite extensive research on earthquake preparedness, a significant gap remains in understanding the attitudinal and behavioral aspects of homeowners' earthquake preparedness strategy in the United States. Despite homeowners have a greater financial stake in their houses compared to renters, their preparedness frequently does not align with this increased risk. Recent statistics from the New Madrid Seismic Zone (NMSZ) indicate that merely 24% of residential properties in Missouri possess earthquake insurance, reflecting a decline of nearly 20% since 2000 (Houston et al., 2022). In California, the adoption of earthquake insurance has consistently remained below 16% since 2002 (Pothon et al., 2019). These findings underscore a significant disparity between risk exposure and risk mitigation practices among homeowners. Recent research has found multiple variables contributing to this mismatch but has not adequately synthesized them into a complete framework that elucidates the diversity in homeowner preparedness across diverse socioeconomic strata and degrees of preparedness. The escalating expense of earthquake insurance is recognized as a significant disincentive (Houston et al., 2022); nonetheless, the interplay between this element, homeowners' risk perception, and property prices is insufficiently examined. Furthermore, research indicates that social cognitive factors considerably affect preparedness behaviors (Topal et al., 2024; Faryabi et al., 2023); however, there has been insufficient investigation into how these factors differ among various homeowner segments based on their preparedness levels, property values, and length of tenure.
Becker et al. (2017) shown that homeowners often misestimate their vulnerability to earthquakes, leading to inadequate preparedness; nevertheless, limited research has systematically examined how this risk perception differs among homeowners across various readiness quantiles. Lindell and Perry (2012) noted that the complexity of earthquake insurance policies and their perceived high cost deter many households from obtaining coverage, despite the increased risk of significant losses. Nonetheless, a gap persists in comprehending the interaction between financial considerations and awareness elements, as well as their collective impact on preparedness activities. The California Earthquake Authority's research indicates that numerous homeowners possess insufficient understanding regarding retrofit approaches and insurance alternatives, despite a broad awareness of earthquake hazards (California Earthquake Authority, 2017). This signifies a deficiency in information that transcends mere awareness and encompasses actionable comprehension. The study by Solberg et al. (2010) highlighted the influence of social norms on preparedness practices, suggesting that homeowners are more likely to prepare if they perceive their neighbors are also doing similar actions. The issue of community engagement and communication is seen essential (Houston et al., 2022), as homeowners who converse about earthquakes with relatives and friends are 1.63 times more likely to possess earthquake insurance. The varying effects of community engagement on different levels of readiness have yet to be investigated. Furthermore, Paton et al. (2014) identified a gap between homeowners' awareness of seismic dangers and their associated preparedness actions, highlighting the need for improved risk communication strategies customized to distinct homeowner demographics. Ultimately, Arlikatti et al. (2018) observed that homeowners' preparedness behaviors are influenced by their trust in governmental institutions and perceived self-efficacy, elements that necessitate further investigation concerning earthquake preparedness, especially regarding their interaction with socioeconomic variables such as income and property value.
Building on these identified research gaps, this study addresses the critical issue of understanding the complex interplay among attitudinal factors (seismic awareness and risk perception), behavioral aspects (community participation and communication), and socioeconomic variables (income and house value) in influencing earthquake preparedness among homeowners. Prior research has acknowledged the importance of these elements in isolation but has not comprehensively examined their relationships or the variability of their impacts across different degrees of homeowner readiness. This research examines these factors over several quantiles (25%, 50%, 75%) and employs classic mean-based Ordinary Least Squares (OLS) analysis, uncovering potential non-linear correlations and diverse effects that average-centric methods may neglect. This study investigates interaction effects, namely between income and home tenure, as well as between earthquake awareness and home value, revealing how these variables may enhance or diminish each other's impact on preparedness.
The research problem centers on three unresolved questions: whether community engagement's influence on preparedness intensifies at higher quantiles, as posited by Solberg et al. (2010); whether income's protective effect diminishes with prolonged home tenure due to risk normalization (complacency), as hinted by Rabinovici et al. (2020); and whether earthquake awareness disproportionately benefits high-property-value homeowners, who possess resources to act on knowledge—a mechanism overlooked in Ao et al. (2022). By employing quantile regression and interaction analysis, this research transcends the limitations of mean-based approaches, probing the conditional effects of variables that conventional models fail to capture. Understanding these complex dynamics is essential for formulating precise and successful preparedness plans that cater to the varied situations and motives of homes.
This study's dual-method approach (OLS and quantile regression) provides innovative insights by pinpointing thresholds at which variables such as income or awareness shift from being inconsequential to becoming critical determinants. For example, the benefits of preparedness derived from community engagement may only become evident beyond the 50th quantile, indicating non-linear dynamics that guide focused initiatives. Furthermore, delineating how socioeconomic variables enhance or diminish attitudinal factors—such as elevated property values making awareness actionable, while low incomes negate its effect—yields a typology of interaction mechanisms. These insights allow policymakers to create differentiated solutions that cater to the distinct requirements of underprepared (25th quantile) and proactive (75th quantile) homeowners. The approach enhances understanding of preparedness behaviors by bridging theoretical and methodological gaps, enabling stakeholders to tackle the varying realities influencing earthquake resilience.
The paper presents multiple hypotheses to investigate the intricate links between diverse characteristics and earthquake preparedness plans among homeowners in eight high-risk states in the United States. It is posited that risk perception, community participation and communication, and earthquake awareness are positively connected with earthquake preparedness planning, exhibiting variable magnitudes across different quantiles (25%, 50%, 75%) and the mean of preparedness levels. Secondly, the interaction term between earthquake awareness and house value is anticipated to positively correlate with earthquake preparedness planning, indicating that the influence of awareness on readiness intensifies as home value rises. The interaction term between income and home tenure is posited to negatively correlate with earthquake preparedness planning, suggesting that the influence of income on readiness diminishes with extended home tenure. The hypotheses will be evaluated while accounting for demographic variables and alternative interpretations. The differential effects across quantiles are anticipated to uncover intricate relationships that may remain obscured when solely examining average effects, thereby offering critical insights for customizing earthquake preparedness strategies for diverse segments of homeowners according to their socioeconomic status, property attributes, and existing preparedness levels.
2 Background
Over the past century, earthquake preparedness planning has markedly progressed due to seismology, engineering, and disaster management advancements. The evolution of earthquake preparedness at the institutional level began in the early 20th century, marked by the founding of seismological observatories and the enactment of building codes in seismically vulnerable areas (Greer, 2012). The 1933 Long Beach earthquake in California prompted the implementation of more rigorous seismic design regulations, signifying a pivotal shift in institutional strategies for earthquake protection (Martin, 2024). The establishment of the National Earthquake Hazards Reduction Program (NEHRP) in 1977 solidified the U.S. government's dedication to mitigating earthquake risks (Ao et al., 2022). The United Nations International Strategy for Disaster Reduction (UNISDR) has been instrumental in advancing worldwide earthquake preparedness since its establishment in 1999 (Aitsi-Selmi et al., 2015). During the second part of the 20th century, earthquake preparedness became significant at the individual level, characterized by enhanced public education initiatives and the advocacy of household emergency kits. The “Drop, Cover, and Hold On” protocol as a personal safety measure during earthquakes gained widespread acceptance in the 1980s (Earthquake Country Alliance, 2024; Paton et al., 2014; Shmueli et al., 2021). The emergence of social media and mobile technology in the 21st century has transformed individual preparedness by facilitating real-time earthquake notifications and crowdsourced damage evaluations (Rostami-Moez et al., 2020). The significance of earthquake preparedness at both institutional and individual levels is paramount since it directly influences community resilience and the capacity to save lives and mitigate economic losses (Joffe et al., 2016; Smith, 2006; Scawthorn et al., 2006b). Recent research has highlighted the necessity for culturally sensitive and community-oriented strategies in earthquake preparedness, acknowledging distinct people's varied needs and capabilities (Rezabeigi Davarani et al., 2023). Moreover, incorporating earthquake preparedness into comprehensive catastrophe risk reduction programs has gained significance due to climate change and other global concerns (Grozdanić et al., 2024).
Research on earthquake preparedness in the United States has advanced considerably in recent decades, emphasizing multiple facets of individual and community readiness. Research has regularly demonstrated that numerous Americans remain inadequately prepared for seismic occurrences despite residing in earthquake-prone regions (Occupational Safety and Health Administration (OSHA), 2024; Rostami-Moez et al., 2020; Scawthorn et al., 2006a). The New Madrid Seismic Zone (NMSZ) offers a distinctive intraplate seismic environment marked by infrequent yet significant events, bringing complex characteristics frequently neglected in coastal-centric research. Although Paton et al. (2014) recognized institutional trust as a determinant of preparedness in Pacific Northwest communities, this association is influenced in the NMSZ by regional skepticism toward federal agencies–a sentiment exacerbated by decentralized emergency management systems and historical underfunding of rural infrastructure (FEMA, 2024b). The significance of risk perception, a fundamental aspect of preparation research, is further confounded by the geological background of the NMSZ. In contrast to California's regular seismic activity, which maintains public consciousness, the New Madrid Seismic Zone's 200-year recurrence interval has led to a phenomenon known as “seismic amnesia,” causing residents to regard earthquakes as a “West Coast issue,” despite the sophisticated monitoring conducted by the USGS Advanced National Seismic System (Shome, 2024). This complacency endures despite FEMA's catastrophic earthquake preparation documents emphasizing the latent risk of the NMSZ, revealing a continual disjunction between scientific evaluations and public awareness (FEMA, 2024b). Socioeconomic inequalities intensify deficiencies in readiness. Poverty rates in rural areas of the NMSZ, especially in Arkansas and Missouri, restrict access to federal retrofit subsidies, resulting in only 23% of low-income homeowners engaging in mitigation initiatives (Ao et al., 2022). The issues are exacerbated by an aged housing stock, with 37% of residences in the region constructed prior to 1980, necessitating expensive retrofits that burden household finances (Rezabeigi Davarani et al., 2023). Simultaneously, competing objectives like climate adaptation financing have shifted focus away from seismic hazards, as government allocations for flood resilience have risen by 32% since 2020 (Grozdanić et al., 2024). This fiscal reallocation highlights the necessity for cohesive policies that tackle simultaneous environmental challenges while ensuring earthquake preparation is not overlooked. Technological innovations such as ShakeAlert® early warning systems, although revolutionary in coastal regions, encounter implementation challenges in the New Madrid Seismic Zone due to disparities in digital access between rural and urban areas. Approximately 34% of rural homes are devoid of broadband connection, constraining the dissemination of real-time alerts and mobile preparedness resources (Rostami-Moez et al., 2020). In equipped regions, merely 58% of schools have executed ShakeAlert® drills, in contrast to 89% adoption in California, highlighting systematic disparities in resource allocation (Shome, 2024). These disparities underscore the imperative to customize national frameworks to the socio-geographical realities of the NMSZ, ensuring that progress in seismology and risk communication results in equitable preparedness outcomes.
The New Madrid Seismic Zone (NMSZ) (Figure 1) is a prominent seismic area covering roughly 150 miles in the central United States, stretching from northeastern Arkansas through southeastern Missouri, western Tennessee, and western Kentucky to southern Illinois. This region features a network of ancient, deep-seated faults concealed beneath substantial sedimentary layers, traversing five state boundaries and intersecting the Mississippi River at three locations and the Ohio River at two (Encyclopaedia Britannica, 2024; Csontos et al., 2008; IEMA, 2024; SEMA, 2024). The New Madrid Seismic Zone can generate destructive earthquakes at any moment, as seen by the historical 1811-1812 earthquake sequence, which had several shocks estimated at magnitude 7.0 or higher. The region continues to be active, averaging over 200 earthquakes annually, although the majority are too minor to be perceived (Missouri Department of Natural Resources, 2024; CUSEC, 2024). The eight states most impacted by the NMSZ are Alabama, Arkansas, Illinois, Indiana, Kentucky, Mississippi, Missouri, and Tennessee. These states, which are the focus of this study and where the survey was implemented, encounter considerable obstacles in earthquake preparedness, such as implementing and enforcing current seismic building codes, the susceptibility of essential infrastructure, inadequate public awareness regarding earthquake hazards, and insufficient earthquake insurance coverage for homeowners (Missouri Department of Natural Resources, 2024; IEMA, 2024; SEMA, 2024; CUSEC, 2024). The geology of the Central United States renders it especially vulnerable to soil liquefaction during seismic events, potentially exacerbating damage across a broader region (Ervin and McGinnis, 1975; Hildenbrand et al., 1996; Grollimund and Zoback, 2001). Coordinating response operations across several state lines during a significant earthquake poses logistical difficulties. To tackle these challenges, entities like the Central United States Earthquake Consortium (CUSEC) and the Federal Emergency Management Agency (FEMA) have been engaged in multi-state planning projects and public awareness campaigns, including the “Great Central U.S. ShakeOut” drill (CUSEC, 2024; FEMA, 2024a; Stelzer, 1999).
Figure 1
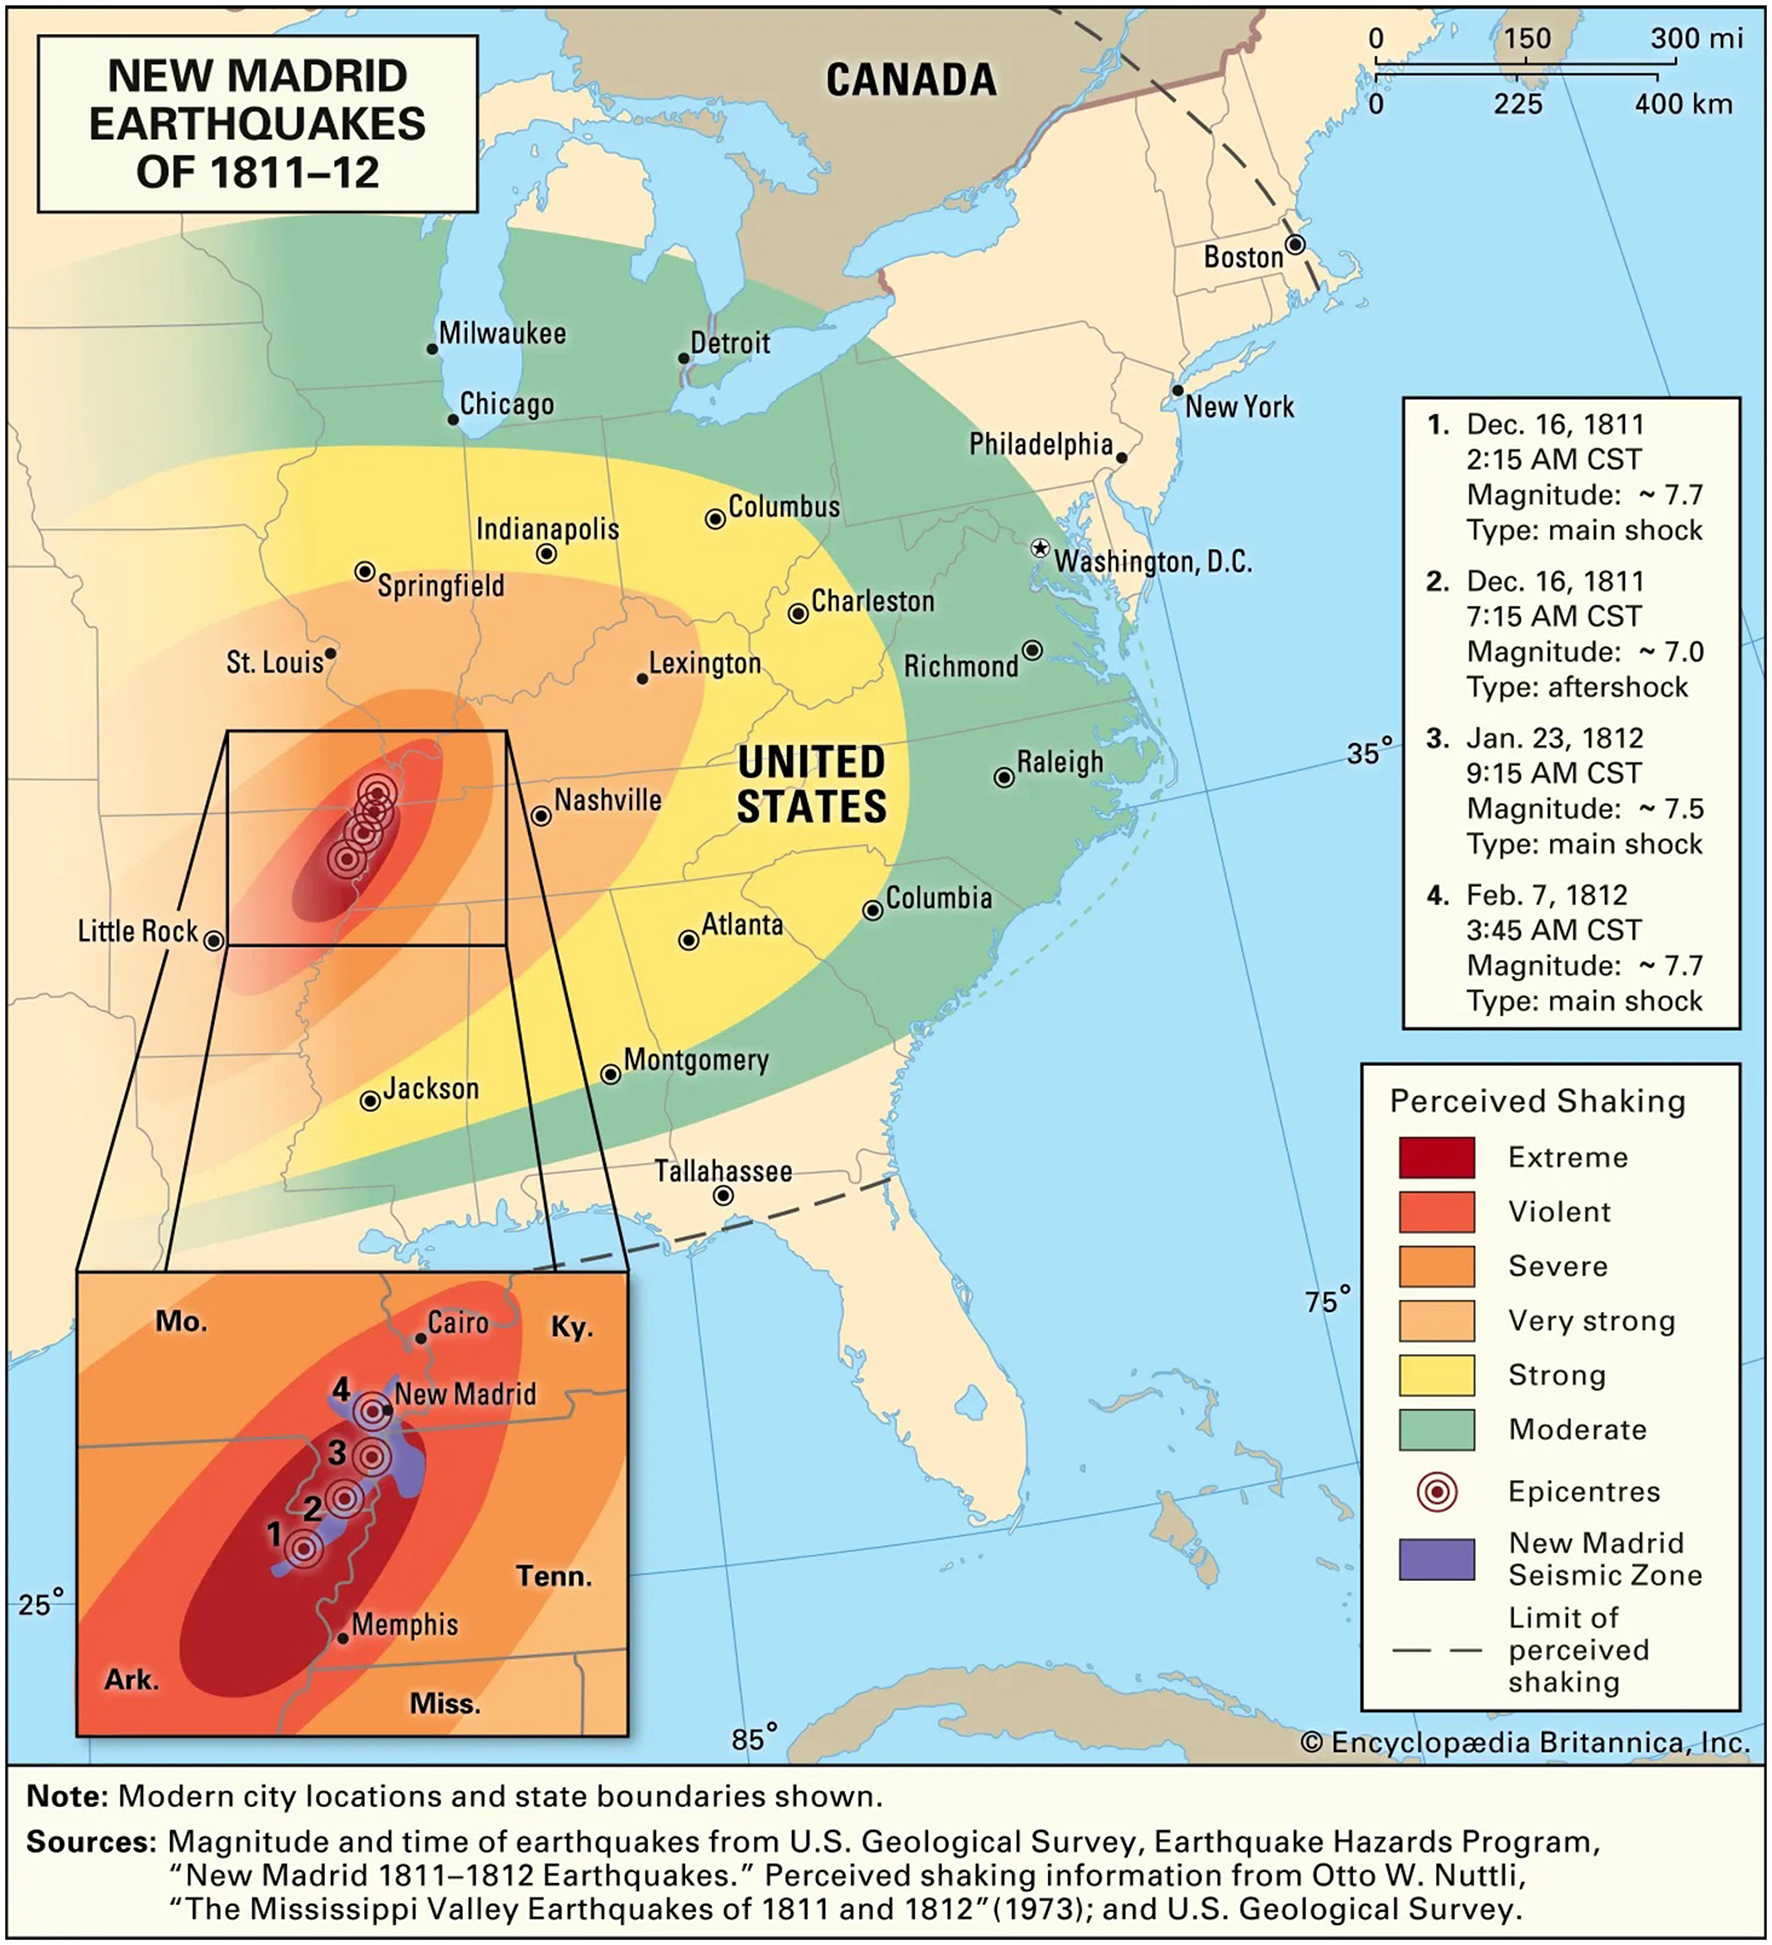
New Madrid Seismic Zone. Source: Encyclopaedia Britannica (2024) (New Madrid Earthquakes 1811–12 reproduced by courtesy of Encyclopædia Britannica, Inc., copyright 2023; used with permission.).
The weighted histogram and relative proportion analysis (Figure 2) indicate substantial disparities in earthquake risk among the eight NMSZ states, considering population density. The weighted frequency analysis suggests that most of the population lives in high-risk counties, followed by medium-risk areas, with the least number in low-risk zones. Analyzing state-by-state, Mississippi exhibits the highest percentage of its population residing in high-risk zones (64.1%), followed by Illinois (59.5%) and Indiana (55.7%). Although nearer to the NMSZ epicenter, Tennessee exhibits a more equitable distribution with 53.8% classified as high-risk, 31.3% as medium-risk, and 14.8% as low-risk locations. Kentucky exhibits the most equitable distribution between high and medium risk, with 44.5% and 44.7% respectively. Indiana lacks any low-risk classed areas, but Alabama and Arkansas exhibit the largest percentages of low-risk regions at 18.9% and 17.6%, respectively. This analysis, grounded in a population-weighted methodology, provides a nuanced understanding of the actual exposure of populations to seismic risks, which is more precise than unrefined geographic risk assessments.
Figure 2
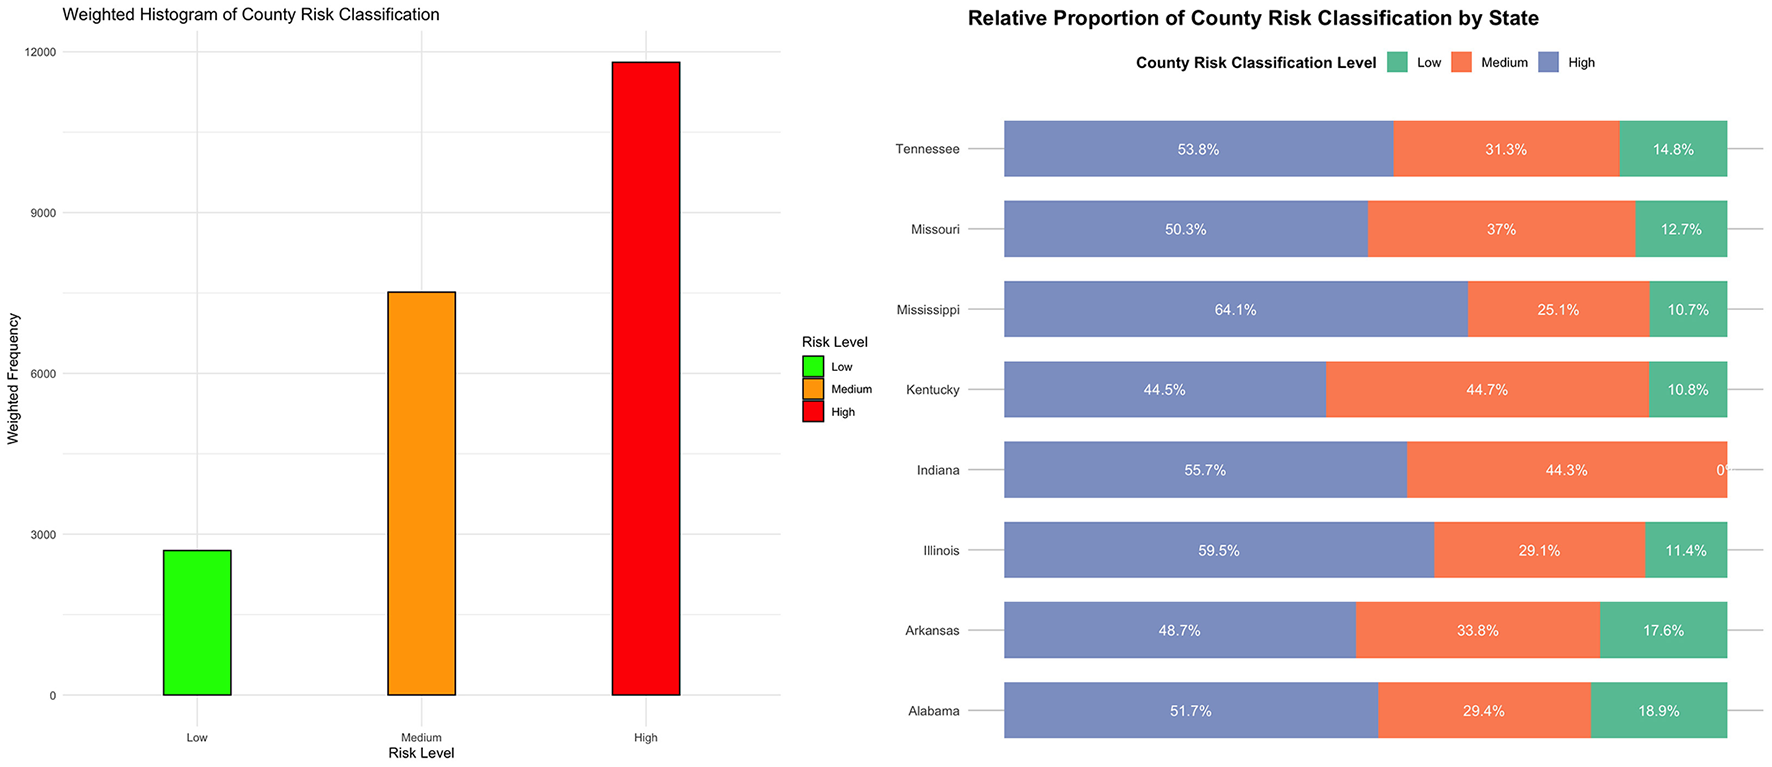
Weighted county risk classification. 2024 Earthquake Survey. Source: Author's analysis.
3 Theory
This study investigates three essential factors influencing earthquake preparedness among homeowners in the New Madrid Seismic Zone: risk perception (the integrated evaluation of perceived vulnerability and severity), community engagement and communication (encompassing information-seeking behaviors and social interactions), and earthquake awareness (self-assessed knowledge of seismic hazards and suitable responses). The analysis examines these factors across eight states–Alabama, Arkansas, Illinois, Indiana, Kentucky, Mississippi, Missouri, and Tennessee–where weighted results indicate that most residents reside in high-risk counties.
3.1 Risk perception
Risk perception, defined as a composite assessment of perceived susceptibility (the individual's assessment of the probability of experiencing an earthquake) and perceived severity (the evaluation of possible adverse outcomes), has been consistently associated with earthquake preparedness behaviors in scholarly literature. Research indicates that individuals with heightened risk perception are often more inclined to participate in preparedness activities, but additional factors frequently influence this correlation. Research demonstrates that risk perception functions through many channels to affect preparedness behaviors. Paton et al. (2005) identified that crucial awareness and risk perception significantly predicted outcome expectations, which subsequently affected preparedness intentions and actual preparedness practices. Paton (2019) similarly established that personal risk views, encompassing risk appraisal (perceived likelihood and severity), were significant determinants of intentions to prepare for earthquakes. The correlation between risk perception and readiness is not invariably direct. Bonfanti et al. (2023) suggested a strong correlation between earthquake preparedness and factors such as risk perception, self-efficacy, and trust in information; however, other research indicates that elevated risk perception alone may not immediately lead to preparedness behaviors. Bronfman et al. (2016) observed that the correlation between risk perception and mitigation behavior is intricate and contingent upon circumstances.
3.2 Community engagement and communication
Community engagement and communication in earthquake preparedness involve several activities, such as information-seeking behaviors, discussions with family and friends, participation in community events, and interactions with neighbors regarding earthquake hazards and preparedness strategies. Research has shown that good communication and community engagement are essential to promoting disaster preparedness. Research indicates that persons participating in earthquake-related dialogues and pursuing information from many sources are more inclined to adopt preparedness strategies (Becker et al., 2012). Numerous studies have proven the efficacy of community-based participatory techniques, demonstrating that involvement in community disaster preparedness initiatives improves both individual and communal preparedness (Gamboa-Maldonado et al., 2012; McBride et al., 2019; Shrestha et al., 2021). Community engagement fosters social networks and trust, which are vital for information dissemination and collaborative efforts in emergencies. Moreover, Wein et al. (2016) demonstrate that persons who consistently engage in discussions about earthquake preparedness with family and partake in community activities are more inclined to formulate and sustain emergency plans and provisions.
3.3 Earthquake awareness
Awareness of earthquakes, which includes self-assessed earthquake literacy and understanding of suitable responses during seismic occurrences, has been consistently associated with enhanced preparedness behaviors. Lindell and Perry (2012) indicate that those with greater earthquake awareness are more inclined to participate in preparatory efforts and adopt protective measures. McClure et al. (2015b) show that awareness of seismic hazards and comprehension of suggested safety protocols substantially affect preparedness choices. This correlation is especially pronounced in high-risk regions, where heightened awareness frequently results in improved preparedness and response capabilities. The theoretical basis for this positive correlation arises from the knowledge-behavior connection, wherein enhanced comprehension results in better-informed decision-making and actions (Paton and Johnston, 2017). Recent research indicates that persons with heightened earthquake awareness are more inclined to formulate emergency plans, stockpile emergency supplies, and engage in preparedness actions (Paton and Johnston, 2017; McClure et al., 2015b). Moreover, individuals with elevated earthquake literacy exhibit a superior comprehension of preventative measures during seismic events and are more inclined to respond effectively during such occurrences (Solberg et al., 2010).
4 Methodology
4.1 Data source and sample design
The data originate from an online poll conducted in early 2024 by the Center for Insurance Policy Research (CIPR) of the National Association of Insurance Commissioners via Qualtrics. The target population comprises adult inhabitants in states that overlap with the New Madrid Seismic Zone, as delineated by the U.S. Geological Survey. The recruitment employed prestratification quotas based on state and community type (urban, suburban, rural) to achieve balance during the sampling phase and to guarantee sufficient subgroup cell sizes. Eligibility required respondents to be 18 years or older and residency in one of the participating states. Post-stratification weights adjusted race and gender to correspond with the demographic standards of each state as of July 1, 2023. The estimates utilize these weights and accurately represent homeowners throughout the research area. The weighting method maintains the within-state composition while rectifying slight discrepancies in racial and gender proportions during data collection. The analytical sample comprises 877 homeowners selected from 1,503 respondents, with 625 renters omitted due to the study's emphasis on property-level mitigation and insurance choices. The homeowner restriction links the unit of analysis with decision-makers for structural retrofitting and homeowners insurance, resulting in a more homogeneous population for inference and clearer interpretation of preparedness behaviors. Owner-occupied shares exceed 50 percent in each core NMSZ state, confirming a homeowner-majority tenure structure: Arkansas 66.1%,1 Illinois 66.8%,2 Indiana 70.4%,3 Kentucky 68.3%,4 Mississippi 69.5%,5 Missouri 67.9%,6 Tennessee 67.0%.7 This tenure profile supports restricting inference to homeowners, while prestratification and weighting support regional representativeness.
4.2 Main variables
4.2.1 Dependent variable
The dependent variable in this study is earthquake preparedness planning, quantified as an average index derived from responses to eight essential preparatory acts. These actions evaluate the concrete measures individuals have implemented or intend to use in preparation for earthquakes. The index consolidates binary recoded replies (1 = “Yes,” 0 = “No” or “No, but I intend to within the next year”) to indicate the degree of preparedness. The eight items comprise: (1) securing heavy objects and utilities within the residence, (2) reinforcing or retrofitting the home to withstand earthquakes, (3) assembling an earthquake/disaster kit with essential supplies, (4) safeguarding important documents, (5) formulating a family earthquake plan, (6) compiling a home inventory of possessions, (7) strategizing for potential evacuation, and (8) determining the presence of earthquake insurance for the respondent. The incorporation of earthquake insurance expands the index to include financial preparedness alongside physical and logistical readiness. The internal consistency of this index was evaluated using Cronbach's alpha, a reliability coefficient that quantifies the correlation among items on a scale and their contribution to a cohesive construct (Cronbach, 1951; Cho, 2016).
The Cronbach's alpha for this index is 0.8 (Table 1), signifying high reliability and demonstrating that the items collectively yield a consistent assessment of earthquake preparation. Omitting the insurance item results in Cronbach's α = 0.81, signifying comparable reliability. All estimations utilize survey weights. The approach employed prestratification quotas based on state and community type, together with post-stratification weights that correspond race and gender to state standards, to mitigate potential non-response bias. The index employs available-case averaging to prevent the exclusion of data due to a solitary missing item among householders.
Table 1
| Preparedness item | α if dropped | Mean | SD | Average r |
|---|---|---|---|---|
| Secure heavy objects/utilities | 0.78 | 0.16 | 0.36 | 0.33 |
| Reinforce/retrofit home | 0.79 | 0.11 | 0.31 | 0.35 |
| Assemble disaster kit | 0.76 | 0.23 | 0.42 | 0.31 |
| Store important documents | 0.80 | 0.61 | 0.49 | 0.36 |
| Develop family earthquake plan | 0.76 | 0.17 | 0.37 | 0.31 |
| Compile home inventory | 0.77 | 0.22 | 0.41 | 0.32 |
| Plan evacuation | 0.76 | 0.28 | 0.45 | 0.32 |
| Hold homeowner's earthquake insurance | 0.81 | 0.21 | 0.41 | 0.38 |
Reliability of the earthquake preparedness index (homeowners, N = 877).
Overall Cronbach's α = 0.80 (95% CI: 0.78–0.81). Reliability remains high if any single item is excluded.
4.2.2 Independent variables
The primary key independent variable, risk perception, is an indicator that amalgamates two principal components: perceived severity and perceived susceptibility of earthquakes, collectively representing individuals' cognitive evaluation of earthquake risk. Perceived severity is assessed by three measures that gauge respondents' beliefs of the potential for an earthquake to inflict significant damage and destruction in their community, disrupt critical services (e.g., power, water, telecommunications), and cause injuries or fatalities. Perceived susceptibility is evaluated using four items that gauge respondents' opinions regarding the probability of an earthquake affecting their residence, their degree of apprehension about such an occurrence, their sense of vulnerability to earthquakes, and the perceived risk that earthquakes present to their household. All items are evaluated using a 5-point Likert scale, with responses ranging from “Strongly disagree” (1) to “Strongly agree” (5). The risk perception index is formulated by consolidating these components into a singular metric, exhibiting a Cronbach's alpha of 0.73, which signifies acceptable reliability and internal consistency. This measure is essential to the study, as perceptions of severity and susceptibility significantly influence preparedness behavior, determining individuals' responses to earthquake hazards.
The second principal independent variable is community engagement and communication, which measures the degree of individuals' participation in debates and activities about earthquakes over the past year. This variable is quantified using an index derived from four items that evaluate the frequency of respondents' participation in particular earthquake-related activities. These actions encompass engaging in discussions with family and friends regarding earthquakes, disseminating information to family and friends, conversing about earthquakes with neighbors and colleagues, and participating in meetings or community events focused on earthquakes. Responses are documented on a 5-point Likert scale, ranging from “Never” to “Very often,” indicating the frequency of these activities. This score suggests interpersonal contact and community engagement, offering insight into earthquake preparedness's social and collective aspects. This variable is analyzed to comprehend the impact of communication and social interaction on individuals' preparedness initiatives, emphasizing the significance of community networks in promoting awareness and action.
The third primary independent variable is earthquake awareness, which evaluates individuals' perceived adequacy of information concerning different facets of earthquake preparedness and response. This variable is quantified as an index derived from seven items, each representing a distinct area of earthquake knowledge. Respondents are requested to indicate their level of information regarding understanding the earthquake risk in their area, ensuring safety during an earthquake, knowing appropriate actions during an earthquake, assisting others during an earthquake, preparing for an earthquake, managing earthquake damage, and comprehending earthquake insurance coverage. Responses are quantified on a scale ranging from 0, indicating “I do not have enough information”, to 1, representing “I have enough information”. The index is determined by the average score of all items, yielding a composite assessment of earthquake awareness. This variable measures how individuals perceive themselves as informed and equipped to handle earthquake risks and their consequences. This study investigates earthquake awareness to underscore the significance of information sufficiency in influencing preparedness behaviors, asserting that access to clear and actionable information is essential for effective earthquake preparedness.
4.2.3 Control variables
The study incorporates several control variables alongside the primary independent variables to address alternative hypotheses related to earthquake preparedness. Adding home value as a control variable is based on the hypothesis that higher home values correlate with increased earthquake preparedness. Home value is categorized into six levels, from “Less than $100,000” to “$400,000 or more”. This variable indicates the financial capacity available for investment in earthquake mitigation measures, including retrofitting and acquiring emergency supplies. Home tenure, defined as the number of years spent in the current residence, is posited as a control variable that may positively affect preparedness. Extended tenure is likely to enhance attachment to the home and encourage more proactive risk mitigation behaviors. Furthermore, prior earthquake experience, defined as a binary variable (0 = no experience, 1 = experience), reflects individual exposure to the effects of earthquakes, including property damage and service disruptions. Individuals with prior earthquake experiences are hypothesized to engage in preparedness activities more frequently due to increased risk awareness.
The research incorporates controls for County Risk Classification, which is categorized from 1 (lowest risk) to 6 (highest risk) according to data from the Central United States Earthquake Consortium (CUSEC) pertaining to counties within the New Madrid Seismic Zone. This variable addresses geographic differences in seismic risk that may affect preparedness behaviors. Demographic controls such as race, gender, education, and income are essential for analyzing the influence of sociodemographic factors on preparedness. The study posits two interaction effects: a positive interaction between earthquake awareness and home value, indicating that increased awareness enhances the impact of home value on preparedness, and a negative interaction between income and home tenure, suggesting that higher income may reduce the effect of long-term residency on preparedness behaviors. The study incorporates controls and interactions to analyze the factors influencing earthquake preparedness and examines the interplay between key predictors.
4.3 Model analysis
The study utilizes a two-stage analytical framework with weighted ordinary least squares (OLS) regression stratified by state to evaluate the primary relationships between earthquake preparedness and the independent variables. The stratification facilitates the consideration of state-specific differences, highlighting variability in risk, demographic factors, and preparedness among states. Weighted OLS is employed to account for the complex sampling design and population weights, thereby improving the generalizability of the findings. The paper also employs quantile regression as a supplementary approach to address the issue of heteroscedasticity.
4.3.1 Weighted ordinary least squares (OLS)
The weighted ordinary least squares (WOLS) objective function is defined as:
where:
-
w i > 0 is the weight for observation i,
-
y i ∈ ℝ is the response variable for observation i,
-
x i ∈ ℝp is the predictor vector for observation i,
-
β ∈ ℝp is the vector of regression coefficients.
Alternatively, in matrix form:
where:
-
y ∈ ℝn is the vector of response variables,
-
X ∈ ℝn×p is the design matrix,
-
W = diag(w1, w2, …, wn) is a diagonal matrix of weights.
The closed-form solution is given by:
4.3.2 Weighted quantile regression
For a given quantile τ ∈ (0, 1), the weighted quantile regression objective is:
where:
-
w i > 0 is the weight for observation i,
-
ρτ(u) is the check function defined as:
Alternatively, using the positive-part operator (z)+ = max(0, z), the objective can be rewritten as:
4.3.3 Limitations
Notwithstanding the merits of the sample approach, certain limitations warrant attention. The cross-sectional study restricts causal interpretation due to the absence of observable temporal ordering between predictors and preparation outcomes (Angrist and Pischke, 2009). Secondly, online administration presents hazards of coverage error and self-selection; while quotas and post-stratification mitigate bias, they do not entirely eradicate it if internet access and survey participation are correlated with preparation (Bethlehem, 2010). Third, self-reported preparedness is susceptible to recollection bias and social desirability bias, which may distort estimates of behaviors and intentions (Tourangeau and Yan, 2007). Fourth, weights were adjusted according to race and sex at the state level; unobserved disparities due to factors such as age, income, or broadband access may remain, and design-based inference presupposes accurate specification of the weighting model and variance estimation (Korn and Graubard, 2011; Lohr, 2021).
5 Findings
5.1 Results
Table 2 provides a comparison between the conventional OLS model (Mean) and the quantile regression models (25%, 50%, 75%). The OLS results indicate a general average effect across the entire sample. In contrast, the quantile regression results provide a more detailed analysis by examining the influence of predictors at various levels of earthquake preparedness. This distinction is significant as preparedness varies among homeowners; some have implemented extensive protective measures, while others have undertaken minimal actions. Investigating various quantiles in this context reveals patterns that may be obscured by reliance on an aggregate average.
Table 2
| Variable | OLS | Quantile regression | ||
|---|---|---|---|---|
| Mean | Quantile (25%) | Quantile (50%) | Quantile (75%) | |
| Intercept | 0.009 | −0.115 | −0.014 | 0.096 |
| (0.070) | (0.063) | (0.059) | (0.061) | |
| Main variables | ||||
| Risk perception | 0.024* | 0.023* | 0.029* | 0.027* |
| (0.012) | (0.008) | (0.009) | (0.009) | |
| Community engagement and communication | 0.115*** | 0.107*** | 0.112*** | 0.106*** |
| (0.015) | (0.011) | (0.010) | (0.011) | |
| Earthquake awareness | 0.050*** | 0.027** | 0.064*** | 0.074*** |
| (0.012) | (0.009) | (0.007) | (0.012) | |
| Control variables | ||||
| Home value | 0.032* | 0.014 | 0.028** | 0.068*** |
| (0.016) | (0.013) | (0.010) | (0.015) | |
| Home tenure | 0.001 | −0.018 | 0.004 | 0.014 |
| (0.013) | (0.011) | (0.010) | (0.012) | |
| Previous earthquake experience | −0.004 | −0.037 | 0.000 | −0.006 |
| (0.032) | (0.025) | (0.023) | (0.028) | |
| County risk classification | −0.003 | −0.001 | −0.003 | −0.002 |
| (0.008) | (0.007) | (0.006) | (0.009) | |
| Female | 0.042 | 0.039 | 0.062* | 0.027 |
| (0.022) | (0.019) | (0.017) | (0.020) | |
| Income | 0.006 | 0.037** | 0.014 | −0.005 |
| (0.014) | (0.013) | (0.012) | (0.014) | |
| Education | −0.006 | −0.012 | −0.009 | −0.003 |
| (0.008) | (0.007) | (0.006) | (0.008) | |
| Race (Reference = Non-Hispanic White) | ||||
| Black people | 0.016 | 0.054 | 0.013 | −0.029 |
| (0.026) | (0.024) | (0.020) | (0.022) | |
| Hispanic | 0.036 | 0.063 | 0.041 | 0.026 |
| (0.054) | (0.037) | (0.035) | (0.049) | |
| Other races | 0.059 | 0.012 | 0.039 | 0.122* |
| (0.051) | (0.038) | (0.032) | (0.045) | |
| Interaction terms | ||||
| Earthquake awareness: home value | 0.038** | 0.019* | 0.032** | 0.067*** |
| (0.014) | (0.009) | (0.008) | (0.013) | |
| Income:Home tenure | −0.023* | −0.030*** | −0.020* | −0.009 |
| (0.011) | (0.008) | (0.007) | (0.010) | |
Regression coefficients with standard errors from OLS and quantile regression models (25%, 50%, 75%).
Analytic sample: N = 877 homeowners; weighted estimates.
Significance levels: ***p < 0.001, **p < 0.01, *p < 0.05. Standard errors in parentheses.
Focusing first on the attitudinal and behavioral variables, risk perception, community engagement and communication, and earthquake awareness consistently demonstrate significance across both OLS and all quantiles. The magnitude of their coefficients varies according to the level of preparedness. Risk perception is significant across all quantiles, though it exerts varying degrees of influence among homeowners categorized as minimally, moderately, or highly prepared. Community engagement and communication emerge as the most significant predictor overall, demonstrating that individuals who actively participate in earthquake-related discussions and activities consistently exhibit higher levels of preparedness, regardless of their position within the distribution. Earthquake awareness is particularly influential in the median (50%) and upper (75%) quantiles, indicating that such awareness becomes a more significant factor as households progress from basic initial actions to more comprehensive, proactive strategies.
The socioeconomic variables of home value and income demonstrate that quantile-based analysis can provide greater insights compared to an OLS-only approach. In the OLS model, home value exhibits a modest positive effect (β = 0.032, p < 0.05). Breaking it down by quantiles indicates that Home value is not significant at the 25% level but achieves significance at the 50% quantile (β = 0.028) and is even more pronounced at the 75% quantile (β = 0.068). This progression indicates that homeowners with higher property values, after implementing certain preparedness measures, are more likely and financially capable of enhancing those efforts. Income is significant at the 25% quantile (β = 0.037**) but loses significance at higher quantiles, indicating that additional financial resources are particularly relevant for individuals in the early stages of preparedness, potentially enabling them to afford essential protective measures.
Two interaction terms–Earthquake Awareness and Home Value; Income and Home Tenure–highlight the complexity of preparedness behaviors. The interaction between awareness and home value is consistently positive, exhibiting its most significant effect at the 75% quantile (β = 0.067***). This indicates that households with higher-value properties that are well-informed experience the greatest benefits in preparedness. The negative interaction between income and home tenure is observed in OLS analysis at the lower (25%) and median (50%) quantiles but not at the 75% quantile. This pattern indicates that individuals new to preparedness initiatives may experience reduced motivation to prepare when they possess both higher income and longer tenure, potentially due to complacency or habituation. These findings emphasize the necessity of examining factors beyond mean effects to comprehend the functioning of preparedness drivers across the entire distribution.
Figure 3 demonstrates differing impacts of risk perception, community participation and communication, and seismic awareness on various levels of earthquake preparedness. Risk perception exhibits a predominantly positive trajectory over quantiles, with coefficients fluctuating from about zero at lower quantiles to around 0.05 at higher quantiles. At the same time, the effect diminishes significantly at the highest quantile. Community engagement and communication exhibit the most significant impact among the three factors, with coefficients varying from 0.03 to 0.17 across quantiles, most pronounced at elevated readiness levels. Earthquake awareness demonstrates a consistently good impact across quantiles, ranging from 0.01 to 0.07. The interaction plots (Figure 4) demonstrate significant moderating effects: earthquake awareness has a more pronounced positive correlation with readiness for higher-value properties, as evidenced by the steeper slope of the high home value line. The relationship between income and home tenure indicates that income positively influences preparation for individuals with shorter tenure, whereas this effect lessens or turns negative for those with longer tenure.
Figure 3
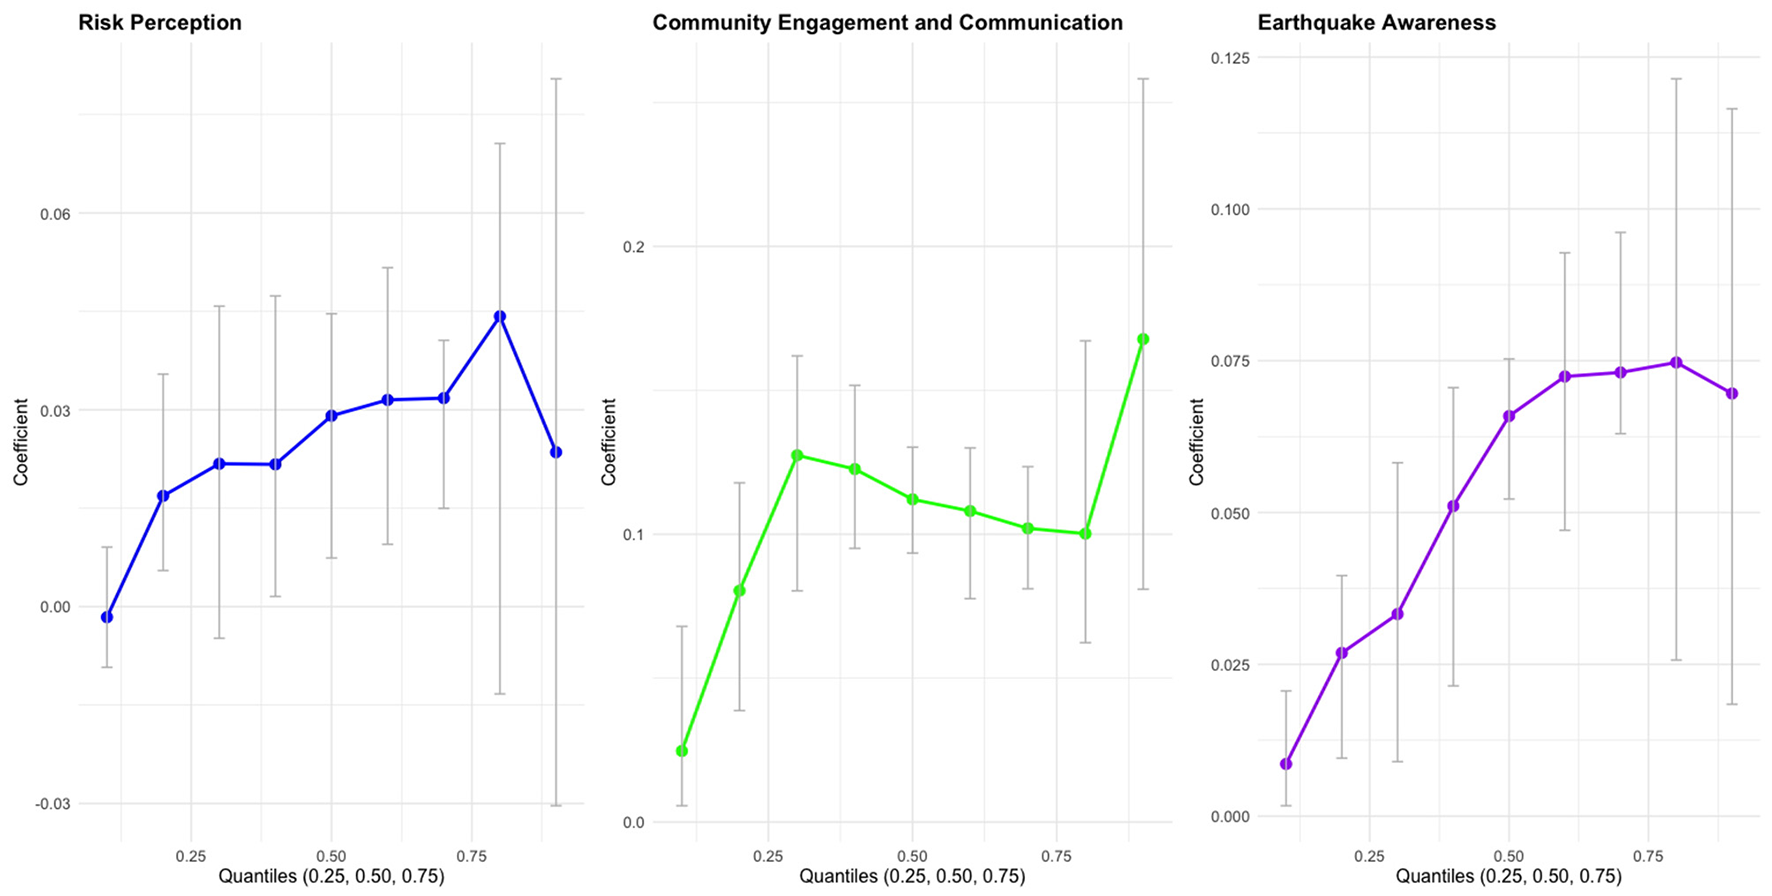
Quantile regression coefficient. 2024 Earthquake Survey. Source: Author's analysis.
Figure 4
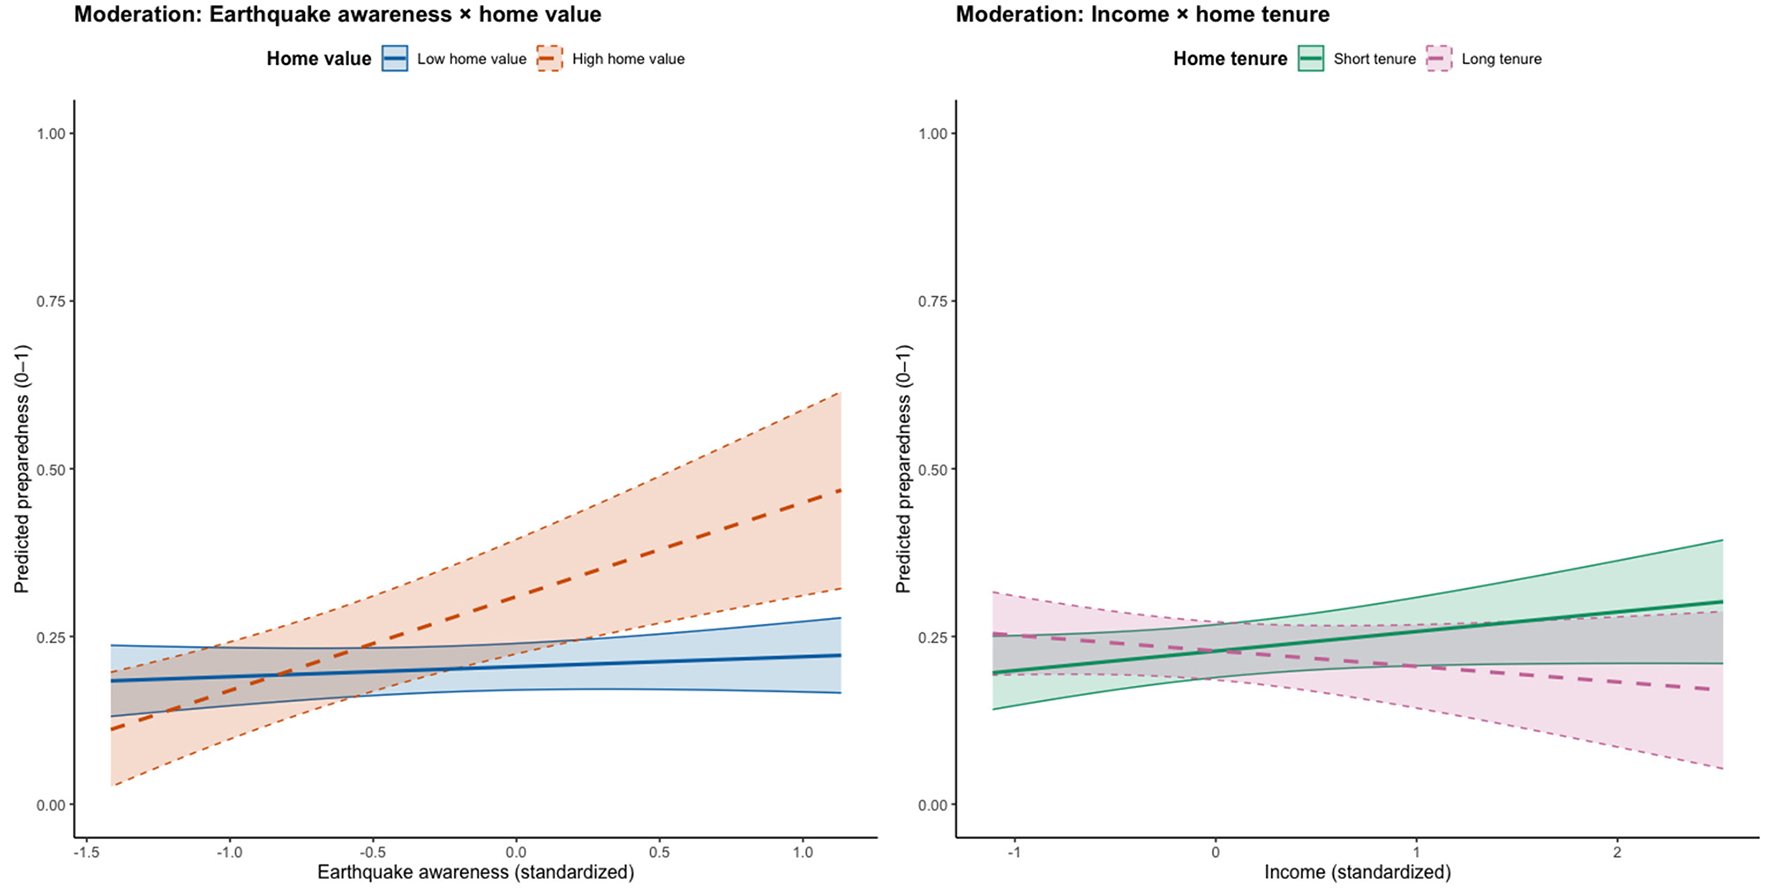
Interaction effect plot. 2024 Earthquake Survey. Source: Author's analysis.
5.2 Post-estimation analysis
The multicollinearity among the independent variables was evaluated using the Generalized Variance Inflation Factor (GVIF), with results presented in Table 3. Adjusted GVIF values (GVIF1/(2·Df)) remained below the established threshold of 2.5, suggesting the absence of significant multicollinearity issues within the model. Home Value (1.907) and Income (1.819) exhibited higher adjusted GVIF values than other variables; however, these values remain within acceptable limits, indicating moderate correlations that are not problematic. Community Engagement and Communication (1.496) and Earthquake Awareness (1.513) demonstrated modest correlations with other predictors. Reduced adjusted GVIF values for variables including Race, Female, Education, and County Risk Classification indicate low levels of collinearity. The results suggest that the independent variables are sufficiently distinct, ensuring reliable parameter estimates and supporting the regression analysis's robustness.
Table 3
| Variable | GVIF | Df | GVIF1/(2·Df) |
|---|---|---|---|
| Race | 1.923629 | 3 | 1.115202 |
| Gender | 1.521697 | 1 | 1.233571 |
| Education | 1.525065 | 1 | 1.234935 |
| Income | 2.815591 | 1 | 1.677972 |
| County risk classification | 1.289154 | 1 | 1.135409 |
| Risk perception | 1.332857 | 1 | 1.154494 |
| Previous earthquake experience | 1.161903 | 1 | 1.077916 |
| Community engagement and communication | 2.004862 | 1 | 1.415932 |
| Earthquake awareness | 1.604913 | 1 | 1.266851 |
| Home tenure | 1.434969 | 1 | 1.197902 |
| Home value | 3.109629 | 1 | 1.763414 |
| Earthquake awareness: home value | 2.333009 | 1 | 1.527419 |
| Income: home tenure | 1.325312 | 1 | 1.151222 |
Generalized variance inflation factor (GVIF) results.
The residual plot (Figure 5) indicates potential heteroscedasticity, as the variance of the residuals seems to increase with the fitted values. The Breusch-Pagan test (Table 4) confirms this concern, producing a highly significant result (BP = 75.105, p < 2.2 × 10⁻¹⁶), which indicates the presence of heteroscedasticity in the data. The violation of the OLS assumption requires the application of alternative modeling techniques to yield more reliable estimates.
Figure 5
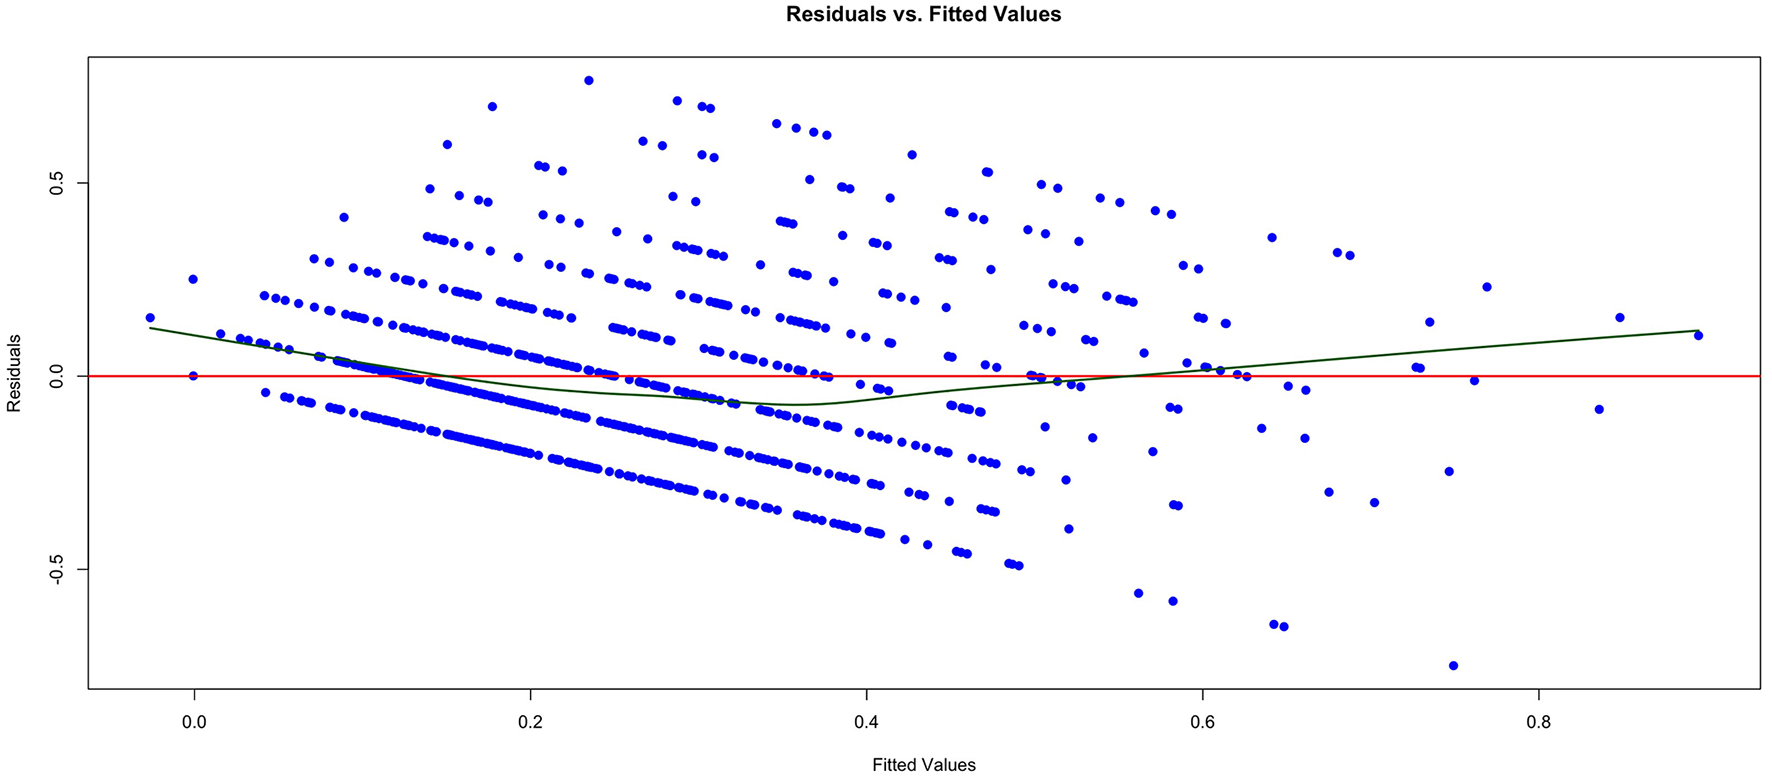
Residual diagnostics from weighted OLS model (2024 Earthquake Survey). Plot shows standardized residuals vs. fitted values to assess potential heteroscedasticity, consistent with Breusch-Pagan results in Table 4. Source: Author's analysis.
Table 4
| Test/analysis | Statistic/value | Details/significance |
|---|---|---|
| Breusch-Pagan test | ||
| Breusch-Pagan test statistic (BP) | 75.105 | p-value < 2.2 × 10⁻¹⁶ |
| Degrees of Freedom (df) | 1 | |
| Quantile Regression analysis of deviance: Wald test | ||
| Model: y = β0 + β1x + … | Joint test of equality of slopes: τ ∈ {0.1, 0.5, 0.9} | |
| Residual degrees of freedom (ResidDf) | 2, 601 | |
| Degrees of freedom (Df) | 30 | |
| F value | 3.0224 | p-value = 7.5 × 10⁻⁸(***) |
Breusch-Pagan test and quantile regression analysis of deviance results.
Significance levels: ***p < 0.001, **p < 0.01, *p < 0.05.
In contrast to OLS, which assesses the average relationship between predictors and the outcome, quantile regression offers a more detailed analysis by estimating effects at various points in the conditional distribution of earthquake preparedness. This study is particularly relevant, as the relationship between preparedness and its predictors may differ across various levels of preparedness. The results of the quantile regression Wald test (Table 4) indicate its effectiveness, with a significant test statistic (F = 3.0224, p = 7.5 × 10⁻⁸) demonstrating that the impact of predictors differs across quantiles (τ = 0.1, 0.5, 0.9). This complementary approach guarantees that the analysis encompasses both central tendencies and distributional differences, thereby offering a more thorough understanding of the factors influencing earthquake preparedness. The integration of weighted OLS and quantile regression effectively addresses heteroscedasticity and accommodates heterogeneous effects, thereby improving the robustness and interpretability of the study's findings.
5.3 Discussion
The differences between OLS and quantile regression results highlight a critical weakness of traditional preparedness models: their failure to consider variability in homeowner behavior. Although OLS offers a population-averaged viewpoint, quantile regression demonstrates that preparedness drivers function variably across the readiness spectrum–a conclusion consistent with Weerts et al. (2011), who contended that flood mitigation behaviors display threshold effects that are masked by mean-based analyses. This study enhances preparedness studies by evaluating impacts across the conditional distribution instead of solely at the mean. The residual-fitted trend and a notable Breusch-Pagan statistic suggest heteroscedasticity, which compromises mean-based inferences from OLS (Breusch and Pagan, 1979; White, 1980; Angrist and Pischke, 2009). Quantile regression resolves this issue by estimating the effects of covariates at various preparation levels, so capturing heterogeneous responses and tail behavior (Koenker and Bassett Jr, 1978; Koenker, 2005; Koenker and Hallock, 2001; Hao and Naiman, 2007). A substantial equality-of-slopes test across quantiles indicates distributional variability rather than a uniform linear change (Koenker and Xiao, 2002; Koenker and Machado, 1999). This method enhances policy relevance by aligning estimates with the choice thresholds encountered by various homeowner segments (Firpo et al., 2009; Cade and Noon, 2003).
Significant attitudinal and behavioral findings demonstrate continuous positive correlations across risk perception, community participation, and earthquake awareness across quantiles, with more pronounced impacts observed at the middle and upper segments of the distribution for awareness. The persistent significance of risk perception, earthquake awareness, and community involvement across quantiles supports Paton et al. (2014)'s claim that cognitive and social factors are the foundation of preparedness. These trends correspond with the notion connecting risk assessment, social engagement, and knowledge to protective measures (Lindell and Perry, 2012; Paton, 2008, 2019; Becker et al., 2012). Nonetheless, quantile-specific fluctuations disclose essential subtleties. At the 25th percentile, slight enhancements in risk perception, such as through localized USGS hazard maps or community workshops, might initiate preliminary preparedness measures, reflecting the findings of Jahangiri et al. (2010) in Iran. Conversely, households at the 75th quantile—already participating in community discussions–necessitate sophisticated technical assistance (e.g., retrofit engineering standards) to advance toward structural mitigations, as emphasized by Miyamoto et al. (2023) in post-Kobe earthquake Japan. This gradient effect contests the “one-size-fits-all” risk communication approach criticized by Grozdanić et al. (2024), promoting tiered messaging tailored to readiness baselines.
Community engagement demonstrates the most robust and consistent correlation, suggesting that discussion networks and local involvement facilitate both the initiation and enhancement of preparedness (Becker et al., 2012). Awareness demonstrates a more significant effect at elevated quantiles, aligning with narratives that suggest knowledge becomes more actionable once households have surmounted fundamental restrictions and commenced investment (McClure et al., 2015a; Lindell and Perry, 2012).
Socioeconomic outcomes demonstrate distributional gradients obscured by the mean. The value of a home exhibits minimal impact at the lower quantile, a significant correlation at the median, and a robust correlation at the upper quantile. This pattern indicates threshold dynamics: Resources associated with wealth facilitate the transition from fundamental to sophisticated measures following the implementation of initial steps (Buchinsky, 1994; Firpo et al., 2009). Income is only significant at the lower quantile, indicating that liquidity is crucial for underprepared households encountering initial expenses. The connection between awareness and house value intensifies at the top quantile, aligning with the resource-facilitated conversion of information into action (Lindell and Perry, 2012; Becker et al., 2012). The adverse association between income and tenure at lower and median quantiles suggests habituation or normalization among long-tenured households, regardless of resources, reflecting findings related to experience, complacency, and stagnated adjustments in hazardous environments Paton (2008, 2019).
These distribution-sensitive results guide targeting. Initiatives aiming for initial adoption should focus on lower-income households by providing liquidity assistance, streamlined checklists, and affordable retrofitting options. This corresponds with Feinman (2019); International Association of Insurance Supervisors (2023)'s “protection gap”, which asserts that cash limitations disproportionately impede low-income households from investing in preparedness, despite the presence of risk awareness. Mid-quantile households gain advantages from nudges that convert awareness into multifaceted strategies via community initiatives and social validation (Becker et al., 2012). Affluent households react to comprehensive advice on sophisticated retrofits and insurance enhancement, since awareness and affluence collectively elevate the potential for action. Distributional research further corroborates regional deployment, wherein social networks enhance engagement effects, aligning with preparation models that highlight communication channels and local trust (Lindell and Perry, 2012; Paton and Johnston, 2001).
The work methodologically illustrates that quantile regression provides robust and policy-relevant findings in the presence of heteroscedasticity and effect heterogeneity (Koenker and Bassett Jr, 1978; Koenker, 2005). A substantial quantile Wald test and consistent directionality across neighboring quantiles substantiate validity (Koenker and Machado, 1999). However, several constraints remain. The cross-sectional design restricts the ability to draw causal inferences because temporal sequencing of predictors and preparedness behaviors cannot be established (Angrist and Pischke, 2009). Longitudinal or panel data would allow researchers to examine dynamic processes, such as how changes in income, tenure, or awareness influence preparedness trajectories over time. Furthermore, reliance on self-reported measures introduces the possibility of recall bias and social desirability bias, which may lead to overestimation or underestimation of preparedness actions. Objective measures—such as insurance records, permit data for retrofits, or third-party verification of household preparedness kits—could help address these concerns in future work.
Despite these limitations, the present study demonstrates a distinct distributional structure in preparedness, underscoring that risk perception, awareness, and community engagement do not operate uniformly across populations. This reinforces the need to move beyond mean-based models toward quantile-sensitive approaches when developing seismic risk strategies. By accounting for heterogeneity and identifying where predictors matter most, quantile regression provides a more equitable and targeted foundation for policy interventions. In doing so, it ensures that preparedness initiatives can be customized to meet the needs of both underprepared and highly proactive households, ultimately strengthening resilience in the New Madrid Seismic Zone and comparable seismic regions.
6 Conclusion
This research underscores the essential need to transcend mean-based methodologies in the assessment of earthquake preparedness. The study demonstrates that factors such as risk perception, community participation, and earthquake awareness influence preparedness variably through the application of quantile regression. Community participation serves as the paramount predictor, highlighting the significance of social networks and information dissemination in cultivating resilience. The interaction results indicate that earthquake awareness significantly influences households with higher-value properties, whereas the impact of income lessens with extended home tenure, implying that wealth and experience affect preparedness in a non-linear manner. These insights collectively contest uniform approaches and illustrate that preparedness initiatives must be customized not only to demographic attributes but also to families' current standings along the preparedness continuum.
The study offers a framework for developing more focused treatments from a policy and practice standpoint. For households in the lower preparedness quantiles, solutions should prioritize addressing financial and informational obstacles to beginning activities, such as subsidized retrofitting or streamlined preparedness guides. Households in the middle quartile derive the greatest advantage from enhanced awareness via community campaigns and interactive exercises that facilitate the conversion of information into tangible action. At elevated quantiles, where awareness and property value exhibit the most significant interaction, activities may focus on sophisticated retrofits, insurance optimization, and leadership in community preparedness. This research identifies the locations and methods through which important predictors exercise their most significant influence, providing policymakers, insurers, and emergency managers with data to develop tailored measures that correspond to varied homeowner circumstances. Ultimately, quantile-based insights provide a more equitable and effective approach to enhancing earthquake resilience in the New Madrid Seismic Zone and similar high-risk areas globally.
7 Policy implications
The policy consequences of this research reach beyond the New Madrid Seismic Zone. Agencies, insurers, and local governments should customize programs according to preparation levels. Offer liquidity assistance, minor subsidies or refunds for essential improvements, affordable kits, and straightforward checklists to households with lesser preparation via reliable local channels. To bridge the awareness-action gap in the middle preparedness segment, implement neighborhood drills, disseminate social-norm messaging, and provide tailored feedback regarding subsequent actions. Encourage advanced retrofits, insurance optimization, and leadership positions as peer instructors for owners with heightened preparation. Utilize risk perception and awareness metrics to categorize audiences and schedule outreach efforts. Direct incentives toward high-risk counties utilizing state hazard maps, permit records, and appraisal data, and link rebates to inspections and code-compliant activities. Broaden this tiered strategy to encompass more U.S. seismic regions, such as Cascadia, the Wasatch Front, Southern California, and locations experiencing induced seismicity. Evaluate outcomes using distribution-sensitive metrics, disclose quantile effects instead of averages, and modify subsidies or communications when lower quantiles underperform.
8 Future research
Subsequent research can expand these findings by utilizing longitudinal or panel data to track changes in preparation across time and more effectively identify causative processes. Comparative analyses in additional high-risk seismic zones may assist in determining if these behavioral patterns are applicable beyond the New Madrid Seismic Zone. Furthermore, examining psychological factors—such as governmental trust and risk communication strategies—may uncover more intricate details on the evolution of awareness and engagement levels. Ultimately, incorporating developing techniques such as mobile applications and social media analytics may provide insights into the impact of digital platforms on family preparedness, particularly among marginalized populations not extensively analyzed in this study.
Statements
Data availability statement
The data supporting the findings of this study are available upon request from the NAIC Center for Insurance Policy and Research.
Author contributions
FN: Writing – original draft, Formal analysis, Writing – review & editing, Visualization, Conceptualization, Methodology, Validation, Investigation.
Funding
The author(s) declare that no financial support was received for the research and/or publication of this article.
Conflict of interest
The author declares no potential conflicts of interest with respect to the research, authorship, and/or publication of this article.
Generative AI statement
The author(s) declare that no Gen AI was used in the creation of this manuscript.
Any alternative text (alt text) provided alongside figures in this article has been generated by Frontiers with the support of artificial intelligence and reasonable efforts have been made to ensure accuracy, including review by the authors wherever possible. If you identify any issues, please contact us.
Publisher’s note
All claims expressed in this article are solely those of the authors and do not necessarily represent those of their affiliated organizations, or those of the publisher, the editors and the reviewers. Any product that may be evaluated in this article, or claim that may be made by its manufacturer, is not guaranteed or endorsed by the publisher.
Footnotes
1.^ U.S. Census Bureau, QuickFacts: Arkansas. Owner-occupied housing unit rate, 2019-2023 ACS 5-year estimates. https://www.census.gov/quickfacts/fact/table/AR/PST040223.
2.^ U.S. Census Bureau, QuickFacts: Illinois. Owner-occupied housing unit rate, 2019–2023 ACS 5-year estimates. https://www.census.gov/quickfacts/fact/table/IL/RHI125223.
3.^ U.S. Census Bureau, QuickFacts: Indiana. Owner-occupied housing unit rate, 2019-2023 ACS 5-year estimates. https://www.census.gov/quickfacts/fact/table/IN/PST040223.
4.^ U.S. Census Bureau, QuickFacts: Kentucky. Owner-occupied housing unit rate, 2019-2023 ACS 5-year estimates. https://www.census.gov/quickfacts/fact/table/KY/RHI325223.
5.^ U.S. Census Bureau, QuickFacts: Mississippi. Owner-occupied housing unit rate, 2019-2023 ACS 5-year estimates. https://www.census.gov/quickfacts/fact/table/MS/IPE120223.
6.^ U.S. Census Bureau, QuickFacts: Missouri. Owner-occupied housing unit rate, 2019-2023 ACS 5-year estimates. https://www.census.gov/quickfacts/fact/table/MO/AGE135223.
7.^ U.S. Census Bureau, QuickFacts: Tennessee. Owner-occupied housing unit rate, 2019-2023 ACS 5-year estimates. https://www.census.gov/quickfacts/fact/table/TN/PST045223.
References
1
Aitsi-Selmi A. Egawa S. Sasaki H. Wannous C. Murray V. (2015). The sendai framework for disaster risk reduction: Renewing the global commitment to people's resilience, health, and well-being. Int. J. Disast. Risk Sci. 6, 164–176. 10.1007/s13753-015-0050-9
2
Angrist J. D. Pischke J.-S. (2009). Mostly Harmless Econometrics: An Empiricist's Companion. Princeton: Princeton University Press.
3
Ao Y. Tan L. Tan L. Zhong J. Zhang H. Wang Y. et al . (2022). House holds' earthquake disaster preparedness behavior: the role of trust in and help from stakeholders. Front. Environ. Sci. 10:926432. 10.3389/fenvs.2022.926432
4
Arlikatti S. Maghelal P. Agnimitra N. Chatterjee V. (2018). Should i stay or should i go? mitigation strategies for flash flooding in india. Int. J. Disast. Risk Reduct. 27, 48–56. 10.1016/j.ijdrr.2017.09.019
5
Becker J. S. Paton D. Johnston D. M. Ronan K. R. (2012). A model of household preparedness for earthquakes: how individuals make meaning of earthquake information and how this influences preparedness. Natural Hazards64, 107–137. 10.1007/s11069-012-0238-x
6
Becker J. S. Paton D. Johnston D. M. Ronan K. R. McClure J. (2017). The role of prior experience in informing and motivating earthquake preparedness. Int. J. Disast. Risk Reduct. 22:179–193. 10.1016/j.ijdrr.2017.03.006
7
Bethlehem J. (2010). Selection bias in web surveys. Int. Statist. Rev. 78, 161–188. 10.1111/j.1751-5823.2010.00112.x
8
Bonfanti R. C. Oberti B. Ravazzoli E. Rinaldi A. Ruggieri S. Schimmenti A. (2023). The role of trust in disaster risk reduction: a critical review. Int. J. Environ. Res. Public Health21:29. 10.3390/ijerph21010029
9
Breusch T. S. Pagan A. R. (1979). A simple test for heteroscedasticity and random coefficient variation. Econometrica47, 1287–1294. 10.2307/1911963
10
Bronfman N. C. Cisternas P. C. López-Vázquez E. Cifuentes L. A. (2016). Trust and risk perception of natural hazards: Implications for risk preparedness in chile. Natural Hazards81, 307–327. 10.1007/s11069-015-2080-4
11
Buchinsky M. (1994). Changes in the us wage structure 1963-1987: application of quantile regression. Econometrica62, 405–458. 10.2307/2951618
12
Cade B. S. Noon B. R. (2003). A gentle introduction to quantile regression for ecologists. Front. Ecol. Environ. 1, 412–420. 10.1890/1540-9295(2003)001[0412:AGITQR]2.0.CO;2
13
California Earthquake Authority (2017). Napa Research Findings Reveal Many Homeowners Lack Understanding Of Seismic Retrofitting, Earthquake Insurance Options. Sacramento, CA: California Earthquake Authority.
14
Cho E. (2016). Making reliability reliable: A systematic approach to reliability coefficients. Organ. Res. Methods19, 651–682. 10.1177/1094428116656239
15
Cronbach L. J. (1951). Coefficient alpha and the internal structure of tests. Psychometrika16, 297–334. 10.1007/BF02310555
16
Csontos R. Van Arsdale R. Cox R. Waldron B. (2008). Reelfoot rift and its impact on quaternary deformation in the central mississippi river valley. Geosphere4, 145–158. 10.1130/GES00107.1
17
CUSEC (2024). “New madrid seismic zone catastrophic planning project,” in Central U.S. Earthquake Consortium (Memphis, TN: Central United States Earthquake Consortium (CUSEC)).
18
Earthquake Country Alliance (2024). Step 5: Improve Safety. Los Angeles, CA: Earthquake Country Alliance.
19
Encyclopaedia Britannica (2024). New Madrid Seismic Zone. Chicago: Encyclopaedia Britannica.
20
Ervin C. P. McGinnis L. (1975). Reelfoot rift: Reactivated precursor to the mississippi embayment. Geol. Soc. Am. Bull. 86, 1287–1295.
21
Faryabi R. Rezabeigi Davarani F. Daneshi S. Moran D. P. (2023). Investigating the effectiveness of protection motivation theory in predicting behaviors relating to natural disasters, in the households of southern iran. Front. Public Health11:1201195. 10.3389/fpubh.2023.1201195
22
Feinman J. M. (2019). “The protection gap in homeowners insurance: An introduction,” in Rutgers Law School Research Paper. Amsterdam: Elsevier B.V.
23
FEMA (2024a). Earthquake Risk Management for Emergency Managers. Washington, D.C.: Federal Emergency Management Agency.
24
FEMA (2024b). Research and Resources for Emergency Managers: Preparedness Activities and Webinars. Washington, D.C.: Federal Emergency Management Agency.
25
Firpo S. Fortin N. M. Lemieux T. (2009). Unconditional quantile regressions. Econometrica77, 953–973. 10.3982/ECTA6822
26
Gamboa-Maldonado T. Marshak H. H. Sinclair R. Montgomery S. Dyjack D. T. (2012). Building capacity for community disaster preparedness: a call for collaboration between public environmental health and emergency preparedness and response programs. J. Environ. Health75:24.
27
Greer A. (2012). Earthquake preparedness and response: Comparison of the united states and japan. Leadersh. Managem. Eng. 12, 111–125. 10.1061/(ASCE)LM.1943-5630.0000179
28
Grollimund B. Zoback M. D. (2001). Did deglaciation trigger intraplate seismicity in the new madrid seismic zone?Geology29, 175–178.
29
Grozdanić G. Cvetković V. M. Lukić T. Ivanov A. (2024). Sustainable earthquake preparedness: a cross-cultural comparative analysis in montenegro, north macedonia, and serbia. Sustainability16:3138. 10.3390/su16083138
30
Hao L. Naiman D. Q. (2007). Quantile Regression. Cambridge, MA: Sage.
31
Hildenbrand T. G. Langenheim V. E. Schweig E. Stauffer P. H. Hendley J. W. II. (1996). “Uncovering hidden hazards in the Mississippi valley,” in Technical Report (Reston, VA: U.S. Geological Survey).
32
Houston J. B. Croy L. Czajkowski J. Groshong L. (2022). “Addressing the new madrid seismic zone earthquake protection gap: Insights into homeowners and renters earthquake insurance uptake from comprehensive primary data,” in CIPR Research Report, National Association of Insurance Commissioners [Kansas City, MO: National Association of Insurance Commissioners, Center for Insurance Policy and Research (NAIC CIPR)].
33
IEMA (2024). Earthquake Preparedness: New Madrid Seismic Zone. Springfield, IL: Illinois Emergency Management Agency.
34
International Association of Insurance Supervisors (2023). “A call to action: The role of insurance supervisors in addressing natural catastrophe protection gaps,” in IAIS Report (Basel: IAIS).
35
Jahangiri K. Izadkhah Y. O. Montazeri A. Hosseini M. (2010). People's perspectives and expectations on preparedness against earthquakes: Tehran case study. J. Injury Viol. Res. 2:85. 10.5249/jivr.v2i2.25
36
Joffe H. Perez-Fuentes G. Potts H. W. Rossetto T. (2016). How to increase earthquake and home fire preparedness: the fix-it intervention. Natural Hazards84, 1943–1965. 10.1007/s11069-016-2528-1
37
Koenker R. (2005). Quantile Regression. Cambridge: Cambridge University Press.
38
Koenker R. Bassett Jr G. (1978). Regression quantiles. Econometrica1978, 33–50. 10.2307/1913643
39
Koenker R. Hallock K. F. (2001). Quantile regression. J. Econ. Perspect. 15, 143–156. 10.1257/jep.15.4.143
40
Koenker R. Machado J. A. (1999). Goodness of fit and related inference processes for quantile regression. J. Am. Stat. Assoc. 94, 1296–1310. 10.1080/01621459.1999.10473882
41
Koenker R. Xiao Z. (2002). Inference on the quantile regression process. Econometrica70, 1583–1612. 10.1111/1468-0262.00342
42
Korn E. L. Graubard B. I. (2011). Analysis of Health Surveys. Minneapolis, MN: John Wiley & Sons.
43
Lindell M. K. Perry R. W. (2012). The protective action decision model: Theoretical modifications and additional evidence. Risk Analysis32, 616–632. 10.1111/j.1539-6924.2011.01647.x
44
Lohr S. L. (2021). Sampling: Design and Analysis. London: Chapman and Hall/CRC.
45
Martin J. R. I. (2024). “Earthquake emergency management: session 10 – preparedness,” in FEMA Training Resources [Emmitsburg, MD: Federal Emergency Management Agency (FEMA), Emergency Management Institute (EMI)].
46
McBride S. K. Becker J. S. Johnston D. M. (2019). Exploring the barriers for people taking protective actions during the 2012 and 2015 new zealand shakeout drills. Int. J. Disast. Risk Reduct. 37:101150. 10.1016/j.ijdrr.2019.101150
47
McClure J. Doyle E. E. Velluppillai J. M. (2015a). A tale of two cities: Judgments about earthquake and aftershock probabilities across time windows. Int. J. Disast. Risk Reduct. 14, 15–26. 10.1016/j.ijdrr.2014.11.010
48
McClure J. Spittal M. J. Fischer R. Charleson A. (2015b). Why do people take fewer damage mitigation actions than survival actions? Other factors outweigh cost. Nat. Hazards Rev. 16:04014018. 10.1061/(ASCE)NH.1527-6996.0000152
49
Missouri Department of Natural Resources (2024). Facts About the New Madrid Seismic Zone. Missouri: Missouri Department of Natural Resources.
50
Miyamoto H. K. Nielsen O. Saberi O. Licciardi G. (2023). Lessons in Resilience: A Year of Global Earthquakes. Dublin: PreventionWeb.
51
Occupational Safety and Health Administration (OSHA) (2024). “Earthquake preparedness and response resources,” in Occupational Safety and Health Administration [Washington, DC: Occupational Safety and Health Administration (U.S. Department of Labor)].
52
Paton D. (2008). Community Resilience: Integrating Individual, Community and Societal Perspectives. New York, NY: Nova Science Publishers.
53
Paton D. (2019). Disaster risk reduction: Psychological perspectives on preparedness. Aust. J. Psychol. 71, 327–341. 10.1111/ajpy.12237
54
Paton D. Johnston D. (2001). Disasters and communities: vulnerability, resilience and preparedness. Disast. Prevent. Managem: Int. J. 10, 270–277. 10.1108/EUM0000000005930
55
Paton D. Johnston D. (2017). Disaster Resilience: An Integrated Approach. Springfield, IL: Charles C Thomas Publisher.
56
Paton D. Johnston D. Mamula-Seadon L. Kenney C. M. (2014). “Recovery and development: perspectives from new Zealand and Australia,” in Disaster and Development: Examining Global Issues and Cases (Cham: Springer), 255–272.
57
Paton D. Smith L. Johnston D. (2005). When good intentions turn bad: Promoting natural hazard preparedness. Austral. J. Emerg. Managem. 20, 25–30. Available online at: https://search.informit.org/doi/abs/10.3316/INFORMIT.085971936598500
58
Pothon A. Gueguen P. Buisine S. Bard P.-Y. (2019). California earthquake insurance unpopularity: the issue is the price, not the risk perception. Nat. Hazards Earth Syst. Sci. 19, 1909–1924. 10.5194/nhess-19-1909-2019
59
Rabinovici S. Deierlein G. G„ Welch, D. P. (2020). PEER–CEA Project Working Group 1 Resources Review: A Working Document for the “Quantifying the Performance of Retrofit of Cripple Walls and Sill Anchorage in Single-Family Wood-Frame Buildings” Project. Working Document. Berkeley: Pacific Earthquake Engineering Research Center. Available online at: https://peer.berkeley.edu/sites/default/files/wg1_resourcesproject-doc_rabinovici.pdf
60
Rezabeigi Davarani E. Nekoei-Moghadam M. Khanjani N. Iranpour A. Chashmyazdan M. Farahmandnia H. (2023). Factors related to earthquake preparedness of households based on social-cognitive theory constructs: a systematic review. Front. Public Health11:987418. 10.3389/fpubh.2023.987418
61
Rostami-Moez M. Rabiee-Yeganeh M. Shokouhi M. Dosti-Irani A. Rezapur-Shahkolai F. (2020). Earthquake preparedness of households and its predictors based on health belief model. BMC Public Health20, 1–8. 10.1186/s12889-020-08814-2
62
Scawthorn C. O'rourke T. Blackburn F. (2006a). The 1906 san francisco earthquake and fire-enduring lessons for fire protection and water supply. Earthquake Spectra22, 135–158. 10.1193/1.2186678
63
Scawthorn C. Schneider P. J. Schauer B. A. (2006b). Natural hazards-the multihazard approach. Nat. Hazards Rev. 7, 39–39. 10.1061/(ASCE)1527-6988(2006)7:2(39)
64
SEMA (2024). About the New Madrid Seismic Zone. Missouri: Missouri State Emergency Management Agency.
65
Shmueli D. F. Ozawa C. P. Kaufman S. (2021). Collaborative planning principles for disaster preparedness. Int. J. Disaster Risk Reduct. 52:101981. 10.1016/j.ijdrr.2020.101981
66
Shome N. (2024). “USGS 2023 national seismic hazard model update: Adopting a modern view of risk,” in Moody's RMS Insights. Vice President, Model Development [New York, NY: Moody's (Moody's Corporation)].
67
Shrestha M. S. Gurung M. B. Khadgi V. R. Wagle N. Banarjee S. Sherchan U. et al . (2021). The last mile: flood risk communication for better preparedness in Nepal. Int. J. Disast. Risk Reduct. 56:102118. 10.1016/j.ijdrr.2021.102118
68
Smith C. (2006). What San Francisco Didn't Learn From the ‘06 Quake. San Francisco: San Francisco Chronicle. Available online at: http://www.sfgate.com/homeandgarden/article/What-San-Francisco-didn-t-learn-from-the-06-quake-2520018. php (Accessed March 24, 2014).
69
Solberg C. Rossetto T. Joffe H. (2010). The social psychology of seismic hazard adjustment: re-evaluating the international literature. Nat. Hazards Earth Syst. Sci. 10:1663–1677. 10.5194/nhess-10-1663-2010
70
Stelzer C. (1999). On shaky ground. Riverfront Times December, 15. St. Louis, MO: Riverfront Times (St. Louis Riverfront Times).
71
Topal M. Başpinar A. Güntürkün M. (2024). Social-cognitive factors of individual earthquake preparedness behavior: a scale adaptation and correlational survey research. TRC J. Humanit. Action4:1. Available online at: https://trcjha.com/wp-content/uploads/2024/12/TRCJDHA_2023_0099.pdf
72
Tourangeau R. Yan T. (2007). Sensitive questions in surveys. Psychol. Bull. 133:859. 10.1037/0033-2909.133.5.859
73
Weerts A. Winsemius H. Verkade J. (2011). Estimation of predictive hydrological uncertainty using quantile regression: examples from the national flood forecasting system (england and wales). Hydrol. Earth Syst. Sci. 15, 255–265. 10.5194/hess-15-255-2011
74
Wein A. Potter S. Johal S. Doyle E. Becker J. (2016). Communicating with the public during an earthquake sequence: Improving communication of geoscience by coordinating roles. Seismol. Res. Letters87, 112–118. 10.1785/0220150113
75
White H. (1980). A heteroskedasticity-consistent covariance matrix estimator and a direct test for heteroskedasticity. Econometrica48, 817–838. 10.2307/1912934
Summary
Keywords
earthquake preparedness, New Madrid Seismic Zone, risk perception, community engagement, disaster resilience, earthquake awareness
Citation
Nkouaga F (2025) Beyond average preparedness: a quantile analysis of earthquake mitigation behaviors among homeowners. Front. Environ. Econ. 4:1658608. doi: 10.3389/frevc.2025.1658608
Received
18 July 2025
Accepted
08 September 2025
Published
28 October 2025
Volume
4 - 2025
Edited by
Indu Khurana, Hampden–Sydney College, United States
Reviewed by
BihChuan Lin, Dayeh University, Taiwan
José A. Lara-Pulido, Ibero American University, Mexico
Updates
Copyright
© 2025 Nkouaga.
This is an open-access article distributed under the terms of the Creative Commons Attribution License (CC BY). The use, distribution or reproduction in other forums is permitted, provided the original author(s) and the copyright owner(s) are credited and that the original publication in this journal is cited, in accordance with accepted academic practice. No use, distribution or reproduction is permitted which does not comply with these terms.
*Correspondence: Florent Nkouaga fnkouaga@gmail.com
Disclaimer
All claims expressed in this article are solely those of the authors and do not necessarily represent those of their affiliated organizations, or those of the publisher, the editors and the reviewers. Any product that may be evaluated in this article or claim that may be made by its manufacturer is not guaranteed or endorsed by the publisher.