 Jun Zhou
 Yajun Duan
 Sicheng Ding
- Key Laboratory of Ecosystem Carbon Source and Sink, China Meteorological Administration (ECSS-CMA), Jiangsu Key Laboratory of Agricultural and Ecological Meteorology, School of Ecology and Applied Meteorology, Nanjing University of Information Science and Technology, Nanjing, China
Introduction: The equipment manufacturing industry is a key source of industrial carbon emissions in China. To assess its environmental impact comprehensively, this study introduces the concept of carbon footprint pressure (ECFP) integrating both carbon sources and vegetation carbon sinks.
Methods: Based on provincial panel data from 2003 to 2020, the study combines LMDI decomposition, Tapio decoupling, and extended STIRPAT spatial econometric models to analyze temporal and spatial evolution patterns and influencing factors.
Results: The ECFP in China's equipment manufacturing industry shows an overall upward trend, spreading from coastal to inland provinces. Employment, economic expansion, and technological effects are key drivers. Some eastern regions achieve weak decoupling between economic growth and ECFP, while central and western regions show unstable coupling.
Discussion: Green technology innovation and industrial upgrading can mitigate ECFP both locally and across neighboring regions. The results provide a theoretical basis for regional emission reduction and coordinated low-carbon development.
1 Introduction
Global warming continues to be one of the most urgent environmental issues confronting the world. A key driver behind this crisis is the large-scale release of greenhouse gases, especially carbon dioxide. To tackle this, the international community adopted the Paris Agreement, setting ambitious goals to reduce emissions and keep global temperature rise well below 2 °C, with efforts to limit it to 1.5 °C (UNFCCC, 2016; Fan et al., 2022). Within this global push, the industrial sector—particularly the energy-intensive equipment manufacturing industry—has become a central focus for national-level mitigation strategies.
In 2021, China's energy consumption reached around 5.24 billion tons of standard coal equivalent, with the industrial sector alone accounting for roughly 65% of that figure (Li et al., 2021; Zhao et al., 2021). Among these industries, equipment manufacturing holds a critical position—it contributed 33.7% of the value added by large-scale industrial enterprises (Wang et al., 2021). The sector spans diverse areas such as machinery, electronics, and transportation equipment, supplying essential components that support a wide range of economic and technological activities. At the same time, however, it remains a major source of carbon emissions. Although its carbon intensity is relatively lower than that of some other manufacturing sectors, equipment manufacturing still contributes more than 10% of total manufacturing-related emissions (Fan and Du, 2018). As the sector continues to grow, its overall emissions are also rising steadily (Lu et al., 2022). This makes emission reduction in equipment manufacturing not only crucial for achieving national carbon neutrality targets, but also a valuable reference point for promoting decarbonization in other industrial sectors.
In addition to reducing carbon emissions from equipment manufacturing, consideration could be given to increasing the capacity of regional terrestrial vegetation to sequester carbon. Studies have been conducted to quantify the relationship between carbon emissions and the environment by converting carbon emissions into the amount of biologically productive land area needed to absorb those carbon emissions (Xuan and Yue, 2016; Chen B. et al., 2022). As a result, incorporating terrestrial vegetation's ability to sequester carbon into research on reducing carbon emissions can hasten the process of becoming carbon neutral (Fan et al., 2022; Gu et al., 2022).
At present, China's equipment manufacturing industry shows a spatial distribution of agglomeration, mainly concentrated in economically developed areas with a strong industrial base (An et al., 2023; Rong et al., 2020). These regions have high carbon emissions due to the concentration of equipment manufacturing companies and the large scale of production. Additionally, the ability of vegetation to sequester carbon varies depending on the location. Therefore, this study constructed the Equipment Manufacturing Carbon Footprint Pressure Index (ECFP) by comprehensively considering equipment manufacturing carbon emissions and regional vegetation carbon sequestration capacity. Through the study of the temporal and spatial evolution of ECFP and the factors influencing it, we can better understand the dynamic changes in the development of the equipment manufacturing industry, and allocate and adjust the specific carbon emission reduction responsibilities among different regions according to local conditions.
2 Literature review
A growing body of research has pointed out that carbon emissions tend to increase during the early phases of economic development. But interestingly, once a certain level of economic maturity is reached, emissions begin to decline—an observation that aligns with the Environmental Kuznets Curve hypothesis (Dong et al., 2018; Sinha and Shahbaz, 2018). In the manufacturing sector, Jin and Han (2021) highlighted that the main driver behind rising emissions is industrial value-added. Building on this, numerous studies have examined the decoupling of economic growth from carbon emissions, particularly in the context of China and other industrialized economies (Ren and Hu, 2012). The general consensus is clear: the ideal scenario is one where economic progress continues while emissions are brought under control (Wang and Zhang, 2021).
Among the many factors at play, energy consumption remains central (Li et al., 2021; Zhao et al., 2021). Feng et al. (2018) found that decreasing energy intensity has made a notable difference in cutting emissions in the metal industry. Technological innovation, too, has been widely regarded as an effective lever in reducing industrial carbon output (Wang et al., 2019; Shahbaz et al., 2020). However, not all innovation leads to greener outcomes. Some studies have flagged a paradox: certain technological advances boost the productivity of traditional factors, which can actually drive up energy and resource use—and with it, emissions (Huang et al., 2020; Zhang and Liu, 2022). Despite differences in focus and approach, most of the literature agrees that economic development, energy use, and innovation are key forces shaping carbon emissions.
As carbon sinks play an increasingly vital role in the path toward carbon neutrality, a number of researchers have started to factor vegetation-based carbon sequestration into emission reduction pressure indicators. Still, it's not easy to quantify the link between carbon emissions and vegetation sequestration, mainly due to pronounced differences in economic development levels and geographic features across regions (Yang et al., 2020). To address this complexity, Chen et al. (2020) introduced a carbon footprint pressure (CFP) index that incorporates vegetation carbon sequestration, using it to analyze CFP and its driving forces in 60 major countries. Building on that foundation, Huang et al. (2020) turned their attention to China, exploring CFP and its determinants using provincial-level data. More recently, Fan et al. (2022) applied the Tapio decoupling model alongside exponential decomposition analysis to examine the drivers and decoupling patterns of CFP in Chinese cities.
That said, there are still some blind spots in the literature. Most existing studies haven't delved into how carbon emissions interact with environmental factors across different industries. And importantly, few have considered the spatial spillover effects—both direct and indirect—of various drivers on CFP, whether in the short or long term. Filling these gaps could offer a deeper, more comprehensive picture of how carbon emission pressures evolve across sectors and space.
Therefore, the equipment manufacturing industry has been chosen as the research object for this study, uses the NPP data acquired by remote sensing satellites with accuracy, objectivity, and timeliness as the key index to measure the carbon sequestration capacity of vegetation, and from the perspective of carbon sources and sinks, incorporates the direct carbon emissions, indirect carbon emissions and carbon sequestration by vegetation in the equipment manufacturing industry into the framework of the analysis of carbon emission reduction drivers, constructs the ECFP and analyzes the factors affecting it. First, the LMDI method is used to decompose ECFP and quantify the specific contribution of carbon footprint pressure intensity (CFPI), output value per capita (AGDP), and number of people employed (EPOP) in equipment manufacturing to the change of ECFP. Next, using the Tapio model, the decoupling relationship between ECFP and the equipment manufacturing industry's economic development is examined. Finally, the extended STIRPAT model is constructed based on the LMDI decomposition results, and the spatial econometric model is applied to explore the role mechanisms of industrial output value (EGDP), scientific research investment (RD), industrial structure (IS), and energy intensity (EI) factors on the pressure of carbon footprint of equipment manufacturing. Examine each driver's direct and indirect effects on ECFP from a temporal and spatial perspective. The analysis will provide a theoretical basis for decision-makers to help better plan the regional ecological balance and the sustainable development of the equipment manufacturing industry.
3 Methods and data
This study constructs a comprehensive analytical framework comprising a sequential progression of the LMDI, Tapio decoupling model, and extended STIRPAT model. The LMDI model is first employed to factorize the ECFP, quantitatively identifying the contribution levels of key drivers such as technological progress, economic development, and employment changes during historical periods. This provides theoretical and empirical foundations for subsequent model variable selection and mechanism construction (Chen et al., 2020).
Building upon this foundation, the study extends its analysis along two dimensions: firstly, by integrating the core economic drivers identified by LMDI with ECFP, the Tapio decoupling model is applied to determine the state of coupling or decoupling between economic growth and environmental pressures, revealing their dynamic evolution patterns over time; Secondly, using the LMDI decomposition results as theoretical support, an extended STIRPAT model is constructed. Corresponding proxy variables (such as green patent counts representing technological effects) are selected to quantify the elastic impact of different factors on ECFP (Wolfram et al., 2016).
Furthermore, the extended STIRPAT model incorporates spatial econometric methods beyond traditional regression frameworks. This enables the simultaneous examination of both the direct effects of regional drivers and the spatial spillover effects from neighboring areas, thereby advancing the analysis from single-factor decomposition to a spatial interaction perspective. In summary, the methodological framework of this study follows a progressive logic encompassing factor identification, state diagnosis, and mechanism analysis. The LMDI model identifies the core driving factors, the Tapio model characterizes the coordination between economic and environmental outcomes, and the extended STIRPAT model provides a comprehensive analysis of the elasticity and spatial effects of each driver. As illustrated in Figure 1, these three components are interconnected, forming a layered and internally coherent analytical framework.
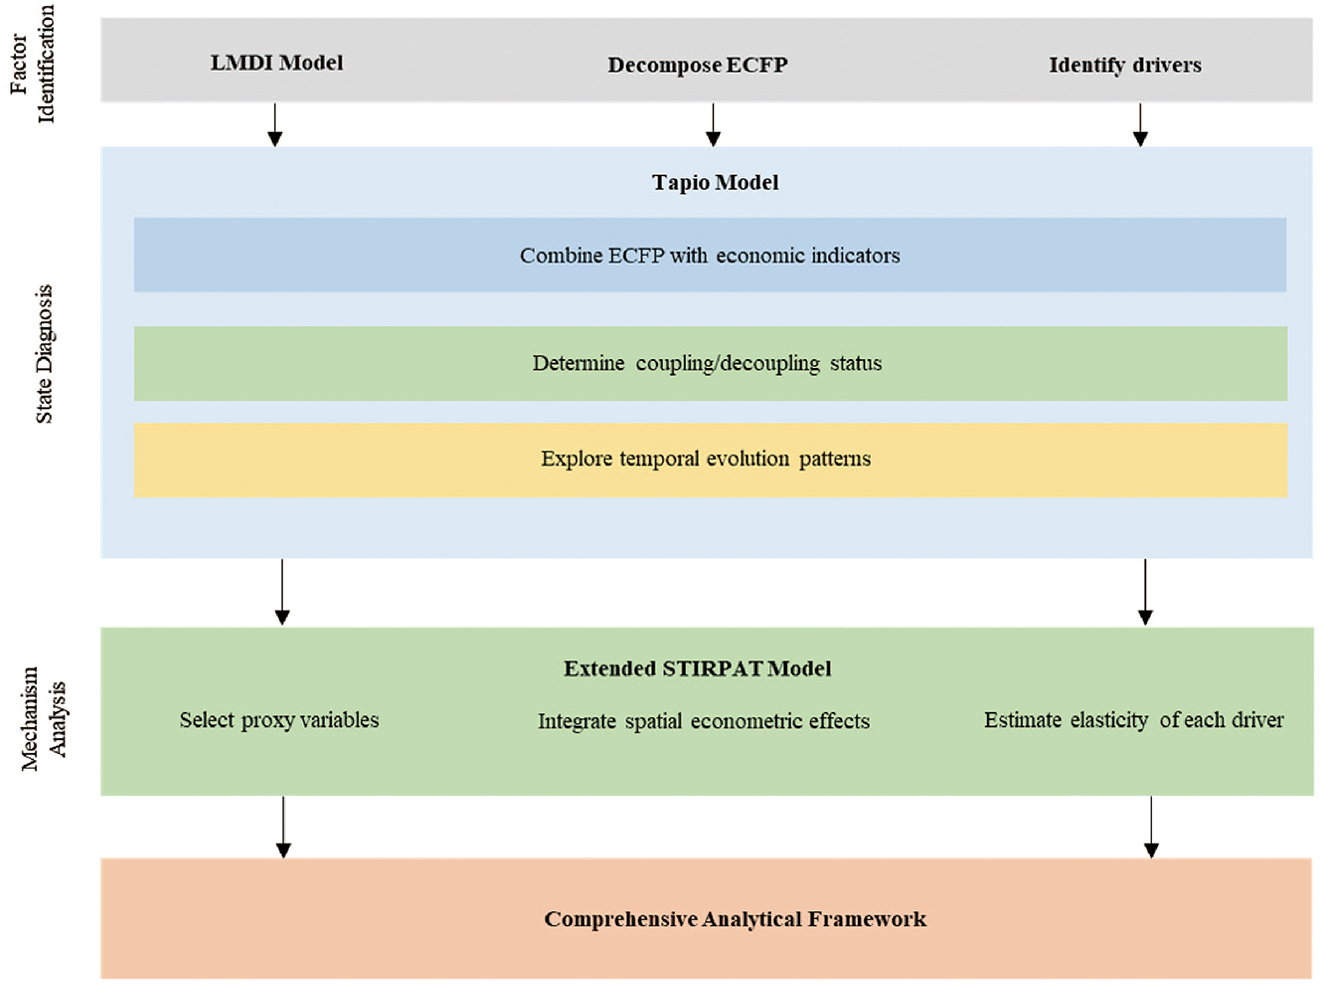
Figure 1. Analytical framework integrating the LMDI, Tapio, and extended STIRPAT models.
3.1 ECFP index construction
The ECFP is an index that uses the ratio of carbon sources to carbon sinks to represent the impact that local ecosystems are under from carbon emissions from equipment manufactured in the region (Su et al., 2013). According to Chen et al. (2020), the specific formula can be constructed as follows:
Where ECE is the carbon emissions from energy consumption of the regional equipment manufacturing industry in a certain period, including direct carbon emissions and indirect carbon emissions from electricity and heat, etc.; NPPE is the amount of carbon sequestered by the regional vegetation in a certain period calculated according to NPP. From an economic perspective, the ECFP indicator reflects the relative environmental pressure exerted by industrial carbon emissions on regional ecological carbon sink capacity. The numerator ECE denotes the carbon emission flow generated by the equipment manufacturing sector within economic activities; the denominator NPPE represents the carbon absorption capacity of regional ecosystems, manifested through carbon sequestration in agricultural and forest lands. Although NPPE encompasses both flow and stock characteristics, it comprehensively reflects the natural system's potential and dynamic equilibrium capacity to offset anthropogenic carbon emissions over a given period. Consequently, ECE/NPPE is not a simple physical ratio but an ecological efficiency indicator measuring the extent to which an economic system's carbon output utilizes the carbon absorption potential of ecosystems. A ratio exceeding 1 indicates industrial carbon emissions surpassing the regional ecosystem's carbon sink capacity, signaling unsustainable environmental pressure. Conversely, a lower ratio suggests relative equilibrium between economic activity and ecological carrying capacity.
3.2 Tapio decoupling model
The Tapio model is widely utilized in many industries because it can precisely estimate the decoupling state of a particular industry in a region at a given moment (Tapio, 2005). The relationship between ECFP and economic development is examined in this study using the Tapio model; the decoupling model is as follows:
where EV is the decoupling elasticity value, ΔP is the difference between the current ECFP and the previous ECFP, and P is the current ECFP; ΔD is the difference between the current EGDP and the previous EGDP, and D is the current EGDP.
3.3 LMDI model
The LMDI model is easy to use and has a wide range of applicability, and it is used in this study for the decomposition of factors affecting ECFP.
In Equation 4, CFPI is the carbon footprint pressure intensity of equipment manufacturing, which represents the technology effect; AGDP denotes the per capita output value of equipment manufacturing, which represents the economic effect; and EPOP denotes the effect of the number of people employed (Zhao et al., 2014; Wolfram et al., 2016).
ECFP changes can be expressed as follows:
ΔECFPi in the above equation represents the change in ECFP from year t to year b. In addition, ΔCFPIi, ΔAGDPi, and ΔEPOPi, represent the contribution of the above three factors to the change in ECFP.
Each effect can be expressed as follows:
3.4 STIRPAT model
STIRPAT was developed by Dietz and Rosa by improving the IPAT model proposed by Ehrlich and Holdren (York et al., 2003), which not only solves the shortcoming of IPAT model's single elasticity, but also has better scalability, and the constant term and error term further improve the reliability (Wang and Zhang, 2021). Its specific expression is as follows:
where I denotes people's impact on the environment, P is the population size; A is the level of affluence; T denotes the level of technology; a is a constant term, b, c, and d are the parameter coefficients of P, A, and T, and ε is the error term.
For ease of analysis, Equation 9 is taken logarithmically to obtain Equation 10 as follows:
Due to the better extensibility of the model, based on the decomposition of the LMDI model, five factors, namely, the number of employees (EPOP), industrial structure (IS), energy intensity (EI), and research investment (RD), are selected to construct the extended STIRPAT model. The expressions are as follows:
Where ECFP is the carbon footprint pressure of China's equipment manufacturing; a denotes the model coefficient; ε denotes the error; b1, b2, b3, and b4 are the elasticity coefficients, which indicate that under the premise of the other variables remaining unchanged, every 1% change in EPOP, IS, EI, and RD will cause b1%, b2%, b3%, and b4% changes in ECFP, respectively.
3.5 Construction of spatial weight matrices
Based on the provinces' latitude and longitude, a geographic distance matrix was created for this study W1. The provinces' connection is influenced by economic growth in addition to distance. Therefore, an economic matrix based on economic development, W2, and two geo-economic spatial matrices, W3 and W4, were constructed, and the general form of these four matrices is as follows:
3.6 Exploratory spatial data analysis
3.6.1 Global Moran's I index
The global Moran's I index is a widely used metric for assessing spatial autocorrelation, offering a broad view of how values relate to one another across the entire study area. Rather than focusing on local patterns, it captures the overall spatial structure. The index ranges from −1 to 1: a positive value suggests that similar values tend to cluster together (positive spatial autocorrelation), while a negative value points to spatial clustering of dissimilar values (negative spatial autocorrelation). When the value is close to zero, it generally indicates a lack of spatial correlation, implying a more random distribution. The formula for Moran's I is defined as follows:
3.6.2 Local Moran's I index
The local Moran's I index, which breaks down the global Moran's I into local components, helps measure how much a given region correlates spatially with its neighbors. It's useful for spotting local clusters as well as spatial outliers across the study area. The formula for calculating this index is as follows:
3.7 Spatial econometric models
The Spatial Lag Model (SLM), Spatial Error Model (SEM), and Spatial Durbin Model (SDM) have become standard tools in the econometric analysis of spatial data. Among them, the Spatial Autoregressive (SAR) model—mainly designed to capture the effects of spatially lagged dependent variables—is essentially a simplified form of the SLM (Elhorst, 2014). The SEM, on the other hand, shifts attention to spatial autocorrelation in the error terms, making it particularly useful when spatial dependence arises from factors that are unobserved or omitted. The SDM goes a step further by introducing spatial lags for both dependent and explanatory variables. Simply put, it doesn't just account for the influence of neighboring outcomes; it also allows explanatory variables from surrounding units to shape the dependent variable (Lee and Yu, 2010). These relationships are typically represented using the following model equations:
ρ is the spatial autoregressive coefficient, W is the spatial weight matrix, y is the dependent variable, X is the explanatory variable, β is the coefficient of the explanatory variable, and ϵ is the error term. λ is the coefficient of the spatial error, and θ is the coefficient of the spatial lag term of the explanatory variable.
The static Spatial Durbin Model (SDM), while useful for capturing spatial dependencies, falls short when it comes to evaluating short-term effects over time. Specifically, it does not account for the time-lagged influence that independent variables might have on the dependent variable (Anselin, 2001). To overcome this limitation, the Dynamic Spatial Durbin Model (DSDM) builds on the static version by introducing a temporal component. This addition enables the model to track both spatial and temporal spillover effects, offering a more complete view of dynamic spatial processes. The general form of the model is given below:
Yt − 1 is the time lag term of the dependent variable, α is the coefficient of the time lag term, and the other signs are the same as in the SDM model
3.8 Data sources
In accordance with the Industrial Classification for National Economic Activities (GB/T 4754-2017) issued by the National Bureau of Statistics of China (2017), the equipment manufacturing industry comprises the following major subsectors: metal products, general equipment manufacturing, special equipment manufacturing, automobile manufacturing, railway, shipbuilding, aerospace and other transportation equipment manufacturing, electrical machinery and equipment manufacturing, computer, communication and other electronic equipment manufacturing, and instrumentation manufacturing.
To maintain data consistency and avoid missing values, this study excludes Hong Kong, Macao, Taiwan, and Tibet. The analysis is based on panel data from 30 provinces in mainland China, spanning 2003 to 2020, with a particular focus on the equipment manufacturing industry. Economic development is represented by the industrial output value of the equipment manufacturing sector in each region. The level of green technological innovation is gauged by the number of green patents granted per province. Energy intensity is calculated as the amount of energy consumed for each unit of industrial output produced by the sector. As for industrial structure, it's reflected in the share of equipment manufacturing output relative to the total manufacturing output within the region. The intensity of scientific and technological input is captured by the ratio of R&D and testing investment to provincial GDP.
Carbon emissions data come from the China Carbon Emission Accounts and Datasets (CEADs; Shan et al., 2018, 2020), while the remaining indicators are drawn from various editions of the China Statistical Yearbook. To improve comparability across time, all monetary data are adjusted to constant 2002 prices. Moreover, logarithmic transformation is applied to all variables to help address potential heteroscedasticity.
4 Results and discussion
4.1 Characterization of the spatial and temporal evolution of the ECFP
As shown in Figure 2, the national ECFP is trending upward generally, rising from 0.0109 in 2003 to 0.0256 in 2020, with a 3.38% yearly average growth rate. It has mostly grown rapidly in the early stages and then leveled off gradually in the latter stages, which is in line with the trajectory of China's general pressure on its carbon footprint (Xia et al., 2024). From 2003 to 2011, ECFP grew by 95.98%; from 2011 to 2020, ECFP growth slowed down, mainly showing a fluctuating upward trend, peaking in 2020 (CFP = 0.0256) with a growth rate of only 19.50%. The annual growth of the national ECFP is mainly attributed to the growth of developed provinces such as Tianjin, Shanghai, and Jiangsu. In contrast, developing regions such as Jiangxi and Guizhou had smaller changes in ECFP, slowing down the growth rate. This finding is similar to that of Chen et al. Differences in ECFP growth among provinces and cities reflect differences in the degree of economic development and industrialization in each region.
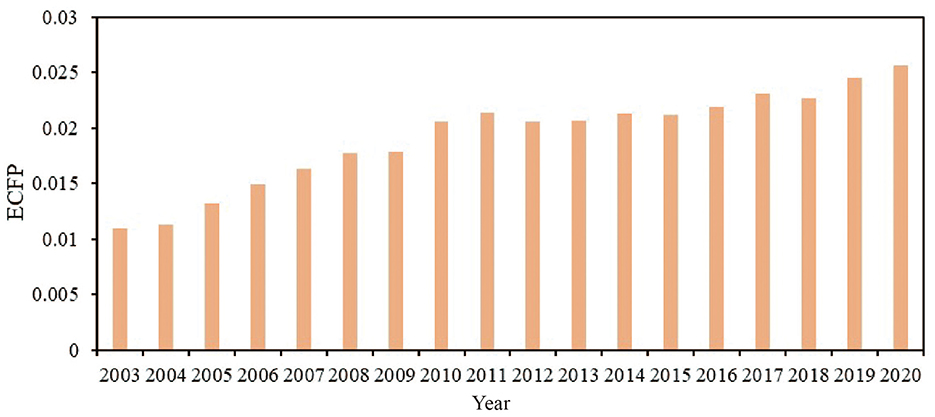
Figure 2. Carbon footprint pressure of national exzaquipment manufacturing industry 2003–2020.
Due to the differences in natural resource endowment and development policies in each province, the spatial and temporal characteristics of ECFP also differ. The spatial distribution characteristics of ECFP in each province in 2003, 2005, 2010, 2015, and 2020 are shown in Figure 3. As illustrated in Figure 3, provinces with high ECFP are mainly concentrated in the southeastern coastal region, and gradually tend to radiate to the central part of the country. The provinces with the largest cumulative ECFP from 2003 to 2020 are Beijing, Tianjin, Shanghai, Jiangsu, and Shandong, which are mainly manufacturing industries and have a higher proportion of equipment manufacturing industries. Most of the provinces with ECFP values lower than the national average are located in the southwest and northwest regions, such as Guizhou, Gansu, Qinghai, and Yunnan. The economic growth of these regions is mainly dominated by primary industry and service industry, so the carbon emission from equipment manufacturing is less than in other provinces, at the same time, these regions are rich in forests and other resources, and their carbon sequestration capacity is stronger than that of other provinces, so the ECFP in these regions is small.
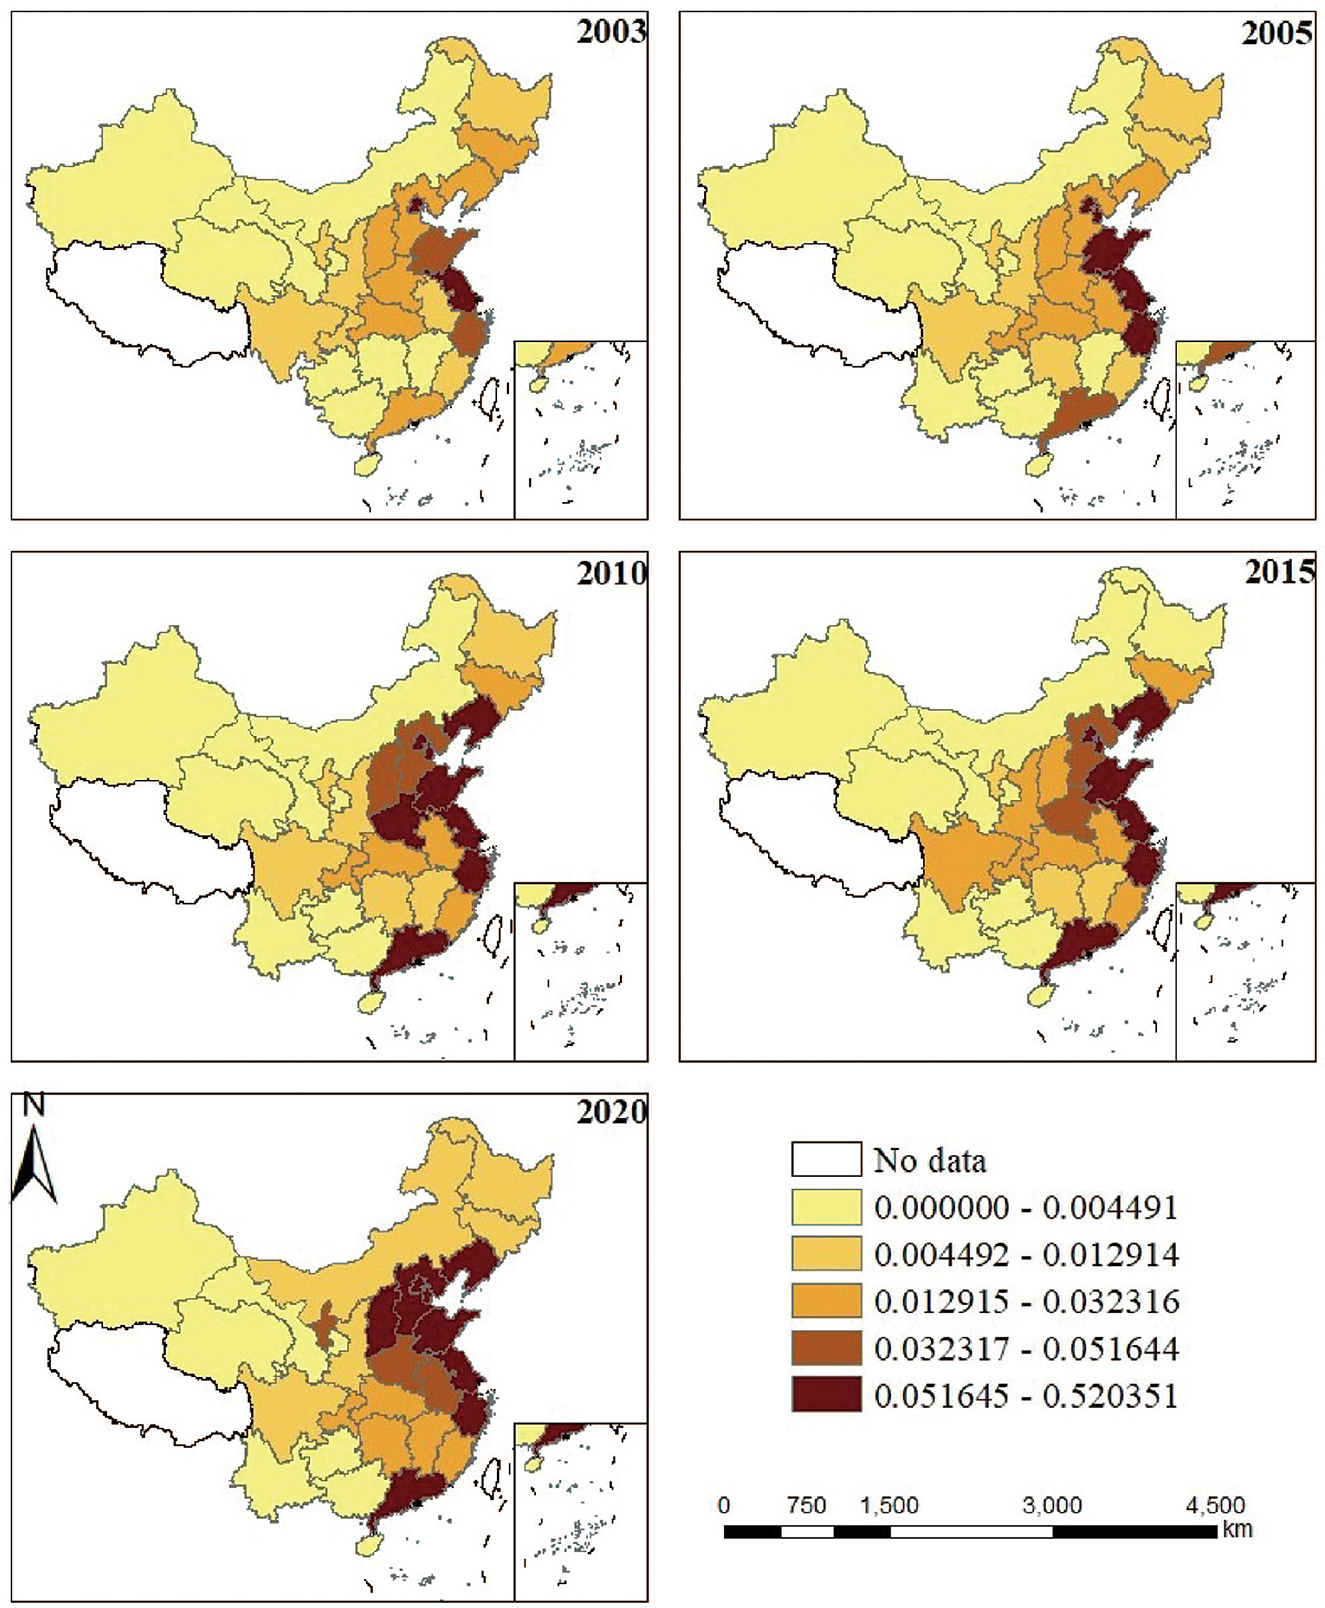
Figure 3. Spatial distribution characteristics of carbon footprint pressure on equipment manufacturing industry in 30 provinces and regions of China, 2003–2020.
To get a better grasp of how equipment manufacturing carbon footprint pressure (ECFP) clusters across space, this study calculates Moran's I index for 30 Chinese provinces and constructs Moran scatter plots across multiple years. As shown in Figure 4, most provinces fall into the first and third quadrants of the scatterplots—pointing to a distinct spatial clustering pattern. The first quadrant highlights provinces like Shandong, Jiangsu, and Shanghai, where high ECFP levels tend to be surrounded by similarly high levels in neighboring regions. Meanwhile, the third quadrant captures areas such as Yunnan, Qinghai, and Gansu, which exhibit relatively low ECFP values and are also bordered by provinces with similarly low emissions.
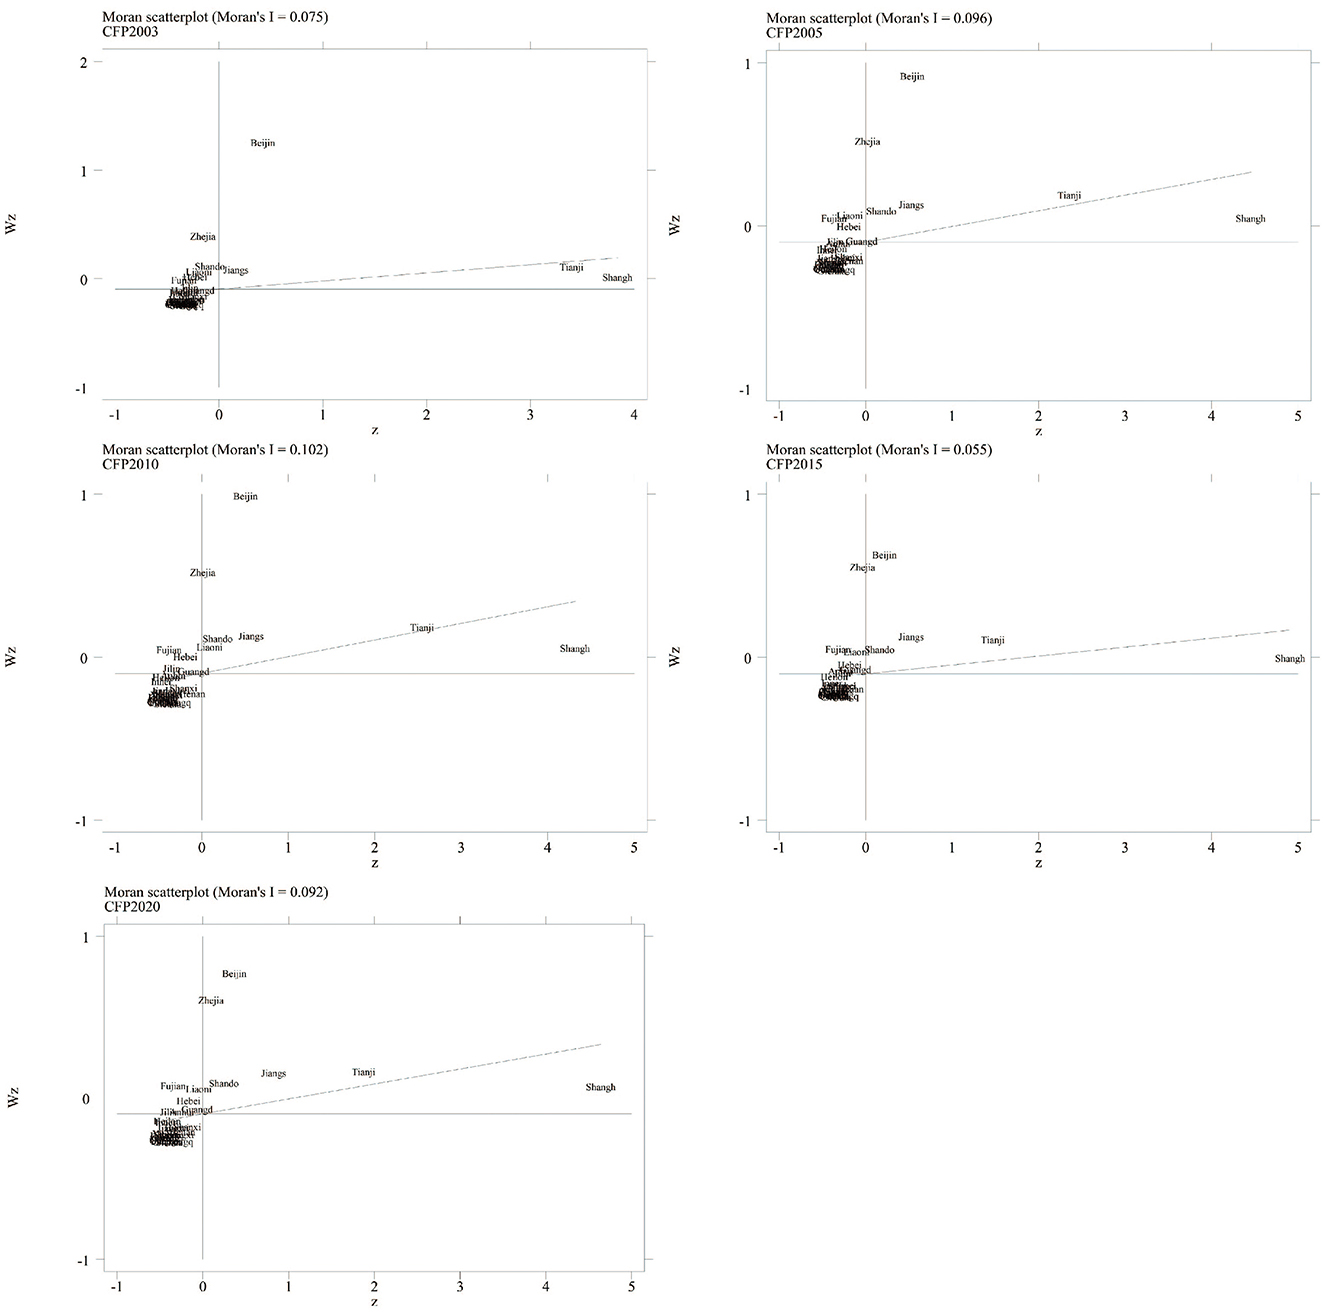
Figure 4. Moran scatter plot of carbon footprint pressure of equipment manufacturing industry in Chinese regions, 2003–2020.
As illustrated in Figure 5, this study charts the trajectory of the carbon footprint center of gravity within China's equipment manufacturing sector, visually presenting the evolution of the industry's carbon footprint pressure space across five representative years: 2003, 2005, 2010, 2015, and 2020. Based on ArcGIS spatial analysis, the geographical coordinates for each phase of the ECFP were calculated, and the migration distance between consecutive years was determined. Results indicate that between 2003 and 2020, the ECFP's center of gravity migrated approximately 235.7 kilometers, with an average annual migration rate of 13.9 kilometers per year. Its trajectory exhibited a phased pattern of eastward, southward, and westward shifts. From 2003 to 2010, the center of gravity shifted approximately 128.4 kilometers southeastward from southern Shandong to northern Jiangsu, reflecting the rapid expansion of equipment manufacturing in eastern coastal provinces. Between 2010 and 2015, it moved southward by roughly 64.3 kilometers, primarily driven by industrial upgrading and energy efficiency improvements in the Yangtze River Delta region. From 2015 to 2020, the center of gravity exhibited a slight westward shift of approximately 43.0 kilometers, corresponding to the accelerated rise of central provinces such as Anhui and Henan under industrial transfer and regional coordination policies. Overall, the migration of the equipment manufacturing industry's center of gravity reflects a dynamic spatial rebalancing process shaped by industrial structural disparities, technological progress, and policy orientation. This indicates that China's equipment manufacturing sector is transitioning from coastal concentration toward regional diversification.
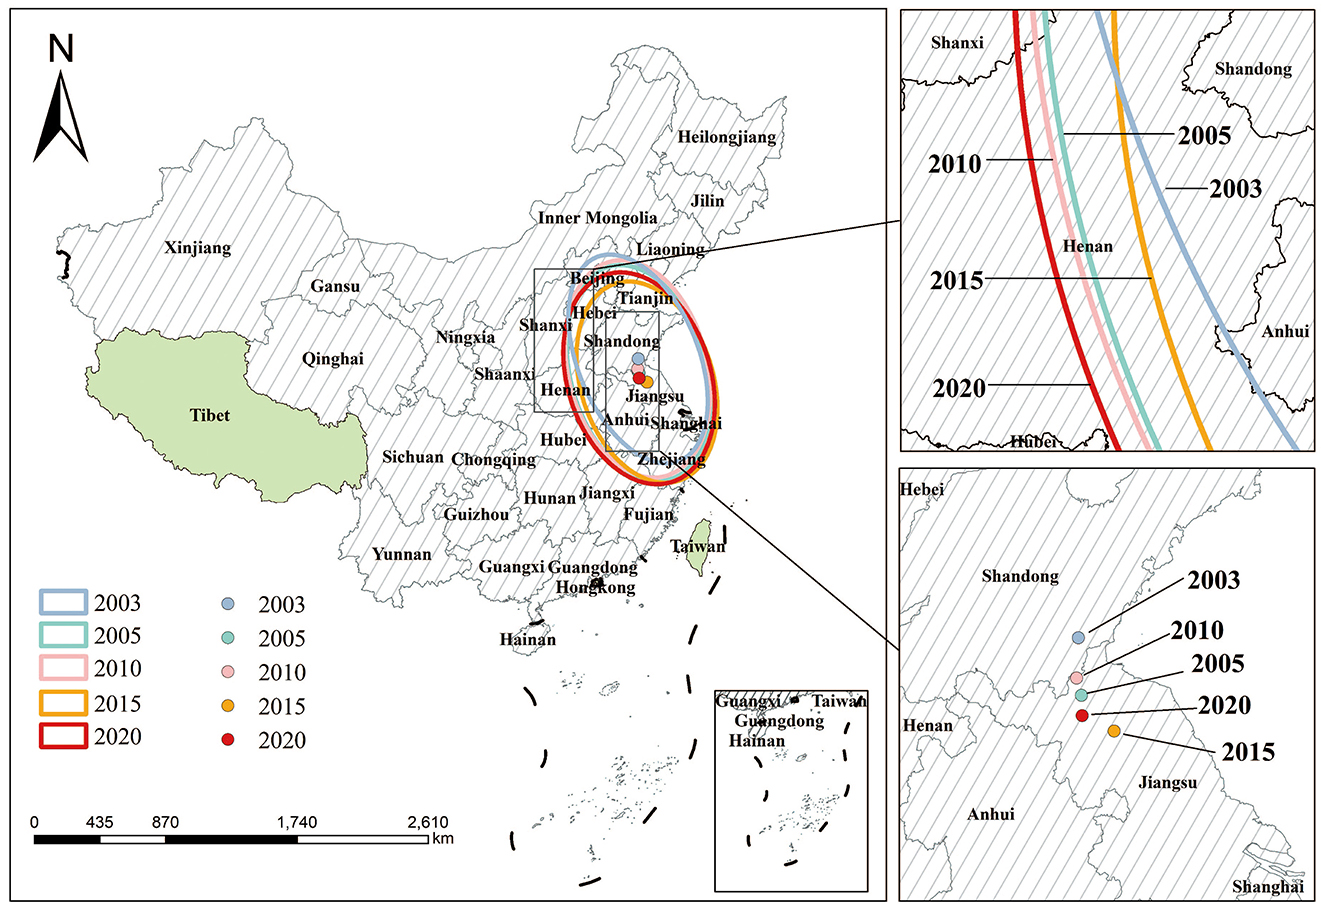
Figure 5. Evolutionary trend of carbon footprint pressure on equipment manufacturing industry in China, 2003–2020.
4.2 Decomposition analysis of ECFP influencing factors
As illustrated in Figure 6, between 2003 and 2020, variations in economic growth rates exceeding the national average were predominantly concentrated in the developed eastern coastal provinces such as Jiangsu, Shanghai, Shandong, and Zhejiang, with relatively minor fluctuations observed in other regions. This pattern reflects China's early implementation of an eastern-region priority development strategy, which propelled rapid industrialization in the economically advanced coastal areas. Figure 6 presents representative provinces rather than all 30 provinces because these selected regions exhibit distinct differences in economic development level, industrial structure, and technological progress, allowing for a clearer comparison of the driving mechanisms behind ECFP changes. Including all provinces would make the figure overly complex and reduce the clarity of interprovincial differences.
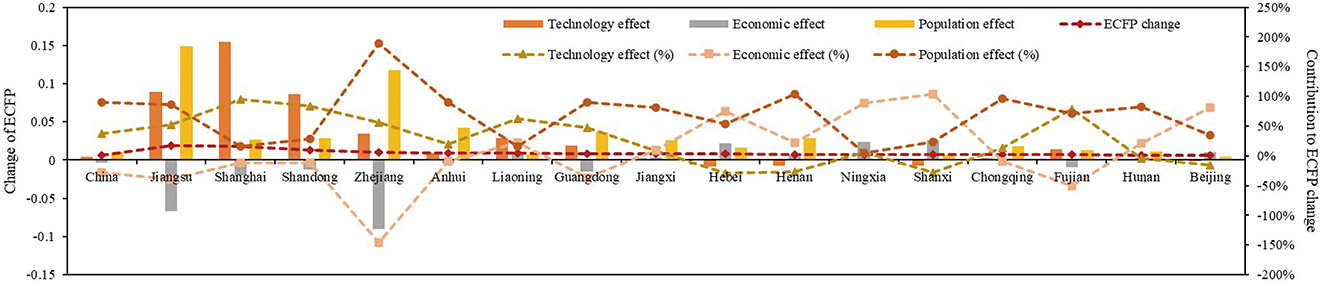
Figure 6. Contributions of driving factors to ECFP change in sample provinces from 2003 to 2020.
Number of Practitioners Effect (ΔEPOP): The contribution of EPOP to ECFP is generally high. For example, in 2003–2004 (125.21%) and 2006–2007 (165.25%). However, from 2003 to 2020, the overall EPOP contribution to the change in ECFP fluctuated and decreased, mainly contributing to ECFP. China's industrial reform, which outlawed high-polluting industries and vigorously developed equipment manufacturing and other high-tech enterprises, led to the expansion of the industry's scale and the expansion of the size of the number of employees, which is the main reason for the larger contribution to ECFP.
Economic effect (ΔAGDP): The contribution of AGDP to ECFP fluctuates considerably. AGDP contributed up to 297.71% to ECFP in 2010–2011, while in 2008–2009 it was −1896.85%. However, from 2003 to 2020, economic development mainly contributed positively to ECFP changes, i.e., economic development led to the increase of ECFP. Among the provinces and cities, the economically developed provinces such as Jiangsu, Shanghai, and Shandong, AGDP promotes the decline of ECFP, which is in line with the environmental Kuznets hypothesis (Brajer et al., 2011), i.e., as AGDP increases, ECFP rises first and then falls. For most provinces with developing economies, the development of equipment manufacturing destroys the local ecological environment due to backward technology and other reasons, leading to a continuous rise in ECFP.
Technology effect (ΔCFPI): changes in CFPI contributed more to ECFP in most of the years. For example, in 2015–2016 and 2016–2017, CFPI contributed 120.45% and 145.44% to ECFP, respectively. In most provinces and cities, CFPI has a significant positive contribution to ECFP changes. For example, Shanghai (95.68%), Shandong (83.50%), Jiangsu (52.13%), and other provinces and cities have very high CFPI contribution rates. In some provinces and cities, CFPI contributes negatively to ECFP changes, but the absolute value is large. For example, Hubei (−123.73%), Gansu (−100%), and so on. This is mainly because the equipment manufacturing industry, as a high-tech industry, gives priority to the optimization of processes and the selection of materials in the process of technological innovation, and the implementation and popularization of new technologies may lead to a rise in the pressure of carbon emissions in the short term.
As summarized in Table 1, the quantitative contribution of each factor to ECFP varies considerably among provinces.
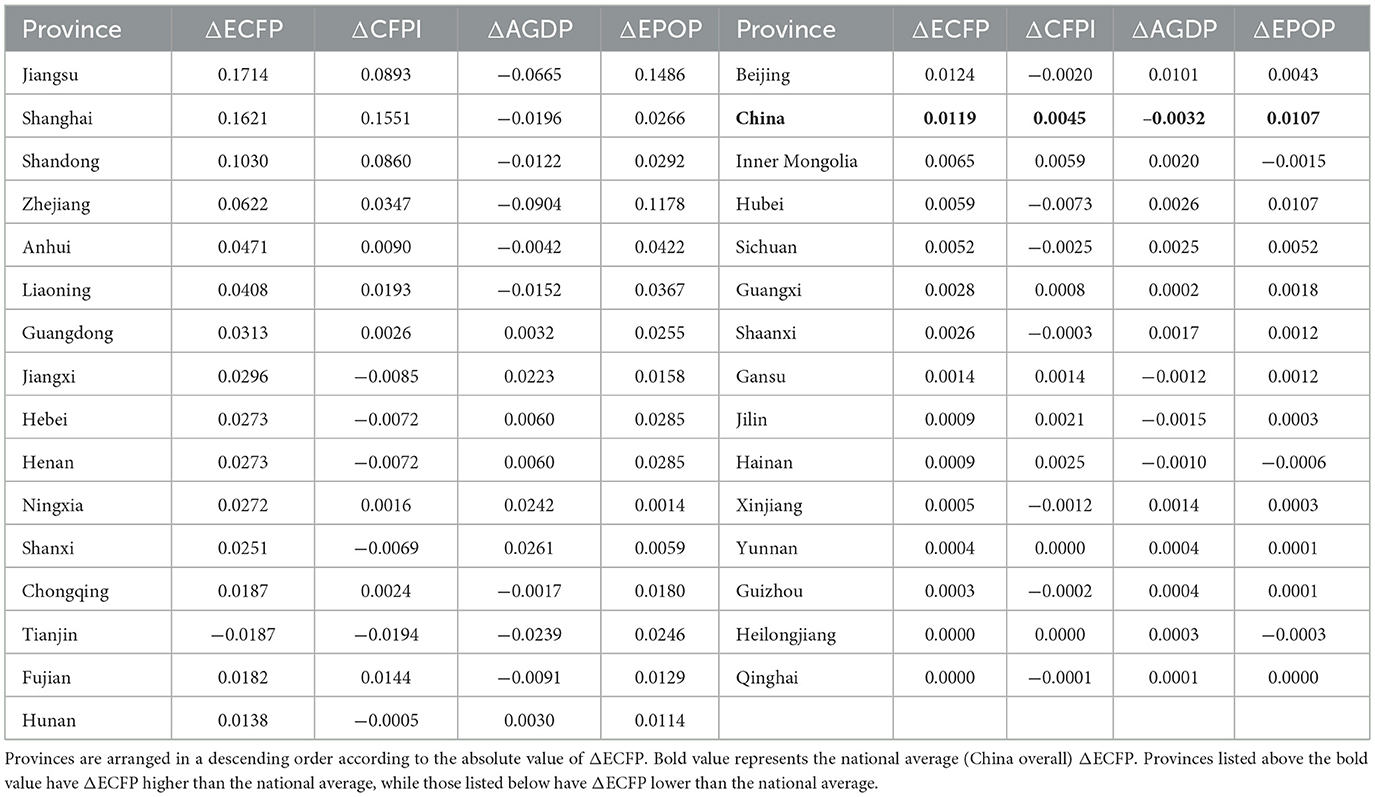
Table 1. Contributions of driving factors to provincial ECFP change from 2003 to 2020.
4.3 ECFP decoupling analysis
It's widely accepted that the growth in the equipment manufacturing industry's economic output largely drives the increase in equipment manufacturing carbon footprint pressure (ECFP). To dig deeper into how this relationship has changed over time, this study uses the Tapio decoupling method to examine the decoupling patterns between ECFP and economic development in China's equipment manufacturing sector from 2003 to 2020. Detailed elasticity results and corresponding decoupling states for all provinces are listed in Table 2.
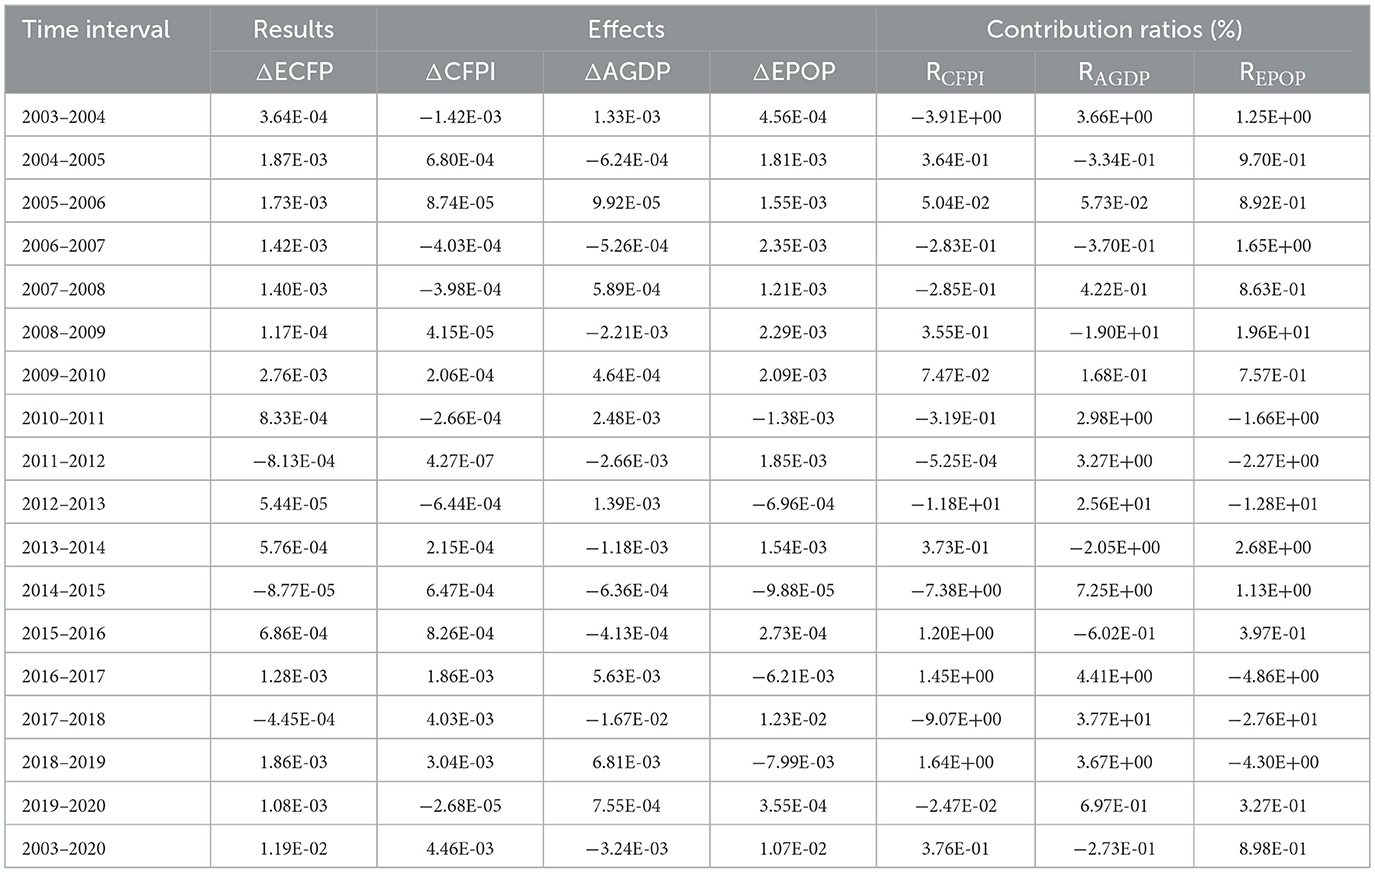
Table 2. Contributions of driving factors to ECFP change in China.
Table 3 outlines eight decoupling states identified in the analysis: strong decoupling, weak decoupling, implicit decoupling, expansive coupling, implicit coupling, weak negative decoupling, strong negative decoupling, and expansive negative decoupling—coded 1 through 8, respectively. Over the years, weak decoupling showed up five times, negative decoupling appeared eight times, and coupling states were recorded four times. Interestingly, weak decoupling mostly happened before 2013, while from 2013 to 2020, negative decoupling dominated, implying a tighter link between economic growth and ECFP in that period.
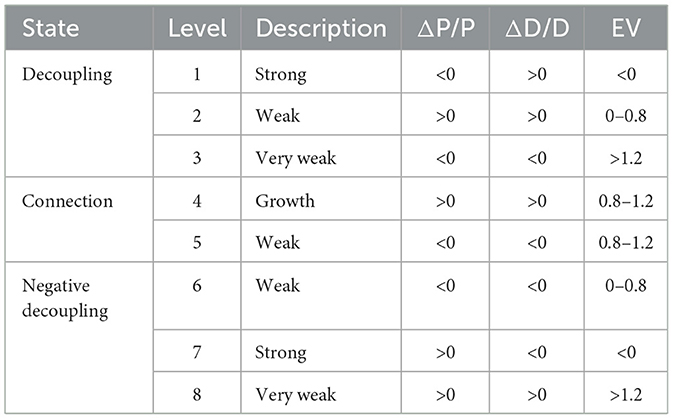
Table 3. Classification of the decoupling states of the Tapio decoupling index.
As shown in Figure 7, between 2003 and 2010, most regions were in a good state of decoupling between ECFP and economic development in equipment manufacturing. For example, the eastern regions of Beijing, Shanghai, Jiangsu, and Zhejiang had a strong decoupling between ECFP and economic development during the initial 2003–2004 period. During this period, China's equipment manufacturing industry was in its infancy, and the speed of the industry's economic development was greater than the change in ECFP. Between 2010 and 2015, the scale of the equipment manufacturing industry in some regions expanded, the amount of energy consumed increased, and the change in the pressure on the environment was greater than the speed of economic development, resulting in a negative decoupling status between ECFP and economic development. For example, in 2012–2013, the value of Shandong was 8, indicating a very weak negative decoupling. Between 2015 and 2020, the equipment manufacturing industry developed at a high speed, and many regions are in a negative decoupling state between ECFP and economic development. However, in 2020, eastern regions such as Beijing, Shanghai, Jiangsu, and Zhejiang become weakly decoupled or strongly decoupled. The development of the equipment manufacturing industry in these regions has changed from an initial decoupling state to a strong negative decoupling state over time, and then to a weak decoupling state. The main reason is that the development of equipment manufacturing from the initial dependence on fossil energy consumption, which has generated greater pressure on the environment. But with the improvement of economic level, technological innovation, reducing carbon emissions, and focusing on the protection of the environment, the pressure on the environment is reduced (Amri, 2017).
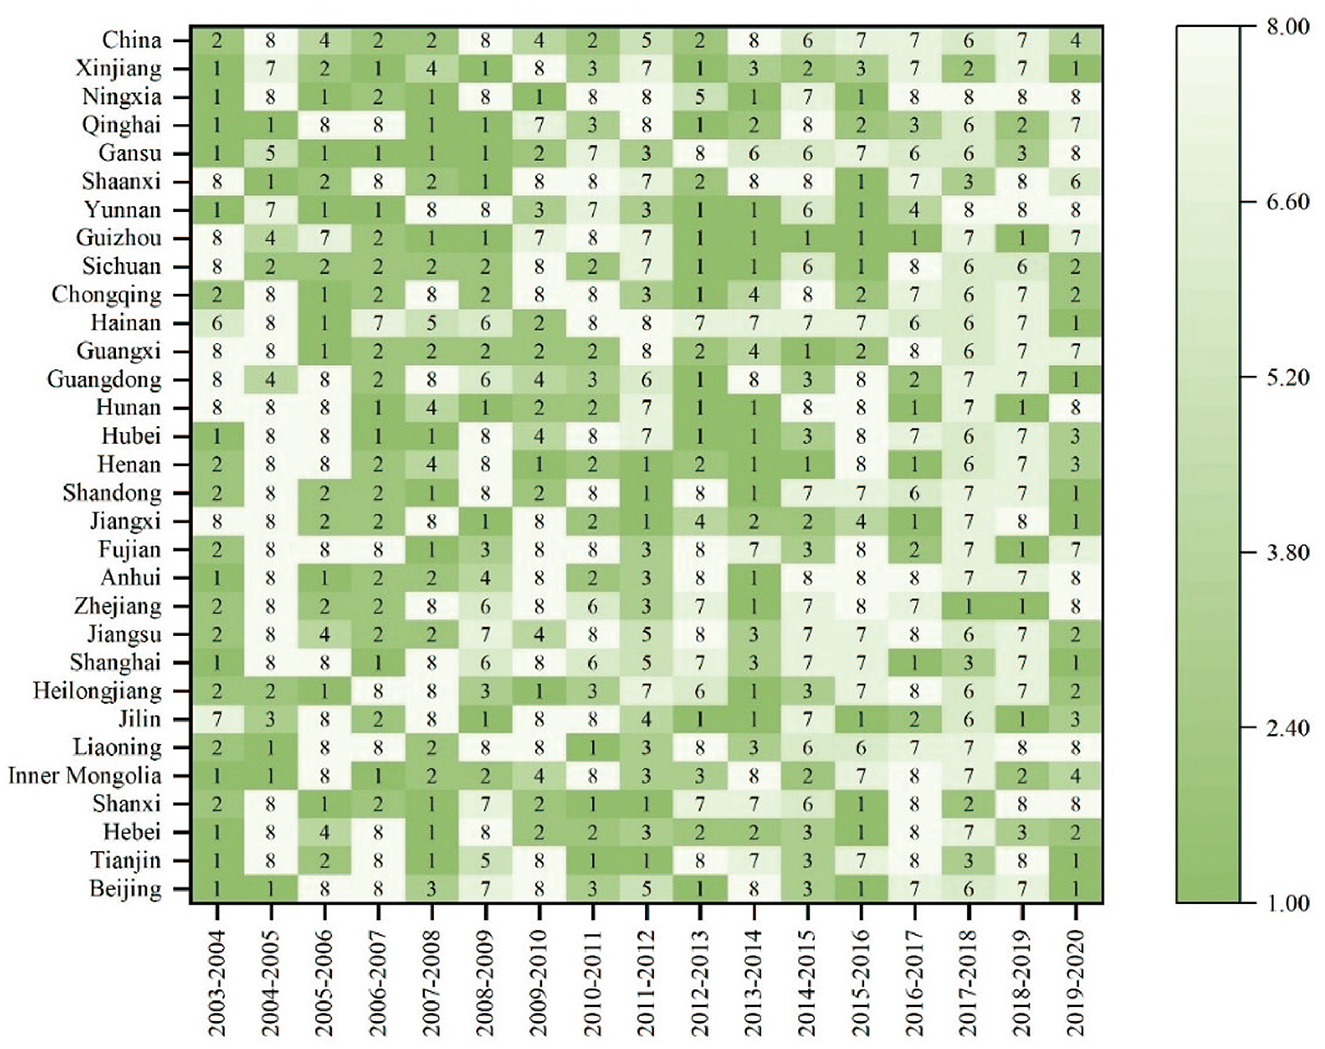
Figure 7. Hot spot map of ECFP decoupling state in each province, 2003–2020.
Overall, the decoupling status of China's regions has gradually changed from strong decoupling to weak or negative decoupling over time. Eastern coastal regions (e.g., Beijing, Shanghai, Jiangsu, etc.) show stronger decoupling effects in the early years, while central and western regions (e.g., Gansu, Shaanxi, etc.) show greater volatility. The analysis of specific years and regions reveals changes in decoupling status, which are closely related to economic policies, environmental policies, and regional development strategies.
4.4 ECFP spatial effects
To clarify the analytical framework and ensure transparency, Table 4 reports the definitions and descriptive statistics of all variables used in the spatial effects analysis. The dependent variable, ECFP, represents the carbon footprint pressure of the equipment manufacturing industry, reflecting the environmental load per unit of industrial output. EPOP denotes the employment level in the equipment manufacturing sector and captures the scale of production activities. RD measures the research and development investment intensity, indicating innovation input and potential for industrial upgrading. IS denotes the share of equipment manufacturing in the total manufacturing output, representing the degree of industrial specialization and structural adjustment. EI measures the energy intensity of equipment manufacturing, indicating the energy consumption per unit of industrial value added. These variables collectively describe the economic, technological, and structural drivers of ECFP and are widely applied in spatial econometric analyses based on the STIRPAT model framework (Elhorst, 2014; Zhou et al., 2023).
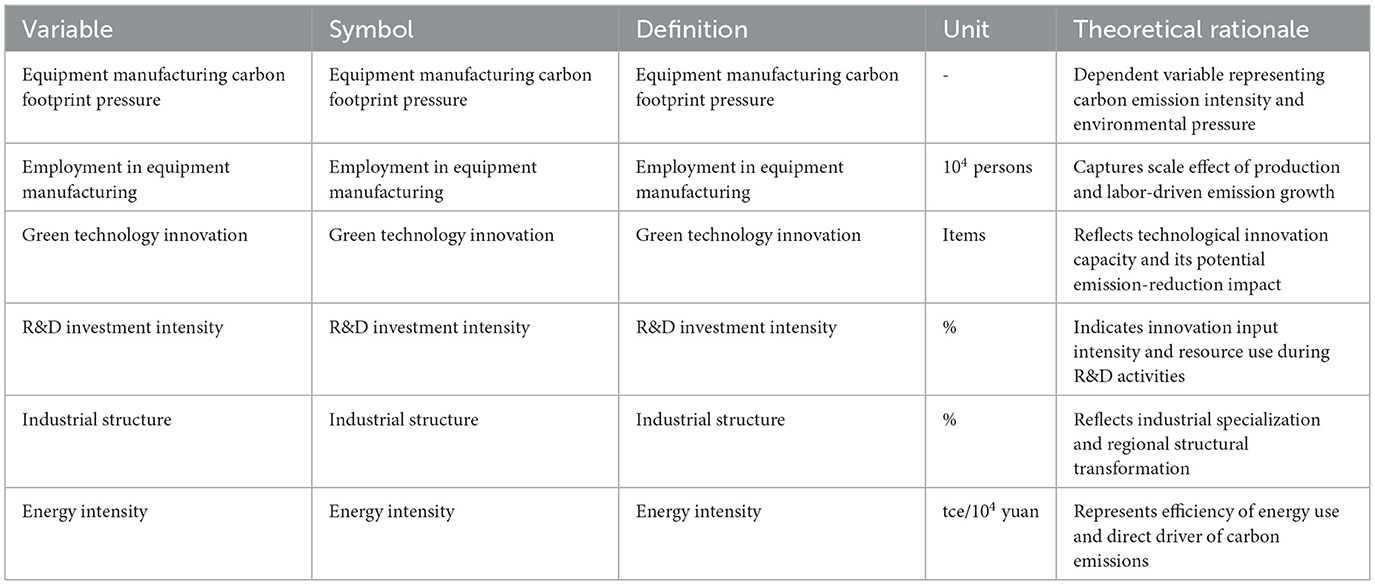
Table 4. Variable definitions and descriptive statistics.
4.4.1 Decomposition of spatial effects
We built an extended STIRPAT model by integrating results from the LMDI decomposition and ran spatial regression analyses on equipment manufacturing carbon footprint pressure (ECFP) over the period 2003 to 2020. The Moran's I plot clearly shows significant spatial autocorrelation in ECFP. To figure out which spatial econometric model fits best, we conducted LM tests. As Table 5 shows, LM-error, LM-lag, Robust LM-error, and Robust LM-lag tests all came out significant, which means traditional regression models just don't cut it here—spatial models like the Spatial Lag Model (SLM) or Spatial Error Model (SEM) are needed to properly account for spatial dependence (Flores-Lagunes and Schnier, 2012).
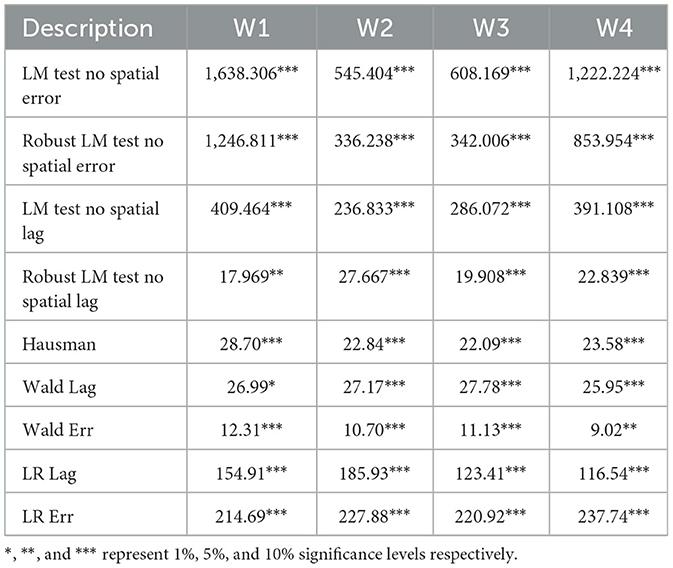
Table 5. Results of the spatial econometric model detection under the four weight matrices.
Looking further, the Wald and likelihood ratio (LR) tests (also in Table 5) are significant at the 1% level, suggesting the Spatial Durbin Model (SDM) fits the data better than either SAR or SEM. Then, to decide between fixed and random effects, we ran the Hausman test, which favored fixed effects at the 1% significance level. Plus, LR tests for spatial and temporal fixed effects also turned out significant, pointing to the spatio-temporal double fixed effects model as the best choice. So, we settled on the spatio-temporal double fixed effects SDM to dig into the spillover effects of carbon footprint pressure in equipment manufacturing.
Since the impact factor coefficients in the SDM do not fully capture the indirect effects of all variables on ECFP (Elhorst, 2014). Therefore, the spatial effects are decomposed and the results are shown in the Table 6. The direct effect indicates the effect of changes in regional drivers on ECFP in the local region, and the indirect effect indicates the effect of changes in drivers on ECFP in neighboring regions.
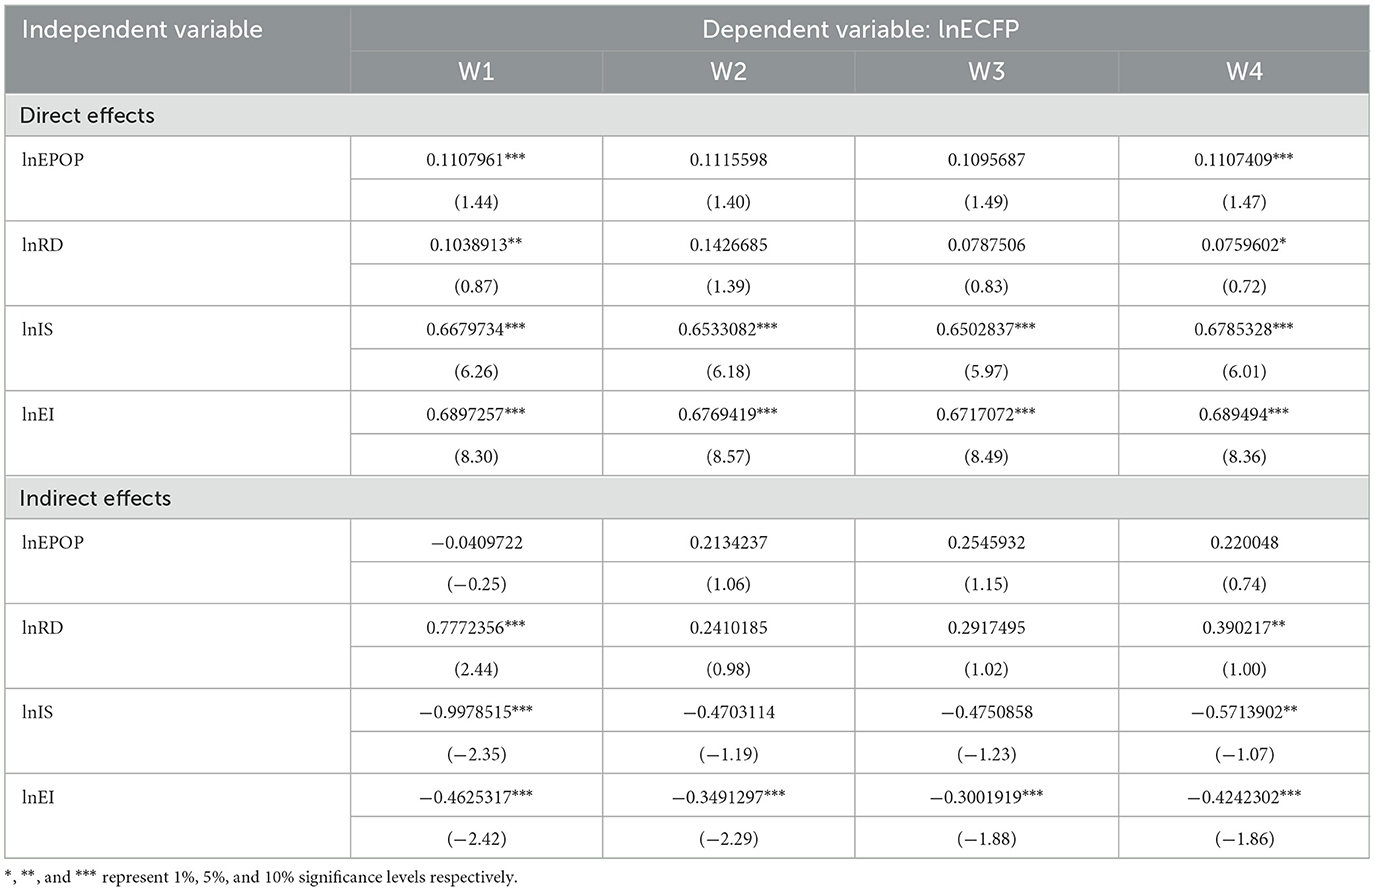
Table 6. Direct and indirect effects under four weighting matrices.
The rise of EPOP expands production activities and scale, which leads to more energy consumption and carbon emissions, thus increasing ECFP. Meanwhile, the indirect effect of EPOP is significant and positive in the W2 matrix and W3 matrix. The main reason is that the equipment manufacturing industry usually has a long industrial chain involving the supply, processing, and transportation of raw materials from multiple regions. An increase in the number of employees may lead to an increase in the production activities of the upstream and downstream enterprises of these industrial chains, which not only affects the region but also drives the development of related industries in neighboring regions, thus increasing the carbon footprint of these regions and leading to a rise in ECFP (Jin and Han, 2021).
The increase of RD significantly increases the ECFP of local and neighboring regions. The main reason may be that the increase of RD leads to more R&D activities, which requires a large number of experiments and tests, and these will generate a large amount of carbon emissions in a short period, which will indirectly increase the ECFP of the local region. Meanwhile, through the inter-regional technological diffusion, cooperation, and industrial chain linkage, it affects the carbon emissions of the neighboring regions, which increase the energy consumption and carbon emissions, indirectly increasing ECFP (Zhou et al., 2023).
The increase of IS will significantly increase the local ECFP but will reduce the ECFP of neighboring regions, mainly because the equipment manufacturing industry has increased its share in the manufacturing industry, and the scale of production has expanded, which leads to the increase of energy demand and carbon emissions, and increases the ECFP in the short term. Meanwhile, the equipment manufacturing industry has an agglomeration effect, and through the division of labor and cooperation with neighboring regions, it diffuses the technology and industrial model to neighboring regions, which promotes industrial upgrading and carbon emission reduction in these regions indirectly. At the same time, the equipment manufacturing industry has an agglomeration effect, spreading technologies and industrial models to neighboring regions through the division of labor and cooperation with neighboring regions, which promotes the industrial upgrading of these regions and reduces carbon emissions, and indirectly reduces ECFP (Zhao et al., 2022).
An increase in EI leads to a rise in local ECFP. Equipment manufacturing energy consumption is mainly coal-based primary energy consumption and secondary energy consumption of electricity and heat, and the rise in energy intensity leads to the rise in carbon emissions from energy consumption, which indirectly leads to the rise in ECFP. However, due to the clustering of the equipment manufacturing industry, the industrial transfer leads to a decrease in carbon emissions in neighboring regions, and the increase in EI indirectly contributes to the decrease in ECFP (Chen Y. et al., 2022).
4.4.2 Dynamic spatial Durbin models
W3 was further used in the analysis of the dynamic spatial Durbin model as the W3 matrix takes into account geographic and economic factors and has an R2 of 0.619, which is the highest among the four matrices, as shown in the Table 7, variables marked with “**” are statistically significant at the 1% level, indicating a strong correlation between these factors and the carbon footprint pressure of the equipment manufacturing industry.
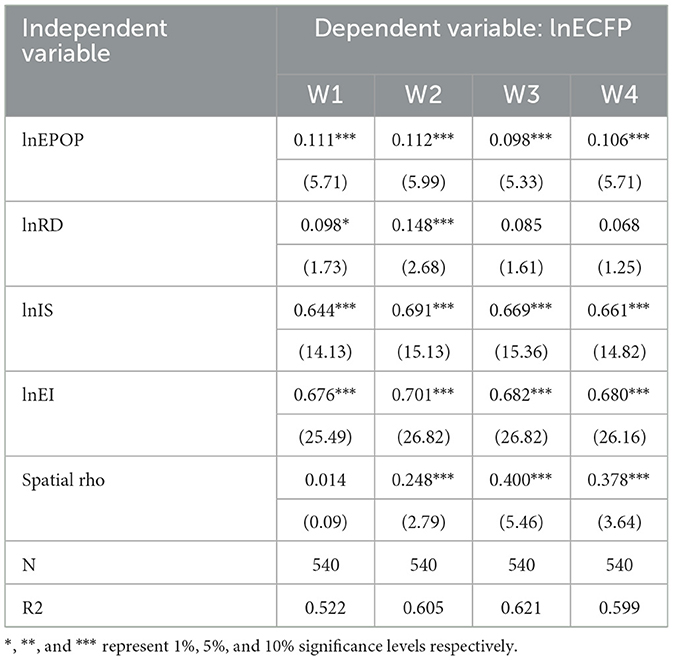
Table 7. Model regression results under the four weight matrices.
Table 8 summarizes the long- and short-term direct and indirect effects of the various factors. In the dynamic spatial Durbin model, rising energy intensity clearly drives up equipment manufacturing carbon footprint pressure (ECFP) in both the short and long term. This basically means that as advanced technologies become more widespread, ECFP tends to decline gradually. To put numbers on it, every 1% increase in technological innovation corresponds to about a 0.113% drop in carbon footprint pressure in the short term and a 0.188% drop in the long term.
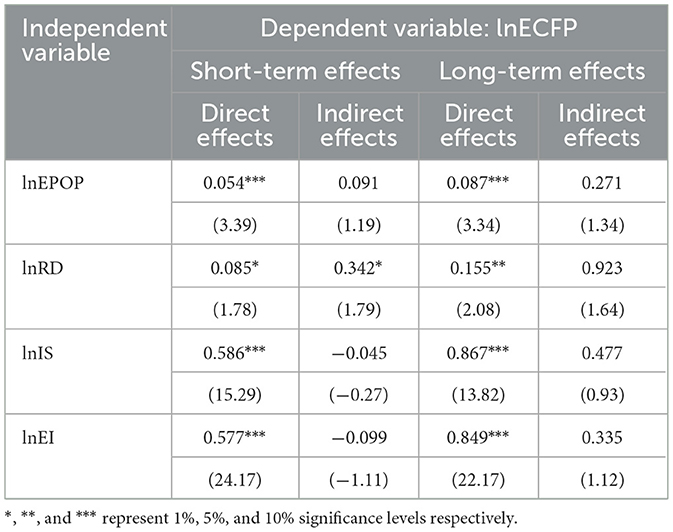
Table 8. Results of the short-term and long-term effects of the dynamic spatial Durbin model under the W3 matrix.
5 Conclusion
This study examined the regional and temporal evolution characteristics of China's ECFP from 2003 to 2020, based on vegetation carbon sequestration, and it selected 30 provinces as research objects. The contributions of the employed population, economic development, and technological effects to the changes in ECFP are explored, followed by a quantitative analysis of the decoupling state between ECFP and economic development. On this basis, the spatial effects of the number of employed people, green technology innovation, research investment, proportion of equipment manufacturing, and energy intensity on ECFP in different provinces are analyzed using spatial econometric models in combination with the extended STIRPAT model. The main conclusions of this study are as follows:
(1) From 2003 to 2020, ECFP increased gradually, especially in the eastern coastal regions, where it rose significantly. Over time, ECFP spreads inland from the eastern coastal regions, and this spreading trend becomes more obvious, especially during 2005–2010. After 2010, the ECFP in the central area grew progressively, which could be connected to economic growth and industrial transfer. From 2003 to 2020, the center of gravity of ECFP gradually moves southward, with the center of gravity shifting from Shandong to Jiangsu and Anhui.
(2) The increase in industrial output value is one of the main reasons for the rise in ECFP. Over time, there has been a shift in the link between the growth of the equipment manufacturing industry and ECFP in the developed eastern coast regions. Initially, there was a strong negative decoupling, which was followed by a mild decoupling that exists now. The development of equipment manufacturing in the previous period mainly relied on fossil energy consumption, which exerted greater pressure on the environment. With technological innovation, industrial transfer, etc., the development of equipment manufacturing in these regions has maintained high growth while reducing the pressure on the environment.
(3) The key drivers behind equipment manufacturing carbon footprint pressure (ECFP) include the number of employees, green technology innovation, research investment, the share of equipment manufacturing in the industrial structure, and energy intensity. Notably, the spatial spillover effects of these factors shouldn't be ignored. The results show that more employees lead to a significant increase in ECFP, especially over the long term. Green technology innovation, on the other hand, helps curb carbon emissions noticeably in the short run, with its effect becoming even clearer in the long run, effectively driving emissions down. When the share of equipment manufacturing in the industrial structure rises, it tends to boost local ECFP but interestingly, it reduces ECFP in neighboring areas. Investment in research exhibits a lagged effect over time. Meanwhile, higher energy intensity works against emission reductions, particularly in the short term, pushing carbon emissions up quite a bit. Overall, these factors tend to have stronger short-term than long-term impacts. So, when crafting policies, it's crucial for decision-makers to take into account these spatial interactions and cross-regional dynamics to achieve more effective carbon reduction.
On this basis, the following policy recommendations are made:
Given the pronounced spatial clustering characteristics of the equipment manufacturing sector, environmental policies should be formulated with due consideration for each province's economic development level, industrial structure, and resource endowment, implementing differentiated emission reduction strategies. Policy direction should focus on optimizing energy structures, reducing energy intensity, and enhancing energy utilization efficiency. This entails accelerating the substitution of clean energy sources (such as renewables, hydrogen, and electrification), promoting the application of high-efficiency energy-saving technologies and low-carbon alternative processes, and achieving coordinated green growth across regions.
Furthermore, cross-regional coordination and collaborative governance must be strengthened. As equipment manufacturing supply chains often span multiple provinces, unilateral actions by individual regions may lead to carbon leakage or uneven emissions reductions. Enhanced inter-provincial cooperation, improved information sharing, and coordinated oversight can establish a unified low-carbon manufacturing ecosystem. Establishing regional green technology demonstration centers and shared innovation platforms will accelerate the dissemination of green technologies and energy-saving practices.
To fully unlock the emission reduction potential of green technological innovation, mechanisms for incentivizing innovation and policy support must be refined. Governments should encourage increased corporate investment in low-carbon R&D through tax incentives, green credit schemes, and emission reduction subsidies. Concurrently, integrating innovation outcomes into industrial upgrading strategies ensures scientific and technological advancements directly translate into emission reduction benefits.
Concurrently, researchers and developers should prioritize environmental protection as a core objective of innovation. Promoting interdisciplinary integration across environmental science, materials engineering, and manufacturing technologies facilitates the conversion of research outcomes into practical industrial solutions. Refining technology transfer systems, strengthening intellectual property protection, and establishing research-to-application incubation mechanisms will further shorten innovation conversion cycles.
Finally, policy design should incorporate social and market mechanisms to sustain long-term emissions reduction momentum. Enhancing transparency and accountability through carbon trading and disclosure mechanisms, while stimulating public engagement via awareness campaigns and voluntary reduction initiatives, will achieve balanced development across technological advancement, economic competitiveness, and environmental sustainability.
Data availability statement
The original contributions presented in the study are included in the article/supplementary material, further inquiries can be directed to the corresponding author.
Author contributions
JZ: Conceptualization, Formal analysis, Methodology, Writing – original draft, Writing – review & editing. YD: Conceptualization, Data curation, Formal analysis, Methodology, Writing – review & editing. SD: Formal analysis, Writing – review & editing. LL: Formal analysis, Writing – review & editing. CL: Funding acquisition, Methodology, Writing – review & editing.
Funding
The author(s) declare that financial support was received for the research and/or publication of this article. This research was supported by the open fund of Key Laboratory of Ecosystem Carbon Source and Sink, China Meteorological Administration (ECSS-CMA) and the open fund of Jiangsu Key Laboratory of Agricultural and Ecological Meteorology.
Acknowledgments
We extend our sincere gratitude to the Key Laboratory of Ecosystem Carbon Source and Sink (ECSS-CMA), China Meteorological Administration, and the Jiangsu Key Laboratory of Agricultural and Ecological Meteorology for their generous support of this study. Their funding and resources were instrumental in enabling this research.
Conflict of interest
The authors declare that the research was conducted in the absence of any commercial or financial relationships that could be construed as a potential conflict of interest.
Generative AI statement
The author(s) declare that no Gen AI was used in the creation of this manuscript.
Any alternative text (alt text) provided alongside figures in this article has been generated by Frontiers with the support of artificial intelligence and reasonable efforts have been made to ensure accuracy, including review by the authors wherever possible. If you identify any issues, please contact us.
Publisher's note
All claims expressed in this article are solely those of the authors and do not necessarily represent those of their affiliated organizations, or those of the publisher, the editors and the reviewers. Any product that may be evaluated in this article, or claim that may be made by its manufacturer, is not guaranteed or endorsed by the publisher.
References
Amri, F. (2017). Carbon dioxide emissions, output, and energy consumption categories in Algeria. Environ. Sci. Pollut. Res. 24, 14567–14578. doi: 10.1007/s11356-017-8984-7
An, M., Wang, J., An, H., Zhang, J., and Huang, J. (2023). A dynamic view of environmental regulation influence mechanism on manufacturing agglomeration-a case study of the Yangtze River Delta city cluster. Environ. Sci. Pollut. Res. 30, 6643–6657. doi: 10.1007/s11356-022-22596-7
Anselin, L. (2001). Spatial effects in econometric practice in environmental and resource economics. Am. J. Agric. Econ. 83, 705–710. doi: 10.1111/0002-9092.00194
Brajer, V., Mead, R. W., and Xiao, F. (2011). Searching for an environmental Kuznets curve in China's air pollution. China Econ. Rev. 22, 383–397. doi: 10.1016/j.chieco.2011.05.001
Chen, B., Xu, C., Wu, Y., Li, Z., Song, M., and Shen, Z. (2022). Spatiotemporal carbon emissions across the spectrum of Chinese cities: insights from socioeconomic characteristics and ecological capacity. J. Environ. Manage. 306:114510. doi: 10.1016/j.jenvman.2022.114510
Chen, J., Fan, W., Li, D., Liu, X., and Song, M. (2020). Driving factors of global carbon footprint pressure: based on vegetation carbon sequestration. Appl. Energy 267:114914. doi: 10.1016/j.apenergy.2020.114914
Chen, Y., Shao, S., Fan, M., Tian, Z., and Yang, L. (2022). One man's loss is another's gain: does clean energy development reduce CO2 emissions in China? Evidence based on the spatial Durbin model. Energy Econ. 107:105852. doi: 10.1016/j.eneco.2022.105852
Dong, K., Sun, R., Jiang, H., and Zeng, X. (2018). CO2 emissions, economic growth, and the environmental Kuznets curve in China: what roles can nuclear energy and renewable energy play? J. Clean. Prod. 196, 51–63. doi: 10.1016/j.jclepro.2018.05.271
Elhorst, J. P. (2014). Spatial Econometrics: From Cross-Sectional Data to Spatial Panels. Heidelberg: Springer.
Elhorst, J. P. (2014). Spatial Econometrics: From Cross-Sectional Data to Spatial Panels. Heidelberg: Springer.
Fan, D. C., and Du, M. Y. (2018). Research on technology innovation resource allocation efficiency and its influencing factors in high-end equipment manufacturing industries—based on the empirical analysis of the two-stage StoNED-Tobit model. China J. Manag. Sci. 26, 13–24. doi: 10.16381/j.cnki.issn1003-207x.2018.01.002
Fan, W., Huang, S., Yu, Y., Xu, Y., and Cheng, S. (2022). Decomposition and decoupling analysis of carbon footprint pressure in China's cities. J. Clean. Prod. 372:133792. doi: 10.1016/j.jclepro.2022.133792
Fan, W., Huang, S., Yu, Y., Xu, Y., and Cheng, S. (2022). Decomposition and decoupling analysis of carbon footprint pressure in China's cities. J. Clean. Prod. 372:133792. doi: 10.1016/j.jclepro.2022.133792
Feng, C., Huang, J. B., and Wang, M. (2018). The driving forces and potential mitigation of energy-related CO2 emissions in China's metal industry. Resour. Policy 59, 487–494. doi: 10.1016/j.resourpol.2018.09.003
Flores-Lagunes, A., and Schnier, K. E. (2012). Estimation of sample selection models with spatial dependence. J. Appl. Econom. 27, 173–204. doi: 10.1002/jae.1189
Gu, G., Zheng, H., Tong, L., and Dai, Y. (2022). Does carbon financial market as an environmental regulation policy tool promote regional energy conservation and emission reduction? Empirical evidence from China. Energy Policy 163:112826. doi: 10.1016/j.enpol.2022.112826
Huang, R., Chen, G., Lv, G., Malik, A., Shi, X., and Xie, X. (2020). The effect of technology spillover on CO2 emissions embodied in China-Australia trade. Energy Policy 144:111544. doi: 10.1016/j.enpol.2020.111544
Huang, R., Chen, G., Lv, G., Malik, A., Shi, X., and Xie, X. (2020). The effect of technology spillover on CO2 emissions embodied in China-Australia trade. Energy Policy 144:111544. doi: 10.1016/j.enpol.2020.111544
Jin, B., and Han, Y. (2021). Influencing factors and decoupling analysis of carbon emissions in China's manufacturing industry. Environ. Sci. Pollut. Res. 28, 64719–64738. doi: 10.1007/s11356-021-15548-0
Lee, L. F., and Yu, J. (2010). Estimation of spatial autoregressive panel data models with fixed effects. J. Econom. 154, 165–185. doi: 10.1016/j.jeconom.2009.08.001
Li, Z. Z., Li, R., Malik, M. Y., Murshed, M., and Umar, M. (2021). Determinants of carbon emission in China: how good is green investment? Sustain. Prod. Consum. 27, 390–421. doi: 10.1016/j.spc.2020.11.008
Lu, H., Elahi, E., and Sun, Z. (2022). Empirical decomposition and forecast of carbon neutrality for high-end equipment manufacturing industries. Front. Environ. Sci. 10:926365. doi: 10.3389/fenvs.2022.926365
National Bureau of Statistics of China (2017). Industrial Classification for National Economic Activities (GB/T 4754–2017). Beijing: National Bureau of Statistics of China. Available online at: https://www.stats.gov.cn/zs/tjws/tjbz/202301/t20230101_1903769.html
Ren, S., and Hu, Z. (2012). Effects of decoupling of carbon dioxide emission by Chinese nonferrous metals industry. Energy Policy 43, 407–414. doi: 10.1016/j.enpol.2012.01.021
Rong, P., Zhang, Y., Qin, Y., Liu, G., and Liu, R. (2020). Spatial differentiation of carbon emissions from residential energy consumption: a case study in Kaifeng, China. J. Environ. Manage. 271:110895. doi: 10.1016/j.jenvman.2020.110895
Shahbaz, M., Raghutla, C., Song, M., Zameer, H., and Jiao, Z. (2020). Public-private partnerships investment in energy as new determinant of CO2 emissions: the role of technological innovations in China. Energy Econ. 86:104664. doi: 10.1016/j.eneco.2020.104664
Shan, Y., Guan, D., Zheng, H., Ou, J., Li, Y., Meng, J., et al. (2018). China CO2 emission accounts 1997–2015. Sci. Data 5:170201. doi: 10.1038/sdata.2017.201
Shan, Y., Huang, Q., Guan, D., and Hubacek, K. (2020). China CO2 emission accounts 2016–2017. Sci. Data 7:54. doi: 10.1038/s41597-020-0393-y
Sinha, A., and Shahbaz, M. (2018). Estimation of environmental Kuznets curve for CO2 emission: role of renewable energy generation in India. Renew. Energy 119, 703–711. doi: 10.1016/j.renene.2017.12.058
Su, Z. H., Ma, L., Chu, X. L., Chen, Z. Y., and He, J. J. (2013). Dynamic analysis on carbon footprint of energy utilization in Guangdong Province. Appl. Mech. Mater. 291–294, 1471–1477. doi: 10.4028/www.scientific.net/AMM.291-294.1471
Tapio, P. (2005). Towards a theory of decoupling: degrees of decoupling in the EU and the case of road traffic in Finland between 1970 and 2001. Transp. Policy 12, 137–151. doi: 10.1016/j.tranpol.2005.01.001
UNFCCC (2016). Aggregate Effect of the Intended Nationally Determined Contributions: An Update. Bonn: UNFCCC Secretariat. Available online at: https://unfccc.int/resource/docs/2016/cop22/eng/02.pdf (Accessed October 20, 2025).
Wang, Q., and Zhang, F. (2021). The effects of trade openness on decoupling carbon emissions from economic growth–evidence from 182 countries. J. Clean. Prod. 279:123838. doi: 10.1016/j.jclepro.2020.123838
Wang, S., Zeng, J., and Liu, X. (2019). Examining the multiple impacts of technological progress on CO2 emissions in China: a panel quantile regression approach. Renew. Sustain. Energy Rev. 103, 140–150. doi: 10.1016/j.rser.2018.12.046
Wang, Y., Wang, Z., and Zameer, H. (2021). Structural characteristics and evolution of the “international trade–carbon emissions” network in the equipment manufacturing industry: international evidence in the perspective of global value chains. Environ. Sci. Pollut. Res. 28, 25886–25905. doi: 10.1007/s11356-021-12407-w
Wolfram, P., Wiedmann, T., and Diesendorf, M. (2016). Carbon footprint scenarios for renewable electricity in Australia. J. Clean. Prod. 124, 236–245. doi: 10.1016/j.jclepro.2016.02.080
Xia, X., Ren, P., Wang, X., Wang, Y., Zhang, W., and Zhang, L. (2024). The carbon budget of China: 1980–2021. Sci. Bull. 69, 114–124. doi: 10.1016/j.scib.2023.11.016
Xuan, Y., and Yue, Q. (2016). Forecast of steel demand and the availability of depreciated steel scrap in China. Resour. Conserv. Recycl. 109, 1–12. doi: 10.1016/j.resconrec.2016.02.003
Yang, J., Cheng, J., and Huang, S. (2020). CO2 emissions performance and reduction potential in China's manufacturing industry: a multi-hierarchy meta-frontier approach. J. Clean. Prod. 255:120226. doi: 10.1016/j.jclepro.2020.120226
York, R., Rosa, E. A., and Dietz, T. (2003). STIRPAT, IPAT and ImPACT: analytic tools for unpacking the driving forces of environmental impacts. Ecol. Econ. 46, 351–365. doi: 10.1016/S0921-8009(03)00188-5
Zhang, M., and Liu, Y. (2022). Influence of digital finance and green technology innovation on China's carbon emission efficiency: empirical analysis based on spatial metrology. Sci. Total Environ. 838:156463. doi: 10.1016/j.scitotenv.2022.156463
Zhao, J., Jiang, Q., Dong, X., and Dong, K. (2021). Assessing energy poverty and its effect on CO2 emissions: the case of China. Energy Econ. 97:105191. doi: 10.1016/j.eneco.2021.105191
Zhao, J., Jiang, Q., Dong, X., Dong, K., and Jiang, H. (2022). How does industrial structure adjustment reduce CO2 emissions? Spatial and mediation effects analysis for China. Energy Econ. 105:105704. doi: 10.1016/j.eneco.2021.105704
Zhao, R., Huang, X., Liu, Y., Zhong, T., Ding, M., and Chuai, X. (2014). Urban carbon footprint and carbon cycle pressure: the case study of Nanjing. J. Geogr. Sci. 24, 159–176. doi: 10.1007/s11442-014-1079-1
Keywords: equipment manufacturing industry, carbon footprint pressure, vegetation carbon sequestration, spatial econometric model, influencing factors
Citation: Zhou J, Duan Y, Ding S, Lu L and Liu C (2025) Spatial and temporal evolution characteristics and influencing factors of carbon footprint pressure in China's equipment manufacturing industry. Front. Environ. Econ. 4:1681641. doi: 10.3389/frevc.2025.1681641
Received: 19 August 2025; Accepted: 29 October 2025;
Published: 19 November 2025.
Edited by:
Wenjie Zou, Fujian Normal University, ChinaReviewed by:
Linjie Feng, Macao Polytechnic University, Macao SAR, ChinaHanbing Li, Nankai University School of Economics, China
Copyright © 2025 Zhou, Duan, Ding, Lu and Liu. This is an open-access article distributed under the terms of the Creative Commons Attribution License (CC BY). The use, distribution or reproduction in other forums is permitted, provided the original author(s) and the copyright owner(s) are credited and that the original publication in this journal is cited, in accordance with accepted academic practice. No use, distribution or reproduction is permitted which does not comply with these terms.
*Correspondence: Chunwei Liu, bGl1Y2h1bndlaUB5ZWFoLm5ldA==