 Marie Vagner1*
 Salomé Ducos1Nicolas Graziano1,2Fabienne Le Grand1Antoine Bideau1Emmanuel Dubillot3Christel Lefrançois3*
- 1CNRS, Univ Brest, IRD, Ifremer, Laboratoire Environnement Marin (LEMAR) UMR 6539, Plouzané, France
- 2Univ Brest, INRAE, Laboratoire Universitaire de Biodiversité et Écologie Microbienne, Plouzané, France
- 3Littoral Environnement Sociétés (LIENSs), UMR 7266 CNRS, La Rochelle Université, La Rochelle, France
Omega-3 long-chain highly unsaturated fatty acids (n-3 HUFA) are poorly synthesized de novo by marine fish, but are necessary to maintain their metabolic and physiological performance. Consequently, fish must find them in their diet. However, the availability of these lipid compounds is predicted to decrease in relation to global changes in ocean waters. The aim of this study was to experimentally determine the effects of an n-3 HUFA-deficient diet on the escape performance of Chelon auratus, a microphytobenthos grazer of high ecological importance. Fish were fed either a standard n-3 HUFA diet or an n-3 HUFA-deficient diet for 2 months. At the end of this conditioning period, several variables (latency, responsiveness, initial direction of escape, response duration, distance covered, maximum acceleration and velocity, and turning rate) related to escape performance were characterized in the tested fish. The results showed that a lower dietary n-3 HUFA content caused a significant reduction in the proportion of these fatty acids in fish muscle, both in membranes and in reserves. While the FA composition of the brain also reflected that of the diet in reserves, the membrane fatty acid composition of the brain remained similar between the two dietary groups, suggesting the preservation of neural and cognitive functions of the fish. Neither growth rate nor escape response variables were significantly different between the two diets. However, some escape response variables (e.g., latency, duration, maximum velocity and acceleration, and turning rate) were highly correlated with fish n-3 HUFA content in brain or muscle, and these correlations were tissue specific. While response duration and latency seemed to be more correlated with n-3 HUFA content in the brain membrane, other escape response variables such as turning rate, maximum velocity, cumulative distance, and maximum acceleration seemed to be correlated with n-3 HUFA content in the lipid reserve, both in the brain and in the muscle. Our results indicate that the reduction of n-3 HUFA in the dietary sources of marine fish appears to reduce the performance of the escape response, suggesting some impact of n-3 HUFA dietary changes with global change on predator-prey relationships within the marine ecosystem.
1 Introduction
Long chain highly unsaturated fatty acids (20–22 carbon atoms) of the n-3 series, also known as n-3 HUFA (or omega-3 HUFA), are the major constituents of the cell membranes of all living organisms (1). They play an essential structural role by allowing the maintenance of membrane fluidity, which then determines the conformation and function of proteins embedded in cell membranes (2). As a result, they determine the proper functioning of the cells and tissues on which the physiological and behavioral performance of organisms depends (e.g., growth, locomotion, and reproduction), contributing to their fitness and, in cascade, to the functioning of the ecosystem. Among these n-3 HUFA, EPA (ecosapentaenoic acid 20:5n-3), and DHA (docosahexaenoic acid 22:6n-3) are particularly important in fish, and have been shown to be essential for maintaining their growth, survival, welfare and development (1, 3). In particular, DHA is required for normal development of the nervous system, and has been shown to play a key role in highly active sites of brain (4, 5).
Despite the biological importance of these lipid compounds, they can only be synthesized to a limited extent by animals (6). In the natural environment, they are mainly produced at the first level of the food chain, i.e., by marine microalgae (7). Thus, most marine consumers acquire n-3 HUFA from their diet, directly from microalgae or through successive predation (1), which allows the transfer of these lipids into the food web, up to humans (8–12).
Recent studies have linked the effects of global changes (e.g., increased temperature, decreased salinity, dissolved oxygen in water) to a decrease in n-3 HUFA production at the base of the food chain, resulting from a shift in microalgal communities with the dominance of species that produce less n-3 HUFA (10, 13–15). A recent study predicted that EPA content in marine phyto- and zooplankton would decline in the next century by 2%, ranging from 0.7 to 28.5%, depending on the geographic location (16). An exploratory analysis also calculated, through linear regression models, that global n-3 HUFA production would be reduced by 8.2% for EPA and 27.8% for DHA with an increase in water temperature of 2.5°C (14). This would reduce the availability of n-3 HUFA to consumers, such as fish, with consequences for their cell membrane composition and functionality and, in cascade, on their physiological and behavioral performance (17–20).
Among fish performances that contribute to ecosystem functioning, the escape response performance is critical in the predator-prey relationships. Escape response is an innate behavior of primordial interest in maintaining the selective value (i.e., the probability of survival and transmission of its alleles to its offspring) of the individual. It is a reflex response, that corresponds to a sudden acceleration in response to a stimulus (e.g., attack by a predator). It is triggered by the activation of Mauthner cells and associated neurons cells until a “decision threshold” of excitation is reached (21) in response to a visual or acoustic stimulus (22, 23). Escape duration is extremely short (between 5 and 40 ms on average; 22, 24) because the large size of Mauthner cells and their axons result in very rapid transmission of the action potential along the spinal cord. This transmission leads to a contraction of the lateral muscles, usually on the side opposite the stimulus, and results in a characteristic C-sharp curved shape of the fish, called stage 1. This stage 1 is often followed by a second stage (stage 2), which corresponds to the contraction of the muscles on the opposite side, resulting in a change of direction of the fish. The escape response is considered complete when no more sudden changes in direction are observed (25). The presence or absence of a stage 2 has been used to classify responses as double or single bend, respectively (26–28). The success of an escape response depends not only on behavior of the predator, but also on the performance of the predated individual (e.g., velocity and acceleration), its maneuverability (radius of rotation of the animal's body) and its reaction time (latency) (29). Kinematic patterns of escape responses have been shown to depend on environmental conditions (e.g., dissolved oxygen conditions, temperature), ontogenetic stage and species (23, 28, 30, 31).
However, despite the important role that n-3 HUFA play in the vertebrate nervous system (1, 4, 32), and in particular the relationship found between a DHA deficiency and cognitive deficits (4, 33–35), still little is known about the specific effect of n-3 HUFA on the escape response in fish. To our knowledge, only four studies have reported the effect of an n-3 HUFA-deficient diet on the escape response of fish, all of them on sea bream Sparus aurata, three of them investigating the response of larvae to a visual and sound stimulus (35–37) and a recent one on the effect of a mechanical stimulus on the escape response of juveniles (38). A lower dietary n-3 HUFA content (about 5 times less n-3 HUFA than in the control diet, which was about 18% of total fatty acids, TFA) was associated with reduced burst swimming speed and a delayed response compared to sea bream larvae fed a higher dietary n-3 HUFA content (36). This was also associated with lower levels of DHA measured in the eyes and brain, suggesting impaired functional development of the brain and vision. Dietary n-3 HUFA deficiency (about 2 times less n-3 HUFA than in the control diet, which was about 26% of TFA) also reduced the number of larvae responding to a visual stimulus, and this was associated with a reduced immune-positive neuronal response in Mauthner cells, indicating lower acetylcholine production (37). In addition, DHA, rather than EPA, was shown to increase the swimming speed of escaping larvae, which may be mediated, at least in part, by an increase in neuronal activity in the Mauthner cell (35). More recently, Carvalho et al. (38) reported no effect of a dietary n-3 HUFA deficiency (about three times less n-3 HUFA than in the control diet, which was about 12% TFA) on locomotor performance or escape response in juveniles. However, they did find a slight, but non-significant, increase in latency in fish fed the low n-3 HUFA diet, suggesting a slower reactivity to the stimulus in these fish, which may be related to a slower rate of translation of the neural signal to activate the escape response. Thus, studies reporting the effect of n-3 HUFA on the escape response in fish are scarce, involve only one species, and suggest that this effect may depend on several factors, including ontogenetic stage.
In order to improve our knowledge on this subject, the present study aims to measure and analyze the effect of dietary n-3 HUFA content on the escape response of the golden mullet (Chelon aurata), a euryhaline fish that feeds partly on microalgae and is very common in coastal areas where it comes to feed at high tide (39, 40). Several variables characteristic of the escape response (i.e., responsiveness, latency, type of escape response, duration, directionality and kinematics in terms of maximum acceleration, maximum velocity, cumulative distance, and turning rate) were compared between two groups of fish fed contrasting levels of n-3 HUFA in the diet. Our hypothesis was that a dietary n-3 HUFA deficiency (about 8 times less than in the control diet, which was about 20% TFA) would alter the escape response of juvenile mullet by altering the structure and functionality of (i) the brain and hence the Mauthner cells, and (ii) the lateral muscle tissue involved in contraction during the escape response.
2 Materials and methods
2.1 Ethic statement
The collection and handling of the animals were carried out under the jurisdiction of the Departmental Service of Fisheries and the Animal Care Committee of France (#12886), respectively (N° APAFIS 2017122208475172).
2.2 Fish conditioning
Juvenile mullets (n = 23) were caught in the Pertuis charentais area, near La Rochelle (46°12′14.4′'N 1°11′43.7′'W) the 7th of November 2017, and transported to the LIENSs laboratory (UMR 7266 CNRS- La Rochelle Université, France), where all the experiments were conducted. Fish were kept for 7 weeks in a common 300 L (98 × 98 × 58 cm) closed-circuit experimental tank equipped with a biological filter (Eheim professional 3 2080, Eheim, Deizisau, Germany), and thermoregulated (TECO TR20, Conselice, Italy). Temperature (13 ± 0.2°C) and salinity (28.7 ± 0.1) were monitored daily (TetraCon® 325, Laboratoires Humeau, La Chapelle-sur-Erdre, France) and were kept similar to that of the sampling site. The oxygen concentration was monitored once a week, and was maintained at 93.3 ± 4.4% saturation. Fish were maintained under a 12:12 photoperiod, and fed daily with commercial pellets (Le Gouessant®, Lamballe, France).
In January 2018, all the fish were starved for 24 h, before being anesthetized (Ethyl 3-aminobenzoate methanesulfonate, MS-222, Sigma-Aldrich, St Quentin-Fallavier, France; 0.1 g L−1) in seawater, individually marked with transponders (diameter 2 mm, length 12 mm, M120; biolog-id, Réseaumatique, Bernay, France) injected into the muscle at the base of the dorsal fin using a sterile injector, weighed (mean ± standard deviation: 34.3 ± 6.5 g), and randomly assigned to one of the four replicate 300 L holding tanks (n = 5–6 fish per tank). Fish were acclimated for 4 weeks in their new tanks, during which they were fed commercial pellets (Le Gouessant®, Lamballe, France) twice a day, to a total of 2% of their biomass, and reared at the same temperature and salinity as before (temperature: 13 ± 0.2°C; salinity: 28.7 ± 0.1).
In February 2018, fish were progressively acclimated to 20°C over a period of about 2 weeks at a rate of 0.5°C per day. This temperature was chosen because it is the temperature at which whole organism performance declined in mullet fed on the same low n-3 HUFA diet, but it is still within their natural thermal range, as 20°C reflects the mean summer temperature in the natural environment of mullet (17–19). In particular, the dietary n-3 HUFA deficiency used in the present study has been estimated to significantly reduce the n-3 HUFA content in biological membranes and has been shown to impair the aerobic performance of golden gray mullet at 20°C (18). This temperature was chosen in order to be able to compare our results with our previous studies carried out in the same species, as we know that the effect of dietary fatty acids on physiological performance in ectotherms can depend on ambient temperature, due to homeoviscous adaptation. Homeoviscous adaptation is the process by which organisms adjust their membrane lipid composition in response to temperature to maintain membrane fluidity and functionality (2).
Fish were left another 2 weeks period of acclimation to insure physiological adjustment to the change in temperature. Temperature (19.9 ± 1°C) and salinity (29.6 ± 1.1) were daily measured in the four experimental tanks.
Following this period of acclimation to water temperature, fish were switched to the experimental diets for about 2 months (mean ± standard error of the mean sem = 61 ± 2 days, range: 45–73 days, depending on which day each individual was further tested to measure its escape response performance; see Section 2.3.1). This duration was chosen because it has been shown to be sufficient to detect differences in the membrane fatty acid composition between diet treatments (41). Fish were randomly allocated to the treatment (two tanks per dietary treatment): fish had their food progressively switched to either a standard n-3 HUFA diet (SH diet; n = 11) or a deprived n-3 HUFA diet (LH diet; n = 12). The experimental diets to commercial diet ratio was increased every 2nd day from 25:75%, 50:50%, 75:25%, and finally to 100:0%. The experimental diets were formulated at Ifremer-PFOM (UMR 6539 LEMAR, Plouzané, France) and manufactured at INRAE (Institut National de la Recherche pour l'Agriculture, l'Alimentation et l'Environnement, Donzaq, France). Differences in n-3 HUFA contents between diets were achieved by replacing fish oil (rich in n-3 HUFA) of the SH diet with rapeseed oil (poor in n-3 HUFA) in the LH diet (see ingredients in Table 1). Experimental diets were isocaloric and isolipidic. SH and LH diets contained 17.5 and 1.2% EPA + DHA per total fatty acid mass of the diets, respectively, which represents about 15-fold difference in EPA and DHA content between diets (Table 1). The EPA and DHA content in the SH diet cover the needs of several fish species (41, 42), although the needs for the golden gray mullet are not well-known.
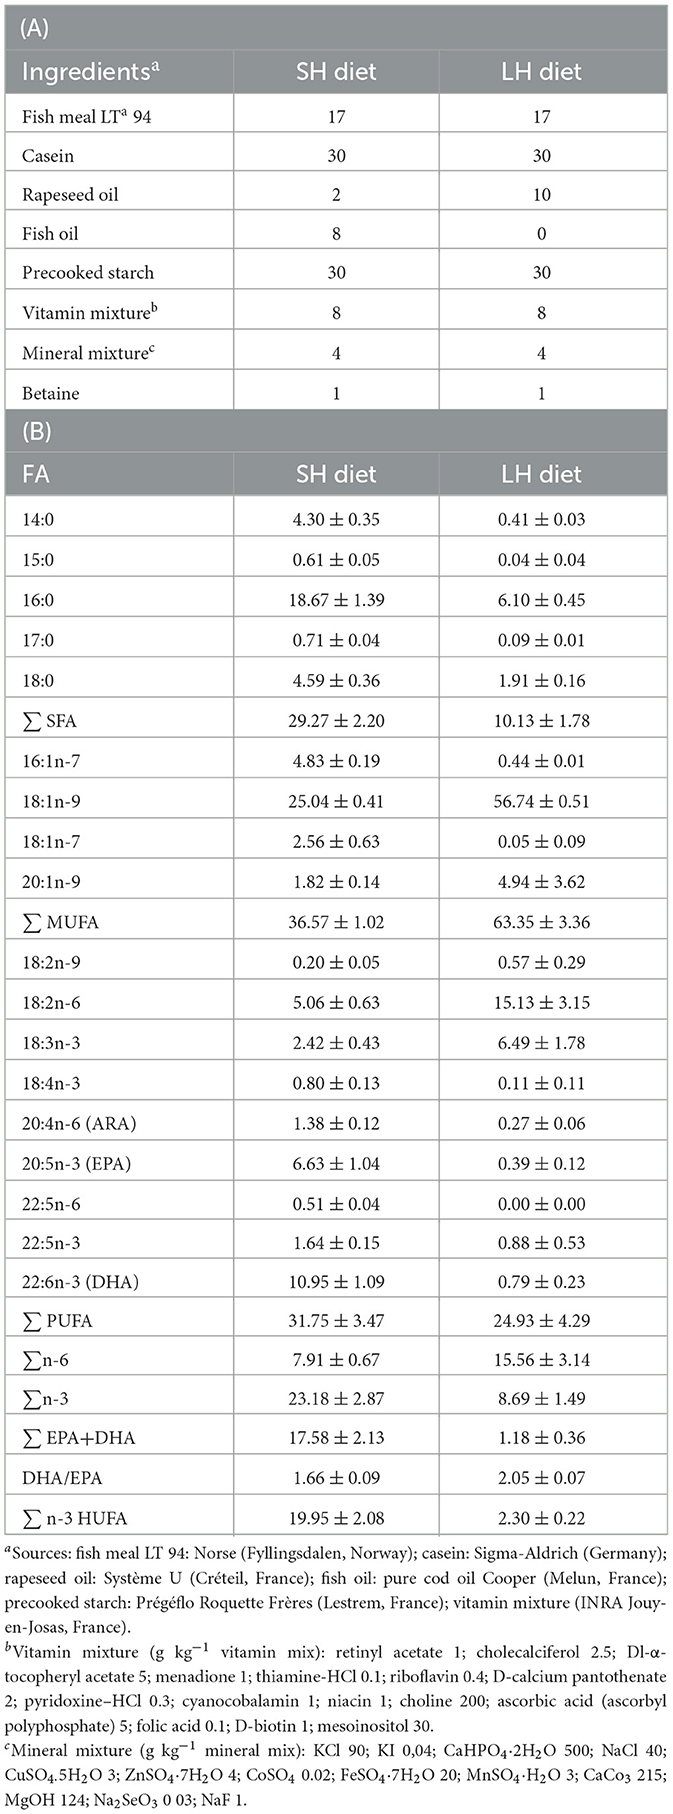
Table 1. (A) Ingredient (in g 100 g−1) and (B) fatty acid (FA) composition expressed as a percentage of FA mass per total FA mass (% mean ± standard error of the mean; n = 3) in the standard (SH) and low (LH) n-3 highly unsaturated fatty acid (n-3 HUFA) diets (made at INRAE, Donzac, France).
Body mass did not differ between fish groups subsequently assigned to the two food treatments (SH: 31.3 ± 1.8 g; LH: 34.9 ± 1.5 g, t-test: t21 = −1.510, p = 0.146). Body mass was measured every 2–3 weeks and rations were recalculated to adjust for growth.
Individuals were fed daily for 2 months at 2% of their biomass, split into two meals during the day (morning and late afternoon). The feed was automatically distributed by an electronic feeder (JBL AutoFood, Neuhofen, Germany).
2.3 Escape response measurement
2.3.1 Experimental protocol
As only two fish per day could be tested for escape response, the duration of the diet treatment varied between processing batches (mean ± SEM = 61 ± 2 days, range: 45–73 days).
The day before each escape response measurement day, one fish from each treatment was randomly netted before the afternoon meal and individually placed in an isolation tank similar to the acclimation tanks (Length: 98 × Width: 98 × Height: 58 cm) and maintained at 20°C with a water depth of ~10 cm. The fish were thus fasted for more than 24 h before being exposed to a startle stimulus.
The next morning, the two fish that had been starved for 24 h in isolation tanks were individually placed in two experimental thermoregulated tanks (Length 75 × Width: 75 × Height: 49 cm; 19.9 ± 0.4°C) with a water depth of ~11 cm (Figure 1), 2 h before the test, which was considered sufficient for the mullet to recover from the transfer (28, 37, 38, 43). After this 2 h period, the fish seemed to have stopped exploring the new tank and showed a calm behavior. To avoid a possible time of day effect on the escape response, all fish were tested in the morning (44).
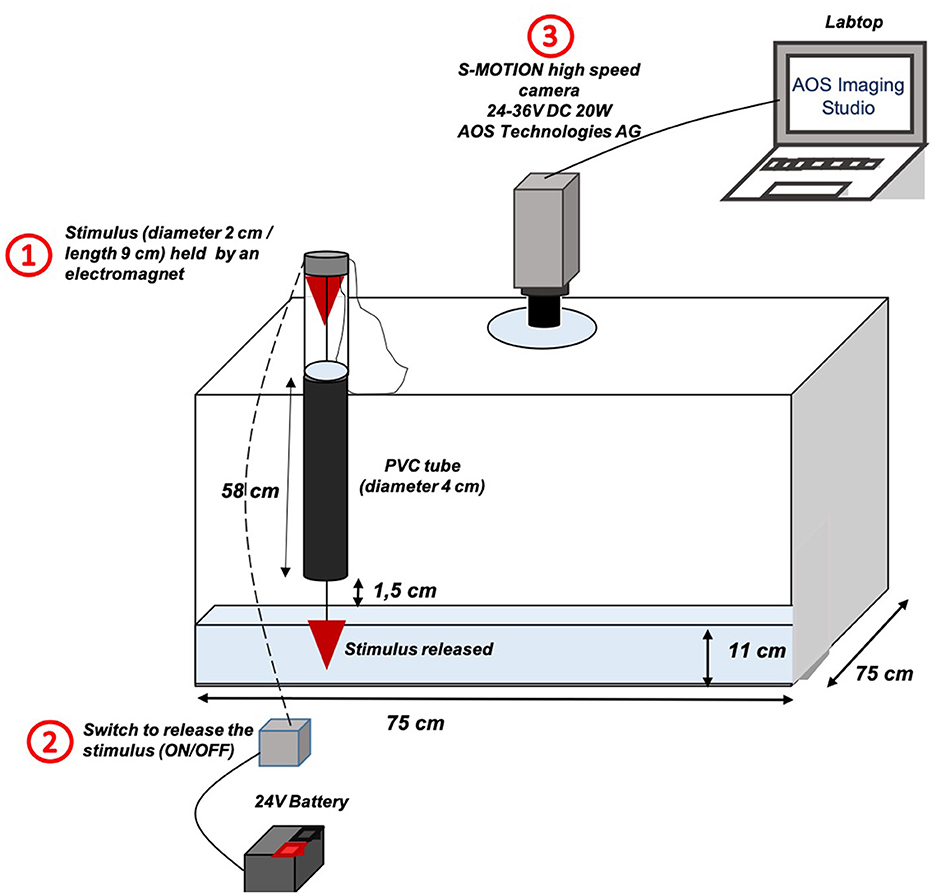
Figure 1. Schematic diagram of the setup for the Chelon auratus escape response experiment. The escape response of the individuals was triggered by the release of a stimulus (1) into an experimental tank. This release was done by activating a switch (2) connected to an electromagnet, which allowed the stimulus to be fixed. The stimulus is then released and passes through a black PVC tube before being immersed in the water. Simultaneously with the activation of the switch, a video of the escape response was manually recorded by a high-speed camera (3) connected to a laptop computer using the OAS Imaging Studio software.
The experimental tanks were covered with an opaque lid and surrounded by a black tarpaulin to keep the fish in a quiet environment as much as possible. The escape response of the individuals was triggered by the release of a stimulus (diameter: 2 cm; length: 9 cm). The stimulus was held above the experimental tank by an electromagnet. When released, the stimulus passed through a black PVC tube (length: 58 cm; diameter: 4 cm) before dropping into the water, without touching the bottom of the tank. The black tube ensures that the stimulus is not seen by the fish as it falls, mimicking an aerial attack by predator in a naturally turbid or shallow environment (28), which is commonly frequented by mullets. This tube is also essential for determining the exact moment of stimulation (i.e., t0). The escape response was recorded using a high-speed camera (S-MOTION, 500 fps-1, 24–36 V DC 20 W, AOS Technologies AG) connected to a laptop with OAS Imaging Studio software.
The protocol was formulated with three requirements to trigger the stimulus (28): (1) it is necessary that the fish was positioned at more than 1 body length from the nearest wall in order to avoid influencing its escape direction, (2) its velocity must be lower than 2 body lengths s−1, and (3) there must be no waves on the water surface. Based on the video analyses, we were able to verify that the distance between the impact of the stimulus on the water surface and the center of mass (CM) of the animal was not significantly different between the two experimental dietary groups (t = −0.91939; df = 15; p = 0.3724). The CM was positioned on the videos according to Lefrançois et al. (28) on the same species, and corresponds to a dorsal point located 1/3 of the body length from the snout, which generally corresponds to the center of the segment between the two pectoral fins.
2.3.2 Video analysis and measured variables
Responsiveness was calculated for both experimental conditions (SH and LH) and corresponds to the proportion of fish that responded to the stimulation with a sudden acceleration (in %). Individuals showing no movement at the time of stimulation were considered as non-responders. Only the videos of fish showing an escape response were then analyzed using the WINanalysis software, which allows a decomposition of the different frames of the video (1 frame = 2 ms). The variables analyzed for each individual were:
• The latency (ms), corresponding to the time interval between the impact of the stimulus on the surface (t0) and the first escape movement (t1).
• The direction of escape, which was classified as “away” or “toward” depending on whether the first detectable movement of the head was oriented away or toward the stimulus, respectively (25).
• Total escape duration (ms), which was determined as the sum of stages 1 and 2 as described in Lefrançois et al. (28).
• The distance-time variables were calculated over the mean escape duration over which the kinematic variables were measured, i.e., 62 ms. For each video sequence, the x and y co-ordinates of the CM were digitized exported to WINanalyze software to perform automatic tracking of the fish's movements. We then evaluated:
- The maximum acceleration Amax.
- The maximum velocity Vmax.
- The cumulative distance Dcum.
- Dcum92, which was calculated as the cumulative distance over the duration of the mean latency added to the mean duration of the total escape response, i.e., over a total of 92 ms (28).
• The turning rate (° ms−1), which was calculated as the angle (in °) of the line passing through the CM and the tip of the head of each individual, between the start of the escape response and the end of stage 1, divided by the time taken to complete stage 1 (31, 38). The higher it is, the greater the maneuverability of the fish.
After stimulus release and video recording of the two fish, individuals were individually netted and anesthetized (MS-222, Sigma-Aldrich, St Quentin-Fallavier, France; 0.1 g L−1) in seawater. Fish were electronically identified (transponder), weighed and measured as described above. They were sacrificed by a prolonged anesthesia and dissected on ice to remove muscle and whole brain (five lobes) for further fatty acid analyses. Samples of white skeletal muscle were taken between the lateral and dorsal lines of dorso-ventral symmetry and between the head of the fish and its dorsal fin. All biological tissues collected were weighed (g), and stored in liquid nitrogen before being stored at −80°C until fatty acid analysis. The liver was removed and weighed for assessment of the hepatosomatic index HSI using Equation (1):
where W liver is the liver weight and W fish is the fish weight.
The Fulton index (FI) was determined using Equation (2) (45):
where W is the fish weight in g and L the total fish length in cm.
The specific growth rate (SGR, % day−1) was calculated for each fish using Equation (3):
where weight was in g, and duration of dietary conditioning was in days.
2.4 Lipid analysis
2.4.1 Lipid extraction
Lipids from fish muscle and brain (LH: n = 12; SH: n = 11 per tissue) were extracted according to the method of Mathieu-Resuge et al. (46). Briefly, tissues were ground to a fine homogeneous powder in liquid nitrogen. Lipids from 200 to 250 mg of tissue powder were then extracted in 6 ml of chloroform/methanol mixture (2:1; v/v). To ensure complete lipid extraction, samples were sonicated at 4°C for 2 × 5 min. Lipids from experimental diets (n = 3 per diet) were extracted using the same method. Pellets were ground in a mortar and the powder was transferred to chloroform/methanol (2:1; v/v). All lipid extracts were then stored at −20°C in a nitrogen atmosphere until further analysis.
2.4.2 Separation of neutral lipids and polar lipids
Fatty acids of biological membranes are attached to a polar head group, collectively called polar lipids (PL), in contrast to fatty acids of energy stores that form triglycerides, which are called neutral lipids (NL). Brain and muscle lipids were separated into NL and PL fractions by solid-phase extraction following the method described in Mathieu-Resuge et al. (46). Briefly, an aliquot of the total lipid extract (1/6) was evaporated to dryness under nitrogen, recovered with three washes of 0.5 ml of chloroform/methanol (98:2; v/v) and applied to the top of a silica gel column (40 × 4 mm, silica gel 60A 63–200 μm) previously heated at 450°C and deactivated with 6 wt % H2O. NL were eluted with 10 mL of chloroform/methanol (98:2; v/v) and PL were eluted with 20 mL of methanol. After the addition of 2.3 μg of an internal standard (tricosanoic acid C23:0) to each of the lipid fractions, they were stored at −20°C in a nitrogen atmosphere.
2.4.3 Lipid transesterification
Lipid transesterification was performed as described in Mathieu-Resuge et al. (46). Both neutral and polar lipid fractions were evaporated to dryness under nitrogen. Fatty acid methyl esters (FAME) were obtained by adding 800 μL of H2SO4/methanol (3.4%; v/v) and heating at 100°C for 10 min. FAME were then extracted in 800 μL of hexane and washed three times with 1.5 ml of distilled water saturated with hexane.
2.4.4 Gas chromatography analysis of FAME
FA composition was analyzed by GC coupled with Flame-Ionization Detector (GC-FID), as described by Mathieu-Resuge et al. (46), using a Varian CP8400 gas chromatograph. After splitless mode injection, FAMEs were separated in parallel on two different columns (DBWAX 30 m × 0.25 mm ID × 0.2 μm and DB5 30 m × 0.25 mm ID × 0.2 μm, Agilent). FAMEs were identified by comparison of their retention times with those of commercial standards (Supelco 37 Component FAME Mix, PUFA No. 1 and No. 3, and Bacterial Acid Methyl Ester Mix, Sigma) and laboratory prepared standard mixtures. The internal standard (C23:0) allowed the calculation of FA content (μg mg −1 muscle wet mass). For each PL and NL fraction, the fatty acid proportion was then determined as the percentage of fatty acid mass per total mass of fatty acids in each fraction.
2.5 Statistical analyses
All statistical analyses were carried out with Rstudio® software (Version 1.1.423; Boston, USA).
It was possible to measure an escape response on seven out of 11 SH fish and on 10 out of 12 LH fish. The reason why some fish could not have been tested is that they were not correctly positioned in the tank within the time limit of the experiment (8:00–13:00) to be stimulated, or displayed an extremely long latency (382 and 224 ms), which did not seem to correspond to escape responses by acoustic-mechanical stimulation (on average between 5 and 40 ms; 24) but rather by visual stimulation (47).
The distance between the CM and the point at which the stimulus touched the water surface has been compared between the two dietary groups using a t-test, and was not significantly different between treatment (LH: 319.22 ± 47.49 mm; SH: 380.78 ± 52.55 mm; t-test, p = 0.37, F = 15), indicating that fish were randomly placed in the tank before stimulation.
Responsiveness was compared between the two dietary groups using a G-test (R package DescTools). The escape direction was statistically compared to the theoretical value of 50% of “away” and “toward” response using a binomial test (31, 48).
The effect of diet on other escape response variables (latency, turning rate, duration, and kinematics in terms of maximum acceleration, maximum velocity, cumulative distance, and turning rate), as well as on growth and condition parameters was statistically tested using linear model (lm; 49). The models' conditions of application have been visually inspected on residuals with quantile-quantile plots. The processing batch (testing day) and fish tanks were included as potential covariate in initial analysis. Each of these variables were not significant, so were removed from all the final models.
The fatty acid composition of brain and muscles were compared between the two-dietary groups using a two-way ANOVA (diet and tissue). When an interaction occurred, a Tukey HSD test was performed.
Our whole dataset (escape responses variables and fatty acid composition) was explored with PCA presented in Supplementary material (R package Factoshiny). Correlations between variables were then tested using Spearman correlations (R package ggplot2, ggpubr, gridExtra, cowplot, and gridGraphics), as Spearman correlation works with both linear and monotonic relationships.
3 Results
3.1 Fish biometric and condition variables
All individuals gained weight during the experiment, as shown by a positive SGR, and the SGR was not different between the two groups (Table 2). Final body mass did not differ between SH and LH fish (Table 2), eliminating body mass as a confounding source of differences in escape response between the dietary treatments. Fish from the two experimental groups (LH and SH) did not differ significantly neither in other growth traits considering length, height, and width, nor in body condition indices (HSI and FI, Table 2; linear model; p ≥ 0.05).
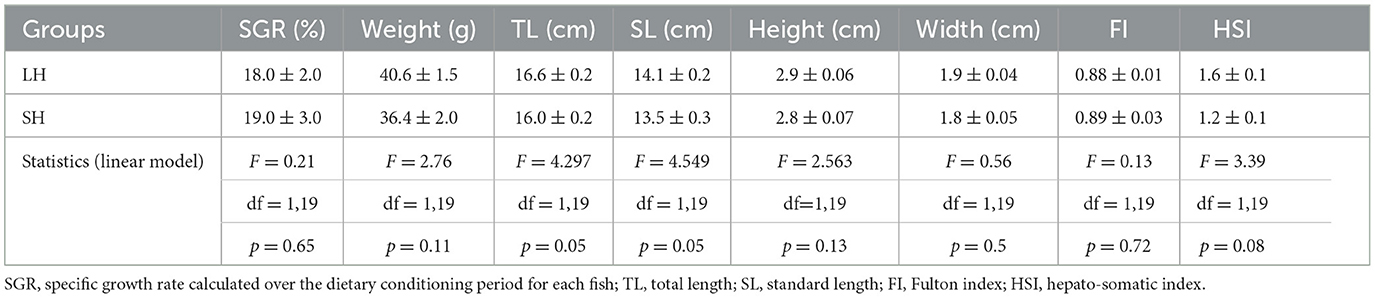
Table 2. Fish growth and body condition variables in both experimental groups, at the end of the 2-month conditioning period (LH: low n-3 HUFA diet, n = 12 and SH: standard n-3 HUFA diet, n = 11), mean ± standard error.
3.2 Effect of dietary treatment on fatty acid composition of brain and muscle
The fatty acid composition of the NL and PL fractions of fish brain and muscle is shown in Table 3.
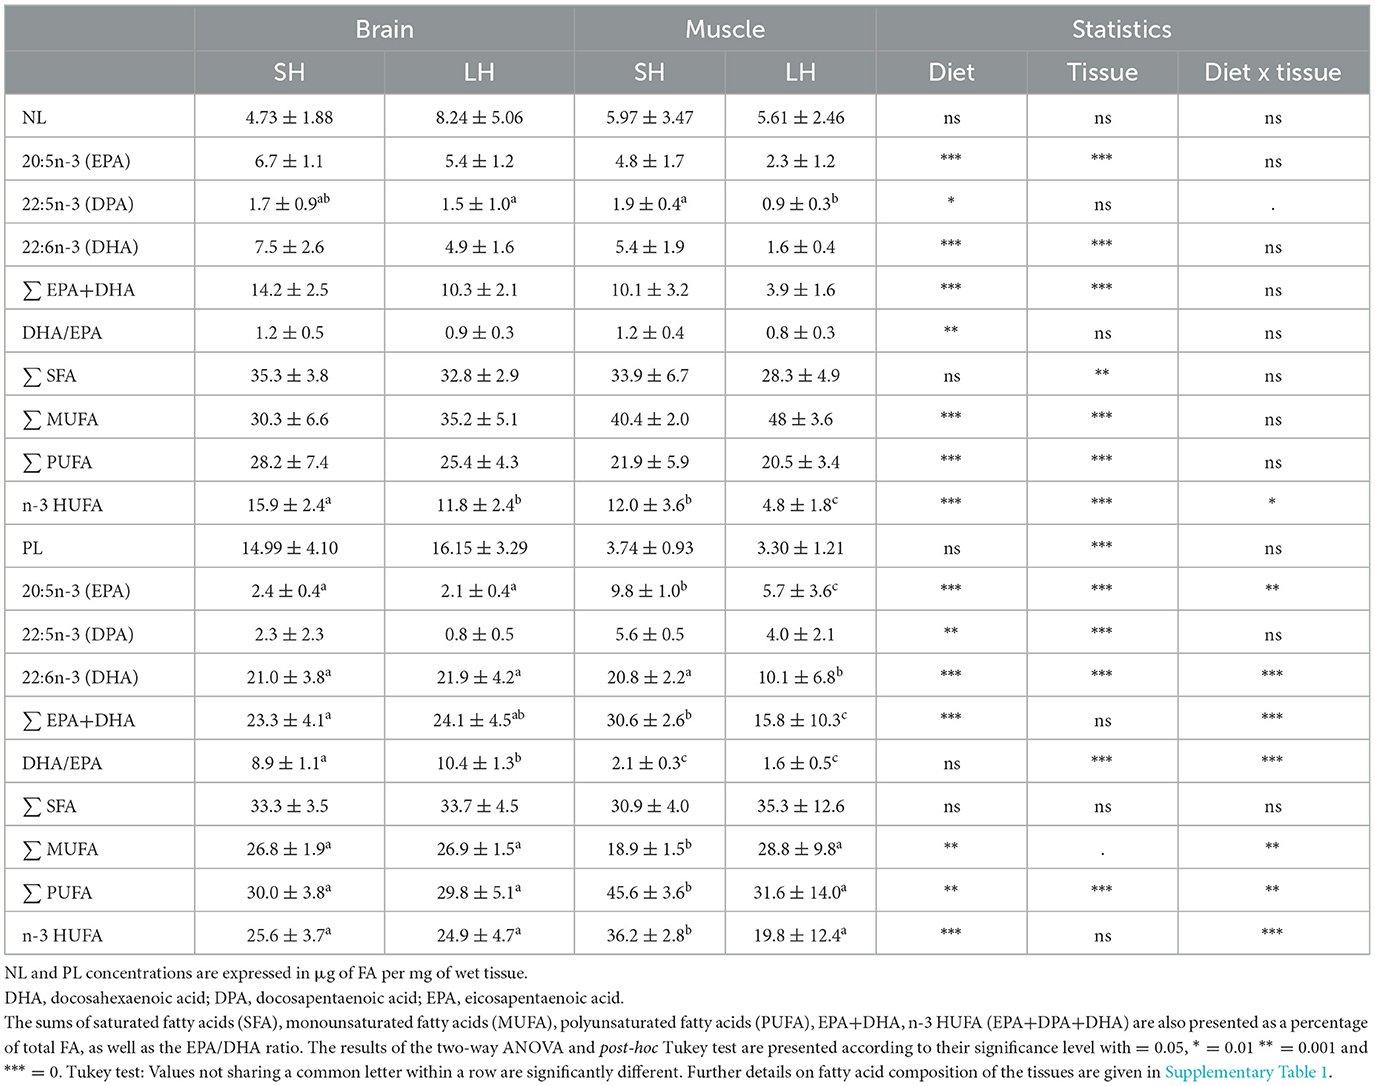
Table 3. Composition of fatty acids of interest as a percentage of total fatty acids in neutral lipids (NL) or polar lipids (PL), expressed as mean ± standard deviation in brain and muscle of fish fed the standard n-3 HUFA diet (SH fish, n = 11) and those fed the low n-3 HUFA diet (LH fish, n = 12).
PL was the major lipid fraction of brain tissue, with a concentration about 5 times higher in brain than in muscle, whereas muscle was equally composed of NL and PL.
DHA was preferentially incorporated into PL rather than in NL in both muscle (F = 41.69; p < 0.001) and brain (F = 41.69, p < 0.001).
EPA was also preferentially incorporated into PL rather than in NL in muscle (F = 27.12, p < 0.001), but not in brain where it was preferentially incorporated in NL (F = 177.4, p < 0.001).
In muscle, the fatty acid composition reflected that of the diet. Muscle from LH fish had lower levels of EPA and DHA contents, as well as lower DHA/EPA, Σ EPA + DHA and Σ n-3 HUFA in both the PL and NL fractions compared to SH fish. In the brain, the dietary fatty acid composition was reflected in the NL fraction, but not in the PL fraction, where we observed that EPA, DHA, Σ n-3 HUFA, and Σ PUFA contents remained similar between the two dietary groups. In addition, the DHA/EPA ratio was significantly the highest in the PL brain of LH fish (Table 3).
Overall, strong inter-individual variability in fatty acid composition was observed within each dietary group, with some LH individuals showing similar EPA and DHA proportions to SH fish, especially in brain PL, brain NL and muscle NL.
3.3 Escape response performance
3.3.1 Responsiveness, latency, escape response duration, and directionality
Responsiveness did not differ between the two groups, with a total of 83% of the LH individuals responding to the stimulus, vs. 78% for the SH group (Chi-test: G = 0.10 e-31, df = 1, p = 0.75).
Among the responding fish, a total of 60% of the LH fish and 86% of the SH fish escaped away from the stimulus. These values were not statistically different from the random theoretical value of 50% of “away” and “toward” responses (LH binomial test; p = 0.377; SH binomial test: p = 0.06; 31).
The latency did not differ between the two groups (lm; F = 0.66; df = 1;15; p = 0.43, Figure 2) and was 27.4 ± 4.8 ms for the LH group, vs. et 32.9 ± 4.0 ms for the SH group (mean ± sem).
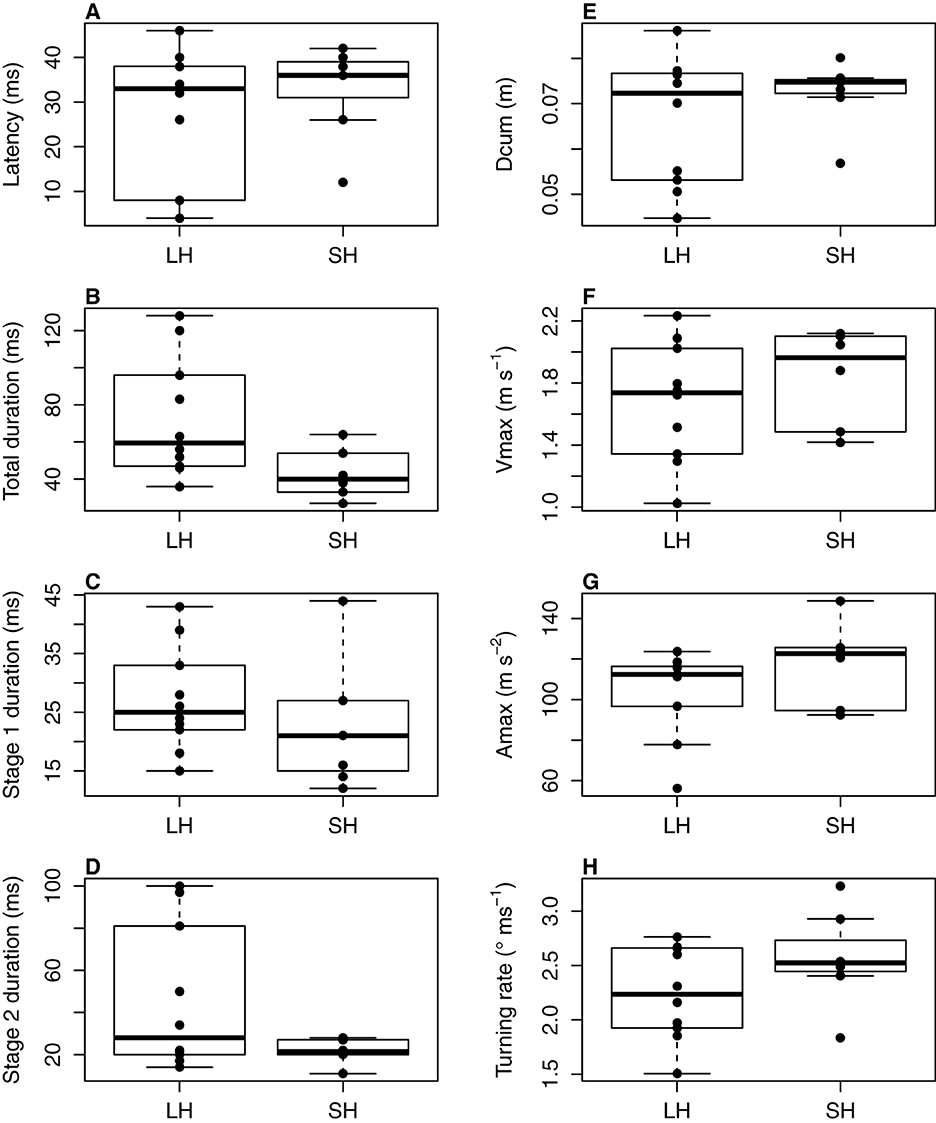
Figure 2. Escape response variables of mullets fed two contrasting diets (LH diet: low n-3 HUFA diet, n = 10; SH diet: standard n-3 HUFA diet, n = 7). Latency in ms (A), escape response duration in ms (B: total duration; C: duration of stage 1; D: duration of stage 2), cumulative distance Dcum in m (E); maximum velocity Vmax in m s−1 (F); maximum acceleration Amax in m s−2 (G); turning rate in ° ms−1 (H). Dcum, Amax and Vmax were calculated over the mean escape duration during which kinematic variables were measured, i.e., 62 ms.
Irrespective of the escape phase considered (stage 1, stage 2 or both; Figure 2), the duration was not significantly different between the two groups (lm for total duration: F = 4.44, df = 1;14, p = 0.053; stage 1 duration: F = 0.72, df = 1;15, p = 0.41; stage 2 duration: F = 2.81, df = 1;14, p = 0.12), with the total duration of the escape response ranging from 36 to 128 ms (mean 73 ± 10 ms) for the LH group and from 32 to 64 ms (43 ± 6 ms) for the SH group.
3.3.2 Kinematic variables and turning rates
All fish, except one SH fish, responded with a double bend response, characterized by a C-shape resulting from the contraction of the muscles on one side of the body (stage 1), which is followed by a return flip of the tail, presumably as a result of a contralateral contraction (stage 2; 31).
Stage-1 turning rate was not affected by diet (lm: F = 2.30; df = 1;15; p = 0.15; Figure 2) and was 2.56 ± 0.66 degrees min−1 (mean ± sem) for SH fish and 2.24 ± 0.13 degrees min−1 (mean ± sem) for LH fish.
Diet had no effect on cumulative distance, maximum velocity, or maximum acceleration (Figures 2E–G). Cumulative distance traveled was not different between the two dietary groups, whether or not latency was included in the mean total duration of the escape response (lm: Dcum: F = 1.02, df = 1; 15, p = 0.33; Dcum92: t = 0.77, df = 1;15, p = 0.39). Mean Dcum was 7.2 ± 0.2 cm for SH fish and 6.6 ± 0.4 cm for LH fish, and mean Dcum92 was 12.0 ± 1.0 cm for SH fish and 11.0 ± 0.9 cm for LH fish. Mean maximum velocity was 1.84 ± 0.09 m s−1 for SH fish and 1.68 ± 0.12 m s−1 for LH fish (lm: F = 0.81, df = 3; 13, p = 0.51). The mean maximum acceleration of SH fish was 117.8 ± 6.3 m s−1 vs. 103.2 ± 6.8 m s−1 for LH fish (lm: F = 0.71, df = 3;13, p = 0.56; Figure 2).
Overall, all the escape response variables presented in Figure 2 showed a higher inter-individual variability in the LH group than in the SH group, which may have prevented the determination of a significant difference between these two dietary groups. We therefore investigated the correlations between the proportions of n-3 HUFA (EPA+DHA+DPA), EPA, DPA, DHA, EPA+DHA, and the DHA/EPA ratio in fish tissues (brain and muscle) and fraction (PL and NL) and the measured escape response variables.
3.3.3 Relationships between escape response variables and brain fatty acid composition in fish
Spearman correlation tests showed significant correlations between escape response variables and n-3 HUFA proportion in PL of brain (Figure 3). More specifically, escape response duration was negatively correlated with n-3 HUFA proportion (Figure 3A), latency was positively correlated with EPA (Figure 3B), and turning rate and maximum velocity were both negatively correlated with DHA/EPA ratio (Figures 3C, D).
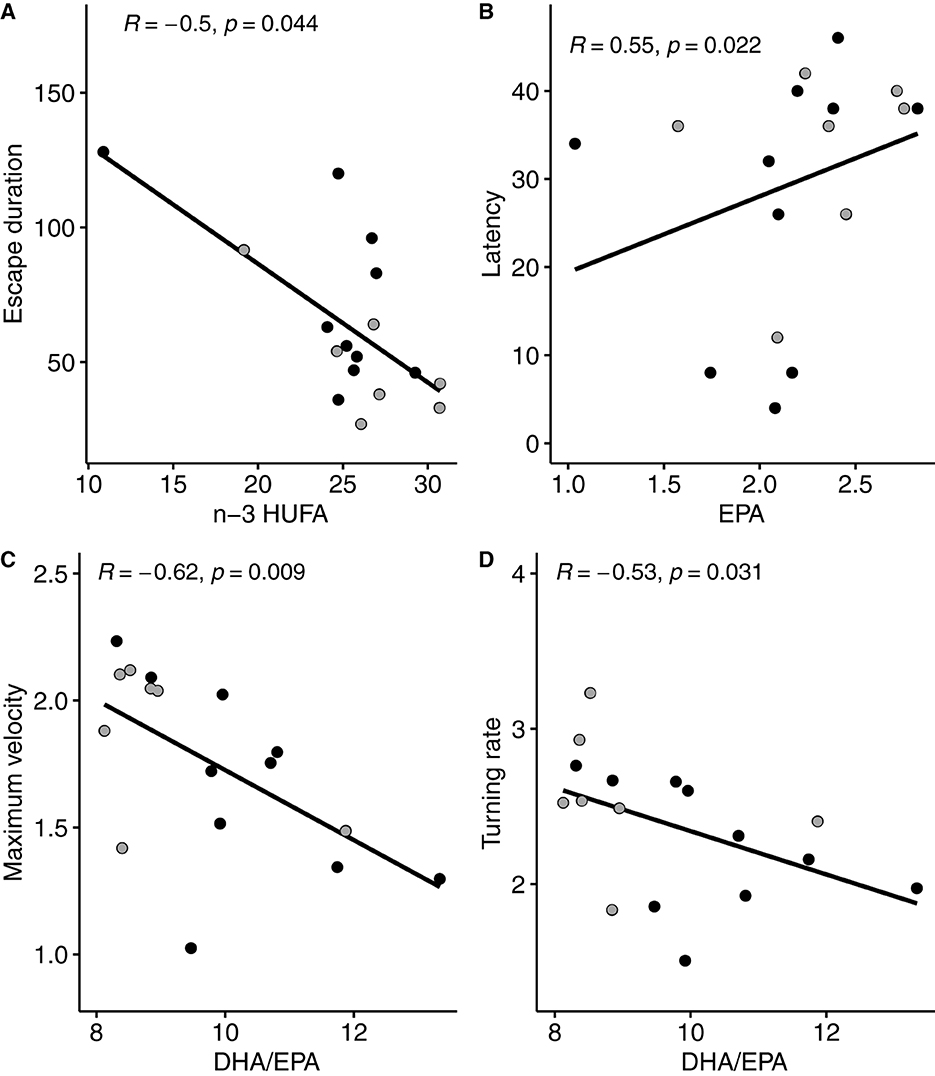
Figure 3. Significant relationships (Spearman correlation) measured between escape response variables and fatty acid composition in brain polar lipids (as % of total fatty acids in the polar fraction). Escape response duration (A) is expressed in ms, latency (B) in ms, maximum velocity (C) in ms–1 and turning rate (D) in ° ms−1. Gray areas represent the 95% confidence interval. DHA, docosahexaenoic acid 22:6n-3; EPA, ecosapentaenoic acid 20:5n-3; n-3 HUFA is the sum of DHA, EPA, and DPA (docosapentaenoic acid 22:5n-3). Black dots represent individuals (n = 10) fed the LH (low n-3 HUFA) diet, and dark gray dots represent individuals (n = 7) fed the SH (standard n-3 HUFA) diet.
We also observed significant correlations between escape response variables and brain FA composition in NL, that were different from those observed in brain PL (Supplementary Figure 2B, Figure 4). Cumulative distance was positively correlated with EPA. Turning rate and maximum velocity were both positively correlated with n-3 HUFA content. Maximum velocity was also positively correlated with the sum of EPA+DHA.
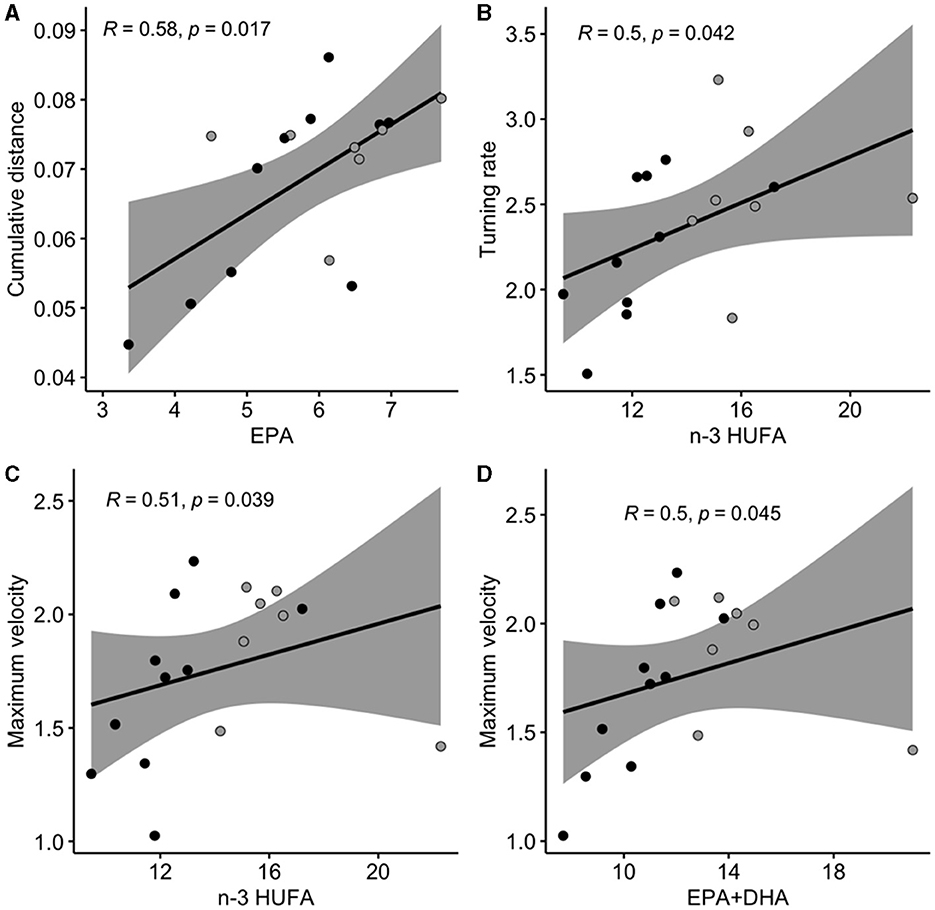
Figure 4. Significant relationships (Spearman correlation) measured between escape response duration variables and fatty acid composition in brain neutral lipids (as % of total fatty acids in the neutral fraction). Cumulative distance (A) is expressed in cm, turning rate (B) in ° ms−1, maximum velocity (C, D) in ms−1. Gray areas represent the 95% confidence interval. DHA, docosahexaenoic acid 22:6n-3; EPA, ecosapentaenoic acid 20:5n-3; n-3 HUFA is the sum of DHA, EPA, and DPA (docosapentaenoic acid 22:5n-3). Black dots represent individuals (n = 10) fed the LH (low n-3 HUFA) diet, and dark gray dots represent individuals (n = 7) fed the SH (standard n-3 HUFA) diet.
3.3.4 Relationships between escape response variables and muscle fatty acid composition in fish
The duration of the escape response was negatively correlated with DHA and n-3 HUFA in PL of the muscle (Figure 5).
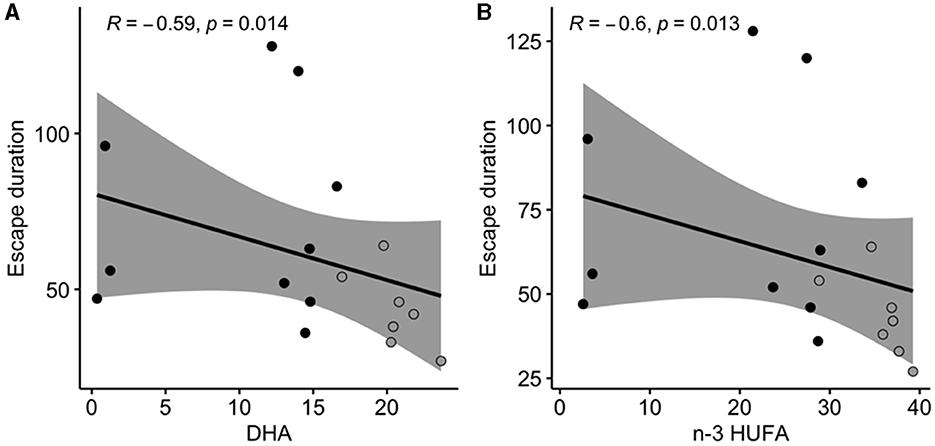
Figure 5. Significant relationships (Spearman correlation) measured between escape response duration (in ms) and DHA (docosahexaenoic acid 22:6n-3; A), or n-3 HUFA (sum of DHA, EPA eicosapentaenoic acid 20:5n-3, and DPA docosapentaenoic acid 22:5n-3; B) composition in muscle polar lipids (as % of total fatty acids in the polar fraction). Gray areas represent the 95% confidence interval. Black dots represent individuals (n = 10) fed the LH (low n-3 HUFA) diet, and dark gray dots represent individuals (n = 7) fed the SH (standard n-3 HUFA) diet.
In terms of muscle NL (Figure 6), turning rate and maximum acceleration were both positively correlated with EPA, and n-3 HUFA content. In addition, the turning rate was positively correlated with DPA and DHA.
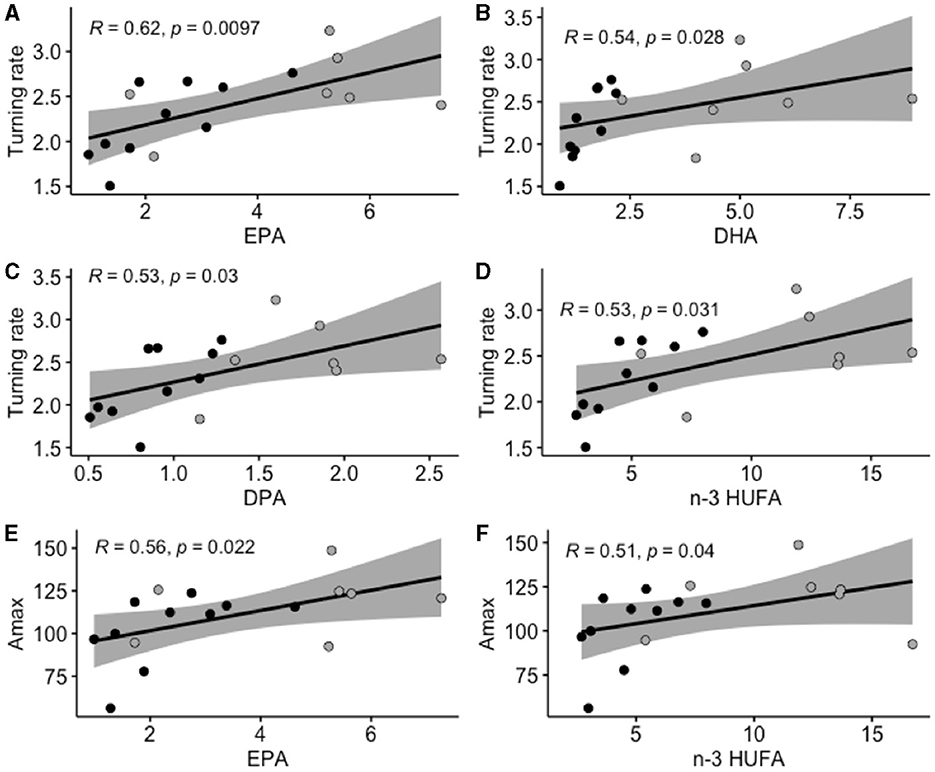
Figure 6. Significant relationships (Spearman correlation) measured between escape response variables (turning rate and maximum acceleration) and fatty acid composition in muscle neutral lipids (as % of total fatty acids in the neutral fraction). Turning rate (T. rate; A–D) is expressed in ° ms−1, and maximum acceleration (Amax; E, F) is expressed in m s−2. Gray areas represent the 95% confidence interval. DHA, docosahexaenoic acid 22:6n-3; EPA, ecosapentaenoic acid 20:5n-3; n-3 HUFA is the sum of DHA, EPA, and DPA (docosapentaenoic acid 22:5n-3). Black dots represent individuals (n = 10) fed the LH (low n-3 HUFA) diet, and dark gray dots represent individuals (n = 7) fed the SH (standard n-3 HUFA) diet.
4 Discussion
After 2 months of nutritional conditioning at 20°C, a lower dietary n-3 HUFA content caused a significant reduction of the proportion of these fatty acids in fish muscle, in both PL and NL fractions. While the FA composition of the brain also reflected that of the diet in NL, PL fatty acid composition in brain remained similar between both dietary groups, suggesting the preservation of neural and cognitive functions of fish (38, 50–52).
Greater variability was measured in the LH group compared to the SH group for most of the escape response variables measured, and fatty acid composition was highly variable between individuals within each dietary group. This may have prevented the detection of a significant difference between these two groups. However, our results show strong correlations between some escape response variables and n-3 HUFA content in fish tissue, regardless of diet. In particular, we showed that a low dietary n-3 HUFA content in fish tissue would alter the escape response by prolonging its duration, reducing maximum velocity and acceleration, and reducing turning rate. Lower levels of EPA content in fish tissue would also reduce both latency and cumulative distance traveled. These correlations seemed to be highly dependent on the tissue (muscle or brain), and the lipid fraction (PL or NL) considered.
It is interesting to note that the values of Dcum, Vmax, and Amax obtained in our study are in the lower range of that found by Lefrançois et al. (28) in the same species. In particular, our values are in the same range as those found by these authors in fish exposed to 10% hypoxia without any surface access. However, these authors used longer fish than those tested here (about 21 vs. 16 cm). Acceleration, velocity and distance covered have been shown to be size-dependent and to increase with size in relation to changes in morphology (23). In addition, the mean turning rate was higher in our study, indicating a higher maneuverability of fish, which is in accordance with the higher maneuverability of smaller fish than of larger ones (23).
4.1 Growth parameters
Biometric data (weight, total length, height, and thickness), and condition indices (HSI, FI) showed no significant differences between the two experimental groups. In a previous study carried out on the same species, with the same diets, and at the same temperature, but during a 5-month period of feed conditioning (compared to 2 months in the present study), we found a higher growth rate in SH individuals than in LH individuals, which became apparent only at the end of the exposure period (17). Thus, it could be argued that if the fish in the present study had been fed their experimental diets for a longer period, they might have shown a different growth rate between the two groups. Looking at the large variability in several escape response variables in the LH group, it could also be argued that a longer period of dietary conditioning may have induced a difference in escape response performance between the two groups. In addition, we cannot rule out the possibility that the large variability in several escape response variables could be due to the individual personality of the fish, but we did not statistically measure the effect of this factor (53, 54). For example, Jones and Godin (54) reported a positive correlation between the duration of exploration of the novel environment and the time taken to respond to the stimulus. The faster the fish explored the new tank, the slower they responded to the stimulus.
4.2 Responsiveness and direction of escape response were similar in both dietary groups
Neither responsiveness nor directionality (“toward” or “away” from the stimulus) was influenced by the n-3 HUFA composition of the diet.
The majority of individuals in both groups (SH: 78% and LH: 83%) responded with an escape response to the mechano-acoustic stimulation. Ecologically, the absence of an escape reflex response from an organism is directly related to a very high probability of its capture by a predator. The absence of a response in some individuals could be due to a lack of transmission of the detected stimulus to the muscle via the motor neuron of the excited Mauthner cell. It could also be related to the failure to reach a necessary threshold of stimulation. This threshold is known to depend on the intensity of the startle stimulus and on inter-individual variability in sensitivity (23). Here, as a standardized stimulus was used, and the distances between the tube and the fish were similar, it could be assumed that for some individuals this threshold was not reached due to possible inter-individual sensitivity.
The direction of escape of all the individuals was predominantly in the opposite direction to the position of the stimulus, which is consistent with what has been already observed in previous work on the same species (28), and in the majority of studied species (23). Escaping in the opposite direction to the predator is expected to increase survival. This has usually been observed in almost 90% of cases (23), and always in more than 80% of cases (28, 55, 56). However, in the present study, only 60% of LH fish escaped in the opposite direction of the stimulus (compared to 86% of SH fish). This could be explained by the position of some fish when the stimulus fell. If the position of the fish (defined by the center of mass and the head) is relatively aligned with that of the stimulus, the fish will have approximately the same chance of survival regardless of which side it escapes from. When the escape directions were analyzed, one LH individual showed this very low angular position in relation to the stimulus. Another LH fish already showed a clear curvature of the body toward the stimulus at the time of stimulation, which explains its escape direction toward the stimulus.
The responsiveness and directionality of the escape response depend on the functionality of the Mauthner cell and the transmission in the M-cell circuits. Interestingly, the lack of significant difference in these variables between the two dietary groups was associated with a similar FA composition of brain membranes (PL) in the two dietary groups. This similar FA composition between the two dietary groups would suggest that the composition, and thus the functionality, of the Mauthner cells responsible for the reflex response, was not altered by the n-3 HUFA dietary conditioning, and contributed to maintaining similar responsiveness and directionality between the two groups. This similar composition of brain membranes would result from a high selective retention of certain fatty acids in the brain, ensuring the protection of the neural circuit, despite the n-3 HUFA dietary deficiency. This is in line with other findings in striped snakehead (Channa striata; 52), sea bream (38, 51), and European seabass (Dicentrarchus labrax; 50), in which brain tissue showed the highest capacity to regulate DHA content in PL, despite the low dietary concentration of this FA, thus preserving brain functionality.
4.3 Latency, escape response duration, and kinematic variables are correlated with n-3 HUFA composition in fish tissue
While no differences were found when examining the effects of dietary treatment at the group level, inter-individual variation in brain FA composition was observed and correlated with some escape performance variables such as escape duration, latency, maximum velocity, and turning rate.
In particular, the higher the DHA/EPA ratio content in the brain membrane, the lower the maximum velocity and turning rate. This lower velocity and maneuverability of the fish would suggest a better success of predators in catching their prey. We also showed that the higher the EPA proportion in the brain membrane, the slower the reactivity of fish to the stimulus. This could also be detrimental to the survival of the fish, as a longer latency of the prey would increase the chances of the predator catching the prey. Although specific neurobiological studies may be required to clarify this point, it suggests that the level of EPA may influence the time course of the neural signal to initiate the escape response. However, it is important to note that, while a short response latency is beneficial for the fish to escape from the predator, it also induces a high state of readiness to escape (vigilance), which results in a high anaerobic metabolic demand to escape. As a consequence, this induces a longer aerobic recovery period after escape. Thus, there is a trade-off between the increased vigilance and the metabolic demand (57). The longer latency that correlates with higher EPA levels in brain PL may indicate lower vigilance as EPA increases, and thus a lower metabolic demand for the escape response, with a further shorter aerobic recovery period after escape. However, further studies would be needed to investigate this hypothesis.
The duration of the escape response also appeared to be highly dependent on the n-3 HUFA content in the membranes, and especially on DHA. The lower the n-3 HUFA content in muscle and brain membranes, the longer the response. A longer duration of the escape response may increase the energetic cost required for an individual to escape from a predator. The mean escape response duration of the LH individuals was almost 60% longer than that of the SH individuals, which was at the limit of significance. These values are well within the range of mean response durations (between 32 and 200 ms for a panel of 14 different fish species) summarized by Domenici and Blake (25). Our results indicate that it is at stage 2 of the escape response that the differentiation (limit of significance) in the total duration of the escape response between the two experimental groups occurs, with LH individuals tending to perform a longer stage 2 than SH individuals. Stage 2 of the escape response corresponds to the contralateral activity of the muscle after activation of the Mauthner cells. Thus, our results would suggest that a lower content of n-3 HUFA, and especially DHA, in the muscle membrane may increase the duration of the contralateral activity.
While response duration and latency seemed rather correlated to n-3 HUFA content in the brain membrane, other escape response variables such as turning rate, maximum velocity, as well as cumulative distance and maximum acceleration appeared to be correlated with the n-3 HUFA content in the lipid reserve, in both in the brain and in the muscle. Lower levels of n-3 HUFA, and especially lower levels of EPA and DHA in the lipid reserve tended to reduce maximum velocity, turning rate, and maximum acceleration. As lipid reserves are usually used as energy stores, these results suggest the use of EPA and DHA as an energetic fuel to promote escape response performance. The escape response is primarily fuelled by anaerobic metabolism. During the early stage of the escape response, energy is provided by the breakdown of adenosine triphosphate (ATP) and creatine phosphate (PCr), whereas during later stages of the response, energy is provided by glycogenesis (58). Our results suggest that the depleted DHA and EPA stores caused by the depleted n-3 HUFA diet would reduce muscle ATP production, and in cascade, the ATP breakdown required to fuel the escape response. A similar hypothesis has been raised in some previous studies, which reported that long-term starvation (~4 weeks) reduced fatty acid stores in the lipid reserve in some fish species, decreasing ATP and PCr in the muscles, and consequently reducing their fast-start swimming performance, in terms of maximum velocity and acceleration, cumulative distance, and turning rate (59–62).
5 Conclusion
Our results suggest that n-3 HUFA content in reserves and membranes of both muscle and brain tissues is involved in the regulation of escape response performance. The reduction of n-3 HUFA, and especially EPA and DHA in dietary sources of marine fish seems to contribute to the reduced performance of the escape response, by reducing the maximum velocity and acceleration, and the turning rate, probably because it prevents to get the energy needed in muscle to maintain this performance. Also, a dietary reduction in n-3 HUFA would prolong the duration of the response, which may result in a higher energetic cost. However, this cost could be compensated by performing a lower velocity, acceleration and turning rate. Finally, a dietary reduction n-3 HUFA would slow down the reactivity of the fish. These results may suggest some impact of EPA and DHA dietary changes with global change on the predator-prey relationships within the marine ecosystem. However, the large inter-individual variability obtained in the depleted groups compared to the standard groups needs to be further investigated to better understand the mechanisms involved in coping with this dietary depletion.
Data availability statement
The raw data supporting the conclusions of this article will be made available by the authors, without undue reservation.
Ethics statement
The animal study was approved by Departmental Service of Fisheries and the Animal Care Committee of France (#12886), respectively (N° APAFIS 2017122208475172). The study was conducted in accordance with the local legislation and institutional requirements.
Author contributions
MV: Conceptualization, Data curation, Investigation, Methodology, Supervision, Writing – original draft, Writing – review & editing. SD: Conceptualization, Data curation, Investigation, Writing – original draft. NG: Data curation, Investigation, Writing – review & editing. FL: Data curation, Investigation, Methodology, Supervision, Writing – review & editing. AB: Investigation, Methodology, Writing – review & editing. ED: Methodology, Writing – review & editing. CL: Conceptualization, Data curation, Investigation, Methodology, Software, Supervision, Writing – review & editing.
Funding
The author(s) declare that financial support was received for the research, authorship, and/or publication of this article. This work is a contribution to the project ECONAT Ax 1 -Ressources Marines Littorales: qualité et éco-valorisation, financed by the Contrat de Plan Etat-Région (CPER) and by the CNRS and the European Regional Development Fund (FEDER) through the project QUALIDRIS (Ressources Marines et Littorales: Qualité et Eco-valorisation).
Acknowledgments
The authors would like to thank Christine Dupuy for her key role in coordinating the funding projects, and José Luis Zambonino Infante for formulating the diets.
Conflict of interest
The authors declare that the research was conducted in the absence of any commercial or financial relationships that could be construed as a potential conflict of interest.
Publisher's note
All claims expressed in this article are solely those of the authors and do not necessarily represent those of their affiliated organizations, or those of the publisher, the editors and the reviewers. Any product that may be evaluated in this article, or claim that may be made by its manufacturer, is not guaranteed or endorsed by the publisher.
Supplementary material
The Supplementary Material for this article can be found online at: https://www.frontiersin.org/articles/10.3389/frish.2024.1394423/full#supplementary-material
References
1. Tocher D. Metabolism and functions of lipids and fatty acids in teleost fish. Revs Fish Sc. (2003) 11:107–84. doi: 10.1080/713610925
2. Cossins AR. Homeoviscous adaptation of biological membranes and its functional significance. In: Temperature Adaptation of Biological Membranes. London: A. R. Cossins (1994). p. 63–76.
3. Tocher DR. Omega-3 long-chain polyunsaturated fatty acids and aquaculture in perspective. Aquaculture. (2015) 449:94–107. doi: 10.1016/j.aquaculture.2015.01.010
4. Ishizaki Y. The effect of dietary docosahexaenoic acid on schooling behaviour and brain development in larval yellowtail. J Fish Biol. (2001) 58:1691–703. doi: 10.1111/j.1095-8649.2001.tb02323.x
5. Zuo R, Ai Q, Mai K, Xu W, Wang J, Xu H, et al. Effects of dietary docosahexaenoic to eicosapentaenoic acid ratio (DHA/EPA) on growth, nonspecific immunity, expression of some immune related genes and disease resistance of large yellow croaker (Larmichthys crocea) following natural infestation of parasites (Cryptocaryon irritans). Aquaculture. (2012) 334–7:101–9. doi: 10.1016/j.aquaculture.2011.12.045
6. Brett M, Müller-Navarra D. The role of highly unsaturated fatty acids in aquatic foodweb processes. Freshw Biol. (1997) 38:483–99. doi: 10.1046/j.1365-2427.1997.00220.x
7. Gladyshev MI, Sushchik NN, Makhutova ON. Production of EPA and DHA in aquatic ecosystems and their transfer to the land. Prostagland Other Lipid Mediat. (2013) 107:117–26. doi: 10.1016/j.prostaglandins.2013.03.002
8. Arts MT, Ackman RG, Holub BJ. “Essential fatty acids” in aquatic ecosystems: a crucial link between diet and human health and evolution. Can J Fish Aquat Sci. (2001) 58:122–37. doi: 10.1139/f00-224
9. Gladyshev MI, Arts MT, Sushchik NN. Preliminary estimates of the export of omega-3 highly unsaturated fatty acids (EPA + DHA) from aquatic to terrestrial ecosystems. in Lipids in Aquatic Ecosystems. New York, NY: Springer (2009). p. 179–211.
10. Kang JX. Omega-3: a link between global climate change and human health. Biotechnol Adv. (2011) 29:388–90. doi: 10.1016/j.biotechadv.2011.02.003
11. Crawford MA, Broadhurst CL. The role of docosahexaenoic and the marine food web as determinants of evolution and hominid brain development: the challenge for human sustainability. Nutr Health. (2012) 21:17–39. doi: 10.1177/0260106012437550
12. Taipale SJ, Vuorio K, Strandberg U, Kahilainen KK, Järvinen M, Hiltunen M, et al. Lake eutrophication and brownification downgrade availability and transfer of essential fatty acids for human consumption. Environ Int. (2016) 96:156–66. doi: 10.1016/j.envint.2016.08.018
13. Galloway AWE, Winder M. Partitioning the relative importance of phylogeny and environmental conditions on phytoplankton fatty acids. PLoS ONE. (2015) 10:e0130053. doi: 10.1371/journal.pone.0130053
14. Hixson SM, Arts MT. Climate warming is predicted to reduce omega-3, long-chain, polyunsaturated fatty acid production in phytoplankton. Glob Change Biol. (2016) 22:2744–55. doi: 10.1111/gcb.13295
15. Colombo SM, Rodgers TFM, Diamond ML, Bazinet RP, Arts MT. Projected declines in global DHA availability for human consumption as a result of global warming. Ambio. (2020) 49:865–80. doi: 10.1007/s13280-019-01234-6
16. Holm HC, Fredricks HF, Bent SM, Lowenstein DP, Ossolinski JE, Becker KW, et al. Global ocean lipidomes show a universal relationship between temperature and lipid unsaturation. Science. (2022) 376:1487–91. doi: 10.1126/science.abn7455
17. Vagner M, Zambonino-Infante JL, Mazurais D, Imbert-Auvray N, Ouillon N, Dubillot E, et al. Reduced n-3 highly unsaturated fatty acids dietary content expected with global change reduces the metabolic capacity of the golden grey mullet. Mar Biol. (2014) 161:2547–62. doi: 10.1007/s00227-014-2526-3
18. Vagner M, Lacoue-Labarthe T, Zambonino Infante J-L, Mazurais D, Dubillot E, Le Delliou H, et al. Depletion of essential fatty acids in the food source affects aerobic capacities of the golden grey mullet Liza aurata in a warming seawater context. PLoS ONE. (2015) 10:e0126489. doi: 10.1371/journal.pone.0126489
19. Vagner M, Pante E, Viricel A, Lacoue-Labarthe T, Zambonino-Infante JL, Quazuguel P, et al. Ocean warming combined with lower omega-3 nutritional availability impairs the cardio-respiratory function of a marine fish. J Exp Biol. (2019) 2019:jeb.187179. doi: 10.1242/jeb.187179
20. Garzke J, Forster I, Graham C, Costalago D, Hunt BPV. Future climate change-related decreases in food quality may affect juvenile Chinook salmon growth and survival. Mar Environ Res. (2023) 191:106171. doi: 10.1016/j.marenvres.2023.106171
21. Schall JD, Thompson KG. Neural selection and control of visually guided eye movements. Annu Rev Neurosci. (1999) 22:241–59. doi: 10.1146/annurev.neuro.22.1.241
22. Eaton RC, Bombardieri RA, Meyer DL. The mauthner-initiated startle response in teleost fish. J. Exp. Biol. (1977) 66:65–81. doi: 10.1242/jeb.66.1.65
23. Domenici P. Context-dependent variability in the components of fish escape response: integrating locomotor performance and behavior. J Exp Zool. (2010) 313A:59–79. doi: 10.1002/jez.580
24. Turesson H, Domenici P. Escape latency is size independent in grey mullet. J Fish Biol. (2007) 71:253–9. doi: 10.1111/j.1095-8649.2007.01490.x
25. Domenici P, Blake R. The kinematics and performance of fish fast-start swimming. J Exp Biol. (1997) 200:1165. doi: 10.1242/jeb.200.8.1165
26. Domenici P, Blake RW. The kinematics and performance of the escape response in the angelfish (Pterophyllum eimekei). J Exp Biol. (1991) 156:187–205. doi: 10.1242/jeb.156.1.187
27. Spierts ILY, Leeuwen JLV. Kinematics and muscle dynamics of C- and S-starts of carp (Cyprinus carpio L.). J Exp Biol. (1999) 202:393–406. doi: 10.1242/jeb.202.4.393
28. Lefrançois C, Shingles A, Domenici P. The effect of hypoxia on locomotor performance and behaviour during escape in Liza aurata. J Fish Biol. (2005) 67:1711–29. doi: 10.1111/j.1095-8649.2005.00884.x
29. Hale ME, Long JH, McHenry MJ, Westneat MW. Evolution of behavior and neural control of the fast-start escape response. Evolution. (2002) 56:993–1007. doi: 10.1111/j.0014-3820.2002.tb01411.x
30. Batty RS, Blaxter JHS, Fretwell K. Effect of temperature on the escape responses of larval herring, Clupea harengus. Mar Biol. (1993) 115:523–8. doi: 10.1007/BF00349358
31. Lefrançois C, Domenici P. Locomotor kinematics and behaviour in the escape response of European sea bass. Dicentrarchus labrax L., exposed to hypoxia. Mar Biol. (2006) 149:969–77. doi: 10.1007/s00227-006-0261-0
32. Lauritzen L. The essentiality of long chain n-3 fatty acids in relation to development and function of the brain and retina. Prog Lipid Res. (2001) 40:1–94. doi: 10.1016/S0163-7827(00)00017-5
33. Bell MV, Batty RS, Dick JR, Fretwell K, Navarro JC, Sargent JR. Dietary deficiency of docosahexaenoic acid impairs vision at low light intensities in juvenile herring (Clupea harengus L.). Lipids. (1995) 30:443–9. doi: 10.1007/BF02536303
34. Browman HI, Skiftesvik AB. The Big Fish Bang: Proceedings of the 26th Annual Larval Fish Conference. Bergen: Institute of Marine Research (2003).
35. Benítez-Santana T, Atalah E, Betancor MB, Caballero MJ, Hernández-Cruz CM, Izquierdo M. DHA but not EPA, enhances sound induced escape behavior and Mauthner cells activity in Sparus aurata. Physiol Behav. (2014) 124:65–71. doi: 10.1016/j.physbeh.2013.10.021
36. Benítez-Santana T, Masuda R, Juárez Carrillo E, Ganuza E, Valencia A, Hernández-Cruz CM, et al. Dietary n-3 HUFA deficiency induces a reduced visual response in gilthead seabream Sparus aurata larvae. Aquaculture. (2007) 264:408–17. doi: 10.1016/j.aquaculture.2006.10.024
37. Benítez-Santana T, Juárez-Carrillo E, Beatriz Betancor M, Torrecillas S, José Caballero M, Soledad Izquierdo M. Increased Mauthner cell activity and escaping behaviour in seabream fed long-chain PUFA. Br J Nutr. (2012) 107:295–301. doi: 10.1017/S0007114511002807
38. Carvalho M, Montero D, Domenici P, Afonso JM, Izquierdo M. Dietary novel oils modulate neural function and preserve locomotor response in gilthead sea bream (Sparus aurata) juveniles by regulating synthesis and contents of fatty acids in brain. Aquaculture. (2022) 550:737873. doi: 10.1016/j.aquaculture.2021.737873
39. Lebreton B, Richard P, Parlier EP, Guillou G, Blanchard GF. Trophic ecology of mullets during their spring migration in a European saltmarsh: a stable isotope study. Estuar Coast Shelf Sci. (2011) 91:502–10. doi: 10.1016/j.ecss.2010.12.001
40. Carpentier A, Como S, Dupuy C, Lefrançois C, Feunteun E. Feeding ecology of Liza spp. in a tidal flat: evidence of the importance of primary production (biofilm) and associated meiofauna. J Sea Res. (2014) 92:86–91. doi: 10.1016/j.seares.2013.10.007
41. Robin JH, Skalli A. Incorporation of dietary fatty acid in European sea bass (Dicentrarchus labrax)—a methodological approach evidencing losses of highly unsaturated fatty acids. Aquaculture. (2007) 263:227–37. doi: 10.1016/j.aquaculture.2006.09.044
42. Skalli A, Robin JH. Requirement of n-3 long chain polyunsaturated fatty acids for European sea bass (Dicentrarchus labrax) juveniles: growth and fatty acid composition. Aquaculture. (2004) 240:399–415. doi: 10.1016/j.aquaculture.2004.06.036
43. Marras S, Killen SS, Claireaux G, Domenici P, McKenzie DJ. Behavioural and kinematic components of the fast-start escape response in fish: individual variation and temporal repeatability. J Exp Biol. (2011) 214:3102–10. doi: 10.1242/jeb.056648
44. Li L, Dowling JE. Zebrafish visual sensitivity is regulated by a circadian clock. Vis Neurosci. (1998) 15:851–7. doi: 10.1017/S0952523898155050
45. Fulton TW. The rate of growth of fishes. In: 22nd Annual Report of the Fishery Board of Scotland (1904). p. 141–241.
46. Mathieu-Resuge M, Kraffe E, Le Grand F, Boens A, Bideau A, Lluch-Cota SE, et al. Trophic ecology of suspension-feeding bivalves inhabiting a north-eastern Pacific coastal lagoon: comparison of different biomarkers. Mar Environ Res. (2019) 145:155–63. doi: 10.1016/j.marenvres.2019.02.016
47. Batty RS. Escape responses of herring larvae to visual stimuli. J Mar Biol Ass. (1989) 69:647–54. doi: 10.1017/S0025315400031039
48. Newcombe RG. Interval estimation for the difference between independent proportions: comparison of eleven methods. Statist Med. (1998) 17:873–90. doi: 10.1002/(SICI)1097-0258(19980430)17:8<873::AID-SIM779>3.0.CO;2-I
49. Wilkinson GN, Rogers CE. Symbolic description of factorial models for analysis of variance. Appl Stat. (1973) 22:392. doi: 10.2307/2346786
50. Skalli A, Robin JH, Le Bayon N, Le Delliou H, Person-Le Ruyet J. Impact of essential fatty acid deficiency and temperature on tissues' fatty acid composition of European sea bass (Dicentrarchus labrax). Aquaculture. (2006) 255:223–32. doi: 10.1016/j.aquaculture.2005.12.006
51. Benedito-Palos L, Navarro JC, Kaushik S, Perez-Sanchez J. Tissue-specific robustness of fatty acid signatures in cultured gilthead sea bream (Sparus aurata L.) fed practical diets with a combined high replacement of fish meal and fish oil. J Anim Sci. (2010) 88:1759–70. doi: 10.2527/jas.2009-2564
52. Kuah M-K, Jaya-Ram A, Shu-Chien AC. The capacity for long-chain polyunsaturated fatty acid synthesis in a carnivorous vertebrate: functional characterisation and nutritional regulation of a Fads2 fatty acyl desaturase with Δ4 activity and an Elovl5 elongase in striped snakehead (Channa striata). Biochim Biophys Acta. (2015) 1851:248–60. doi: 10.1016/j.bbalip.2014.12.012
53. Millot S, Bégout ML, Chatain B. Exploration behaviour and flight response toward a stimulus in three sea bass strains (Dicentrarchus labrax L.). Appl Anim Behav Sci. (2009) 119:108–14. doi: 10.1016/j.applanim.2009.03.009
54. Jones KA, Godin J-GJ. Are fast explorers slow reactors? Linking personality type and anti-predator behaviour. Proc R Soc B. (2010) 277:625–32. doi: 10.1098/rspb.2009.1607
55. Eaton RC, Emberley DS. How stimulus direction determines the trajectory of the mauthner-inthated escape response in a teleost fish. J Exp Biol. (1991) 161:469–87. doi: 10.1242/jeb.161.1.469
56. Tudorache C, Blust R, Deboeck G. Social interactions. Predation behaviour and fast start performance are affected by ammonia exposure in brown trout (Salmo trutta L.). Aquat Toxicol. (2008) 90:145–53. doi: 10.1016/j.aquatox.2008.08.009
57. Killen SS, Reid D, Marras S, Domenici P. The interplay between aerobic metabolism and antipredator performance: vigilance is related to recovery rate after exercise. Front Physiol. (2015) 6:111. doi: 10.3389/fphys.2015.00111
58. Dobson GP, Hochachka PW. Role of glycolysis in adenylate depletion and repletion during work and recovery in teleost white muscle. J Exp Biol. (1987) 129:125–40. doi: 10.1242/jeb.129.1.125
59. Weber JM. Metabolic fuels: regulating fluxes to select mix. J Exp Biol. (2011) 214:286–94. doi: 10.1242/jeb.047050
60. Fang W, Bo-Jian C, Zhen-Dong C, Yu-Xiang W, Shi-Jian F. The influence of starvation on fast-start performance of Spinibarbus sinensis. Acta Ecol Sin. (2012) 32:291–6. doi: 10.1016/j.chnaes.2012.07.009
61. Zhao W-W, Pang X, Peng J-L, Cao Z-D, Fu S-J. The effects of hypoxia acclimation, exercise training and fasting on swimming performance in juvenile qingbo (Spinibarbus sinensis). Fish Physiol Biochem. (2012) 38:1367–77. doi: 10.1007/s10695-012-9624-2
Keywords: fish, n-3 long chain polyunsaturated fatty acids, EPA, DHA, acceleration, velocity, turning rate, response duration
Citation: Vagner M, Ducos S, Graziano N, Le Grand F, Bideau A, Dubillot E and Lefrançois C (2024) Omega-3 long chain highly unsaturated fatty acid content in tissue correlates with escape response efficiency in golden gray mullet. Front. Fish Sci. 2:1394423. doi: 10.3389/frish.2024.1394423
Received: 01 March 2024; Accepted: 16 April 2024;
Published: 14 May 2024.
Edited by:
Sébastien Alfonso, Université de Nice Sophia Antipolis, FranceReviewed by:
Marta Ribeiro Carvalho, University of Las Palmas de Gran Canaria, SpainEduardo Bessa, University of Brasilia, Brazil
Copyright © 2024 Vagner, Ducos, Graziano, Le Grand, Bideau, Dubillot and Lefrançois. This is an open-access article distributed under the terms of the Creative Commons Attribution License (CC BY). The use, distribution or reproduction in other forums is permitted, provided the original author(s) and the copyright owner(s) are credited and that the original publication in this journal is cited, in accordance with accepted academic practice. No use, distribution or reproduction is permitted which does not comply with these terms.
*Correspondence: Marie Vagner, bWFyaWUudmFnbmVyQHVuaXYtYnJlc3QuZnI=; Christel Lefrançois, Y2xlZnJhbmNAdW5pdi1sci5mcg==