 Clare E. M. Prebble
 Lydie I. E. Couturier
 Christoph A. Rohner
 Simon J. Pierce
 Clive N. Trueman3
- 1Marine Megafauna Foundation, West Palm Beach, FL, United States
- 2France Énergies Marines, Bât. Cap Océan, Plouzané, France
- 3National Oceanography Centre, University of Southampton, Southampton, United Kingdom
Introduction: Despite their size, relatively passive behavior, and commercial significance, knowledge of the behavioral ecology of whale sharks remains limited. The difficulty of tracking individual animals at sea encourages the use of retrospective biochemical approaches such as stable isotope analysis.
Methods: Whale sharks at Mafia Island in Tanzania form a comparatively small and resident aggregation that has been monitored for several successive years, providing a rare opportunity to study biochemical changes in individuals over time. In this study, 53% of the identified individuals were sampled at the time of collection over a multi-year period. Stable isotope analysis was performed on these samples to investigate their feeding ecology.
Results: Stable isotope data suggest that whale sharks at Mafia Island predominantly feed within the local food web at a trophic level consistent with current understanding of the species' general feeding ecology. These data also reveal a range of individual feeding strategies within the local aggregation, with some sex and size-related differences. However, the isotopic niche area at the population level was relatively constrained.
Discussion: We call for additional research and emphasize the importance of a multi-faceted approach incorporating diverse biochemical and tracking techniques to more accurately understand the long-term feeding ecology of this endangered and charismatic mega-planktivore.
1 Introduction
Whale sharks (Rhincodon typus), the world's largest extant fish and possibly the largest fish that has ever lived (1), have inhabited the world's oceans since the late Oligocene (2). From their initial scientific description in the 1800's (84) until the 1980's rare sightings over this ~150 year period led to their description as sparsely distributed and elusive oceanic animals, posing significant challenges to researchers (3). In the decades since, our knowledge of the world's largest fish has vastly improved, however, studying wide-ranging, highly mobile marine species remains a challenge. While whale sharks in some areas have likely been known to indigenous coastal fishers for generations (4), a large part of this surge in knowledge is due to the discovery of several coastal aggregation sites of whale sharks across the globe (5). These accessible, predictable seasonal aggregations, driven by ephemeral pulses of productivity in an otherwise oligotrophic marine environment, provide valuable opportunities for research.
The majority of coastal aggregation sites are characterized by populations of whale sharks showing pronounced sex- and size-based segregation, typically dominated by juvenile males, with an average total length (TL) of all sharks of 400–800 cm (5, 6). Sharks at these locations can spend up to 11 h continuously feeding each day (7).
The structure of the whale sharks' filtering apparatus (8, 9), and multiple feeding modes (10, 11) allow whale sharks to target a wide selection of prey (12) including fish and crab spawn, and several groups of crustacean zooplankton (4, 13, 14). The dominant food source at an aggregation is often readily identifiable (10, 14, 15) due to high prey densities in feeding patches (14, 16). Such reliable and high quality food resources support long-term philopatry in whale sharks, with some individuals returning to the same sites over decades (17). While the seasonal timing and duration of aggregations varies geographically, peak seasons typically last a few weeks to months per year, with individual residency rates ranging from a few days to several weeks (18, 19). Despite this site fidelity, whale sharks are also highly mobile and exhibit extensive movements beyond aggregation areas (3).
Successful species conservation requires a clear understanding of their habitat use throughout their range. Whale sharks are exposed to a multitude of threats, including target fisheries (85–88) and other anthropogenic threats (20, 89, 90) which has led to a significant population decline and an Endangered status on the IUCN Red List of Threatened Species (20). Determining the importance of coastal aggregation sites and identifying potentially new and currently unknown critical feeding habitats and prey items is a vital underpinning to understanding whale shark movement and behavior. The disproportionate amount of information derived from direct observations at coastal aggregations has unavoidably introduced bias into our understanding of their ecology (20). Consequently, the relative importance of these coastal habitats to their overall feeding and survival strategies remains unclear.
Given the rarity and logistical challenges of observing whale sharks away from coastal locations or islands (21, 22), indirect methods such as biochemical analyses can be utilized to infer aspects of their trophic and spatial ecology. Biochemical tissue analysis is now a routine tool in terrestrial trophic and spatial ecology, and increasingly so in marine and elasmobranch ecology (23–25). Stable isotope analysis of nitrogen and carbon (expressed as δ15N and δ13C values respectively) are commonly employed as trophic and spatial markers in the marine environment. Typically, δ13C values provide insights into location or nutrient sources, while δ15N primarily infer trophic level.
However, diet source, location and trophic level can each influence both δ13C and δ15N values to some degree (26, 27) potentially complicating interpretation. The limited timescale, and the small proportion of individuals sampled within large aggregations, have hampered previous studies and left researchers with a sometimes ambiguous understanding of individual or population-level habitat and diet preferences (28, 29). Furthermore, obtaining multi-year, repeated measurements from individuals outside of controlled feeding studies is rare, particularly for marine fishes.
In an attempt to disentangle the confounding effects of diet and location, and to investigate potential temporal dietary shifts, this study focuses on a unique whale shark aggregation in the western Indian Ocean. Mafia Island, Tanzania is home to a uniquely small and resident aggregation. The whale sharks here display predictable seasonal movements but maintain small core habitats at this coastal feeding site, with limited latitudinal ranging (30–32). These individuals have been reliably monitored for several successive years (33), and a large subset (~25%) were continuously tracked locally using passive acoustic telemetry between years (30, 32). During the peak season (October to January), when whale shark sightings are most frequent (32), their primary prey is readily observable: dense patches of large sergestid shrimp (Belzebub hanseni) in close inshore waters (14).
The productive waters around the island support multi-species artisanal fisheries (34, 35) as well as an expanding whale shark tourism industry. While whale sharks are legally protected in Tanzania, evidence from scarring suggests that boat strikes and incidental catches in fishing gear are somewhat commonplace (36). Localized protections and management have been suggested based on an extensive multi-year acoustic monitoring study (32). Building upon this existing knowledge, this study aims to investigate the dietary importance of this area to whale sharks, identify any structure within the aggregation with regards to feeding behavior, and to highlight potential feeding habitats outside of Kilindoni Bay that may warrant further investigation or protection. Specifically, we aim to determine whether the strong association of whale sharks at Mafia Island with the sergestid shrimp represents a major component of their trophic ecology, or whether SIA results reveal a more complex feeding ecology. The population structure at whale shark aggregation sites, including Mafia Island, is known to be biased toward males and to encompass only a portion of the species' size range. Therefore, we examined the possibility that dietary variations among these groups could explain, at least in part, the segregation patterns observed in these aggregations. Utilizing repeat, multi-year sampling of a large proportion of individuals in the aggregation, we aim to provide a uniquely robust assessment of this aggregation's isotopic trophic geography.
2 Methods
2.1 Study area
Kilindoni Bay off Mafia Island, Tanzania (7.9° S, 39.6° E) (Figure 1A) is a shallow bay not exceeding 30 m depth. The intertidal zone is up to ~1 km wide and mangroves line most of the Bay. Sand is the dominant substrate type, with patches of seagrass and muddy areas next to the mangroves, and dispersed coral bommies and rubble throughout the bay (Figure 1C). The Rufiji river drains into the sea on the mainland directly opposite Mafia Island (Figure 1B). Whale sharks are present at this site year-round, with the population mostly composed of immature males (89% male) ranging from 400–1,000 cm in total length (6). Field activities were conducted annually in Kilindoni Bay for five consecutive years between 2012 and 2016 during the peak season from October until February (30). Because some samples were collected during the same field season but in different calendar years, the term “season” will be used hereafter to refer to each sampling period. All whale shark surveys were conducted as described in Rohner et al. (14).
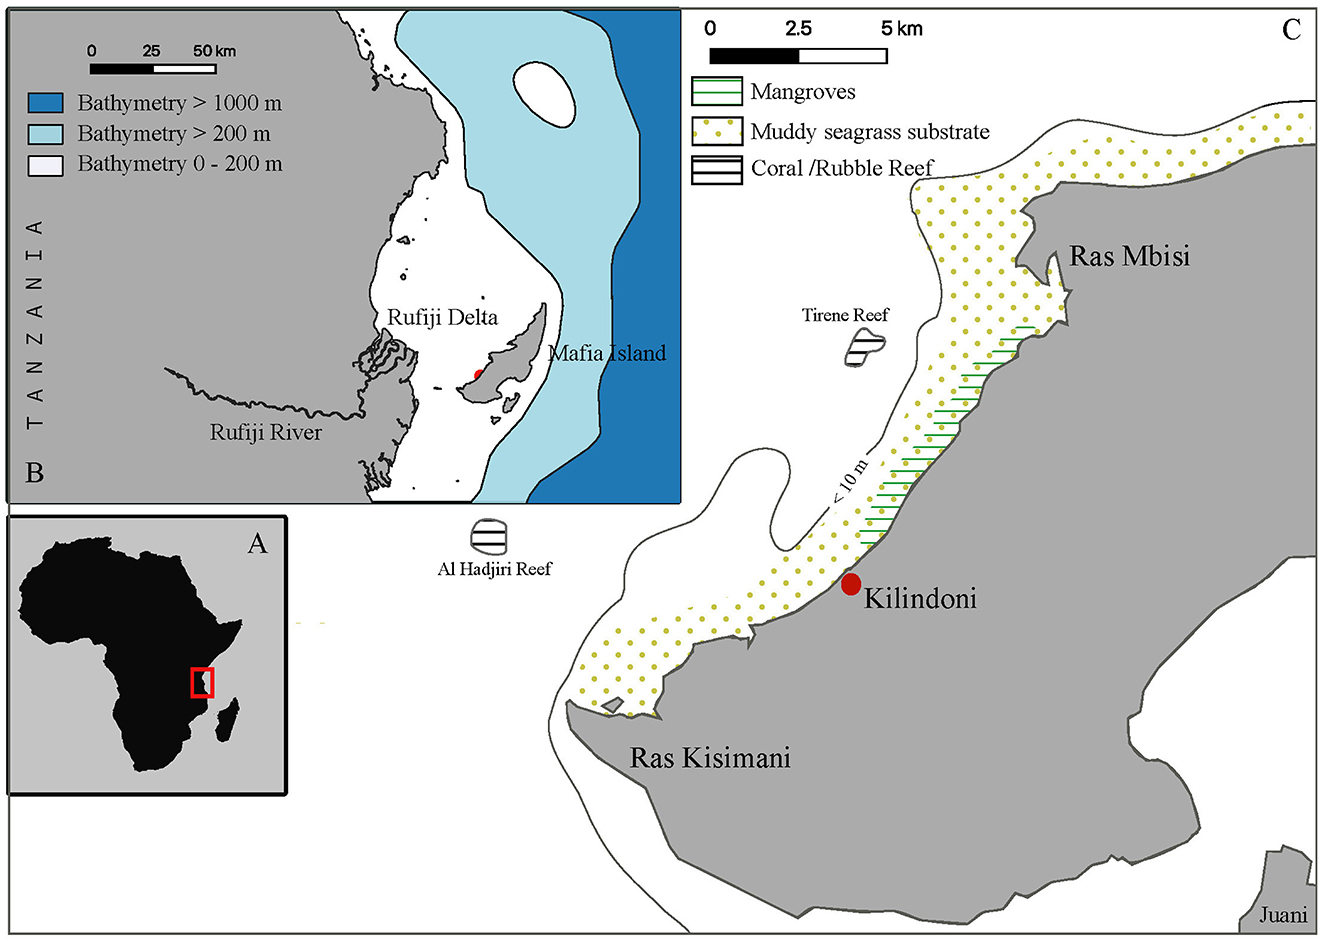
Figure 1. An overview of the location and topographic features of Mafia Island, Tanzania: (A) location of Mafia Island and mainland Tanzania within the African continent, (B) Mafia Island, along with the surrounding bathymetry, and coastal features of the adjacent mainland, (C) Kilindoni Bay, situated on the southeast coast of Mafia Island, highlighting the topographic features, substrate types, and bathymetry within the area.
Whale sharks were individually identified using underwater photographs of the body region immediately posterior to the gills (37, 38). These images are processed using a pattern-matching algorithm to identify individual sharks, and stored on the online database, Sharkbook (previously “Wildbook for Whale Sharks;” www.sharkbook.ai). Total length was visually estimated in 50 cm bins and sex was visually determined based on the presence (male) or absence (female) of claspers (33).
2.2 Field observations
During fieldwork for this study, researchers directly observed whale sharks feeding on sergestid shrimp zooplankton and occasionally on small inshore fishes. Whale sharks are also sometimes encircled at night by ring-net fishers targeting small schooling fishes, and they may feed on these small fishes themselves, or on the emergent plankton that gets attracted by the light that the fishers use to attract the small fishes.
2.3 Sample collection
Tissue samples were collected from the lateral area of the shark, beside the first dorsal fin, between the lateral ridges, using a hand spear fitted with a modified biopsy tip. Samples were stored on ice on the boat and then rinsed in fresh water to remove contaminants from seawater and excess urea in the tissue. For each sample, the white sub-dermal connective tissue layer was separated from the upper dermal denticle layer and was frozen prior to analyses. Muscle was not collected because the shark's skin is exceptionally thick (~15 cm) and the biopsy tip penetrated no more than 10 cm.
Several potential dietary items were sampled within Kilindoni Bay. Sergestid shrimps Belzebub hanseni, the dominant local food source in peak season (6), were sampled using a small plankton net (10 cm diameter, 100 μm mesh-size) towed by a swimmer near feeding whale sharks. Surface zooplankton were also collected when whale sharks were not feeding during the day and at night using a large plankton net (50 cm diameter 200 μm mesh-size) towed for 3 min at ~2 knots, 15 m behind the boat. Emergent zooplankton (i.e., zooplankton that live in the substrate during the day and enter the water column at night) were collected using a weighted 200 μm mesh-size 1.5 m long vertical plankton net with the opening placed on the substrate. The net was left overnight to trap and collect the migrating zooplankton. Zooplankton samples were filtered, rinsed with fresh water, and kept on ice until returned to shore where they were then frozen. Deep-water zooplankton were collected offshore as part of the Agulhas II cruise in October–November 2017 (39). Hauls were conducted during daylight hours at eight locations between the latitudes 20.68° S in southern Mozambique, and 6.09° S in northern Tanzania. Zooplankton samples were collected with a Vertical Multinet equipped with five nets (Type Midi 0.25 m2 mouth area). Hauls were made at the maximum depth of 1,482 m with integrated samples between depths of 0 m, 200 m, 400 m, 600 m, 800 m, 1,000 m and 1,482 m. Other local consumers in Kilindoni Bay were sampled within the same time period as the whale shark samples. Dorsal muscle tissue was sampled from non-migratory, planktivorous, and larger predatory piscivorous fishes. Bell tissue from jellyfish were also collected from within the Bay.
2.4 Chemical analysis
A total of 445 samples were collected for biochemical analysis (Table 1). Samples were freeze-dried and homogenized prior to analysis in an EA 1110 elemental analyser, linked to a Europa Scientific 2020 isotope ratio mass spectrometer at OEA Laboratories Cornwall, UK. Raw data were corrected using the reference materials USGS40 and USGS41 (glutamic acid from USGS Reston USA). An internal QC material bovine liver standard (NIST 1477a) was used to monitor the precision of the instrument. Precision was on average 0.21 per mil for both C and N.
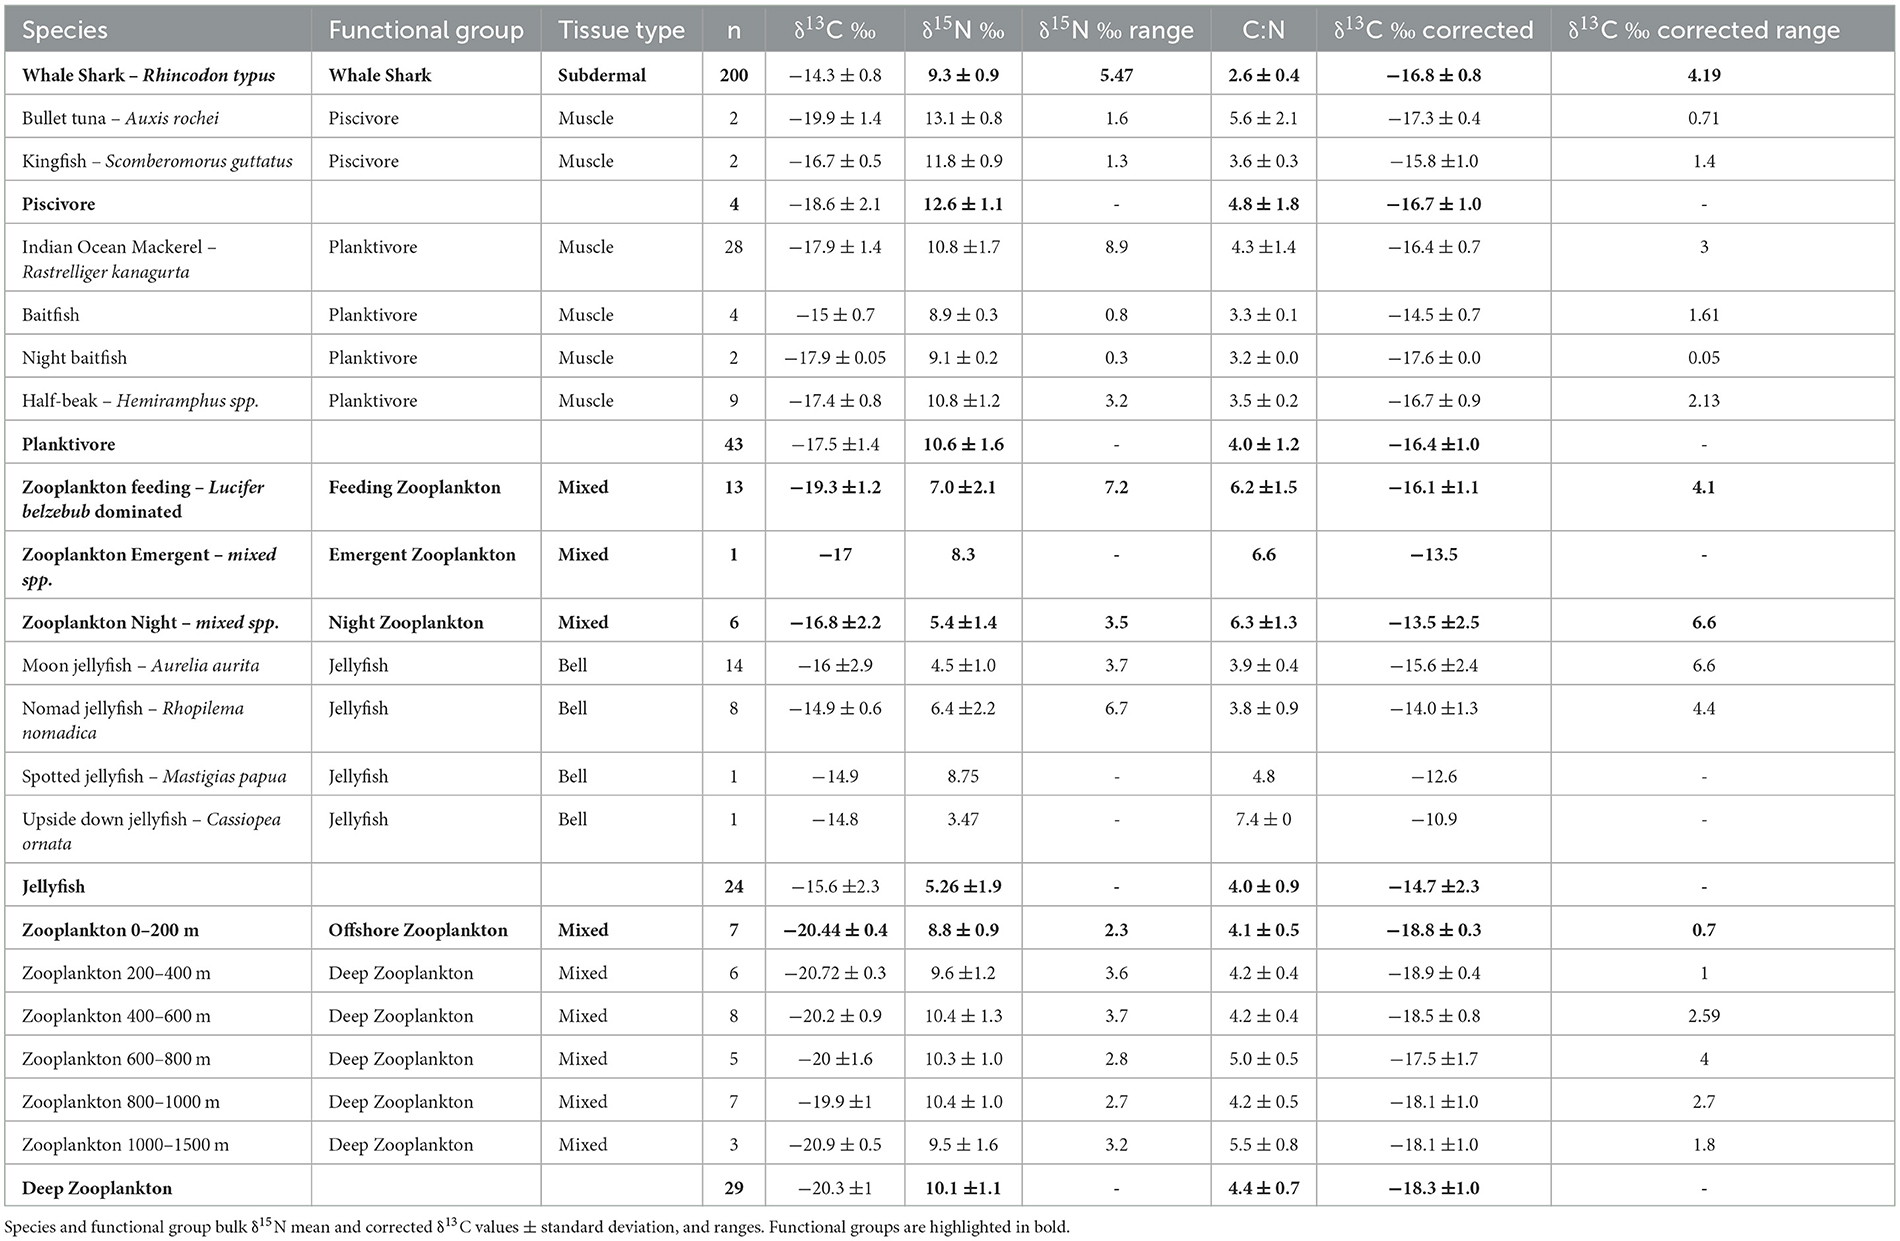
Table 1. Species, tissue type, and number of samples collected.
Currently the protocol for whale shark tissue preparation for stable isotope analysis varies (29, 31, 40, 41). In this study mean elemental C:N ratios for water-washed whale shark dermal connective tissue samples from Tanzania exhibited comparatively low C:N ratios (2.6 ± 0.4 S.D) (31), slightly lower than lipid-extracted dermal connective tissues from Australian whale sharks (2.9 ± 0.4 S.E) (41) and below the 3.5 threshold suggested in Post et al. (42) for aquatic animals where normalization and extraction are likely to have little influence on δ13C values. Indeed, whale shark subdermal tissues have also shown comparatively low lipid content when directly measured (41, 43, 44). Low lipid content in subdermal tissue of whale sharks means that the samples are unlikely to be misleadingly δ13C enriched, as high lipid samples would have more negative δ13C values (42). Consequently, no chemical treatment was undertaken to remove lipids, and analytical results were not adjusted to correct for lipid content.
Due to the limited field storage conditions many samples were small and were required for further analysis and thus the destructive nature of lipid extraction was not considered, and mathematical corrections were preferable. Of these samples, those that had high (>3.5) molecular C:N ratio, a mathematical lipid correction factor was applied to bulk δ13C values. The correction factor from Kiljunen et al. (45), developed for marine fishes, was used because it most closely represented the types of samples used in our study. Elasmobranch skin tissue comprises many layers of collagen fiber bundles, particularly in the dorsal region where they support the fins (11, 91). The major amino acid in the type I collagens found in shark skin is glycine, a non-essential amino acid which is typically δ13C enriched compared to bulk protein (93). Consequently, subdermal tissue shows more positive δ13C values than muscle protein by approximately 3‰−5‰ (92). To allow the direct comparison between subdermal tissue and muscle sample types, a correction factor was applied to the whale shark isotope values to account for tissue type, −2.5‰ for δ13C, as outlined in Prebble et al. (31).
In marine studies there is often the possible bias with regards to zooplankton 13C values. The inorganic C in the calcareous exoskeletons of some zooplankton and crustaceans are often highly 13C enriched with respect to the soft tissues (46). The plankton samples were not acidified here because of the varied effects it can have on 15N values and the widely differing advice on protocol (47). We also note that δ13C can decrease by almost 0.5‰ for plankton samples after acidification (48). Whale shark fecal samples suggest that whale sharks do not efficiently digest or assimilate these 13C-enriched crustacean exoskeletons (13, 49). So while whale sharks may derive nutrition particularly from the soft part of crustacean zooplankton, we used the whole crustacean, including the 13C-enriched exoskeleton, in our analysis. This could be a concern for night-time samples containing some molted amphipod exoskeletons, and feeding zooplankton, predominantly consisting of sergestid shrimps.
2.5 Statistical analysis
2.5.1 Whale sharks
We estimated the trophic position (TP) of whale sharks using the equation TP = λ + (δ15NConsumer – δ15NBase)/Δn, where λ is the trophic position of the consumer used as a baseline, δ15NBase is the mean δ15N of the baseline, δ15NConsumer is the δ15N value of the whale sharks and Δn is the fractionation value of the consumer. Fractionation values are species-specific, and accurate estimation needs to be determined in controlled feeding studies. To date, there are no experimental fractionation values for whale sharks or any other planktivorous elasmobranchs. Currently, the closest proxies are from a long term, controlled feeding study on leopard sharks (Triakis semifasciata) (50) and a semi-controlled study on larger predatory sharks (23). As lower trophic level species, whale sharks are likely to have larger fractionation values, with a larger associated error (93). Therefore, a range of probable trophic enrichment factors (2.8‰−4‰ enrichment per trophic level) was used to estimate a distribution of likely trophic levels. If available, standard deviations of all other values in the trophic level calculation were also included to account for error. The value chosen for the base was the mean and standard deviation δ15N of the feeding zooplankton functional group. The λ value used was the mean and standard deviation of the calculated trophic position from zooplankton and sergestids (7.38 ± 2.33‰) (51, 94). The consumer value used was the δ15N mean and standard deviation of the whale sharks (9.35 ± 0.98‰). Trophic level sampling values were restricted to a biologically meaningful range of 0–6, with 0 representing primary producers, and 6 representing high trophic level consumers. The data were bootstrapped 1,000 times to produce a trophic-level likelihood distribution curve (Supplementary Figure 1).
To estimate the whale shark population isotopic niche area, of male and female sharks and size classes, the Bayesian method of standard ellipse area corrected for smaller sample sizes (SEAc) was used to quantify and approximate dietary niche width. To further investigate isotopic niche overlap among whale sharks, Kernel utilization density (KUD) estimators within the package rKIN (52) were used to estimate overlap for 50%, 75%, and 95% data contours (53). Due to the minimum sample sizes required for this method (n > 15) size classes were merged into three; ≤ 500 cm, 500–650, and >700 m for analysis.
2.5.2 Biological and temporal factors
To investigate the importance of biological (sex, size), and temporal (season) factors, mixed-effect linear models were used to identify their influence on corrected δ13C and bulk δ15N values among whale sharks. Whale shark identity was set as a random effect. ANOVA was used to compare model performance. Model selection was performed by ranking models using the lowest Akaike's Information Criterion (AIC) value. Where two models were ranked equally within 2 AIC units, the most parsimonious model was selected. Model fit was also assessed by the deviance. To identify any significant differences among levels within factors, adjusted Tukey contrasts were performed on all three aforementioned factors using a 95% confidence interval level (i.e., p-value < 0.05 and t ratio > 1.96).
To investigate the effect of season and functional group corrected δ13C and bulk δ15N values on all data, linear mixed-effects models were used with species and whale shark identity both set as random effects to account for the variance from these factors. Model performance was again compared using ANOVA. Offshore and deep zooplankton were not included in this part of the analysis as they were not sampled within the same timeframe as the rest of the data and so could not be assigned a season. To identify differences between each level within factors, adjusted Tukey contrasts were performed between each of the seasons and then between each of the functional groups. Offshore and deep zooplankton were included in the pairwise comparisons of functional groups.
The coefficient of variation in corrected δ13C and δ15N values was further investigated to look for changes in variance across the range of estimated total length of the sharks. The Fligner-Killeen test was used to test for homogeneity of variances. Further pairwise comparisons could not be made due to low (<10) sample numbers in some size bins (400, 450, 550, 650, and 750 cm). Linear models were applied to the variances to investigate any significant trends in the variance.
2.5.3 Potential prey
Each sample type/species were categorized into nine functional groups to better evaluate trophic structure. These are defined as: whale shark (all whale shark subdermal samples), feeding zooplankton (collected next to feeding whale sharks), emergent zooplankton, night zooplankton, offshore zooplankton (zooplankton collected offshore between the surface and 200 m depth), deep zooplankton (zooplankton collected offshore between 200–1,500 m), jellyfishes (all jellyfish species), planktivore (any fish species that predominantly consumes plankton as a primary food source), and piscivore (any fish species that predominantly consumes fishes as a primary food source). We calculated the mean and standard deviations (SD) of δ13C, δ15N, and C:N for each functional group to make direct comparisons between them. Some whale sharks were biopsied more than once within a season. To avoid pseudo replication the mean of the corrected δ13C and bulk δ15N of these samples were calculated so there would be only one value per individual per season in the dataset. These mean values were used in all further analyses. SEAc values for all groups were calculated as above as a means of comparing and adding context to the isotopic niche areas of whale sharks within the Tanzanian food web.
3 Results
3.1 Whale sharks
A total of 200 subdermal connective tissue biopsies were collected from 88 different individual whale sharks (excluding repeats within a season), of which 12 were female and 76 were male (86%). Their total length ranged from 450–900 cm (mean 612 ± 103 cm). The mean trophic level for whale sharks estimated by the likelihood distribution curve was 2.73 with a quartile range of 1st Q = 2.31 to 3rd Q = 3.35 (Supplementary Figure 1). Whale sharks had a range of δ13C (4.19‰) and δ15N (5.47‰) values (Table 1, Figure 2). Corrected δ13C values for whale shark subdermal connective tissue ranged from −14.7‰ to −18.9‰, while uncorrected δ13C values ranged from −12.2‰ to −16.4‰. Bulk δ15N values ranged from 6.1‰ to 11.6‰ (Table 1, Figure 2). Seven individual sharks with more than one sample within a season had a mean net difference in isotope values of δ13C 0.29 ± 0.17, and δ15N 0.36 ± 0.37. Forty-six individuals were sampled in more than one, and in up to five seasons.
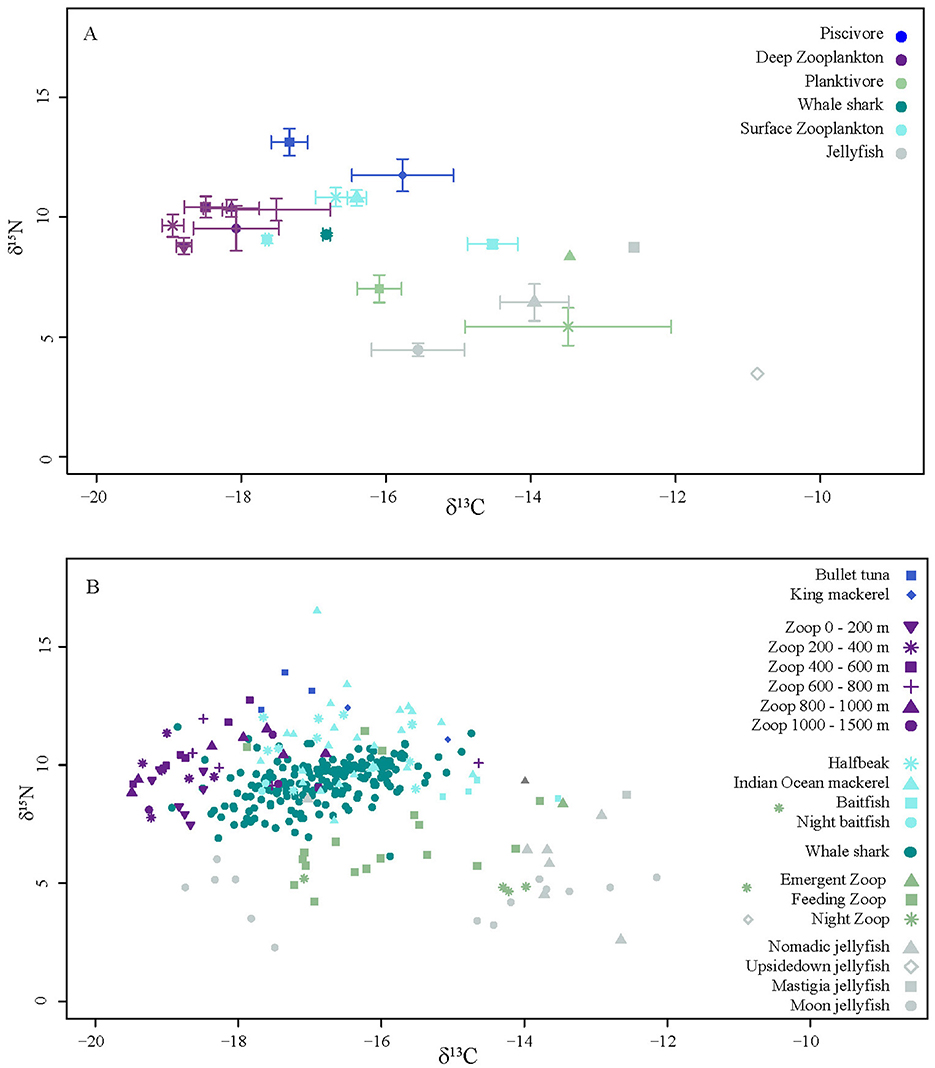
Figure 2. Biplots of (A) mean isotopic values (‰± standard error) of each functional group, and (B) isotopic values of all samples collected in this study.
The niche width metrics for male and female sharks showed substantial core overlap (Figure 3A). At the 95 contour the overlap was 74.4% and 74.7% for males and females, respectively (Supplementary Table 1). However, female sharks showed a greater isotopic niche area then male sharks (Table 2) but also a larger range across the density distribution (Figure 3B) suggesting higher within-group variability. The female KUD isotopic area stretched more along the y-axis (δ15N) and the male isotopic area slightly more along the x-axis (δ13C) (Figure 4A); these shapes are mirrored in the SEAc ellipses (Figure 3A). The isotopic niches of small (≤500 cm) sharks were larger than those of the 500–650 cm sharks, and the largest (≥700 cm) sharks displayed the smallest isotopic niche (Table 2, Figure 3C). There was substantial overlap in the isotopic niche between each of the size classes (Figure 3C; Supplementary Table 2) where the 500–650 cm and ≥700 cm size classes are almost completely nested within the small (≤500 cm) sharks' isotopic niche (Figure 4B).
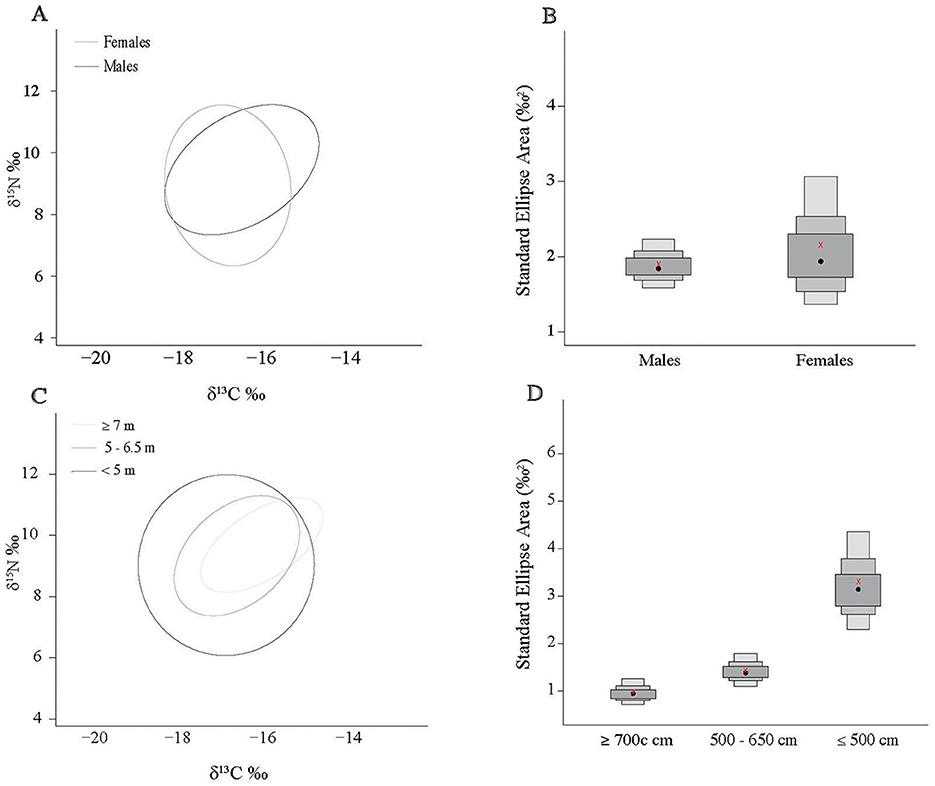
Figure 3. Sample size corrected standard ellipse area (SEAc) calculated from whale shark δ13C and δ15N values. Area comparisons of sex (A) and size class (B). Density distribution plots of Bayesian SEAc calculations for sex (C) and size classes (D). Black circles represent the estimated center of the distribution, and credibility intervals are presented as dark gray for 50%, medium gray for 75%, and light gray for 95%. Red x's represent the calculated SEAc values.
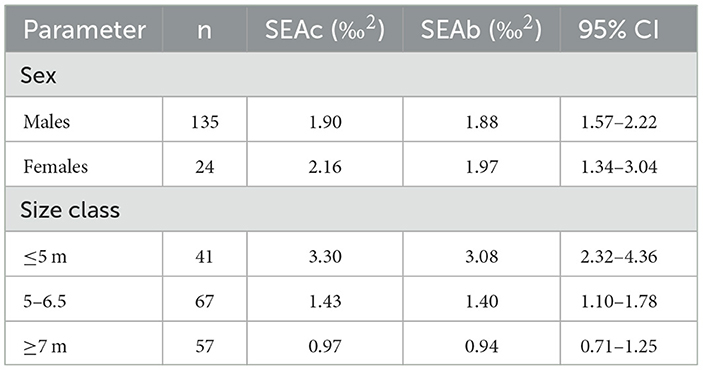
Table 2. Whale shark isotopic niche area estimates and parameters for sex and size classes.
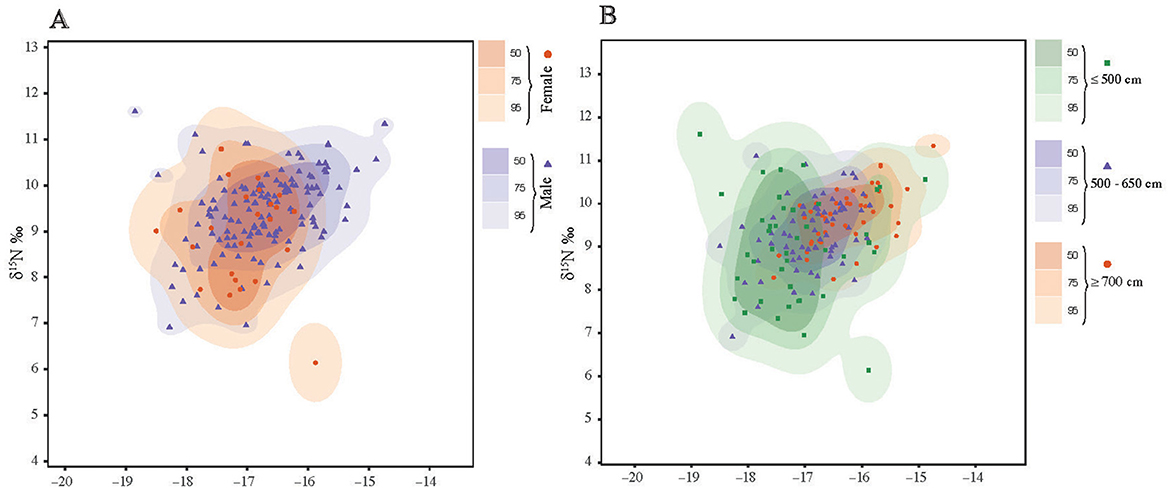
Figure 4. Plot of δ13C and δ15N isotopic niche space for whale sharks separated by (A) sex and (B) size classes. Shaded areas represent 50%, 75%, and 95% Kernel Utilization Densities (KUD) calculated in rKIN.
3.2 Biological and temporal factors
Among seasons within individuals, the mean net difference in isotope values was similar to the within-season replicates, with a δ13C of 0.3 ± 0.2 and a δ15N of 0.41 ± 0.95. The model selected to best explain whale shark δ13C values included both total length and season (Table 3).

Table 3. Ranked linear mixed effects models for δ13C and δ15N values for whale shark samples only.
Pairwise comparisons within factors showed that the δ13C values for whale sharks in season four were more enriched than in seasons two and three (Table 4). However, there was only a 0.4‰ difference between their means (Table 4). δ13C showed a 1.6‰ enrichment across the total length classes from 400–800 cm (Table 4; Figure 5), with several size classes significantly different from each other (Table 5). The model selected to best explain whale shark δ15N values included sex and total length (Table 3). The coefficient of variance for δ13C was not significant (p = 0.9) indicating that there were no differences in the corrected δ13C values across the size range of sharks. However, the coefficient of variance for δ15N values across total length was significant (p < 0.005). Linear regression analysis further clarifies this relationship showing a significant negative correlation between total length and δ15N variance (p < 0.005) (Figure 6).
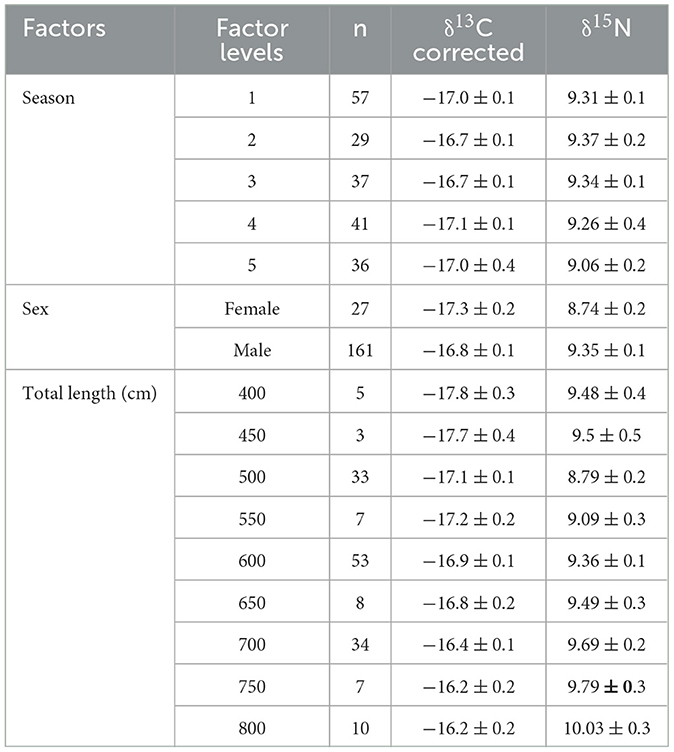
Table 4. Mean and standard error of corrected δ13C and δ15N values for whale shark data of each level within the factors of season, sex, and estimated size.
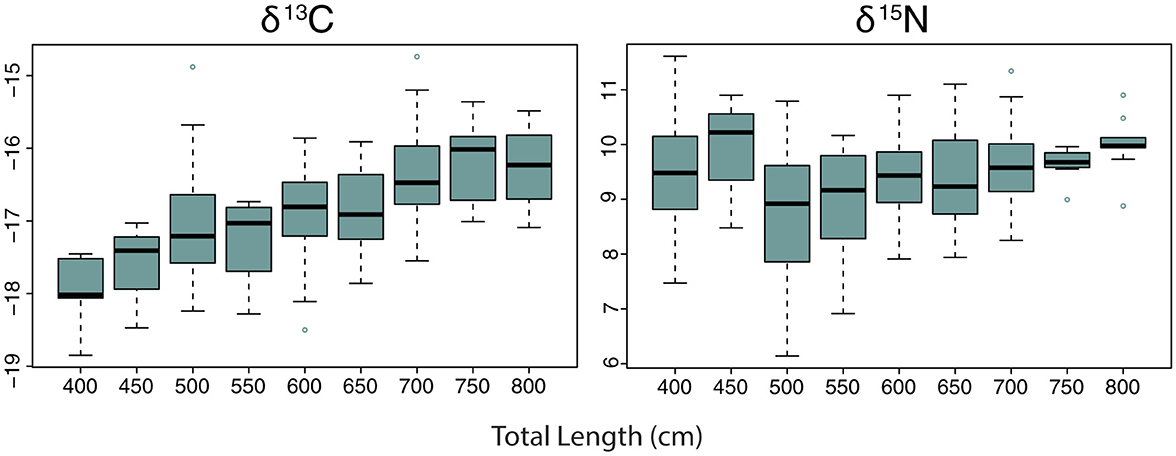
Figure 5. Variation of whale shark δ15N values by total length.
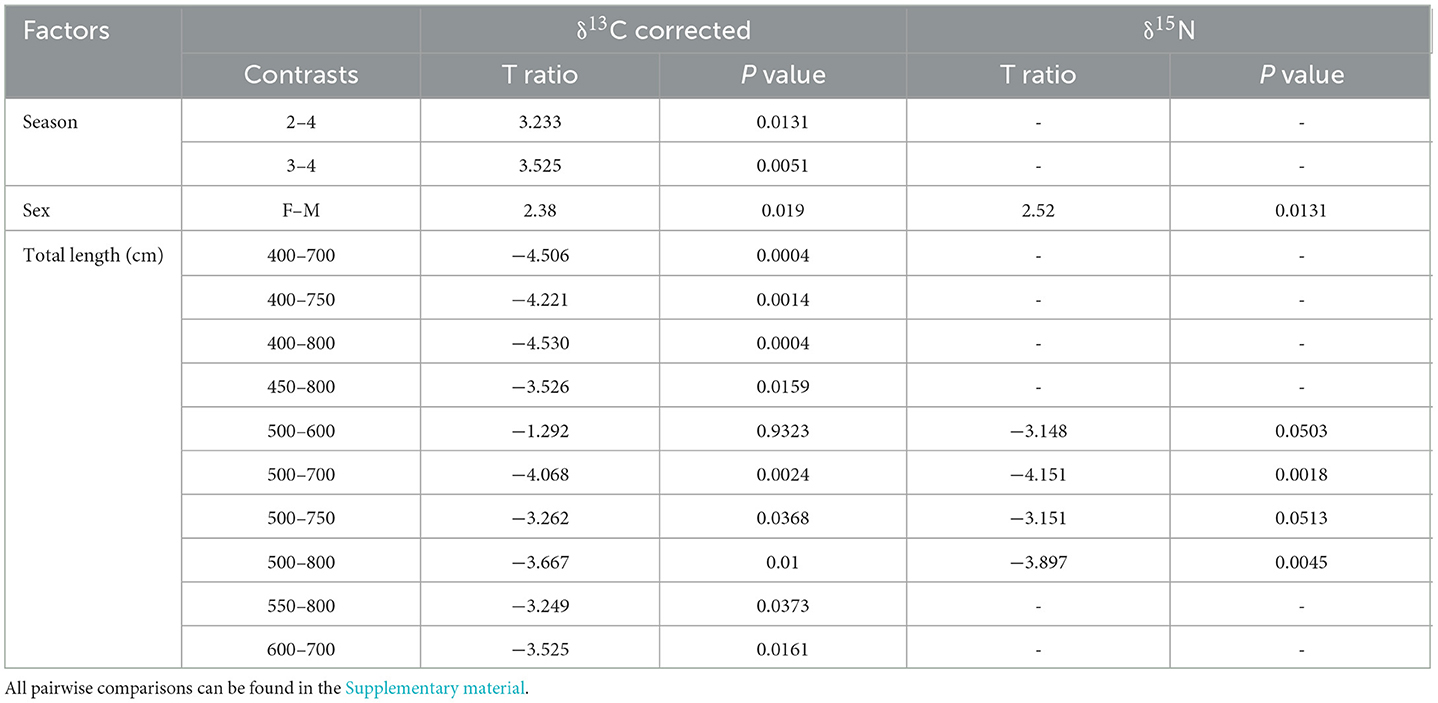
Table 5. Significant (p < 0.05 or t ratio >1.96) pairwise comparisons among levels for each factor (season, sex, and estimated size of corrected δ13C and δ15N values for whale shark data.
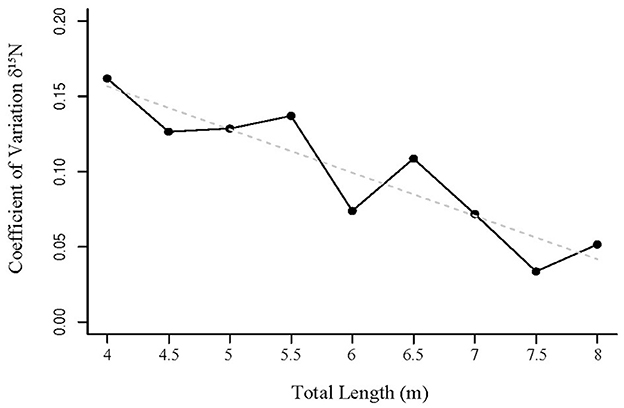
Figure 6. Coefficient of variation of whale shark δ15N values by total length. Regression line shown as dashed gray line.
Pairwise comparisons showed that male sharks had more enriched δ13C and δ15N values than females (Tables 4, 5). There was also a significant difference between several of the total length classes with δ15N also enriching as total length increased (Tables 4, 5; Figure 5).
3.3 Whale sharks and potential prey
A total of 133 samples of zooplankton and other local species were collected throughout this study (Table 1). Of all corrected δ13C values, the night and emergent zooplankton functional groups were the most enriched (−13.5 ± 2.5‰ and −13.5‰, respectively). On a species level, the inshore and benthic-associated jellyfish Mastigias papua and Cassiopeia ornata had the two highest corrected δ13C values (−12.6‰ and −10.9‰, respectively). The most δ13C depleted corrected values came from offshore and deep zooplankton (−18.8 ± 0.3‰ and −18.3 ±1.0‰, respectively). Jellyfish and whale sharks showed the greatest range of corrected δ13C values among functional groups (6.6‰ and 4.6‰, respectively; Table 1). Piscivorous fishes had the highest δ15N values (12.6 ± 1.1‰), while night zooplankton and jellyfish had the lowest values (5.4 ± 1.4‰ and 5.3 ± 1.9‰, respectively). The model that best explained variations in δ13C values for all samples included season only (Table 6). Pairwise comparisons showed that season four had significantly less enriched δ13C values than all other seasons (Table 5). The best model for δ15N included functional group only. However, in all functional group pairwise comparisons there were few (9 of 72) differences between groups (Table 7, Supplementary Table 3). In particular, pairwise comparisons revealed that δ13C and δ15N values for whale sharks were not different from any of the other functional groups (Table 7). Niche areas and the associated parameters varied widely (0.94–14.2‰2) (Supplementary Table 4) with feeding zooplankton (12.9‰2) and jellyfish (14.2‰2) with comparably large estimates, and offshore zooplankton (0.94‰2) and piscivores (2.93‰2) with the smallest areas. The credible intervals of prey groups also varied considerably. Variation in piscivores and night zooplankton groups are more likely to be a result of small sample sizes, whereas variation in jellyfish and feeding zooplankton might represent high within group variability.
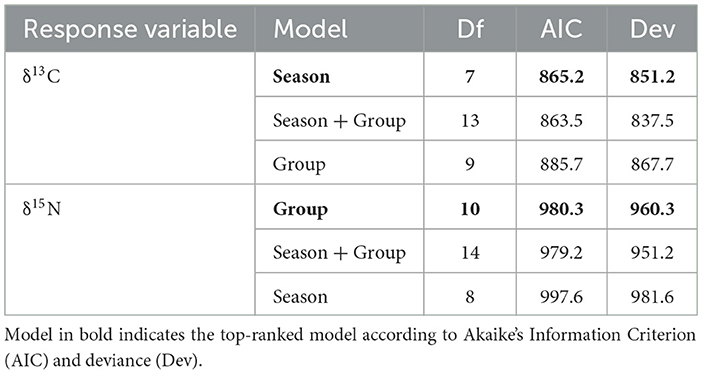
Table 6. Ranked linear mixed effects models for δ13C and δ15N values for all samples.
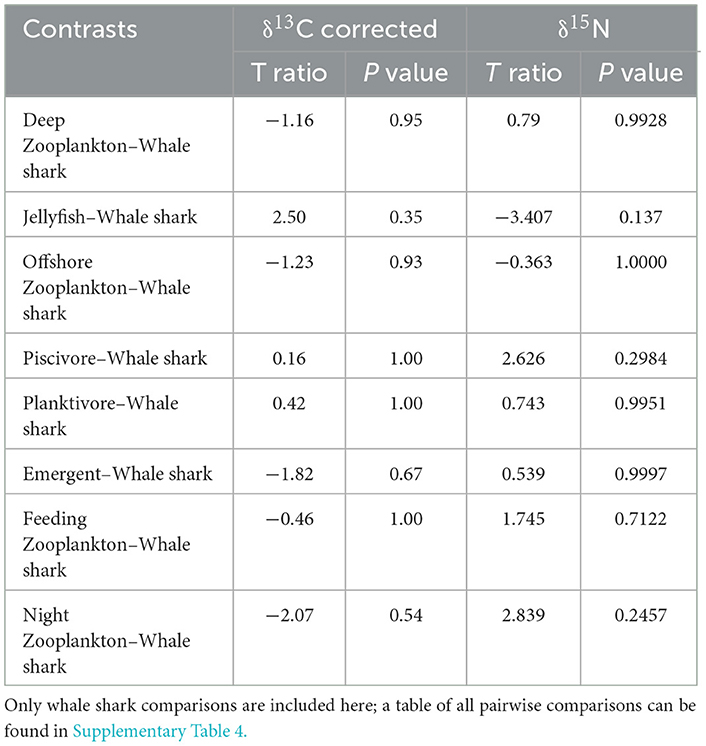
Table 7. Pairwise comparisons of corrected δ13C and δ15N values among whale sharks and all other functional groups. significance (p < 0.05 or t ratio >1.96).
4 Discussion
The isotopic analysis of whale sharks in the Mafia Island aggregation places them broadly in the secondary-tertiary consumer position within the local food web. The range of whale shark isotope values likely represents a variety of individual dietary preferences, and potentially some individual variability in bioprocessing and metabolic rates. With limited studies for comparison it is challenging to describe the isotopic niche width, and by proxy, the dietary width of the population with any certainty. Though by the metric measured here they appear to occupy a relatively small isotopic niche, with some difference between the sexes and size classes. The study time-frame likely exceeds the tissue turnover time of the subdermal tissue used here (56) but with some uncertainty. However, at the aggregation level, we did not detect any significant temporal changes across seasons in feeding behavior. Taken together with their unusually resident nature at this site (32), whale sharks at Mafia Island broadly appear to be creatures of habit, repeatedly feeding on the same prey sources over time. With a priori knowledge of their movement ecology at this site, the similarity of their isotopic profiles to the local food web over time suggests that Mafia Island is likely to be an important long-term foraging area.
4.1 Whale sharks
The trophic position estimated for whale sharks in this study is similar to previous estimates for wild juvenile whale sharks in other locations (28, 51, 54). However, given the uncertainties and differing assumptions surrounding trophic level calculations, particularly for whale sharks (27, 28, 55), each study may not be directly comparable. We therefore consider the trophic level as a range (1st Qu 2.31–3rd Qu. 3.35), rather than a single number, to allow for assumptions and individual variation in discrimination factors (56). Our results showed that whale sharks hold a position as secondary consumers within the local Mafia Island food web. This is further supported by observations of their feeding behavior and high site fidelity (30–32).
It is also worth noting that this, and most previous studies, have calculated shark trophic level estimates based on bulk δ15N, which arguably makes them less reliable than more advanced, compound-specific trophic position calculations (57). The singular study using compound-specific methods on wild whale sharks in Okinawa, Japan (56) found the lowest trophic position estimates presently published, calculated from various cartilage amino acids. The authors also noted caution around the uncertainty of assumed discrimination factors. However, setting aside the debate of the mathematical calculations behind trophic position estimates, a more ecological theory has also been presented to account for the lower-than-expected trophic level estimates derived from compound-specific SIA. It is thought that there may be a degree of herbivory in whale sharks' diet (28, 56). Indeed, marine macroalgae have been quite frequently found in the stomachs of stranded whale sharks (43, 58). While this is likely a result of incidental ingestion, it is still unclear physiologically how this could be filtered in large amounts (59), and to what degree digestion and assimilation could occur, though it is perhaps possible (60).
Due to the limited number of studies on whale shark stable isotope ecology, conclusions about the size of the whale shark isotopic niche at the population level are challenging. Niche area estimates here are comparable to those measured in Australia (28). While the slightly larger standard deviations and variability in the niche area calculations here for male sharks (the bulk of samples for both studies) suggest that the sharks in Tanzania might have a slightly larger variability in their isotopic niche space, and perhaps dietary strategies, than whale sharks in Australia. Relative to the other functional groups sampled during this study whale sharks have a relatively low isotopic niche area and associated credible intervals, and a low standard deviation of bulk values suggesting that within the Mafia Island ecosystem they have a relatively small isotopic niche, and by proxy, dietary niche.
4.2 Biological factors
Although there was a bias in the number of males and females sampled, reflecting the strong male bias present in this, and many other, whale shark aggregations (5), we found indications of dietary differences between sexes. Males had more enriched δ13C and δ15N values and a slightly smaller isotopic niche than females, which is supported by previous results from whale sharks in Western Australia (41) and India (40). The difference in isotope values was more pronounced in δ15N values, both in this study and in Australian sharks.
We found an incremental enrichment of both δ13C, and to a lesser extent δ15N values, with increasing whale shark total length, and decreasing niche area. The comparatively large isotopic niche calculations for smaller sharks suggests that they might be targeting a greater diversity of prey items than their conspecifics. Both these trends could suggest a size-related diet shift, or changes in the growth rate related to age, which can also reduce the isotope integration rates into tissues (56). The same δ13C and δ15N value size-related trends have been found in previous studies on whale sharks (40, 41). Whale sharks from India showed a positive relationship between total length and both δ15N and δ13C, indicating that either the larger sharks might be feeding at a higher trophic level overall, and or in different locations. A similar correlation was also observed for whale sharks in the Gulf of California and the Mexican Caribbean (29) and in Western Australia, particularly for female sharks (41). Here they also reported a decreasing niche area as shark size increased comparable to this study.
We might expect the size-related differences observed here, and in the previous studies, to be relatively small, as whale sharks are a slow-growing species (61) and only a subset (400–900 cm TL) of the overall length range of the species was sampled. Ontogenetic changes between small juveniles (<400 cm TL), juveniles (400–800 cm), and adults (>800 cm) are likely to be more pronounced. Additional sampling of a range of other size classes, not commonly present at aggregation sites, is required to further examine ontogenetic variation in diet.
Sex and size-related differences in SI values may also be attributed to either geographic or dietary preferences, physiological differences, or a combination of these. Relatively enriched δ13C and δ15N values in male and larger sharks could reflect a larger proportion of their diet derived from inshore feeding, deep water feeding or feeding at lower latitudes, as all of these habitats have comparatively enriched 13C and 15N (62, 63). Observational work at Mafia Island indicates that it is unlikely that male and larger sharks show a preference for inshore feeding, as both direct sightings and passive acoustic tracking data do not show sex or size-based differences in local habitat use (30–32). Feeding at lower latitudes is ecologically possible, with some evidence that Tanzanian sharks are sharing resources with Mozambican sharks at lower latitudes, perhaps in the particularly productive fishing grounds of northern Mozambique (31). Known distributions of whale sharks tell us that there is widespread habitat segregation by sex and size (5), yet even in more balanced aggregation sites, like the southern Red Sea, electronic tagging studies have not yet reported sex or size related segregation in long-distance movement patterns (64). While the population at Mafia Island is heavily male-biased for those sharks that have been observed within the bay, passive acoustic telemetry studies show no evidence of sexual differences in habitat use (32). Additional satellite tagging studies could serve to clarify some of the long-distance movements of whale sharks away from this coastal site. These sex and size-related differences are more likely to be driven by an increased proportion of piscivorous, benthic or deep-water feeding (62, 63, 65). For example, based on the respective isotope values of whale sharks and planktivorous fishes measured here, if the larger or male sharks target small bait fishes more frequently than smaller or female sharks, this could in part explain the isotopic enrichment of their tissues. Similarly, sex and size-related differences in the proportion of emergent zooplankton and deep-water prey could account for the observed SI values (63).
Alternatively, it is possible that physiological differences, including changes in discrimination factors with growth rate and starvation, drive the observed variation in SI values related to sex and size (50, 56, 66). Reduced N discrimination in faster-growing whale sharks could lead to significant decreases in bulk δ15N (56, 67), meaning the observed depletion of δ15N values in smaller sharks could be at least in part explained by their relatively higher growth rates, even if all size classes were consuming similar diets. Faster growth rates and by extension tissue turnover rates can also result in larger niche areas despite similar food sources (68, 69) which may account for the larger niche area in smaller sharks despite the larger overlap between size classes. As previously stated, these effects could be expected to be more pronounced in a dataset spanning a larger size range than sampled here, as very small whale sharks likely grow much faster than larger individuals. Developing a methodology to accurately assess the three dimensional shape and body condition of whale sharks both over time and between growth stages, as in other sharks (70) could be a useful factor to include in future dietary studies.
Starvation can also result in dramatic changes in discrimination factors leading to a reduction in plasma δ13C and δ15N values well below that of their diet (56). Even among similarly sized sharks, individual states of health could account for variations in isotope values, even if they had previously adopted similar feeding strategies. How protracted each bout of starvation would need to be to affect the isotope values in subdermal tissue is yet to be determined, as well as the effect of sustained intermittent starvation (which is more likely) in wild sharks. However, the importance of considering the individual biochemistry of each animal is demonstrated in the magnitude of isotopic variability of captive sharks with identical diets and environmental conditions (56). This highlights the need to include shark identity in the statistical analysis of isotope data where possible.
Several studies have documented trends in sex- and size-related isotopic values in whale sharks (28, 29, 40, 54). While these trends may not be individually pronounced, and authors have proposed alternative non-dietary environmental and biological explanations (often consistent with those discussed herein), the concordance of these findings, including the present study, increasingly suggests a discernible pattern in the isotopic ecology of this species.
4.3 Temporal factors
Individual sharks showed only small changes in isotopic variability within and between seasons. At the population level there were some indications of seasonal changes among the whale shark corrected δ13C values, although these changes were of similar magnitude to individual differences. Given the ~3-year estimate for tissue turnover rates of subdermal tissue (56), the 5 year duration of the data collection in this study is potentially long enough that it may have revealed any true temporal isotopic changes if significant dietary shifts had occurred at the population level. However if diet shifts were of a moderate magnitude or minimally fluctuating between years, we may not have been able to detect them. Particularly as the large sample size might contribute some noise to the data as a result of individual variation in turnover rates. The high long-term residency (30, 32) and limited latitudinal ranging (31) of whale sharks at Mafia Island do however support the idea that, while there may be variability in feeding strategies among individuals, at the population level they appear have an isotopically similar diet over the timeframe of this study. This consistency of feeding strategy across a similar time frame has also recently been alluded to in the whale shark aggregation in Western Australia (71).
4.4 Isotopic variation among whale sharks at Mafia Island
As a group, whale sharks hold a similar place in the food web at Mafia Island to other sympatric planktivorous and piscivorous fishes, which is consistent with field observations of then feeding on both small fishes and inshore epipelagic zooplankton. The range of individual isotopic values suggests dietary variation among whale sharks, with some individuals exhibiting isotopic signatures indicative of a diet rich in sergestid zooplankton, others reflecting a greater piscivorous component, and still others suggesting a reliance on offshore zooplankton.
The Kilindoni Bay ecosystem has several distinct topographical features that could account for some of the δ13C variation as well. Around the Bay terrestrial carbon inputs originate from freshwater runoff from the island, while detrital carbon inputs originate from the seagrass and mangrove system lining the bay. Seagrass and mangrove habitats and associated fauna have more negative δ13C values compared to coral reef and open ocean habitats (72). Both the detrital are likely to affect the δ13C values close to shore. This is reflected in the more negative δ13C values of the Cassiopeia and Mastigias jellyfish values which are both predominantly found close to shore in or around the seagrass beds and close to the mangroves lining the bay. Both jellyfish are shallow, inshore-associated species, and Cassiopeia are even often resting on the sediment in seagrass areas. Anthropogenic nitrogen sources flow into the bay via Kilindoni town, which included a fish processing factory, are also likely to cause localized enrichment in 15N. Additionally the visible plume of terrestrial output from the Rufiji River on the Tanzania mainland directly across from Mafia Island can often extend half-way to the island. The Rufiji delta contains one of the most extensive areas of mangrove forest in East Africa (73). Terrestrial runoff containing organic matter from plants with predominantly C3 photosynthetic pathways are usually depleted in 13C in comparison to marine C3 plants and marine ecosystems (74). The Rufiji river flow peaks in the wet season around April, which may contribute to increase the concentration of 13C rich nutrients in offshore waters where whale sharks occur outside of the peak season. Whether whale sharks display such fine-scale feeding choices over periods of longer than the likely tissue integration time (up to a few years) to produce such diverse signals among individuals is yet to be established, however, they do display individual residency patterns within the Bay (32) which may well extend to small scale feeding preferences.
A similarity between the 13C depleted offshore and deep water zooplankton could suggest that whale sharks travel away from the bay for foraging, most likely in the “off-season” in March-September time (32) and undertake deeper dives to target pelagic and mesopelagic prey. Generally stable isotope enrichment is assumed to increase with depth (63). Here we did not find a clear trend in our offshore plankton samples, perhaps related to the depth of chlorophyll maximum which lies at approximately 70 m (75), which lies within one of the collection depth bins for the plankton samples. The deep-water zooplankton shows a comparatively depleted δ13C signature compared to the rest of the functional groups sampled here. An “offshore” signal is thus more likely than a “deep-water” signal.
While we were unable to isotopically characterize deep water zooplankton in the region during this study there is evidence that deep water foraging is likely to be an important part of whale shark feeding behavior. Dive profiles of whale sharks indicate that they may access the deep scattering layer (DSL) in shallow water at night, and also opportunistically forage in the mesopelagic zone (76). Their deep diving behavior has been tentatively linked to the diel vertical migration (DVM) (43, 76), one of the largest daily movements of biomass on the planet (77–79) and a substantial food and energy source for many vertebrate predators (80). This food source is likely to be particularly important for those that move long distances between patches of ephemeral productivity in the euphotic zone (81–83). Characterization of this potential food source in the region would assist in characterizing whale shark diet more precisely in future studies.
5 Conclusions
At the time of sampling, the number of individual whale sharks sampled here represents almost half of the identified aggregation at Mafia Island. This has provided an opportunity to assess diet across the majority of the sharks that are routinely present, with the addition of a novel temporal component. This in addition to the cumulative knowledge from the handful of biochemical studies of whale sharks thus far, has allowed some additional insights into whale shark trophic ecology and has certainly highlighted important areas of future work.
Our results have placed the whale sharks within the Mafia Island ecosystem in a manner that lines up with our current understanding of the aggregation and the species. Stable isotope analysis of this aggregation places whale sharks broadly in a secondary to tertiary consumer position within the Kilindoni Bay food web. This aggregation exhibits individual dietary specialization among whale sharks, as well as dietary distinctions based on sex and ontogeny. However at a population level they appear to have a relatively small isotopic niche with no significant detectable temporal changes, suggesting a consistent and relatively small dietary width. Whether their prey is exclusively or predominantly derived from within Mafia Island waters specifically is not clear-cut. However, the unusually high philopatry of the aggregation and their behavior suggests that the area is certainly an important feeding location over large time scales. Some individuals have been seen every year for over a decade at this location and “feeding” is the behavior recorded ~80% of the time during encounters across the aggregation (authors unpublished data).
Anthropogenic and topographic features within, and in close proximity to the Bay could account for some of this diversity through small-scale habitat segregation and feeding preferences, meaning the whale sharks wouldn't necessarily have had to travel great distances to account for the diversity of isotopic values across individuals. However, this study has not exhaustively sampled all possible dietary items of this highly mobile species. Further sampling and isotopic analysis, as well as additional biochemical methods such as fatty acid analysis and compound-specific SI analyses, would complement these results and also provide further taxonomic and habitat resolution.
There is some compelling evidence that sex and size influence the whale sharks' feeding ecology. Males and larger sharks likely select higher trophic levels, and/or deep-water dietary items more often. This observed enrichment could also indicate foraging at lower latitudes. While females and smaller sharks appear to be more diverse feeders. Given the reduced likelihood of sightings of smaller and female sharks at coastal sites it is reasonable to assume that they are pursuing different feeding strategies. Tracking of long-distance horizontal and vertical movements at this site may assist in clarifying this point.
In addition, it is worth noting that all elements investigated here are subject to the assumptions of standardized growth rates, health condition, and tissue turnover rates. These are unlikely to be the same for all whale sharks in an aggregation, although for most of these considerations, there is little published data on elasmobranchs. Species-specific investigations will be essential to allow more robust and detailed conclusions to be made from future isotopic studies. Ultimately, a multi-faceted approach incorporating diverse biochemical and tracking techniques will be crucial to unravel the complete story of whale shark foraging ecology.
Data availability statement
The raw data supporting the conclusions of this article will be made available by the authors, without undue reservation.
Ethics statement
The animal study was approved by the ERGO Ethics Committee, University of Southampton. The study was conducted in accordance with the local legislation and institutional requirements.
Author contributions
CP: Conceptualization, Data curation, Formal analysis, Funding acquisition, Investigation, Methodology, Project administration, Resources, Software, Writing – original draft, Writing – review & editing. LC: Supervision, Validation, Writing – review & editing. CR: Conceptualization, Data curation, Funding acquisition, Project administration, Resources, Supervision, Writing – review & editing. SP: Conceptualization, Data curation, Funding acquisition, Project administration, Resources, Supervision, Writing – review & editing. CT: Conceptualization, Formal analysis, Funding acquisition, Investigation, Methodology, Project administration, Resources, Software, Supervision, Validation, Writing – review & editing.
Funding
The author(s) declare that financial support was received for the research and/or publication of this article. This project was funded by the Aqua-Firma, the Shark Foundation, WWF Tanzania, WWF Sweden/SIDA, Waterlust, 2 private trusts, and Patreon supporters.
Acknowledgments
We thank Dr. Jenny Huggett and Dr. Hans M. Verheye and the Department of Environmental Affairs: Oceans and Coastal Research in South Africa for providing the deep-sea plankton data from Agulhas II Cruise. We thank Liberatus Mokoki and his team for their assistance in the field, and Jason Rubens, Mathias Igulu, Haji Machano, Paul Kugopya, Sware Semesi, the WWF Tanzania team as well as Amin Abdallah from the Mafia Island Marine Park for facilitating the project. Thanks to Carlos Omari and the team at Whale Shark Lodge and to Jean and Anne de Villiers for hosting us. Thanks to Fernando Cagua for his help in the field and his feedback on the manuscript. We thank Kenny Wolfe, Jens Paulsen, Rilke Ballero, Alexandra Watts, Stella Diamant, Sophia Lind, and David Robinson for their help in the field and Alina Riensema and Michael Pfundt for help with photo-ID processing. We thank all citizen scientists who contributed photo-ID data. Thanks also to the MMF team and board for administrative support.
Conflict of interest
The authors declare that the research was conducted in the absence of any commercial or financial relationships that could be construed as a potential conflict of interest.
Publisher's note
All claims expressed in this article are solely those of the authors and do not necessarily represent those of their affiliated organizations, or those of the publisher, the editors and the reviewers. Any product that may be evaluated in this article, or claim that may be made by its manufacturer, is not guaranteed or endorsed by the publisher.
Supplementary material
The Supplementary Material for this article can be found online at: https://www.frontiersin.org/articles/10.3389/frish.2025.1414859/full#supplementary-material
References
1. McClain C, Balk M, Benfield M, Branch T, Chen C, Cosgrove J, et al. Sizing ocean giants: patterns of intraspecific size variation in marine megafauna. PeerJ. (2015) 3:e715. doi: 10.7717/peerj.715
2. Cicimurri DJ, Knight JL. Late Oligocene sharks and rays from the Chandler bridge formation, Dorchester county, South Carolina, USA. Acta Palaeontol Pol. (2009) 54:627–47. doi: 10.4202/app.2008.0077
3. Dove ADM, Pierce SJ. Whale Sharks: Biology, Ecology, and Conservation. London, England: CRC Press (2021). doi: 10.1201/b22502
4. de la Parra Venegas R, Hueter R, González Cano J, Tyminski J, Gregorio Remolina J, Maslanka M, et al. An unprecedented aggregation of whale sharks, Rhincodon typus, in Mexican coastal waters of the Caribbean Sea. PLoS ONE. (2011) 6:e18994. doi: 10.1371/journal.pone.0018994
5. Norman BM, Holmberg JA, Arzoumanian Z, Reynolds SD, Wilson RP, Rob D, et al. Undersea constellations: The global biology of an endangered marine megavertebrate further informed through citizen science. Bioscience. (2017) 67:1029–43. doi: 10.1093/biosci/bix127
6. Rohner CA, Richardson AJ, Prebble CEM, Marshall AD, Bennett MB, Weeks SJ, et al. Laser photogrammetry improves size and demographic estimates for whale sharks. PeerJ. (2015) 3:e886. doi: 10.7717/peerj.886
7. Cade DE, Levenson JJ, Cooper R, de la Parra R, Webb DH, Dove ADM. Whale sharks increase swimming effort while filter feeding, but appear to maintain high foraging efficiencies. J Exp Biol. (2020) 223:jeb224402. doi: 10.1242/jeb.224402
8. Martin AP, Naylor GJP. Independent origins of filter-feeding in megamouth and basking sharks (order lamniformes) inferred from phylogenetic analysis of cytochrome b gene Sequences. In: Biology of the Megamouth Shark. Tokyo: Tokai University Press (1997) 39–50.
9. Sims DW. Sieving a living: a review of the biology, ecology and conservation status of the plankton-feeding basking shark Cetorhinus maximus. Adv Mar Biol. (2008) 54:171–220. doi: 10.1016/S0065-2881(08)00003-5
10. Nelson JD, Eckert SA. Foraging ecology of whale sharks (Rhincodon typus) within Bahía de Los Angeles, Baja California Norte, México. Fish Res. (2007) 84:47–64. doi: 10.1016/j.fishres.2006.11.013
11. Motta PJ, Maslanka M, Hueter RE, Davis RL, de la Parra R, Mulvany SL, et al. Feeding anatomy, filter-feeding rate, and diet of whale sharks Rhincodon typus during surface ram filter feeding off the Yucatan Peninsula, Mexico. Zoology. (2010) 113:199–212. doi: 10.1016/j.zool.2009.12.001
12. Rohner CA, Prebble CEM. Whale shark foraging, feeding, and diet. In: Whale Sharks. Boca Raton: CRC Press (2021). p. 153–180. doi: 10.1201/b22502-8
13. Meekan M, Jarman S, McLean C, Schultz MB. DNA evidence of whale sharks (Rhincodon typus) feeding on red crab (Gecarcoidea natalis) larvae at Christmas Island, Australia. Mar Freshwater Res. (2009) 60:607–9. doi: 10.1071/MF08254
14. Rohner CA, Armstrong AJ, Pierce SJ, Prebble CEM, Cagua EF, Cochran JEM, et al. Whale sharks target dense prey patches of sergestid shrimp off Tanzania. J Plankton Res. (2015) 37:352–62. doi: 10.1093/plankt/fbv010
15. Robinson DP, Jaidah MY, Jabado RW, Lee-Brooks K, Nour El-Din NM, Al Malki AA, et al. Whale sharks, Rhincodon typus, aggregate around offshore platforms in Qatari waters of the Arabian Gulf to feed on fish spawn. PLoS ONE. (2013) 8:e58255. doi: 10.1371/journal.pone.0058255
16. Motta PJ, Wilga CD. Advances in the study of feeding behaviors, mechanisms, and mechanics of sharks. Environ Biol Fishes. (2001) 60:131–56. doi: 10.1007/978-94-017-3245-1_10
17. Norman BM, Morgan DL. The return of “Stumpy” the whale shark: two decades and counting. Front Ecol Environ. (2016) 14:449–50. doi: 10.1002/fee.1418
18. Araujo G, Lucey A, Labaja J, So CL, Snow S, Ponzo A. Population structure and residency patterns of whale sharks, Rhincodon typus, at a provisioning site in Cebu, Philippines. PeerJ. (2014) 2:e543. doi: 10.7717/peerj.543
19. Sigsgaard EE, Nielsen IB, Bach SS, Lorenzen ED, Robinson DP, Knudsen SW, et al. Population characteristics of a large whale shark aggregation inferred from seawater environmental DNA. Nat Ecol Evol. (2016) 1:4. doi: 10.1038/s41559-016-0004
20. Pierce SJ, Norman B. Rhincodon typus. The IUCN Red List of Threatened Species 2016. (2016). doi: 10.2305/IUCN.UK.2016-1.RLTS.T19488A2365291.en
21. Capietto A, Escalle L, Chavance P, Dubroca L, Delgado de Molina A, Murua H, et al. Mortality of marine megafauna induced by fisheries: insights from the whale shark, the world's largest fish. Biol Conserv. (2014) 174:147–151. doi: 10.1016/j.biocon.2014.03.024
22. Womersley FC, Leblond ST, Rowat DRL. Scarring instance and healing capabilities of whale sharks and possible implications. In: The 4th International Whale Shark Conference. Hamad bin Khalifa University Press (HBKU Press) (2016). doi: 10.5339/qproc.2016.iwsc4.67
23. Hussey NE, Dudley SFJ, McCarthy ID, Cliff G, Fisk AT. Stable isotope profiles of large marine predators: viable indicators of trophic position, diet, and movement in sharks? Can J Fish Aquat Sci. (2011) 68:2029–45. doi: 10.1139/f2011-115
24. Meyer L, Pethybridge H, Nichols PD, Beckmann C, Huveneers C. Abiotic and biotic drivers of fatty acid tracers in ecology: a global analysis of chondrichthyan profiles. Funct Ecol. (2019) 33:1243–55. doi: 10.1111/1365-2435.13328
25. Chan AJ, Raoult V, Jaine FRA, Peddemors VM, Broadhurst MK, Williamson JE. Trophic niche of Australian cownose rays (Rhinoptera neglecta) and whitespotted eagle rays (Aetobatus ocellatus) along the east coast of Australia. J Fish Biol. (2022) 100:970–8. doi: 10.1111/jfb.15028
26. Trueman CN, MacKenzie KM, Palmer MR. Identifying migrations in marine fishes through stable-isotope analysis. J Fish Biol. (2012) 81:826–47. doi: 10.1111/j.1095-8649.2012.03361.x
27. Stephens RB, Shipley ON, Moll RJ. Meta-analysis and critical review of trophic discrimination factors (Δ13C and Δ15N): Importance of tissue, trophic level and diet source. Funct Ecol. (2023) 37:2535–48. doi: 10.1111/1365-2435.14403
28. Marcus L, Virtue P, Nichols PD, Ferreira LC, Pethybridge H, Meekan MG. Stable isotope analysis of dermis and the foraging behavior of whale sharks at Ningaloo reef, western Australia. Front Mar Sci. (2019) 6:546. doi: 10.3389/fmars.2019.00546
29. Whitehead DA, Murillo-Cisneros D, Elorriaga-Verplancken FR, Hacohen-Domené A, De La Parra R, Gonzalez-Armas R, et al. Stable isotope assessment of whale sharks across two ocean basins: Gulf of California and the Mexican Caribbean. J Exp Mar Bio Ecol. (2020) 527:151359. doi: 10.1016/j.jembe.2020.151359
30. Cagua EF, Cochran J, Rohner C, Prebble CEM, Sinclair-Taylor T, Pierce SJ, et al. Acoustic telemetry reveals cryptic residency of whale sharks. Biol Lett. (2015) 11:20150092. doi: 10.1098/rsbl.2015.0092
31. Prebble CEM, Rohner CA, Pierce SJ, Robinson DP, Jaidah MY, Bach SS, et al. Limited latitudinal ranging of juvenile whale sharks in the Western Indian Ocean suggests the existence of regional management units. Mar Ecol Prog Ser. (2018) 601:167–83. doi: 10.3354/meps12667
32. Rohner CA, Cochran JEM, Cagua EF, Prebble CEM, Venables SK, Berumen ML, et al. No place like home? High residency and predictable seasonal movement of whale sharks off Tanzania. Front Mar Sci. (2020) 7:1–16. doi: 10.3389/fmars.2020.00423
33. Rohner CA, Venables SK, Cochran JEM, Prebble CEM, Kuguru BL, Berumen ML, et al. The need for long-term population monitoring of the world's largest fish. Endanger Species Res. (2022) 47:231–48. doi: 10.3354/esr01177
34. Jiddawi NS, Öhman MC. Marine fisheries in Tanzania. Ambio. (2002) 31:518. doi: 10.1639/0044-7447(2002)031[0518:MFIT]2.0.CO;2
35. Chande M, Kimirei IA, Igulu MM, Kuguru B, Kayanda R, Mwakosya C, et al. Assessment of the impacts of artisanal fishing gears on nearshore fish stocks along coastal waters off the Kilwa–Mafia seascape in Tanzania. Reg Stud Mar Sci. (2019) 27:100531. doi: 10.1016/j.rsma.2019.100531
36. Peterson S, Lovasoa D, Shahid U, Videira E, Ravelona M, Kwizela R, et al. Annual report 2023/24 WWF south west Indian ocean regional programme. World Wildlife Fund. (2024). Available online at: https://wwfafrica.awsassets.panda.org/downloads/wwf-south-west-indian-ocean-annual-report-2023.pdf (accessed December 14, 2024).
37. Pierce SJ, Holmberg J, Kock AA, Marshall AD. Photographic identification of sharks. In: Shark research: emerging technologies and applications for the field and Laboratory. (2018). p. 220–234.
38. Rohner CA, Norman BM, Reynolds S, Araujo G, Holmberg J, Pierce SJ. Population ecology of whale sharks. In: Dove ADM, and Pierce Boca SJ. Whale Sharks. Raton: CRC Press (2021). p. 129–152. doi: 10.1201/b22502-7
39. Vichi M. Winter 2017 Cruise Report S.A. Agulhas II: Marine Research Institute, Department of Oceanography, UCT (2017).
40. Borrell A, Cardona L, Kumarran RP, Aguilar A. Trophic ecology of elasmobranchs caught off Gujarat, India, as inferred from stable isotopes. ICES J Mar Sci. (2011) 68:547–54. doi: 10.1093/icesjms/fsq170
41. Marcus L, Virtue P, Nichols PD, Meekan MG, Pethybridge H. Effects of sample treatment on the analysis of stable isotopes of carbon and nitrogen in zooplankton, micronekton and a filter-feeding shark. Mar Biol. (2017) 164:124. doi: 10.1007/s00227-017-3153-6
42. Post DM, Layman CA, Arrington DA, Takimoto G, Quattrochi J, Montaña CG. Getting to the fat of the matter: models, methods and assumptions for dealing with lipids in stable isotope analyses. Oecologia. (2007) 152:179–89. doi: 10.1007/s00442-006-0630-x
43. Rohner CA, Couturier LIE, Richardson AJ, Pierce SJ, Prebble CEM, Gibbons MJ, et al. Diet of whale sharks Rhincodon typus inferred from stomach content and signature fatty acid analyses. Mar Ecol Prog Ser. (2013) 493:219–35. doi: 10.3354/meps10500
44. Villagómez-Vélez SI, Carreón-Palau L, Mejía-Zepeda R, González-Armas R, Aguíñiga-García S, Vázquez-Haikin A, et al. Fatty acid composition of whale shark (Rhincodon typus), and zooplankton in two aggregation sites in the Gulf of California. Reg Stud Mar Sci. (2024) 76:103577. doi: 10.1016/j.rsma.2024.103577
45. Kiljunen M, Grey J, Sinisalo T, Harrod C, Immonen H, Jones RI. A revised model for lipid-normalizing δ13C values from aquatic organisms, with implications for isotope mixing models: revised lipid-normalization model for C isotope analysis. J Appl Ecol. (2006) 43:1213–22. doi: 10.1111/j.1365-2664.2006.01224.x
46. Kump LR, Arthur MA. Interpreting carbon-isotope excursions: carbonates and organic matter. Chem Geol. (1999) 161:181–98. doi: 10.1016/S0009-2541(99)00086-8
47. Schlacher TA, Connolly RM. Effects of acid treatment on carbon and nitrogen stable isotope ratios in ecological samples: a review and synthesis. Methods Ecol Evol. (2014) 5:541–50. doi: 10.1111/2041-210X.12183
48. Carabel S, Godínez-Domínguez E, Verísimo P, Fernández L, Freire J. An assessment of sample processing methods for stable isotope analyses of marine food webs. J Exp Mar Bio Ecol. (2006) 336:254–61. doi: 10.1016/j.jembe.2006.06.001
49. Meekan M, Wilson S, Halford A, Retzel A. A comparison of catches of fishes and invertebrates by two light trap designs, in tropical NW Australia. Mar Biol. (2001) 139:373–81. doi: 10.1007/s002270100577
50. Kim SL, Casper DR, Galván-Magaña F, Ochoa-Díaz R, Hernández-Aguilar SB, Koch PL. Carbon and nitrogen discrimination factors for elasmobranch soft tissues based on a long-term controlled feeding study. Environ Biol Fishes. (2012) 95:37–52. doi: 10.1007/s10641-011-9919-7
51. Cortes E. Standardized diet compositions and trophic levels of sharks. ICES J Mar Sci. (1999) 56:707–17. doi: 10.1006/jmsc.1999.0489
52. Eckrich CA, Albeke SE, Flaherty EA, Bowyer RT, Ben-David M. rKIN: Kernel-based method for estimating isotopic niche size and overlap. J Anim Ecol. (2020) 89:757–71. doi: 10.1111/1365-2656.13159
53. R Core Team. R: A language and environment for statistical computing. Vienna, Austria. (2024). Available online at: https://www.R-project.org/ (accessed January 27, 2025).
54. Borrell A, Aguilar A, Gazo M, Kumarran RP, Cardona L. Stable isotope profiles in whale shark (Rhincodon typus) suggest segregation and dissimilarities in the diet depending on sex and size. Environ Biol Fishes. (2011) 92:559–67. doi: 10.1007/s10641-011-9879-y
55. Olin JA, Hussey NE, Grgicak-Mannion A, Fritts MW, Wintner SP, Fisk AT. Variable δ(15)N diet-tissue discrimination factors among sharks: implications for trophic position, diet and food web models. PLoS ONE. (2013) 8:e77567. doi: 10.1371/journal.pone.0077567
56. Wyatt A, Matsumoto R, Chikaraishi Y, Miyairi Y, Yokoyama Y, Sato K, et al. Enhancing insights into foraging specialization in the world's largest fish using a multi-tissue, multi-isotope approach. Ecol Monogr. (2019) 81:e01339. doi: 10.1002/ecm.1339
57. Won E-J, Choi B, Lee CH, Hong S, Lee J-H, Shin K-H. Variability of trophic magnification factors as an effect of estimated trophic position: Application of compound-specific nitrogen isotope analysis of amino acids. Environ Int. (2020) 135:105361. doi: 10.1016/j.envint.2019.105361
58. Rowat D, Brooks KS. A review of the biology, fisheries and conservation of the whale shark Rhincodon typus. J Fish Biol. (2012) 80:1019–56. doi: 10.1111/j.1095-8649.2012.03252.x
59. Paig-Tran EWM, Bizzarro JJ, Strother JA, Summers AP. Bottles as models: predicting the effects of varying swimming speed and morphology on size selectivity and filtering efficiency in fishes. J Exp Biol. (2011) 214:1643–54. doi: 10.1242/jeb.048702
60. Leigh SC, Papastamatiou YP, German DP. Seagrass digestion by a notorious “carnivore.” Proc Biol Sci. (2018) 285:20181583. doi: 10.1098/rspb.2018.1583
61. Meekan MG, Taylor BM, Lester E, Ferreira LC, Sequeira AMM, Dove ADM, et al. Asymptotic growth of whale sharks suggests sex-specific life-history strategies. Front Mar Sci. (2020) 7:774. doi: 10.3389/fmars.2020.575683
62. Hobson KA. Tracing origins and migration of wildlife using stable isotopes: a review. Oecologia. (1999) 120:314–26. doi: 10.1007/s004420050865
63. Trueman CN, Johnston G, O'Hea B, MacKenzie KM. Trophic interactions of fish communities at midwater depths enhance long-term carbon storage and benthic production on continental slopes. Proc Biol Sci. (2014) 281:20140669. doi: 10.1098/rspb.2014.0669
64. Berumen ML, Braun CD, Cochran JEM, Skomal GB, Thorrold SR. Movement patterns of juvenile whale sharks tagged at an aggregation site in the Red Sea. PLoS ONE. (2014) 9:e103536. doi: 10.1371/journal.pone.0103536
65. Davenport SR, Bax NJ. A trophic study of a marine ecosystem off southeastern Australia using stable isotopes of carbon and nitrogen. Can J Fish Aquat Sci. (2002) 59:514–30. doi: 10.1139/f02-031
66. Hussey NE, MacNeil MA, Olin JA, McMeans BC, Kinney MJ, Chapman DD, et al. Stable isotopes and elasmobranchs: tissue types, methods, applications and assumptions. J Fish Biol. (2012) 80:1449–84. doi: 10.1111/j.1095-8649.2012.03251.x
67. Trueman CN, McGill RAR, Guyard PH. The effect of growth rate on tissue-diet isotopic spacing in rapidly growing animals. An experimental study with Atlantic salmon (Salmo salar). Rapid Commun Mass Spectrom. (2005) 19:3239–47. doi: 10.1002/rcm.2199
68. Yeakel JD, Bhat U, Elliott Smith EA, Newsome SD. Exploring the isotopic niche: Isotopic variance, physiological incorporation, and the temporal dynamics of foraging. Front Ecol Evol. (2016) 4:1. doi: 10.3389/fevo.2016.00001
69. Gorokhova E. Individual growth as a non-dietary determinant of the isotopic niche metrics. Methods Ecol Evol. (2018) 9:269–77. doi: 10.1111/2041-210X.12887
70. Moorhead SG, Gallagher AJ, Merly L, Hammerschlag N. Variation of body condition and plasma energy substrates with life stage, sex, and season in wild-sampled nurse sharks Ginglymostoma cirratum. J Fish Biol. (2021) 98:680–93. doi: 10.1111/jfb.14612
71. Osorio BJ, Skrzypek G, Meekan M. Parasitic copepods as biochemical tracers of foraging patterns and dietary shifts in whale sharks (Rhincodon typus Smith, 1828). Interact Stud. (2023) 8:261. doi: 10.3390/fishes8050261
72. Marguillier S, Velde G, Dehairs F, Hemminga, Rajagopal S. Trophic relationships in an interlinked mangrove-seagrass ecosystem as traced by delta 13C and delta 15N. Mar Ecol Prog Ser. (1997) 151:115–21. doi: 10.3354/meps151115
73. Wang Y, Bonynge G, Nugranad J, Traber M, Ngusaru A, Tobey J, et al. Remote sensing of mangrove change along the Tanzania coast. Mar Geod. (2003) 26:35–48. doi: 10.1080/01490410306708
74. Bastos RF, Lippi DL, Gaspar ALB, Yogui GT, Frédou T, Garcia AM, et al. Ontogeny drives allochthonous trophic support of snappers: seascape connectivity along the mangrove-seagrass-coral reef continuum of a tropical marine protected area. Estuar Coast Shelf Sci. (2022) 264:107591. doi: 10.1016/j.ecss.2021.107591
75. Peter N, Semba M, Lugomela C, Kyewalyanga M. Seasonal variability of vertical patterns in chlorophyll-a fluorescence in the coastal waters off Kimbiji, Tanzania. West Indian Ocean J Mar Sci. (2021) 20:21–33. doi: 10.4314/wiojms.v20i1.3
76. Brunnschweiler JM, Baensch H, Pierce SJ, Sims DW. Deep-diving behaviour of a whale shark Rhincodon typus during long-distance movement in the western Indian Ocean. J Fish Biol. (2009) 74:706–14. doi: 10.1111/j.1095-8649.2008.02155.x
77. Hays GC. A review of the adaptive significance and ecosystem consequences of zooplankton diel vertical migrations. Hydrobiologia. (2003) 503:163–70. doi: 10.1007/978-94-017-2276-6_18
78. Potier M, Bach P, Ménard F, Marsac F. Influence of mesoscale features on micronekton and large pelagic fish communities in the Mozambique Channel. Deep-Sea Res II. (2013) 100:184–99. doi: 10.1016/j.dsr2.2013.10.026
79. Brierley AS. Quick guide Diel vertical migration. Curr Biol. (2014) 24:1074–6. doi: 10.1016/j.cub.2014.08.054
80. Pethybridge HR, Parrish CC, Bruce BD, Young JW, Nichols PD. Lipid, fatty acid and energy density profiles of white sharks: insights into the feeding ecology and ecophysiology of a complex top predator. PLoS ONE. (2014) 9:e97877. doi: 10.1371/journal.pone.0097877
81. Lalli C, Parsons T. Phytoplankton and primary production. In: Biological Oceanography: An Introduction. Elsevier (1997). p. 39–73. doi: 10.1016/B978-075063384-0/50003-7
82. Walli A, Teo SLH, Boustany A, Farwell CJ, Williams T, Dewar H, et al. Seasonal movements, aggregations and diving behavior of Atlantic bluefin tuna (Thunnus thynnus) revealed with archival tags. PLoS ONE. (2009) 4:e6151. doi: 10.1371/journal.pone.0006151
83. Bauer RK, Fromentin J-M, Demarcq H, Bonhommeau S. Habitat use, vertical and horizontal behaviour of Atlantic bluefin tuna (Thunnus thynnus) in the Northwestern Mediterranean Sea in relation to oceanographic conditions. Deep Sea Res Part 2 Top Stud Oceanogr. (2017) 141:248–61. doi: 10.1016/j.dsr2.2017.04.006
84. Smith, A. Description of New, or Imperfectly Known Objects of the Animal Kingdom, Found in the South of Africa. African Commercial Advertiser, 3 (1828). Available online at: http://www.rhinoresourcecenter.com/pdf_files/146/1463910081.pdf
85. Alava MNR, Yaptinchay AA, Acogido G, Dolar M, Louella L. Fishery and trade of whale shark (Rhincodon typus) in the Philippines. In: 13th Meeting of the American Elasmobranch Society (Pennsylvania). (1997). Available online at: http://elasmo.org/abst1997.php
87. Anderson C, Waheed A. The economics of shark and ray watching in the Maldives. Shark News (2001) 13.
88. Hsu HH, Joung SJ, Liu KM. Fisheries, management and conservation of the whale shark Rhincodon typus in Taiwan. J Fish Biol. (2012) 80:1595–607. doi: 10.1111/j.1095-8649.2012.03234.x
89. Speed CW, Meekan MG, Rowat D, Pierce SJ, Marshall AD, Bradshaw CJA. Scarring patterns and relative mortality rates of Indian Ocean whale sharks. J Fish Biol. (2008) 72:1488–503. doi: 10.1111/j.1095-8649.2008.01810.x
90. Li W, Wang, Y, Norman B. A preliminary survey of whale shark Rhincodon typus catch and trade in China: an emerging crisis. J Fish Biol. (2012) 80:1608–18. doi: 10.1111/j.1095-8649.2012.03250.x
91. Meyer W, Seegers U. Basics of skin structure and function in elasmobranchs: a review. J Fish Biol. (2012) 80:1940–67. doi: 10.1111/j.1095-8649.2011.03207.x
92. Satterfield IV FR, Finney BP. Stable isotope analysis of Pacific salmon: insight into trophic status and oceanographic conditions over the last 30 years. Prog Oceanogr. (2002) 53:231–46. doi: 10.1016/S0079-6611(02)00032-0
93. McMahon KW, Fogel ML, Elsdon TS, Thorrold SR. Carbon isotope fractionation of amino acids in fish muscle reflects biosynthesis and isotopic routing from dietary protein. J Anim Ecol. (2010) 79:1132–41. doi: 10.1111/j.1365-2656.2010.01722.x
Keywords: isotopes, diet, planktivore, elasmobranch, Tanzania
Citation: Prebble CEM, Couturier LIE, Rohner CA, Pierce SJ and Trueman CN (2025) Trophic and feeding ecology of whale sharks (Rhincodon typus) using bulk stable isotope analysis. Front. Fish Sci. 3:1414859. doi: 10.3389/frish.2025.1414859
Received: 09 April 2024; Accepted: 23 April 2025;
Published: 22 May 2025.
Edited by:
Julia L. Y. Spaet, University of Cambridge, United KingdomReviewed by:
Vincent Raoult, Griffith Sciences, Griffith University, AustraliaLucy Arrowsmith, Conservation and Attractions (DBCA), Australia
Takumi Tsutaya, Graduate University for Advanced Studies (SOKENDAI), Japan
Copyright © 2025 Prebble, Couturier, Rohner, Pierce and Trueman. This is an open-access article distributed under the terms of the Creative Commons Attribution License (CC BY). The use, distribution or reproduction in other forums is permitted, provided the original author(s) and the copyright owner(s) are credited and that the original publication in this journal is cited, in accordance with accepted academic practice. No use, distribution or reproduction is permitted which does not comply with these terms.
*Correspondence: Clare E. M. Prebble, Y2xhcmVAbWFyaW5lbWVnYWZhdW5hLm9yZw==