 Erick C. Jones1*
 Gohar Azeem1
 Erick C. Jones Jr.2
 Felicia Jefferson3*
 Marcia Henry4
 Shannon Abolmaali1
 Janice Sparks5
- 1Department of Industrial Engineering, The University of Texas at Arlington, Arlington, TX, United States
- 2Department of Industrial Engineering, The University of Texas at Austin, Austin, TX, United States
- 3Biology Academic Department, Fort Valley State University, Fort Valley, GA, United States
- 4Ochsner Clinic Foundation, New Orleans, LA, United States
- 5City of Houston (Health and Human Services), Houston, TX, United States
The underserved population could be at risk during the times of crisis, unless there is strong involvement from government agencies such as local and state Health departments and federal Center for Disease Control (CDC). The COVID-19 pandemic was a crisis of different proportion, creating a different type of burden on government agencies. Vulnerable communities including the elderly populations and communities of color have been especially hard hit by this pandemic. This forced these agencies to change their strategies and supply chains to support all populations receiving therapeutics. The National Science Foundation [National Science Foundation (NSF) Award Abstract # 2028612] funded RAID Labs to help federal agencies with strategies. This paper is based on a NSF funded grant to work on investigating supply chain strategies that would minimize the impact on underserved populations during pandemic. This NSF funded study identified the phenomena of last mile importance. The last mile transportation concept was critical in saving lives during the pandemic for underserved populations. The supply chain model then maximizes social goods by sending drugs or vaccines to the communities that need it the most regardless of ability to pay. The outcome of this study helped us prioritize the communities that need the vaccines the most. This informs our supply chain model to shift resources to these areas showing the value in real time prioritization of the COVID-19 supply chain. This paper provides information can be used in our healthcare supply chain model to ensure timely delivery of vaccines and supplies to COVID-19 patients that are the most vulnerable and hence the overall impact of COVID-19 can be minimized. The use of electrical vehicles for last mile transportation can help in significantly fighting the climate change.
Introduction
The understanding of supply chain and transportation in recent times has brought life and death to underserved communities in the US and other countries like India, United Kingdom, etc. The COVID-19 pandemic was a crisis of different proportion, creating a different type of burden on government agencies. The COVID-19 pandemic has severely affected the entire world with more than 168 million cases and over 3.5 million deaths worldwide (Johns Hopkins, 2021). The US is one of those countries, which has suffered the most from this disease with around 33 Million confirmed cases and approximately 600,000 deaths as of May 27, 2021. While this pandemic has affected the people of all races and origins, the African American and other communities of color have been specifically affected by the coronavirus pandemic (Dorn et al., 2020). According to a study about COVID-19 exacerbating inequalities in the US, the total number of deaths due to COVID-19 are disproportionately high among the African American communities as compared to the overall population in the US (Dorn et al., 2020). Another study was conducted to assess differential impacts of COVID-19 on black communities (Millet et al., 2020). The outcome of their study shows that counties that have highly black population are more susceptible to contracting the COVID-19 virus. After accounting for county-level factors such as age, poverty, epidemic duration and comorbidities, death due to coronavirus was significantly higher in black rural and small metro counties (Millet et al., 2020). According to the Office of Behavioral Health Equity (Office of Behavioral Health Equity, 2020), the coronavirus pandemic has exposed the deep-rooted disparity in the health care setup towards the underserved communities and aggravated the socio-economic factors that contribute to poor health outcomes. Racial and ethnic minority groups are experiencing higher rates of COVID-19 infection, hospitalization, and death. Inequities in the social determinants of health have historically prevented these groups from having the same opportunities for economic, physical, and emotional health. These inequities are highlighted by the factors that contribute to increased risk of COVID-19 exposure, severe illness from COVID-19, death, and unintended consequences of COVID-19 mitigation strategies (CDC 2020).
While the vaccines have already been developed for COVID-19, the big challenge is how to get these important medicines to the communities that are most at risk, especially in the underrepresented minority (URM) community. This challenge becomes more significant due to health disparities for underserved communities. An innovative and robust pandemic vaccine supply chain needs to be designed and developed to tackle the daunting task of mass vaccination under stringent operating constraints. Pandemics such as the coronavirus disease (hereafter COVID-19) exert severe pressure on healthcare systems, which in turn affects timely delivery and distribution of vaccines to healthcare centers. Most governments are responding to this distribution challenge by building or upgrading healthcare infrastructure to enhance geographic accessibility of health services. Nevertheless, it is equally important to design an optimal vaccine supply chain that supports an effective, agile, and responsive distribution network to maximize geographic coverage of populations at greater risk while keeping distribution lean. Evidence-based decision-making to help optimize and allocate vaccines in a timely manner is critical to protect lives during the COVID-19 pandemic. Health organizations are calling for novel approaches and methods to optimize immunization supply chains and meet the demands of an increasingly large and costly portfolio of vaccines (World Health Organization, 2020).
Different vaccines have been created in order to help reduce the spread of the virus (Calina et al., 2020). Government agencies ordered a lockdown to be put into place with social distancing and the use of wearing masks in order to control the COVID-19 pandemic. For long-term purposes, it is necessary to make sure that the vaccines are distributed evenly between the populations (National Governors Association Center for Best Practices, 2020). Given the complexity of global vaccine supply chains and the constraints related to supply, demand, and capacity, various distribution scenarios should be formulated to help optimize the system for acquiring, prioritizing, and distributing vaccines to the populace (Uscher-Pines et al., 2006; Medlock and Galvani, 2009; Biggerstaff et al., 2015; Davila-Payan et al., 2014). Few studies have been developed for an effective distribution for vaccines to make certain that the vaccines are delivered in an effective manner to the people who are in need the most (Medlock and Galvani, 2009) and (Lee et al., 2012). These studies did not fully take into consideration the constraints which affect a vaccine supply chain which can be optimized to mitigate the risk of the infection. As a result, a robust model is needed to conceptualize the process of the downstream vaccine supply chain in order to ensure efficient distribution of the vaccines.
The process of the distribution of the COVID-19 vaccines is a complex task. The last mile transportation concept is critical in saving lives during the pandemic for underserved populations. The focus of this research on optimizing COVID-19 therapeutics supply chain to get these lifesaving therapeutics to the communities that are most at risk, especially the underserved communities. This becomes more significant due to health disparities for underserved communities. This National Science Foundation funded study (Award Abstract # 2028612) identified the phenomena of last mile importance and its criticality in saving lives during the pandemic for underserved populations. The research which has been performed previously has not incorporated the factors and constraints which affect a vaccine supply chain which can be optimized to reduce the risk of the infection. We have defined community health index as a way to identify those communities, which are most vulnerable to COVID-19 and using this in our MIP supply chain model to prioritize highly vulnerable communities with higher service levels to ensure the timely availability of therapeutics to these underserved community. This paper develops a mathematical model to support vaccine allocation decisions based on exposure risk, and operational constraints including capacity of medical centers, vaccine stocks, and routes optimization. Using the city of Houston, Texas, the fourth largest city in US as a case study, we applied the proposed model to test different scenarios of vaccine allocation and distribution with different priority levels. In this study we assume that the vaccine is already manufactured and available in the market for distribution and that limited supply and excessive demand necessitate optimizing the allocation of vaccine by prioritizing people with higher risk of infection and greater probability of social contact with others; and that the vaccine is to be administered at state-run medical centers.
Background
An effective distribution of the vaccines is key for the risk mitigation of the community during a pandemic. A standard vaccine supply chain consists of the following: manufacture, packaging, storage, domestic and global distribution, cost-effective, and uninterrupted supply of vaccines to the population (U.S. Department of Health and Human Services, 2005). The difference between a standard vaccine supply chain and a pandemic vaccine is that, previously healthcare and other vaccine providers were to purchase vaccines directly from the manufacturers. For government agencies, they are more susceptible to buy the vaccines directly from the manufacturer in order to ensure an early vaccination delivery. Government agencies are then able to distribute the vaccines to health centers after the vaccines are procured. During pandemic vaccine supply chain, the healthcare providers register their interest with public health programs rather than with supply chain vendors (U.S. Department of Health and Human Services, 2005). Brown et al. (2014) hypothesized a typical vaccine supply chain as a four-level delivery system that incorporates the departmental stores, and one regional store.
Brandeau et al. (2003) showed that the optimum resource allocation depends on population size, the status of the pandemic on a local level, precautionary measures such as wearing masks, and the transmission rate of the infection. The demand and capacity to distribute the vaccines to the population, as needed, is an important parameter in the distribution model. There are, however, unpredictable emergency situations which will cause challenges when executing strategies to resolve the vaccine decision issues. Arora et al. (2010) used a cost-benefit-based model to optimize aid during public health emergencies. The key results of the research consisted of the following; a higher flexibility is to be accomplished by postponing on the decision of how to pre-allocate; smaller counties benefit more from mutual help, and lastly, in order for significant savings, groups should be prioritized in allotting the vaccines.
In the development of an optimum COVID-19 vaccine supply, it is determined by the constraints imposed by the vaccination context. Approximately 5.6 billion individuals in the world need to be vaccinated, meaning that there needs to be a mass production in a short period of time. Vaccine supply is delayed by the capacity of the method of delivery and the capacity of health care centers to vaccinate the individuals within the time period.
In the following sub-sections, previous literature on the communities that are disproportionately affected by the pandemic, vaccine supply chains and pandemic supply chains is presented and explored.
The Most at Risk Populations
COVID-19 pandemic has caused disproportionately effects on vulnerable populations, people of color or those with pre-existing health conditions. The elderly and underserved communities are particularly at most risk. 80% deaths reported in the U.S. have been in adults 65 years old and older (CDC, 2021). As seen in Figure 1 and Table 1, the percentage of COVID-19 deaths reported are far higher in elderly population of color as compared to others.
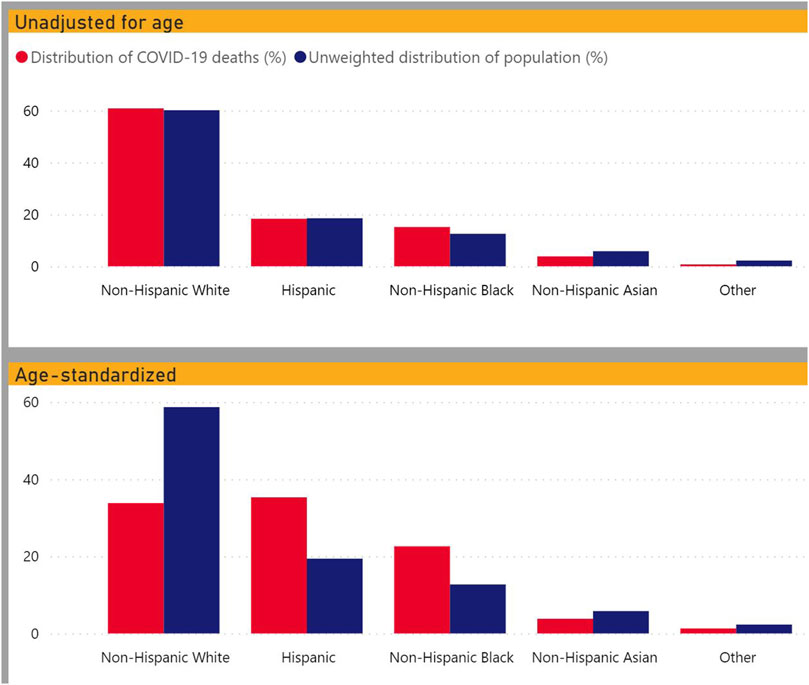
FIGURE 1. Crude and age-adjusted percent of COVID-19 deaths and unweighted population distribution by race (CDC, 2020).
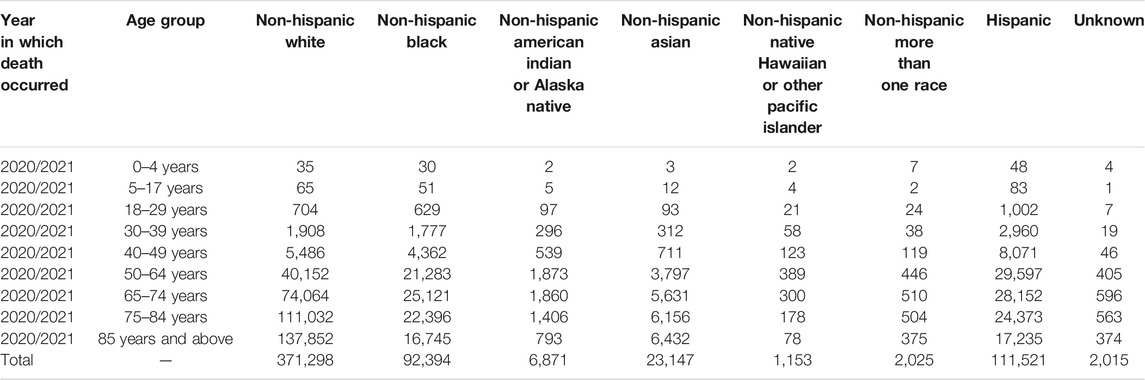
TABLE 1. Count and percent distribution of deaths involving COVID-19 with distribution of weighted and unweighted percent population by race and time period (CDC 2020).
A study of selected states and cities with data on COVID-19 deaths by race and ethnicity showed that 34% of deaths were among non-Hispanic Black people, though this group accounts for only 12% of the total U.S. population (Holmes et al., 2020). In Chicago, residents in highly segregated neighborhoods with higher social vulnerability, such as higher levels of poverty and lower levels of education, income, and employment, are disproportionately exposed to social and health risks. This intersection of factors was found to be associated with high death rates from COVID-19 (Kim and Bostwick, 2020).
Similarly, in a nationwide analysis, counties with higher population percentages of non-Hispanic Black people experienced higher COVID-19 confirmed case and death rates than counties with higher population percentages of non-Hispanic White people (Mahajan and Larkings-Pettigrew, 2020).
It is also concerning that a high percentage of Americans do not want to get vaccinated. A study shows that 31.1% of Americans do not intend to pursue being vaccinated when a COVID-19 vaccine becomes available (Callaghan et al., 2020). The likelihood of refusal is higher for Blacks, women, and conservatives, exacerbating existing disparities in COVID-19 outcomes. Blacks were more likely to be hesitant than Whites because of concerns about safety and efficacy, because they lack needed financial resources or health insurance, and because they already had COVID-19 (Callaghan et al., 2020).
Notably, previous research has also shown vaccine hesitancy among Blacks, with evidence that Blacks have refused to participate in HIV/AIDS vaccine trials and are less likely to receive annual influenza vaccinations (Immunizations and African Americans, 2018).
Any vaccine or treatment should target these high at risk populations first to prevent further loss of life. Therefore, this study looked to identify how socially and medically vulnerable populations overlapped, if and how much they are being underserved in the current testing paradigms, and how to design supply chain for vaccines or drug treatments that prioritizes the vulnerable ensuring they get treatments they need regardless of their income status.
Vaccine Supply Chains
The current literature on vaccine supply chain is immeasurable and hypothesized. The majority of the studies were driven by the vaccine effectiveness procurement, distribution and allocation to vaccinate a wider population. Lee et al. (2011) investigated the impact of a new vaccine on the existing vaccine supply chain with a deterministic mathematical Equation-Based Model (EBM). The results illustrated that the distribution of the newly introduced vaccine needed additional storage and transportation capacity to effectively implement the program of the vaccination. Similarly, by taking into account scheduling preferences of patients and scheduling inconvenience (Abrahams and Ragsdale, 2012), argued that the distribution of vaccines presents a number of operations management challenges like, multi-dose vaccine packages, rapid spoilage upon opening, high-cost of wastage, and vaccination needs of patients.
Storage capacity is another factor which impacts the vaccine supply chains. Shittu et al. (2016) analyzed the influence of variance in supply and demand under scenarios which enhance the supply chain’s capability to meet the storage requirements. In Nigeria, a simulation was developed for vaccine storage capacity. The study showed that there was a 55% increase in the storage capacity which was needed to meet the vaccination needs. With the establishment of three more vaccine delivery hubs, there could be a decrease of cold storage requirement of 55–33%. The redesign of old vaccine supply chains can therefore be crucial for capacity utilization.
Hospitals and other service providers play a vital role in ensuring that the vaccines are distributed and dispensed effectively. Lin et al. (2020) created a mathematical model to analyze the decision of the distributor to use a cold chain or non-cold chain to deliver the vaccines. Next, the model was to analyze the influence of a single-step or two-step standard inspection policy of the retailers on the distributor’s decision whether to use the cold chain or not. The results represented that the two-step policy, despite being stricter and more costly, was less effective in influencing the distributor to select the cold chain option than the single-step policy was.
Pandemic Vaccine Supply Chains
In the case of pandemics, vaccine supply chains consist of their own specifics such as, scale, exposure, time-space levels, and constraints. Uscher-Pines et al. (2006) evaluated a sample of 45 national pandemic influenza prioritization plans, including 19 developed and 26 developing countries. It was found that 28 (14 developed and 14 developing countries) out of 45 nations have provided for prioritized vulnerable groups of the population for vaccination. In some countries, higher prioritization of high-risk individuals by healthcare workers and service workers is embedded in the national pandemic vaccination plan (ibid). The study concluded by emphasizing the need to establish priority settings based on individualized modeling or impact estimates to enhance the effectiveness of large-scale vaccination programs to mitigate the risk of community transmission during a pandemic (Uscher-Pines et al., 2006).
Araz et al. (2012) prioritized 15 counties of Arizona based on four distinct H1N1 pandemic vaccine distribution strategies: pro rata distribution; sequential distribution by population size; sequential distribution by estimated periods of pandemic peaks; and reverse sequential distribution by estimated order of pandemic peaks. The study demonstrated that the policies would be effective to reduce the pandemic’s impact by optimizing waiting times for vaccines. The results revealed that the two most effective policies for controlling the epidemic and reducing unmet demand are pro rata distribution and prioritization of communities expected to experience the latest outbreak.
Previous research by Huang et al. (2017) and Chen et al. (2020) has investigated risk-based pro rata distribution and prioritization for vaccine allocation in order to reduce the spread of the virus. Medlock and Galvani (2009) used a parametrized model with survey-based contact and mortality data from influenza pandemics to determine optimum vaccine allocation minimizing five outcome measures: deaths, infections, years of life lost, contingent valuation, and economic costs. They found that optimal vaccination is feasible by prioritization of schoolchildren and adults from the ages of 30–39 years (Medlock and Galvani 2009). Buccieri and Gaetz (2013) argued that in a pandemic outbreak, priority for vaccination should be given to population groups at high risk and who would experience difficulty reaching health centers, such as homeless people and other disadvantaged groups, to ensure equity and utility. During the H1N1 outbreak in Toronto, the city managed to vaccinate 38 percent of the homeless people via highly accessible community-based vaccine clinics. Taking New York City as a case study, Chen et al., 2020 applied an age-structured simulation model to explore the optimal allocation strategy for the COVID-19 vaccine. They divided the population into seven compartments, and then each compartment was further divided into five age-groups. They analyzed the impact of both static and dynamic policies. The results showed that, when the objective is to minimize deaths, the optimal static approach is to vaccinate the oldest group first and then the younger groups. However, when the target is to mitigate total confirmed cases, then the optimal static policy is to allocate vaccines to younger people even if the supply is scarce. Sudan and Taggar (2021) used the concept of Transport Intelligence and Logistics Systems for recovering Supply Chain Disruptions in Post-COVID-19 Pandemic.
In recent years, with an increased focus on renewable energy and the potential reduction of transportation’s impact on climate change and other environmental issues, the electric vehicles (EVs) have high importance to address these challenges. Project Drawdown describes electric vehicles as one of the 100 best contemporary solutions for addressing climate change (Electric Cars @ProjectDrawdown #ClimateSolutions, 2020). Even though the emissions from the power plants are used to fuel the vehicles, the electric vehicles will reduce the global air pollution significantly Technologies for EV are increasing which include extending driving ranges and reducing costs (Chan and Wong, 2004). The EVs are not only helping in fighting climate change, but also providing more economical mode of transportation as well. According to a study by Idaho National Laboratory (2010), the breakdown for a gas-powered car vs. an electric car comes out to be $9.83 per 100 miles for a gas car and $5.27 per 100 miles for an electric vehicle. When directly compared, the cost to power an electric vehicle is about half of what it costs to fuel your gas-powered car.
This project aims to create a supply chain model that prioritizes geographic sections in the cities that house vulnerable communities. The study identified the phenomena of last mile importance in achieving the objectives. The last mile transportation concept was critical in saving lives during the pandemic for underserved populations. Integrating the last mile concept along with an accessible healthcare index (CHI) will allow for real-time strategies. The strategies are defined as mathematical models that could be used in real-time for these at-risk communities. The use of electric vehicles (EVs) for last mile transportation will help in reducing carbon emission and fighting climate change.
Methodology
Model Overview
The global activities during pandemic influenced the strategies real-time including testing protocols, ventilators distribution, and vaccine manufacturing, which impacted the strategies in real-time. Our research objective is to understand how the COVID-19 therapeutics (Immunizations, drugs etc.) can be delivered to underserved communities including the last mile transportation, to prevent and minimize the impacts of COVID-19. For this NSF funded study, we are focusing on the city of Houston, which is the fourth largest city in US. We worked with the Houston Department of Health and Human Services (HDHHS) to capture the data needed to model a community that has these challenges. The Houston Department of Health and Human Services HDHHS has the responsibility for community health, particularly for the underserved population that might not have commercial insurance plans (Medicaid and Medicare). The HDHHS also has an elderly care division that distributes care between the services facilities, the hospitals and home care. Our research focuses initially on the most vulnerable population for the COVID-19 population, namely the elderly in underserved populations who receive personal home services from HDHHS. For this study, we will focus on 97 zip codes in city of Houston. The details are shown in Table 2.

TABLE 2. assumption and data collection details.
We worked with HDHHS to collect the COVID-19 related data in these zip codes including the total number of reported cases in each zone, number of active cases and total number of deaths.
Initially, we assume our current demand (dj) is the total number of cases reported in each zone for modelling supply chain. We collected the data during the first phase of COVID-19 vaccine distribution where demand was much higher than the availability of vaccines supply, so we will be focusing on elderly population above the age of 60 and healthcare workers, who were supposed to get the vaccine at the earliest.
As mentioned previously, we want to highlight and prioritize the communities, which are at high risk or are more vulnerable to COVID-19 outbreak. In this study, we defined a new term called “Community Health Index (CHI)”. The CHI is calculated using a proprietary modified health index that takes into account social-economic indicators and has the ability to use artificial intelligence for behavior patterning. The data for modified health index and other indicators for different regions has been provided by HDHHS, which is used to calculate the community health index. This CHI helps us in identifying those communities, which house the most vulnerable populations. We can use this information in our mixed integer programming (MIP) optimized supply chain model to prioritize these communities using the concept of higher service level. The CHI is calculated using below equation (Jones et al., 2020).
Health Index: (modified RTN) with heavier weighting of the HDHHS 8 health factors from the questionnaire. Our health index is based on Houston’s Vulnerability Index, a mostly health focused indicator. However, they added some additional data so that it could be used to identify who needs help in an emergency like a hurricane or extreme flooding.
Socio-Economic Index: Combination of different indicators such as education, average income etc. in different zones. Our Socioeconomic Index is based on the CDC’s Social Vulnerability Index, which takes into account socioeconomic status, household compositions and disability, minority status and language, and housing type and transportation.
Behavioral Index: We are also using the COVID-19 active case information to inform our CHI. In the future we plan to use AI to determine who is at risk and who will need treatment soon.
By taking all three of these indices, we produce one simple CHI score. That CHI score can be used into the supply chain model and prioritize treatment shipments. The higher the CHI rate, more vulnerable that zone is to COVID-19.
Multi-Objective Optimization and Supplier Selection in Supply Chains
The existing literature primarily focuses on optimization of one objective function viz cost or profit and other important factors such as customer service and vendor management are neglected. Since we seek to optimize off of community and to prioritize geographic regions in supply chain model on the basis of service levels, we will use multi-objective optimization. There are multiple techniques for multi-objective optimization such as Σ-constrained method, sequential optimization, weighted method, and distance-based model. (Jones et al., 2020). introduced a multi-objective stochastic supply chain model that incorporates Six Sigma approach to assess the financial risk. The model consists of design of four-echelon supply chain that includes identifying objectives, establishing model constraints, evaluating the economic risk and formulation of model by multi-objective Σ constrained method. In this paper, we utilize the Σ-constrained method to optimize profits and quality objective function. In the Figure 2, the four-echelon supply chain configuration is shown. The most important part of this supply chain is last mile transportation from hospitals or therapeutics distribution points to underserved communities. This last mile transportation is critical in saving lives during the pandemic for these underserved populations.
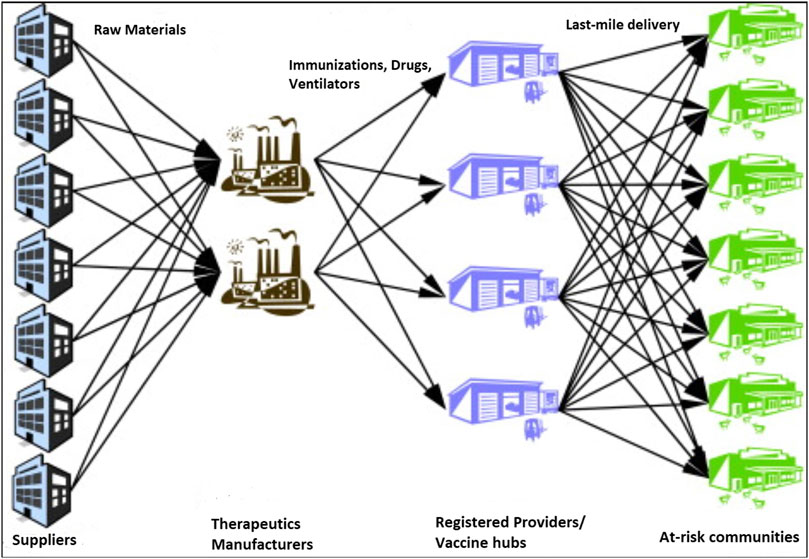
FIGURE 2. Jones and Azeem’s echelon supply chain Configuration (Jones et al., 2020).
Mathematical Model
This model is based on the supply network design problem. Given a set of producers, depots, and customers (zip codes), the goal is to determine how to satisfy customer demand while minimizing transport costs and service. This problem can be regarded as one of finding minimum cost flow through a network. Our primary objective is to ensure that the immunizations and the drugs are delivered to required population when required, so we use higher service levels for regions that are highly vulnerable to COVID-19.
Sets and Indices
Parameters
We have made several assumptions about the variables as shown in Table 2. Our focus is on two major cost for this study. The first cost is the transportation cost from manufacturers to central hubs, registered providers and finally at-risk communities including the last mile component. We have assumed the cost per mile to be 1$/mile based on the estimates shared by city of Houston. The second cost is the penalty cost which shows the impact of shortages to these at-risk communities. For equal distribution, we have considered this amount to be $70, which was the cost two doses of Pfizer vaccine at the time of data collection. For prioritized distribution to at-risk communities, the penalty cost is $70 for at-risk communities and half of it for other population. We have a total of five major vaccine hubs in Houston and 278 registered providers in 97 zip codes in Houston.
We have incorporated the service level in our model using the imputed shortage cost. In the equation, α value will be utilized for required service level in a particular region, which will be used to calculate the imputed shortage cost. The higher the service level, the higher the imputed shortage cost will be, which reflects the main focus on those regions with higher service levels to minimize the imputed shortage cost. The secondary objective is to reduce the overall cost which includes transportation cost and holding cost. We will use Mixed Integer Programming (MIP) for transportation cost along with Q,r Inventory Model to calculate the overall holding cost. We will use the outcome from GIS mapping and Community health Index to prioritize more vulnerable zones in that scenario, so that those who need the medicinal the most can get it on time.
Decision Variables
Objective Function
Cost: Minimize total shipping costs.
Constraints
Producer output: Flow of goods from a producer must respect maximum capacity.
Customer demand: Flow of goods must meet customer demand.
Depot flow: Flow into a depot equals flow out of the depot.
Depot capacity: Flow into a depot must respect depot capacity.
Scenarios
In order to us to find the impact of different supply and demand scenarios on service levels to at-risk communities and the overall costs, especially when demand is much higher than supply, we have created different scenarios, and we will use the data provided by Houston Health Department in our model to analyze and compare the output for each scenario. As shown in Table 3, we will run and analyze eight different scenarios for this study. The first four scenarios are considering equal distribution for all communities, and last four scenarios will prioritize underserved communities as highlighted by Community Health Index score for each region.
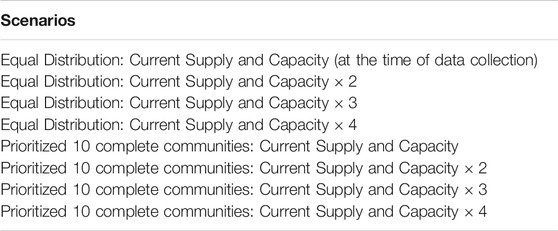
TABLE 3. list of all eight scenarios with equal distribution and prioritized distribution.
In the first scenario, the actual supply of the vaccine and capacity of the registered providers was far less than the actual demand (20% of Houston population) consisting of elderly population above 60 and healthcare workers. In second scenario, we doubled the actual supply of the vaccine and capacity of the registered providers to measure the performance variables. In third and fourth scenarios, we increased the supply and capacity by 3 times and 4 times to again measure the performance variables such as service levels and costs. As mentioned earlier, first four scenarios were used with equal distribution for all population without using CHI scores to prioritize underserved communities. In last four scenarios, we used the same approach, but by using the CHI scores to prioritize the underserved communities in our model using higher service level concept and higher imputed shortage costs or penalty costs.
Results and Discussion
The section below discusses geographical mapping of city of Houston using the CHI scores and COVID-19 information as input, followed by discussion on results of different scenarios using optimized supply chain model.
Geographical Mapping
Using the Modified Health Index and Social-Economic Index for each zip code in Houston to calculate the CHI score, as well as the data for total number of reported cases and deaths for COVID-19 and geographical information, we created a map that overlay COVID information by zip codes with vulnerable communities, as shown in Figure 3.
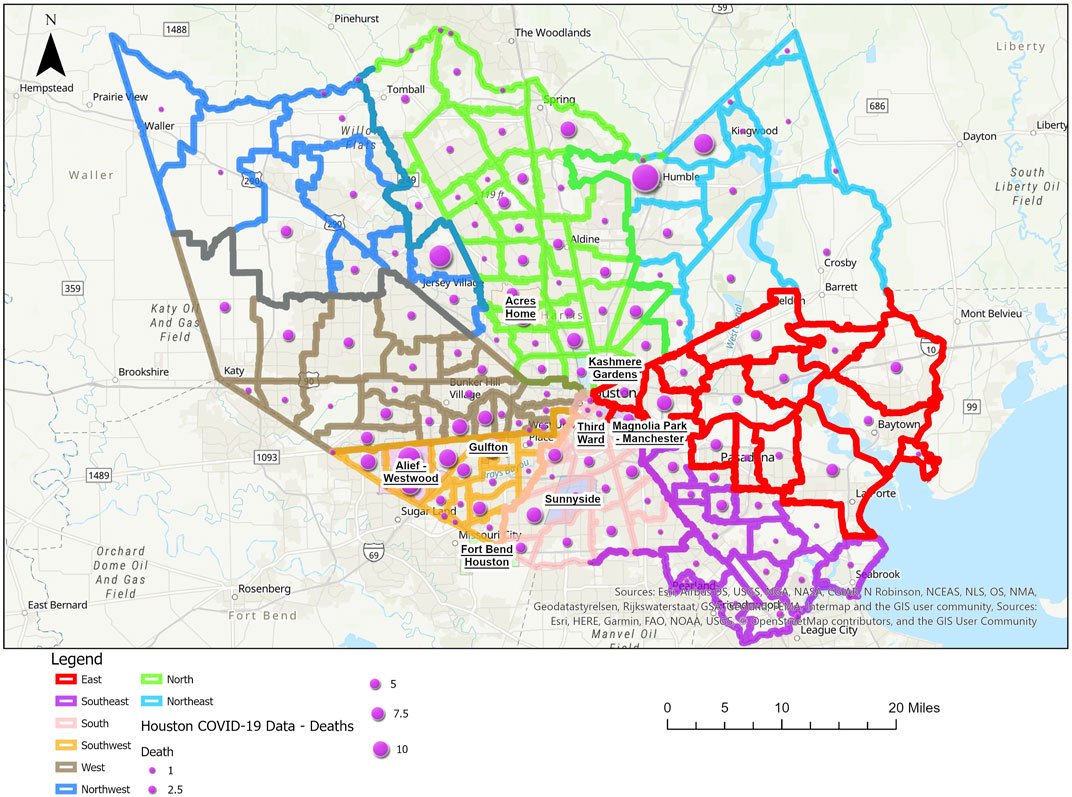
FIGURE 3. The map of city of Houston with all zip codes and COVID-19 deaths.
As discussed earlier, at the time of data collection, we were in phase I of COVID-19 vaccine distribution where demand was far higher than the supply of vaccines; we considered the elderly population and healthcare workers as the actual demand, which is 20% of the total population as per the collected data. The number of vaccination administration points, including hospitals, pharmacies and other locations at the time of data collection was 278 in Houston with five major central hubs in Houston providing vaccine shipments to these locations. All this information was used to create a new map along with 86 neighbourhoods as defined by city of Houston. As shown in Figure 4, the blue starts in the map shows the vaccine administration points (Hospitals, pharmacies etc.) closest to different neighborhoods.
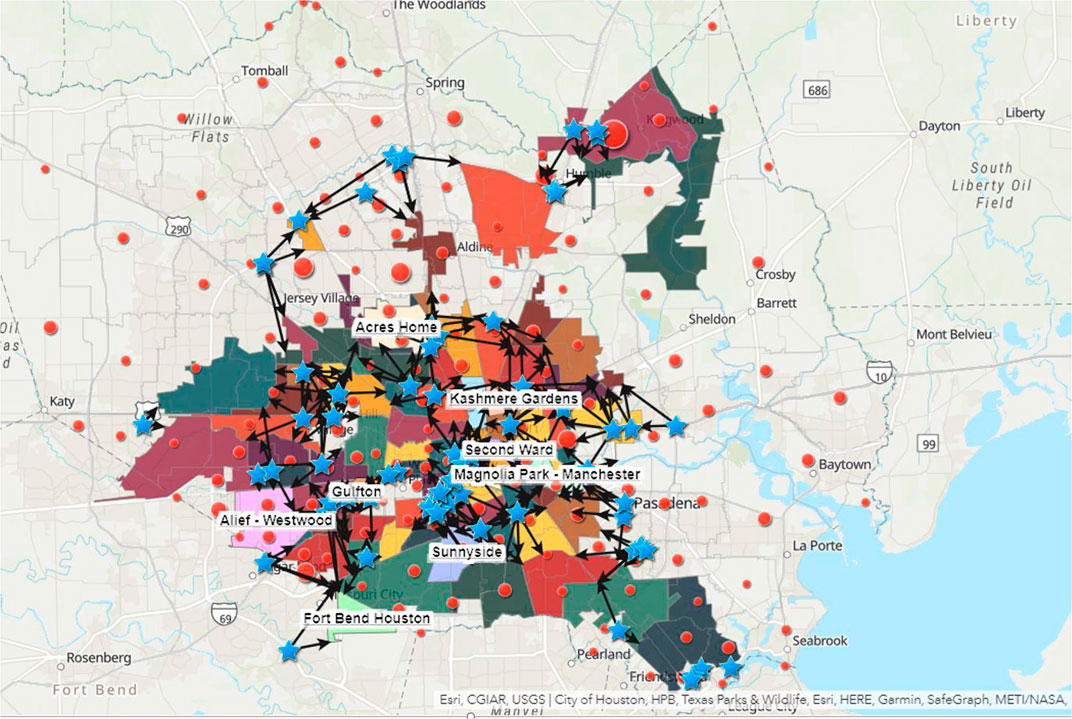
FIGURE 4. The map of city of Houston with 86 Neighbourhoods and nearest hospitals.
Results for Different Scenarios in Equal Distribution
Using the data collected with the help of Houston Health Department, we ran our optimized supply chain model for the first four scenarios with equal distribution for all communities without prioritizing underserved communities using community health index (CHI). As described in methodology section, the actual supply of the vaccine and capacity of the registered providers is far less than the actual demand (20% of Houston population) consisting of elderly population above 60 and healthcare workers in the first scenario. In scenario 2-4, we increased the supply of vaccines and capacity of registered providers to measure the performance variables of different costs and service level.
From our supply chain model output given in Figure 5, for all scenarios of equal distribution to all communities, we can see that in the penalty cost due to shortage is very high in scenario 1. This is because the demand is much higher and the supply of vaccines and capacity of registered providers of vaccines, this resulted in majority of the target population not provided with vaccines and leading to very higher penalty cost or imputed shortage cost. As we double the supply and capacity in second scenario, the penalty cost is reduced from 34 Million USD to 22 Million USD, but even then this penalty cost is on much higher side as still a huge number of target population are not provided with vaccine. As we keep on increasing the supply of vaccine and capacity of registered providers in scenario 3 and 4, the penalty cost keeps on reducing, until it reaches zero at scenario 4, which means that supply is equal, or more than the demand and all target population is served.
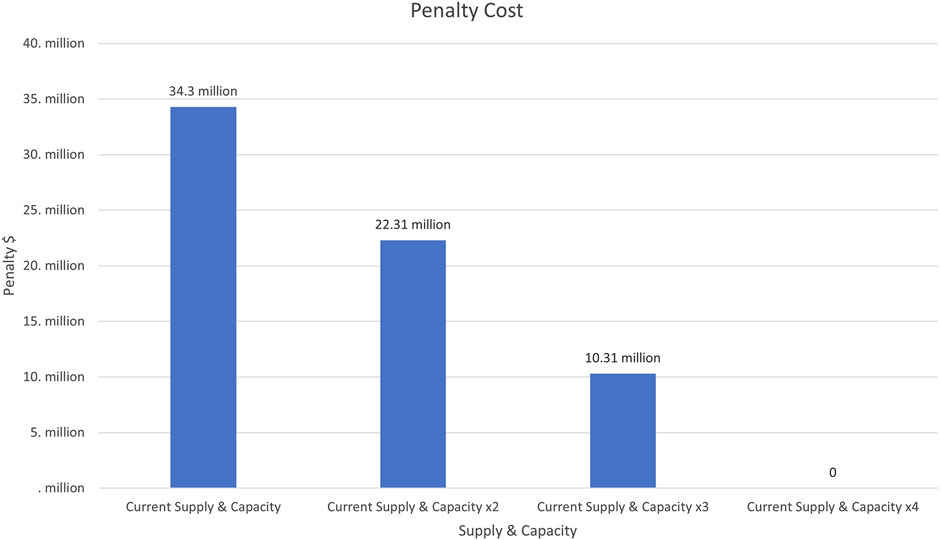
FIGURE 5. Penalty cost for four scenarios with equal distribution.
Similarly, if we look at the transportation cost in Figure 6, including the last mile from all major hubs to vaccines administration points (registered providers) to locations of target population, we observe that the transportation cost is relatively low for scenario one and as we keep on increasing supply of vaccines in scenario 2–4, it increases the transportation cost. This is because in scenario 1, majority of the people are not provided with vaccines due to vaccine shortage, so less miles of transportation are covered. As we cover more people in scenario 2–4, transportation cost increase and gets to maximum level at scenario 4, where all target population is covered. It is worth noting that the transportation cost is far lower than the penalty cost. This is because the primary focus of our study is to save lives of people by providing them with vaccines, and reducing overall cost is secondary objective by optimizing routes and allocating optimal inventory levels, so penalty cost is more significant for our study.
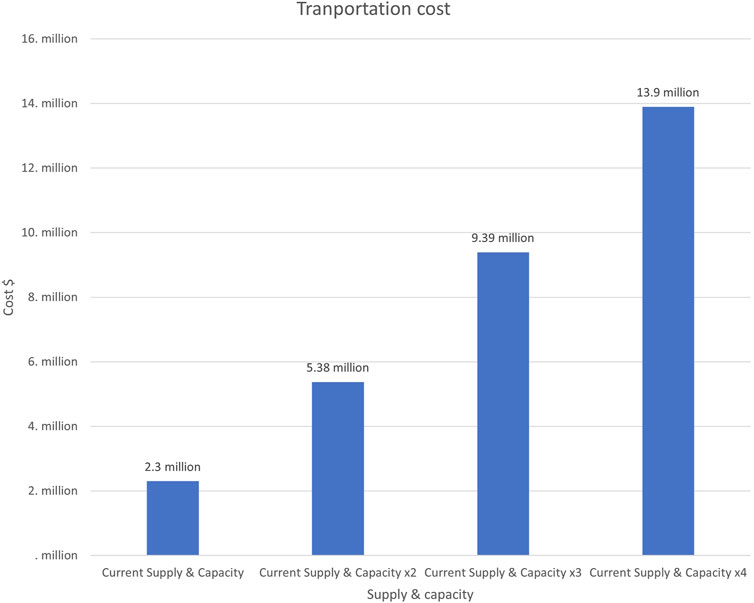
FIGURE 6. Transportation cost for four scenarios with equal distribution.
Similarly, if we look at the total cost in Figure 7, we find out that as we reduce the shortages by increasing the supply of the vaccines, the total cost is significantly reduced as penalty costs have more significant and are drastically reduced by minimizing shortages.
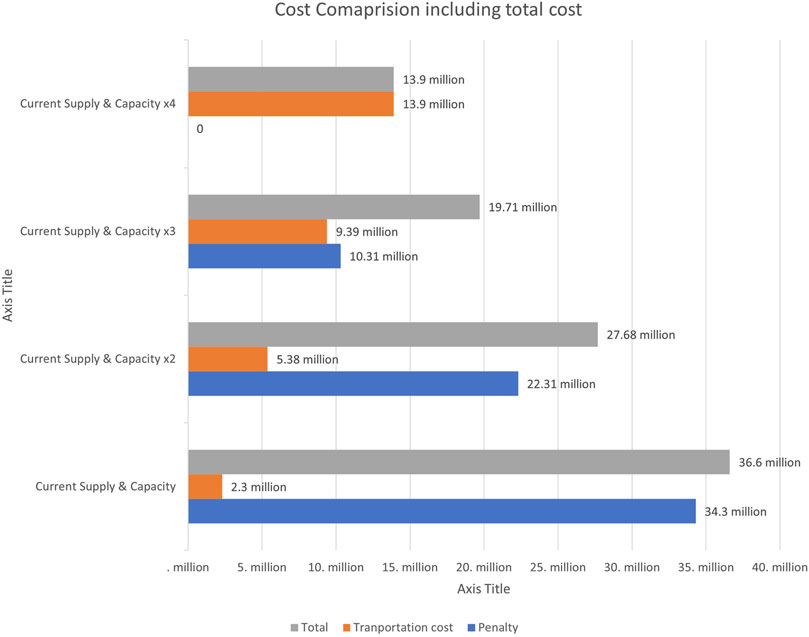
FIGURE 7. Cost comparison for four scenarios with equal distribution.
The above cost analysis is echoed by the output of service levels as shown in Figure 8, for equal distribution scenarios. In the first scenario, the service level is only 32%, which means that only 32% of the target population is provided with the vaccine. As we keep on increasing the supply of vaccines and capacity of registered providers from scenario 2-4, the service levels are increased and eventually reach 100% in scenario 4, where current supply and capacity is increased 4 times and it becomes equal or more than the current demand.
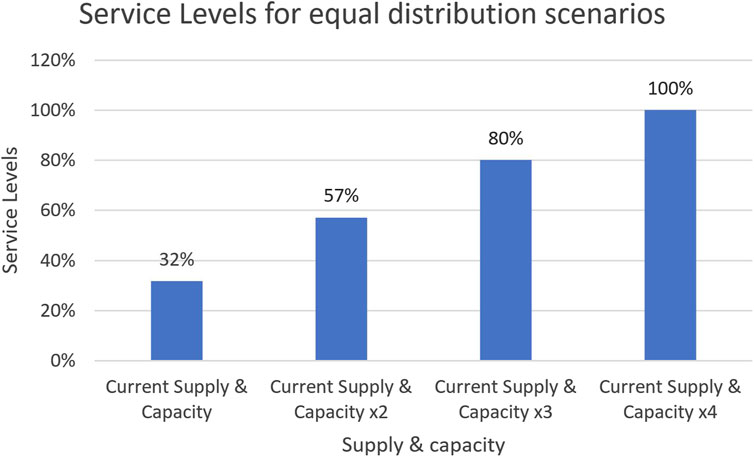
FIGURE 8. Service levels for four scenarios with equal distribution.
Results for Different Scenarios in Prioritized Distribution
In the previous section, we discussed the results of our supply chain model for equal distribution of therapeutics to all communities with four different scenarios of vaccine supply and providers’ capacity to administer vaccine. In this section, we will discuss the results of prioritized distribution, using our CHI scores to prioritize underserved communities using our supply chain model. We will use imputed shortage cost or penalty cost and service levels as variables to prioritize these underserved communities in our model.
In Figure 9, we can observe the same trend that we observed with equal distribution. The imputed shortage cost or penalty cost is very high in scenario 1 with current supply and capacity. As we increase the supply of vaccine and capacity of vaccine administration points or providers to match the demand from scenario 2–4, the penalty cost would increase drastically, eventually falling to zero in scenario 4 where supply is more than the demand. This figure for penalty cost for prioritized distribution looks similar to penalty cost chart for equal distribution in this case, but it is not always like that. The difference here is that the zip codes or neighborhoods that house underserved communities are prioritized here based on higher CHI scores and this drives our supply chain model to give higher service levels to these geographic regions of underserved communities. We will discuss this more when looking at service levels for prioritized distribution.
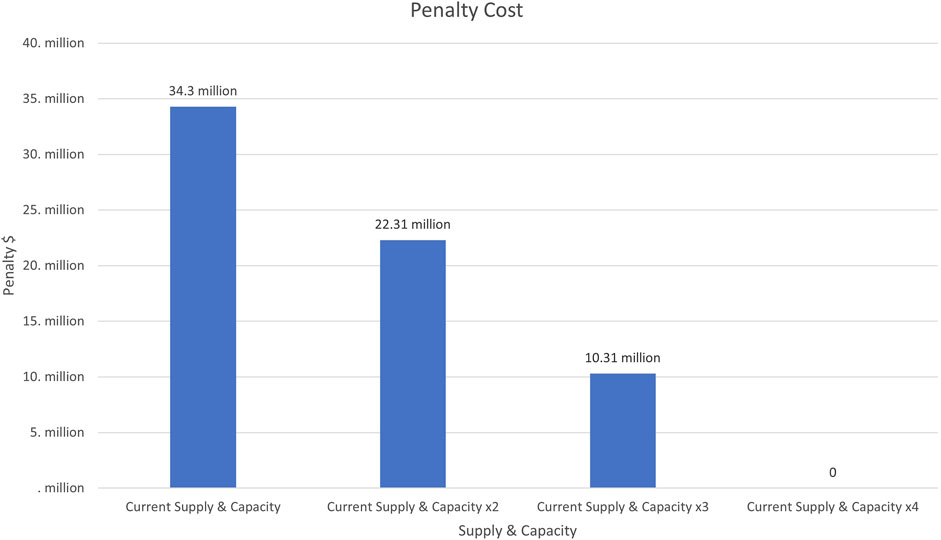
FIGURE 9. Penalty cost for four scenarios with prioritized distribution.
Similarly, the same trend is observed for transportation cost for prioritized distribution in Figure 10. In scenario 1 where supply and capacity is much lower than the actual demand, the transportation cost is lower because a high ratio of target population is not provided with vaccine, so less miles covered from vaccine hub to hospitals to target population addresses (last mile). As the vaccine supply and capacity increases in scenario 2–4, more people are provided with therapeutics and hence higher transportation cost.
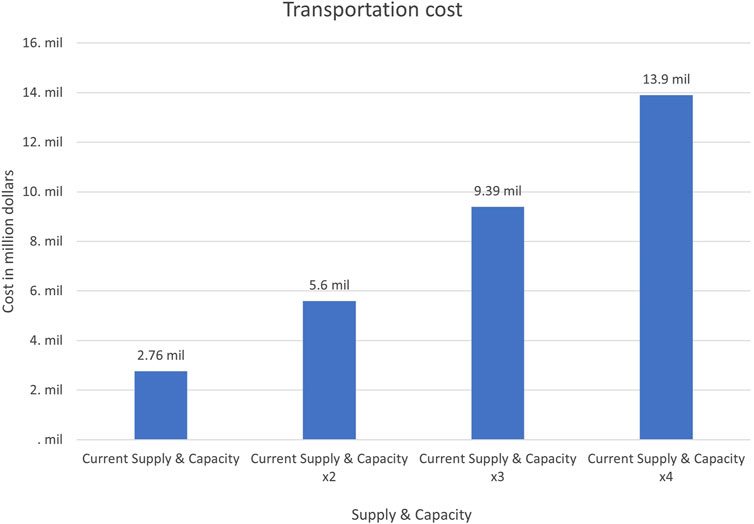
FIGURE 10. Transportation cost for four scenarios with prioritized distribution.
Similarly, in Figure 11, we can see that overall cost is reduced in case or prioritized distribution when the supply and capacity gets closer to the demand. The penalty cost is again more significant as compared to transportation cost as saving lives by ensuring timely vaccine delivery is primary objective.
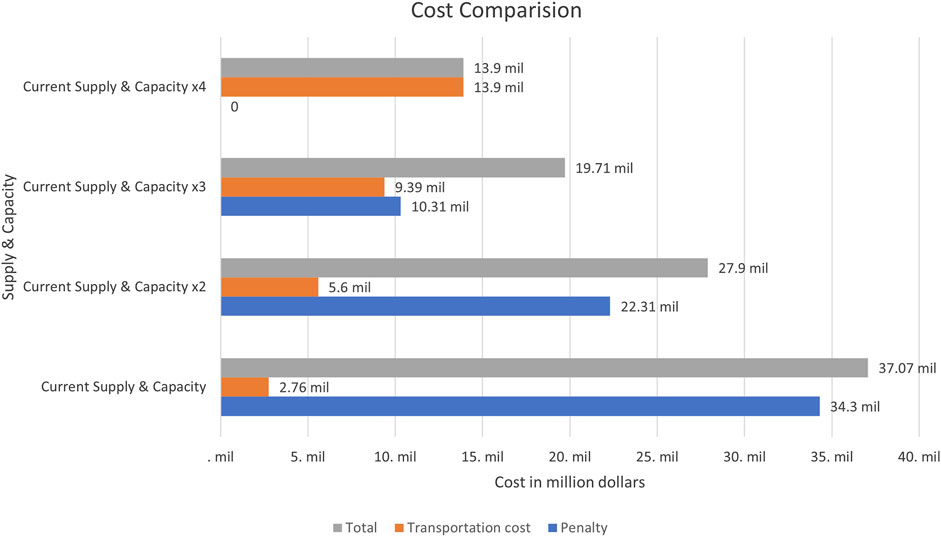
FIGURE 11. Cost comparison for four scenarios with prioritized distribution.
Now, when we look at service levels for all scenarios for prioritized distribution in Figure 12, we observe that service levels increase when we increase the therapeutics supply and providers’ capacity to match it with the demand.
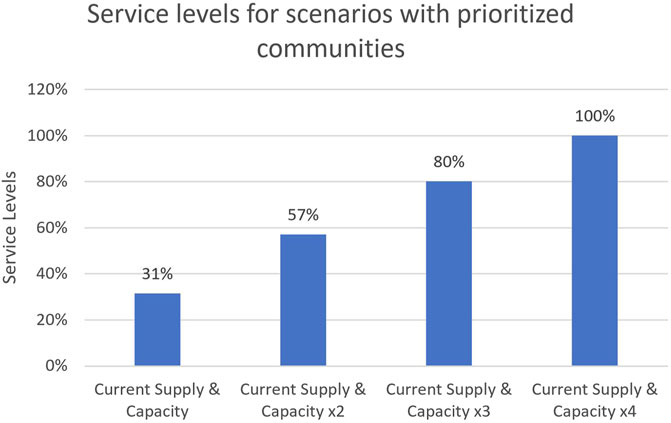
FIGURE 12. Service levels for four scenarios with prioritized distribution.
It is very important to understand the difference between the service level for equal distribution and service levels for prioritized distribution. In case of equal distribution, we have a collective service level for entire population as we do not have any priority levels for any communities, but in case of prioritized distribution, the underserved communities get higher priority as compared to other communities. This means that even when the demand is much higher than the supply of therapeutics, as in the case of scenario 1, the prioritized underserved communities will have a very high service rate, approximately close to 100%, even though the overall population will still have a low service level of 31%. This means that underserved communities will get vaccine based on priority even when there is a shortage of vaccine due to high difference between supply and demand. The last mile element of our model will also make sure that the lifesaving therapeutics are actually provided to these at-risk populations.
Conclusion
This paper is based on a National Science Foundation funded grant (NSF Award Abstract # 2028612) to work on investigating supply chain strategies that would minimize the impact on underserved populations during pandemic. The underserved population could be at risk during the times of crisis, unless there is strong involvement from government agencies such as local and state Health departments and federal Centre for Disease Control (CDC). These government agencies were designed to help all communities but historically supporting underserved populations, because they do not have health insurance. The COVID-19 pandemic was a crisis of different proportion, creating a different type of burden on government agencies. Vulnerable communities including the elderly populations and communities of color have been especially hard hit by this disease. The allocation and distribution of COVID-19 vaccines in a timely manner to these at-risk communities is important not only to end the pandemic but to do so equitably. This forced them to change their strategies and supply chains to support all populations receiving therapeutics. The National Science Foundation (NSF) funded RAID labs to help federal agencies with strategies.
The research focused on making sure that underserved populations are not left out, especially considering the health disparities that exist. This project aims to create a supply chain model that prioritizes geographic sections in the cities that house vulnerable communities. We collaborated with Houston Health and Human Services (HHS) to model supply chain for fourth largest city in US by using the concept of Community Health Index and COVID-19 Cases and geographical information to create a map that overlay COVID information by zip codes with vulnerable communities. The supply chain model then maximizes social good by sending drugs or vaccines to the communities that need it the most regardless of ability to pay. The outcome of this study helped us prioritize the communities that need the vaccines the most. This informs our supply chain model to shift resources to these areas showing the value in real time prioritization of the COVID-19 supply chain. This paper provides information can be used in our healthcare supply chain model to ensure timely delivery of therapeutics to underserved populations that are the most vulnerable and hence the overall impact of COVID-19 can be minimized.
The study identified the phenomena of last mile importance in achieving the objectives. The last mile transportation concept was critical in saving lives during the pandemic for underserved populations. Integrating the last mile concept along with an accessible healthcare index (CHI) allows for real-time strategies. The strategies were defined as mathematical models that could be used in real-time for these at-risk communities. Use of electric vehicles for last mile transportation will results in significant cost saving and also help in reducing the carbon emissions and fighting climate change.
For future work, this can lead to collaborating with programs, such as Uber eats, Meals on Wheels, partnering with nurses to administer vaccinations to these populations. Data collected from the last mile of direct contact with members of at-risk communities to vaccinate or refusal to vaccinate will provide information to help predict which communities are not vaccinated due to access and which are vaccine hesitant. The responses from questionnaires about attitudes toward COVID vaccination and drug development will help future predictions of which vaccine hesitant communities are most likely to be persuaded to take the vaccine, increasing the efficiency of last mile efforts.
Data Availability Statement
The raw data supporting the conclusion of this article will be made available by the authors, without undue reservation.
Author Contributions
EJ (1st Author) is the PI for this project who has worked on the supply chain modeling and last mile transportation for underserved communities. GA is the PhD student working on using MIP algorithm and community health index (CHI) scores. EJ (3rd Author) worked on the mapping of underserved communities. FJ and SA took a convergent approach to developing the health index that fed the AI engine for optimizing the last mile routing. MH described how immunizations in the URM communities which lead to a stochastic probability of taking the shot which was fed into the AI engine. JS was the liaison between City of Houston and researchers team and provided help with collecting important data for this project. FJ as the second corresponding author.
Funding
National Science Foundation—NSF Award Abstract # 2028612. This research was supported in part by funding from the National Science Foundation, Awards #1900572, 1939739 and 2028573 to FJ.
Conflict of Interest
The authors declare that the research was conducted in the absence of any commercial or financial relationships that could be construed as a potential conflict of interest.
Publisher’s Note
All claims expressed in this article are solely those of the authors and do not necessarily represent those of their affiliated organizations, or those of the publisher, the editors and the reviewers. Any product that may be evaluated in this article, or claim that may be made by its manufacturer, is not guaranteed or endorsed by the publisher.
Acknowledgments
We would like to acknowledge National Science Foundation for funding this project (NSF Award Abstract # 2028612). We would also like to acknowledge City of Houston Health and Human Services for providing data and collaborating with us in this project.
References
Abrahams, A. S., and Ragsdale, C. T. (2012). A Decision Support System for Patient Scheduling in Travel Vaccine Administration. Decis. Support Syst. 54, 215–225. doi:10.1016/j.dss.2012.05.007
Araz, O. M., Galvani, A., and Meyers, L. A. (2012). Geographic Prioritization of Distributing Pandemic Influenza Vaccines. Health Care Manag. Sci. 15, 175–187. doi:10.1007/s10729-012-9199-6
Arora, H., Raghu, T. S., and Vinze, A. (2010). Resource Allocation for Demand Surge Mitigation during Disaster Response. Decis. Support Syst. 50, 304–315. doi:10.1016/j.dss.2010.08.032
Biggerstaff, M., Reed, C., Swerdlow, D. L., Gambhir, M., Graitcer, S., Finelli, L., et al. (2015). Estimating the Potential Effects of a Vaccine Program against an Emerging Influenza Pandemic-United States. Clin. Infect. Dis. 60, S20–S29. doi:10.1093/cid/ciu1175
Brandeau, M. L., Zaric, G. S., and Richter, A. (2003). Resource Allocation for Control of Infectious Diseases in Multiple Independent Populations: beyond Cost-Effectiveness Analysis. J. Health Econ. 22, 575–598. doi:10.1016/s0167-6296(03)00043-2
Brown, S. T., Schreiber, B., Cakouros, B. E., Wateska, A. R., Dicko, H. M., Connor, D. L., et al. (2014). The Benefits of Redesigning Benin's Vaccine Supply Chain. Vaccine 32, 4097–4103. doi:10.1016/j.vaccine.2014.04.090
Buccieri, K., and Gaetz, S. (2013). Ethical Vaccine Distribution Planning for Pandemic Influenza: Prioritizing Homeless and Hard-To-Reach Populations. Public Health Ethics 6, 185–196. doi:10.1093/phe/pht005
Calina, D., Docea, A., Petrakis, D., Egorov, A., Ishmukhametov, A., Gabibov, A., et al. (2020). Towards Effective COVID-19 V-accines: Updates, P-erspectives and C-hallenges (Review). Int. J. Mol. Med. 46, 3–16. doi:10.3892/ijmm.2020.4596
Callaghan, T., Moghtaderi, A., Lueck, J. A., Hotez, P. J., Strych, U., Dor, A., et al. (2020). Correlates and Disparities of COVID-19 Vaccine Hesitancy. SSRN J. 272, 113638. doi:10.2139/ssrn.3667971
CDC (2021). Health Disparities. Available at: https://www.cdc.gov/nchs/nvss/vsrr/covid19/health_disparities.htm.
CDC (2020). What We Can Do to Move towards Health Equity. Available at: https://www.cdc.gov/coronavirus/2019-ncov/community/health-equity/racial-ethnic-disparities/what-we-do.html.
Chan, C. C., and Wong, Y. S. (2004). Electric Vehicles Charge Forward. IEEE Power Energ. Mag. 2 (6), 24–33. doi:10.1109/mpae.2004.1359010
Chen, X., Li, M., Simchi-Levi, D., and Zhao, T. (2020). Allocation of Covid-19 Vaccines under Limited Supply.
Davila-Payan, C., Swann, J., and Wortley, P. M. (2014). System Factors to Explain 2009 Pandemic H1n1 State Vaccination Rates for Children and High-Risk Adults in Us Emergency Response to Pandemic. Vaccine 32, 246–251. doi:10.1016/j.vaccine.2013.11.018
Dorn, A. v., Cooney, R. E., and Sabin, M. L. (2020). COVID-19 Exacerbating Inequalities in the US. The Lancet 395 (10232), 1243–1244. Published online 2020 Apr 16. doi:10.1016/S0140-6736(20)30893-X
Govindan, K., Mina, H., and Alavi, B. (2020). A Decision Support System for Demand Management in Healthcare Supply Chains Considering the Epidemic Outbreaks: A Case Study of Coronavirus Disease 2019 (Covid-19). Transportation Res. E: Logistics Transportation Rev. 138, 101967. doi:10.1016/j.tre.2020.101967
Health Disparities (2019). Provisional Death Counts for Coronavirus Disease 2019 (COVID-19). Available at: https://www.cdc.gov/nchs/nvss/vsrr/covid19/health_disparities.htm.
Holmes, L., Enwere, M., Williams, J., Ogundele, B., Chavan, P., Piccoli, T., et al. (2020). Black-White Risk Differentials in COVID-19 (SARS-COV2) Transmission, Mortality and Case Fatality in the United States: Translational Epidemiologic Perspective and Challenges. Ijerph 17 (2), 4322. doi:10.3390/ijerph17124322
Huang, H.-C., Singh, B., Morton, D. P., Johnson, G. P., Clements, B., and Meyers, L. A. (2017). Equalizing Access to Pandemic Influenza Vaccines through Optimal Allocation to Public Health Distribution Points. PloS one 12, e0182720. doi:10.1371/journal.pone.0182720
Idaho National Laboratory (2010). Advanced Vehicle Testing Activity INL/MIS-11-22490. Available at: https://avt.inl.gov/sites/default/files/pdf/fsev/costs.pdf.
Immunizations and African Americans (2018). U.S. Department of Health and Human Services Office of Minority Health. Available at: https://minorityhealth.hhs.gov/omh/browse.aspx?lvl=4&lvlid=22 (Accessed July 13, 2020).
Johns Hopkins (2021). COVID-19 Map - Johns Hopkins Coronavirus Resource Center. Available at: https://coronavirus.jhu.edu/map.html.
Jones, E., Azeem, G., Jones, E. C., and Jefferson, F. (2020). Impacting at Risk Communities Using AI to Optimize the COVID-19 Pandemic Therapeutics Supply Chain. Isctj 06 (No. 9). doi:10.20545/isctj.v06.i09.02
Kim, S. J., and Bostwick, W. (2020). Social Vulnerability and Racial Inequality in COVID-19 Deaths in Chicago. Health Educ. Behav. 47 (4), 509–513. doi:10.1177/1090198120929677
Klassen, K. J., and Rohleder, T. R. (2001). Combining Operations and Marketing to Manage Capacity and Demand in Services. Serv. Industries J. 21, 1–30. doi:10.1080/714005019
Lee, B. Y., Assi, T.-M., Rookkapan, K., Wateska, A. R., Rajgopal, J., Sornsrivichai, V., et al. (2011). Maintaining Vaccine Delivery Following the Introduction of the Rotavirus and Pneumococcal Vaccines in thailand. PloS one 6, e24673. doi:10.1371/journal.pone.0024673
Lee, S., Golinski, M., and Chowell, G. (2012). Modeling Optimal Age-specific Vaccination Strategies against Pandemic Influenza. Bull. Math. Biol. 74, 958–980. doi:10.1007/s11538-011-9704-y
Lin, Q., Zhao, Q., and Lev, B. (2020). Cold Chain Transportation Decision in the Vaccine Supply Chain. Eur. J. Oper. Res. 283, 182–195. doi:10.1016/j.ejor.2019.11.005
Mahajan, U. V., and Larkins-Pettigrew, M. (2020). Racial Demographics and COVID-19 Confirmed Cases and Deaths: a Correlational Analysis of 2886 US Counties. J. Public Health 42 (3), 445–447. doi:10.1093/pubmed/fdaa07031
Medlock, J., and Galvani, A. P. (2009). Optimizing Influenza Vaccine Distribution. Science 325, 1705–1708. doi:10.1126/science.1175570
Millett, G. A., Jones, A. T., Benkeser, D., Baral, S., Mercer, L., Beyrer, C., et al. (2020). Assessing Differential Impacts of COVID-19 on Black Communities. Ann. Epidemiol. 47, 37–44. doi:10.1016/j.annepidem.2020.05.003
National Governors Association Center for Best Practices (2020). Preparing for the COVID-19 Vaccine and Considerations for Mass Distribution. Available at: https://www.nga.org/wp-content/uploads/2020/08/NGA-Memorandum-on-COVID-19-Vaccine-and-Mass-Distribution-Considerations.pdf.
Office of Behavioral Health Equity (2020). The Substance Abuse and Mental Health Services Administration (SAMHSA). Available at: https://www.samhsa.gov/sites/default/files/covid19-behavioral-health-disparities-black-latino-communities.pdf.
Shittu, E., Harnly, M., Whitaker, S., and Miller, R. (2016). Reorganizing Nigeria's Vaccine Supply Chain Reduces Need for Additional Storage Facilities, but More Storage Is Required. Health Aff. 35, 293–300. doi:10.1377/hlthaff.2015.1328
Sudan, T., and Taggar, R. (2021). Recovering Supply Chain Disruptions in Post-COVID-19 Pandemic through Transport Intelligence and Logistics Systems: India's Experiences and Policy Options. Front. Future Transp. 2. doi:10.3389/ffutr.2021.660116
Uscher-Pines, L., Omer, S. B., Barnett, D. J., Burke, T. A., and Balicer, R. D. (2006). Priority Setting for Pandemic Influenza: an Analysis of National Preparedness Plans. Plos Med. 3, e436. doi:10.1371/journal.pmed.0030436
U.S. Department of Health and Human Services (2005). HHS Pandemic Influenza Plan. Available at: https://www.cdc.gov/flu/pdf/professionals/hhspandemicinfluenzaplan.pdf?fbclid=IwAR0KGbTVDQj2SovXHddSNa3k8kRj5_3IJD988kqDfQF5Rvxu1sFDTITtmPE.
World Health Organization (2020). Immunization, Vaccines and Biologicals. Available at: https://www.who.int/immunization/programmes_systems/supply_chain/en/.
Keywords: supply chain modeling, COVID19, underserved communities, last mile transportation, community mapping
Citation: Jones EC, Azeem G, Jones EC, Jefferson F, Henry M, Abolmaali S and Sparks J (2021) Understanding the Last Mile Transportation Concept Impacting Underserved Global Communities to Save Lives During COVID-19 Pandemic. Front. Future Transp. 2:732331. doi: 10.3389/ffutr.2021.732331
Received: 28 June 2021; Accepted: 25 August 2021;
Published: 23 September 2021.
Edited by:
Emmanouil Rigas, University of Cyprus, CyprusReviewed by:
Tamás Tettamanti, Budapest University of Technology and Economics, HungaryMaria Papoutsoglou, Aristotle University of Thessaloniki, Greece
Copyright © 2021 Jones, Azeem, Jones, Jefferson, Henry, Abolmaali and Sparks. This is an open-access article distributed under the terms of the Creative Commons Attribution License (CC BY). The use, distribution or reproduction in other forums is permitted, provided the original author(s) and the copyright owner(s) are credited and that the original publication in this journal is cited, in accordance with accepted academic practice. No use, distribution or reproduction is permitted which does not comply with these terms.
*Correspondence: Erick C. Jones, ZWNqb25lc0B1dGEuZWR1; Felicia Jefferson, amVmZmVyc29uZkBmdnN1LmVkdQ==