 Kristi Saporito
 Rachel Rothenstein-Henry
 Elizaveta Zeynalova*
 Nalin Singh Negi
 Sandra Mullin
 Irina Morozova
 Nandita Murukutla
- Policy Advocacy and Communication Division, Vital Strategies, New York, NY, United States
Introduction: In Colombia, road traffic crashes are the eighth leading cause of death. In 2017, as part of the Bloomberg Philanthropies Initiative for Global Road Safety (BIGRS), Vital Strategies supported government-led journalist trainings in Colombia to shift media discourse of road safety as a public health and development issue with known risk factors and achievable solutions, to ultimately catalyze public and policymaker concern and action. This study evaluates the effects these trainings had on road safety reporting.
Methods: Articles about BIGRS road safety work published between 1 May 2017 and Aug. 30, 2021 were collected from a database maintained by communication officers. The sample included 870 articles, which were systematically analyzed for year-wise frequency by independent coders. Inter-reliability (Cohen’s Kapp K > 0.94) was established using a codebook developed to identify examples of best practices shared during trainings.
Results: From 2017 to 2021, there was a 27% increase in articles that situated road traffic collisions (RTCs) as due to systemic issues (thematic framing) rather than isolated events (episodic framing). Almost all observed articles used at least one WHO-recommended story angle (96%) and key element (95%). Reporting angles focused on the human story were largely underutilized (2%–5%). Government representatives (81%), mostly from the Secretary of Mobility (67%), were the most cited sources and road safety advocates were the least (3%). Use of terms “crash” and “collision” increased across the study period (crash: 47% in 2017 to 59% in 2021; collision: 0.4% in 2019 to 5% in 2020). However, RTCs continued to be widely called “accidents” (46%). More than half of articles referenced either “victims” or “vulnerable road users” (55%); use of “person” to refer to victims/vulnerable road users increased from 33% in 2017 to 56% in 2020.
Conclusion: Over the course of the BIGRS journalist training program, reporting in Colombia increasingly used best practices to frame road safety as a public health issue. This highlights how media engagement is important to comprehensive road safety strategies and should be more widely adopted. Future training efforts should focus on finding the human story, and on changing overreliance on terms like “accident” that make RTCs seem inevitable.
1 Introduction
In Colombia, road traffic crashes are the eighth leading cause of death for people of all ages (Ministerio de Salud y Protección Social y Agencia Nacional de Seguridad Vial, 2020). In 2016, the year preceding this study, there were nearly 9,000 fatalities on the country’s roads (World Health Organization, 2016). This represented double the estimated fatalities per 100,000 people than in the countries with the lowest traffic fatalities in the region (World Bank Group Global Road Safety Facility, 2023). Colombia has taken important steps toward safer roads via the National Road Safety Agency, which has implemented measures beginning in 2016 to improve local infrastructure and safety equipment and to change road safety behaviors and social norms (International Transport Forum, 2021). However, Colombia was not on track to accomplish the United Nation’s goal of halving road traffic fatalities by 2020, and there was a need to elevate road safety as an issue worthy of concern and action (Sharpin et al., 2018).
This is not unique to Colombia: Despite being the leading cause of death for children and young adults ages 5–29 globally (World Health Organization, 2022), road safety has not yet garnered the financial resources and political will needed to meet the updated U.N. goal of halving road traffic deaths by 2030 (Connor and Wesolowski, 2004; Political Declaration of the Road Safety, 2022). A comprehensive communication strategy that includes media engagement, plays a vital role in garnering support for improved interventions, policies, behaviors and social norms related to road safety (World Health OrganizationUnited Nations Regional Commissions, 2021).
The media plays a central role in determining which issues receive attention (agenda-setting) and in shaping perceptions (framing theory), in turn affecting public and policy priorities (McCombs and Shaw, 1972; Magusin, 2017). Specifically, research has demonstrated that a lower crash reporting rate is associated with fewer policy changes and that better editorial patterns can increase support for road safety infrastructure improvements (Mattingly et al., 2018; Goddard et al., 2019). Therefore, how road safety is covered in news media influences whether it is seen as an issue worthy of action (Goddard et al., 2019).
Regrettably, road safety topics tend not to be sufficiently reported in the media, as the media most often focuses on events that are considered “rare” or “surprising” (Daniels et al., 2010; Goddard et al., 2019). When road traffic crashes1 are reported on, it is often through an “episodic” frame that treats them as dramatic events, often attributed to human error and isolated from the broader public health context, rather than “thematic” framing that connects them to a larger systematic public health issue with proven risk factors and solutions (Connor and Wesolowski, 2004; Goddard et al., 2019; te Brömmelstroet, 2020; Boufous et al., 2016; Gupta et al., 2021; Zipper, 2021; Keliikoa et al., 2022). This reporting style also tends to use a “victim/villain” storyline to shift blame between agents of crashes, such as drivers, and vulnerable road users, such as pedestrians (Connor and Wesolowski, 2004; MacRitchie and Seedat, 2008; Keliikoa et al., 2022). This may include, for example, suggesting that a pedestrian victim could have avoided injury or death had they acted differently (Goddard et al., 2019). While it is important to identify agents of crashes, focusing exclusively on individual behavior distracts from the need for proven policy-level and system-wide solutions, such as those that reduce vehicle speed, a leading risk factor (Goddard et al., 2019; Zipper, 2021; World Health Organization, 2022). In addition, referring to road traffic crashes as “accidents,” which implies that they are inevitable and blameless, is widespread in road safety coverage (Davis and Pless, 2001; Stromberg, 2015; Ralph et al., 2019; Gupta et al., 2021). Language is a powerful tool that shapes our reality and social practices; even slight differences in how road traffic crashes are described has been found to influence perceptions (Loftus and Palmer, 1974; Goddard et al., 2019).
Research has underscored the need for enhanced collaboration between road safety stakeholders and media professionals to improve coverage of road safety topics. This can be achieved through initiatives such as joint workshops and trainings (Connor and Wesolowski, 2004; Rosales and Stallones, 2008; Isaac Kofi et al., 2010; Kenez et al., 2015; Boufous et al., 2016). Journalist trainings on health topics such as suicide and violence against women have been found to increase journalist knowledge and confidence in writing about the topics, facilitating reporting that is better aligned with best practices (Scherr et al., 2019; Easteal et al., 2022).
In 2015, WHO collaborated with editors and reporters to develop a guide identifying recommended story angles and key elements to accurately and effectively cover road safety as a public health issue (World Health Organization and Pulitzer Center, 2015) (Table 1). Based on this guide, Vital Strategies, a global public health organization and implementing partner of the Bloomberg Philanthropies Initiative for Global Road Safety (BIGRS), developed an adapted version to suit the practical contexts of BIGRS participating locations and that aligned with BIGRS objectives (Vital Strategies, 2020) (Table 2). These recommendations form the basis of BIGRS’ road safety journalist trainings, which as of 2023, have been held in 12 countries with Vital Strategies’ support.
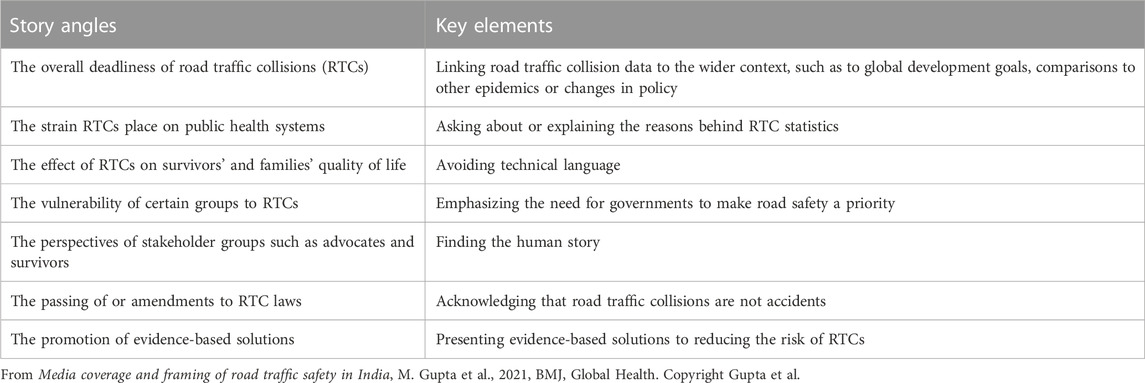
TABLE 1. WHO recommended story angles and key elements.
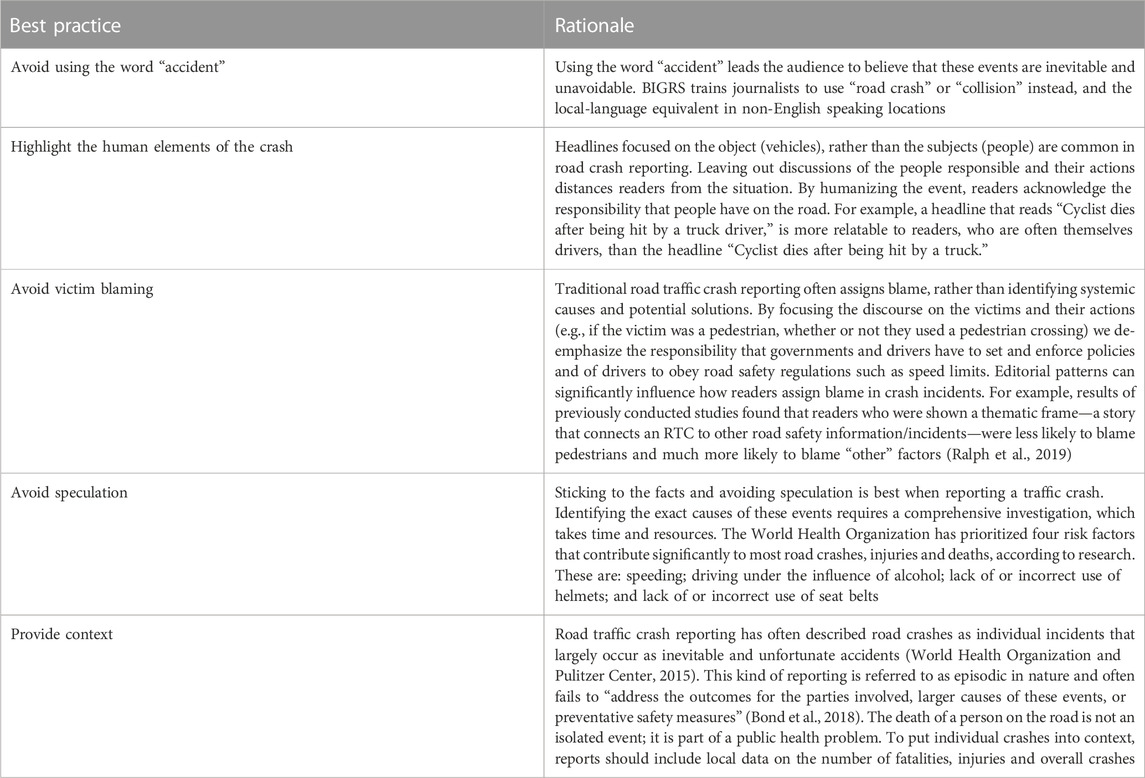
TABLE 2. Vital Strategies’ adaptation of recommendations and best practices.
BIGRS has provided financial support for journalist workshops in Colombia since 2017. The Global Health Advocacy Incubator implemented the first, to introduce participants to road safety broadly; subsequent workshops were implemented by Vital Strategies to support government-led road safety interventions. Eight trainings at least half a day in length were conducted during this study period (one in 2017 and 2021 and two each year from 2018–2020), with an estimated 150 journalists trained. Each workshop was government-led and included an overview of risk factors as identified by WHO (e.g., speeding); global and local road traffic crash death and injury data to contextualize the issues; a discussion of solutions (e.g., speed limits, helmet use); an emphasis on the use of language such as using “crash” instead of “accident”; and the participation of government as a resource for journalists. These trainings were held in-person in Bogota from 2017 to 2019 and shifted to an online format in 2020 due to the COVID-19 pandemic. This allowed a wider range of participants to participate (Vital Strategies, 2021). Participants were recommended by government officials and identified as journalists covering topics related to road safety, including public health and transportation.
This study aims to evaluate changes in the quality of news reporting over time, identifying both improvements and areas for further development in BIGRS trainings. We do so by systematically analyzing the content of media stories from 1 May 2017 and Aug. 30, 2021 to examine whether changes in the story angles and key elements aligned with the nature of the trainings. We replicate the methodologies implemented by Gupta et al. (Gupta et al., 2021). There is growing literature that identifies the challenges with media reporting on road safety (Magusin, 2017; Ralph et al., 2019), but this paper is one of the first to evaluate the effects of road safety journalist trainings on the quality of reporting. Our findings can support training implementors in improving the curriculum and scaling up trainings to additional governments.
2 Materials and methods
We conducted a systematic content analysis of news stories published between 1 May 2017 and Aug. 30, 2021 pertaining to BIGRS road safety work in Colombia. This time frame was chosen to encompass the start of media engagement by the BIGRS Colombia-based communication officer within the initiative. The analysis included articles in English and Spanish. The coding and analysis described in this paper were conducted between Jan. 1 and 15 July 2022.
2.1 Data collection
Articles in the study were drawn from a database created by the communication officer. The articles collected were from national, regional and local media sources, including newspapers (print and online), magazines, social media, blogs, television and online radio platforms. Articles were identified using search strings of keywords (e.g., “road safety,” “car crash,” “incident,” “accident,” “cyclists,” “driver,” “BIGRS,” “Vital Strategies,” etc.). Only articles that mentioned BIGRS and its partners, including Vital Strategies, WHO or Johns Hopkins University, or that covered work related to the initiative, such as speed limits and drink-driving enforcement or policies, were included in the analysis. Any duplicate articles were excluded. Of the total sample of 1,365 published articles in the BIGRS database, a subset of 870 articles was randomly selected for content analysis. This sample size was determined to achieve a margin of error of 2%. To ensure random selection, every second article, when possible, was selected.
2.2 Data coding
A codebook was developed to analyze the presence of best practices that had been described to journalists during BIGRS trainings. The codebook contained approximately 22 variables in five different categories related to patterns of road traffic crash and road safety reporting, summarized below. For a more detailed description, refer to Tables 1, 2.
1) Article characteristics: title, date of publication, type of publication, name of newspaper/magazine in which it was published, platform hosting the publication, type of article, type of visuals found in the publication, and the emotional tone of visuals.
2) Description of the incident: specific words used to describe the incident, such as: crash, speeding, reckless driving, accident, etc.
3) Mention of human elements of the crash: how the victims or vulnerable road users (defined as those who are unprotected by an outside shield, such as pedestrians and cyclists) were referred to.
4) Assignment of blame: agents (perpetrators), causal factors, solutions, framing of the article (thematic vs. episodic).
5) Evidence-based practices: sources included in the articles; which of any of the WHO-best practice story angles and key elements were included.
2.3 Data analysis
The complete set of 870 articles was examined for year-wise frequency. Coding was conducted by four coders (1 supervisor and 3 coders). To ensure the reliability of the results, inter-rater reliability (IRR) was calculated and found to be high (total IRR score of 0.94).
The coders’ observations were entered into SPSS (IBM Corp. Released 2013. IBM SPSS Statistics for iOS, Version 22.0. Armonk, NY: IBM Corp.). Univariate and bivariate analysis were conducted for all variables from 2017 to 2021. Univariate analyses of the data included standard descriptive statistics (frequencies) and bivariate analysis included comparisons of all the variables by time with significance testing (column proportion test).
3 Results
3.1 Frequency and characteristics of articles studied
The sample of 870 articles was obtained from 163 distinct publishing platforms. Most articles were published in 2020 (27%), with the fewest published in 2021 (8%) (Table 3). The majority of articles were published by national media organizations (52%), followed by regional (20%) and local media (16%). Most media articles were published in print and virtual newspapers (41%), followed by online TV and radio platforms (33%); blogs (14%); social networks (8%); and other sources (4%).

TABLE 3. Percentage distribution of articles by media type.
Road safety-related articles by national media decreased from 62% in 2017 to 39% in 2020 and increased in local media from 14% in 2017 to 25% in 2020 (Table 3). Publications in online TV and radio platforms declined from 38% in 2017 to 13% in 2021, whereas publications in social networks increased from 0.9% in 2017 to 11% in 2020 and in blogs from 18% in 2017 to 27% in 2021.
The outlet that featured the most road safety articles was El Tiempo (17%), which is one of the most popular outlets in Colombia. This was followed by: El Espectador (8%); Dinero (6%); Canal Capital (6%); and Caracol Radio (5%). All of these outlets are national.
3.2 WHO story angles and key elements
This study evaluated whether the WHO-recommended story angles and key elements for effective road safety coverage that were integrated into the curriculum of BIGRS trainings were included in articles spanning from when trainings began in 2017–2021 (Table 4).
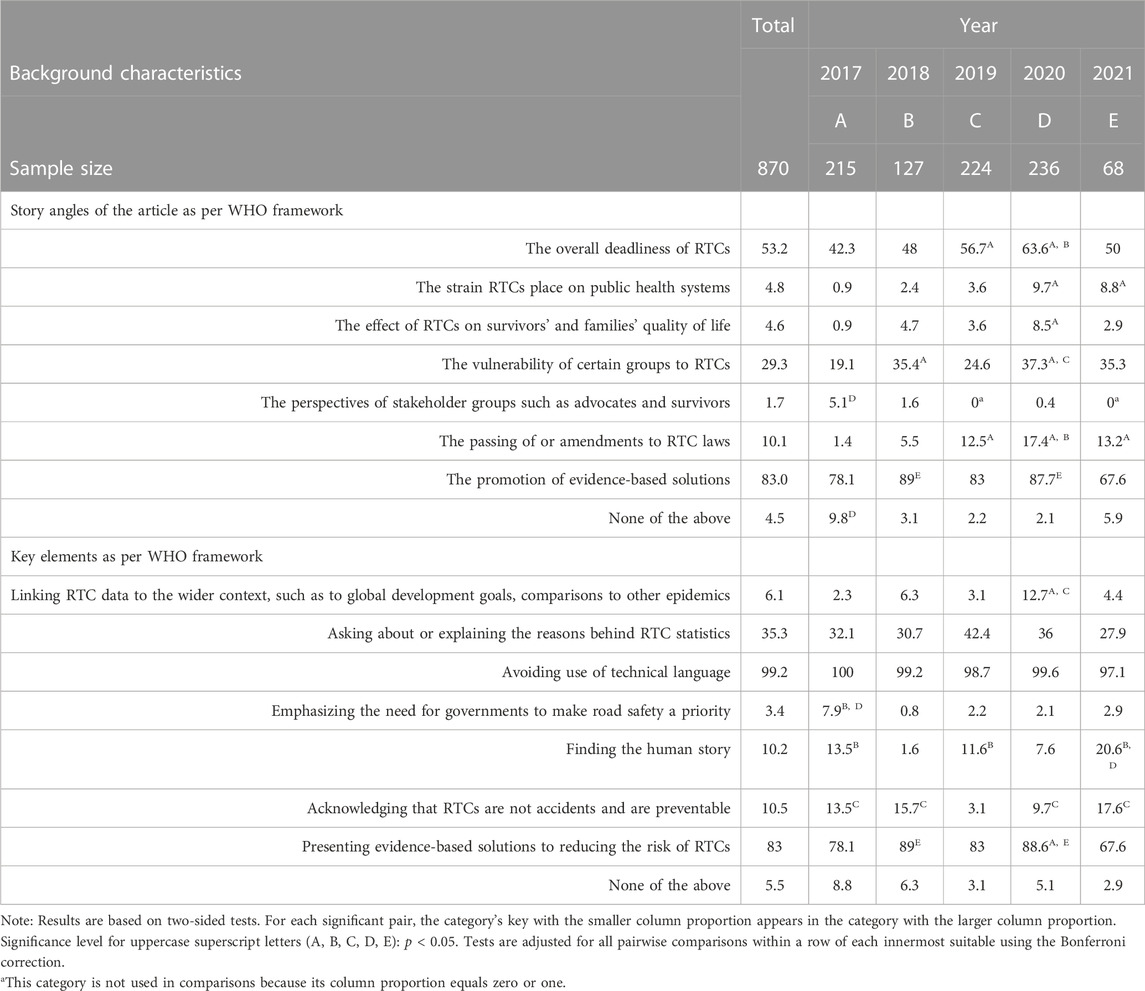
TABLE 4. Percentage distribution of articles by presence of WHO-recommended story angles and key elements.
Overall, the most-used story angles were the “promotion of evidence-based solutions,” which involved presenting evidence-based strategies to reducing the risk of RTCs, and the “overall deadliness of road traffic crashes,” which connected road traffic collision data to the wider context, such as to global development goals. These angles were incorporated in 83% and 53% of the reviewed articles, respectively.
Many recommended story angles were increasingly used over the course of the period studied: use of the angle “the overall deadliness of road traffic collisions” increased from 42% in 2017 to 64% in 2020. The use of the angle the “strain RTCs place on public health systems” and the angle “effect on survivors’ and families’ quality of life,” which focused on the financial and health burdens associated with injuries from RTCs, increased from 1% to 9% from 2017 to 2021 and 2020, respectively; use of the storyline “the vulnerability of certain groups to RTCs,” which addressed actions that can be taken to reduce vulnerability of certain groups to RTCs, increased from 19% in 2017 to a peak of 37% in 2020; and storylines using the angle “the passing of or amendments to RTC laws” increased from 1% in 2017 to 13% in 2021, with a peak of 17% in 2020.
Some recommended storylines were used less over the period studied: Stories that used the angle “The perspectives of stakeholder groups such as advocates and survivors” featuring human stories declined from 5% in 2017 to 0.4% in 2020. Storylines using “the promotion of evidence-based solutions” declined from 89% in 2018 to 68% in 2021; however, for most years they hovered between 83% and 89%.
Overall, the most-used key elements were “avoiding the use of technical language” and “presenting evidence-based solutions to reducing the risk of RTCs,” which were incorporated into 99% and 83% of the reviewed articles, respectively.
The presence of the element “linking RTC data to the wider context…” increased from 2% in 2017 to 13% in 2020. On the other hand, stories that encompassed the element “emphasizing the need for governments to make road safety a priority,” declined from 8% in 2017 to 2% in 2020.
We also observed some fluctuations in the use of certain key elements over the course of the trainings: Stories that included the element “finding the human story” decreased from 14% in 2017 to a low of 2% in 2018, but then increased to a high of 21% in 2021; stories with the element “acknowledging that RTCs are not accidents and are preventable” declined from 14% in 2017 to 3% in 2019 and then increased to a peak of 18% in 2021; and stories that included the element “presenting evidence-based solutions to reducing the risk of RTCs” increased from 78% in 2017 to 89% in 2020, however, they declined to a low of 68% in 2021.
3.3 Providing context to road safety reporting
Overall, most of the reviewed articles were framed thematically and provided a deeper context of RTCs and their risk factors and solutions (69%). The proportion of thematically framed articles increased from 61% in 2017 to 88% in 2021. Articles using episodic news frames, which treated road safety issues as isolated events, declined from 39% to 12% during that same period (Table 5).
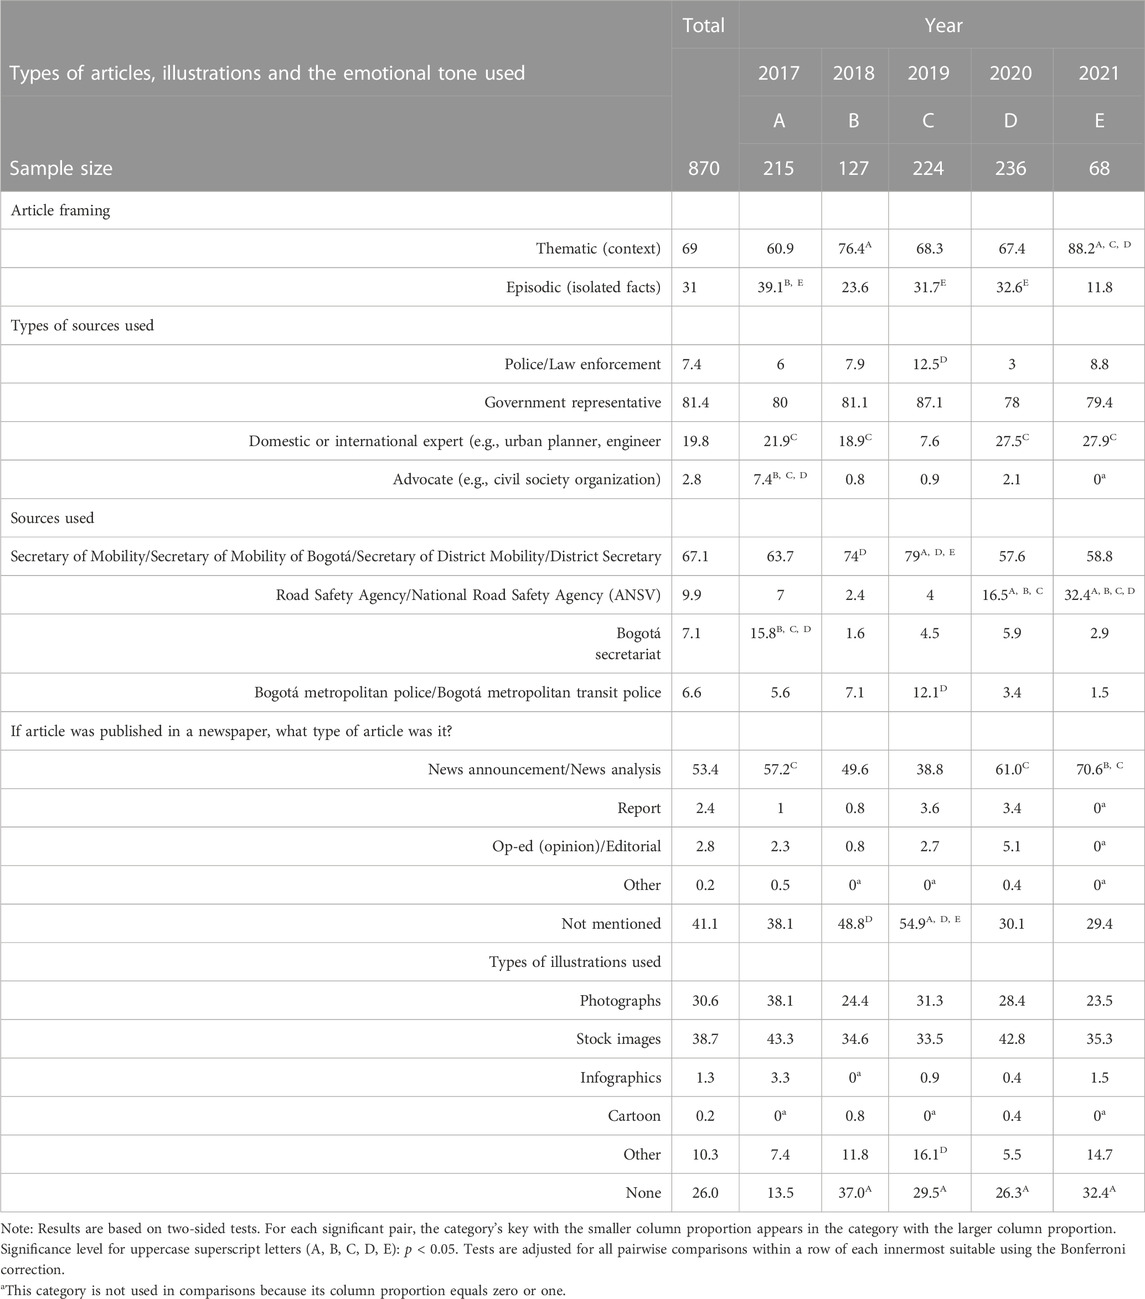
TABLE 5. Percentage distribution of road safety articles by context and reporting style.
Government representatives were the most-cited sources of information (81%), followed by domestic or international experts, such as engineers and urban planners (20%) and police/law enforcement agents (7%). Among the most popular government sources quoted was the Secretary of Mobility (67%), followed by road safety agencies (10%).
There was a decline in articles quoting police/law enforcement from a peak of 13% in 2019 to a low of 3% in 2020. Articles quoting domestic or international experts declined from 22% in 2017 to 8% in 2019 and then increased again to a peak of 28% in 2021. There was a decline in articles quoting advocates (e.g., civil society organizations) from 7% in 2017 to 2% in 2020.
The study also revealed differences in reporting styles. Most road safety-related media pieces were published as news analyses (53%), some as an opinion/editorial (3%), and a few as reports (2%). Many publishers included stock images (39%) or photographs (31%) in their stories. However, there was an increase in articles that did not use images from 14% in 2017 to 32% in 2021.
3.4 Terms used to describe road traffic crashes
For all years combined the most used words to describe road traffic crashes were “crash” (52%) and “accident” (46%). Journalists often used “death/fatality” (47%) to describe the aftermath of a crash (Table 6).
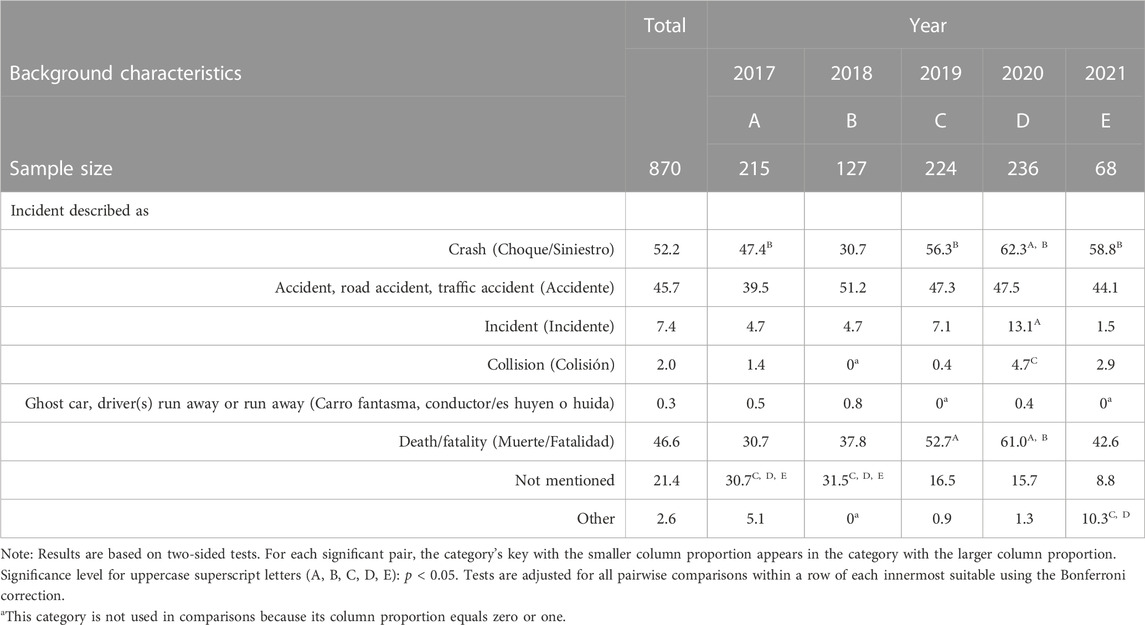
TABLE 6. Percentage distribution of terms used to describe road traffic crashes throughout the years.
The frequency of the use of the word “crash” increased from 47% in 2017 to 59% in 2021. Similarly, the frequency of the term “death/fatality” doubled from 31% in 2017 to 61% in 2020. The word “collision” was used infrequently, although we observed a significant increase in the application of this term from 0.4% in 2019 to 5% in 2020. The use of the term “accident” was relatively consistent from 40% in 2017 to 44% in 2021 (Table 6).
3.5 References to human elements of RTCs, factors that contribute to crashes, and solutions
3.5.1 References to human elements of crashes
Of all the articles reviewed, 32% mentioned victims, and 23% mentioned vulnerable road users, however, 45% did not mention either (Table 7). Reference to victims increased from 25% in 2017 to 44% in 2020 but declined to 22% in 2021. Reference to vulnerable road users increased from 19% in 2017 to a peak of 40% in 2021. Often, the terms “victims” or “vulnerable road users” referred to “pedestrians” (52%), “motorcyclists” (51%), “bicyclists” (49%), or simply a “person” (41%) (see Table 7). The use of the word “person” without any reference to the mode of transportation increased from 33% in 2017 to a peak of 56% in 2020, with a low of 28% in 2019 (Table 7).
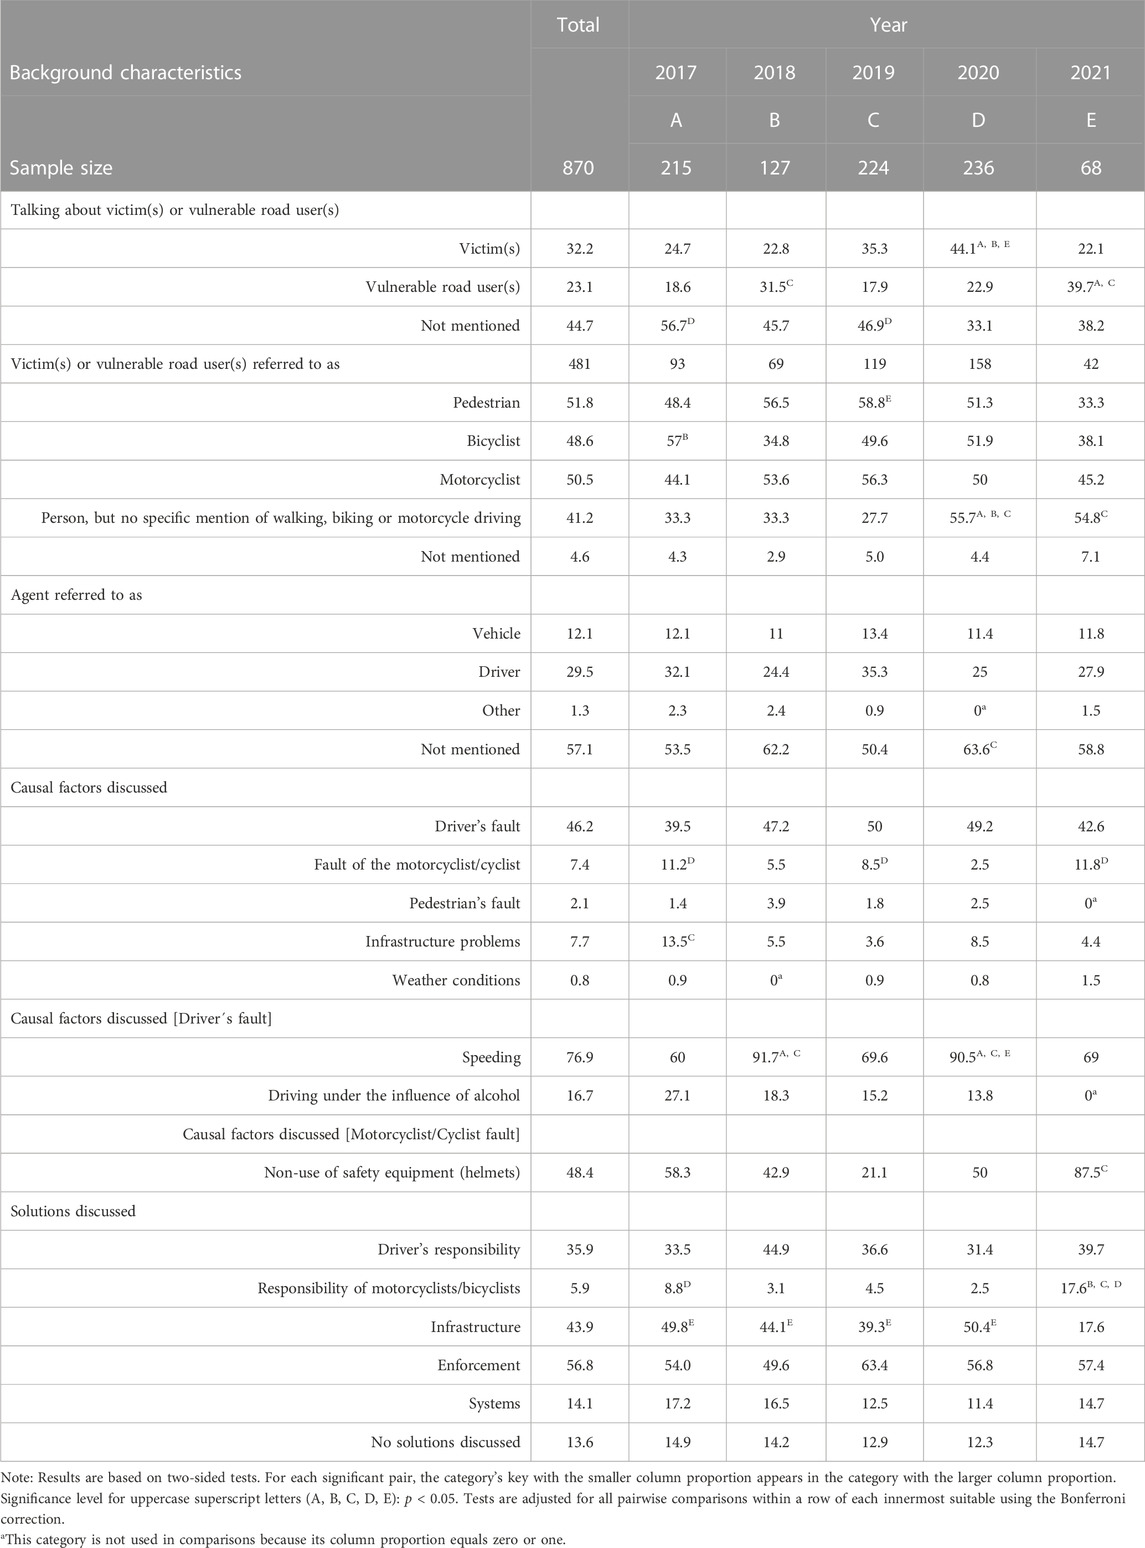
TABLE 7. Percentage distribution of articles describing human elements, factors and solutions of road crashes.
Most of the time the agent of a crash was not mentioned (57%); however, nearly one-third of the time, the agent was described as a “driver” (30%) (Table 6). Articles that did not mention the agent of the crash increased from a low of 50% in 2019 to a peak of 64% in 2020.
The authors mostly placed blame on drivers (46%) for causing road traffic crashes by either speeding (77%) or driving under the influence of alcohol (17%). Articles that placed blame on drivers for speeding increased from 60% in 2017 to a peak of 92% in 2018. Among other reasons for RTCs, some articles placed blame on poor infrastructure (8%), others on motorcyclists or cyclists (7%), and a few mentioned pedestrians (2%); however, there were no articles placing blame on pedestrians in 2021. Articles that referred to motorcyclists/cyclists as causal factors of road traffic crashes significantly declined from 11% in 2017 to 3% in 2020, but then increased again to a peak of 12% in 2021. Among the articles that placed blame on motorcyclists/cyclists (8%), nearly half suggested that failure to use safety equipment, such as helmets, was a major cause of road traffic injuries and deaths (48%); this increased from a low of 21% in 2020 to a high of 88% in 2021. Articles that referenced infrastructure problems as causal factors for road traffic crashes declined from a high of 14% in 2017 to a low of 4% in 2019.
3.5.2 Commonly mentioned solutions
Many reviewed articles presented potential actions that various actors could take to combat road traffic crashes. Most of them revolved around enforcement (57%), infrastructure (44%), and reducing drivers’ risky behaviors (36%) (Table 7). There was an increase in articles that focused on solutions motorcyclists/bicyclists could implement, from a low of 3% in 2018 and 2020 to a high of 18% in 2021, and a decline in those that focused on infrastructure solutions, from 50% in 2017 to a low of 18% in 2021.
4 Discussion
Our content analysis of road safety articles published between 2017 and 2021 in Colombia demonstrated that over time, road safety reporting increasingly aligned with WHO and Vital Strategies’ best practices, which aim to shift media discourse of road safety as a public health and development issue with known risk factors and achievable solutions.
Changes in the road safety coverage analyzed in our study largely aligned with what was covered in the journalist trainings conducted. A study conducted by researchers in Nepal also found that road safety journalist trainings improved adherence to WHO best practices and increased media space allocated to road safety topics (Puspa Raj et al., 2021).
Over the course of our study, there was a significant increase in media articles that used thematic framing that provided context into road crashes and efforts to address them, as opposed to episode framing that treated them as isolated events. How to present road safety as a systemic issue was a prominent focus of the trainings. This is an important finding because thematic framing, which attributes an issue to social causes, has traditionally been underused in road safety stories, while episodic framing attributing crashes to individual behavior, has been the default (te Brömmelstroet, 2020; Rosales and Stallones, 2008; Weinstein et al., 2020). Health news stories that use thematic framing have also been found to make readers more supportive of policy changes and encouraged to adopt healthier behaviors (Iyengar, 1991; Iyengar, 1996; Major, 2009; Coleman et al., 2011).
Nearly all the articles observed used at least one WHO-recommended story angle and key element. The most-used story angles focused on promoting evidence-based solutions and the overall deadliness of road traffic collisions, while the most-used key elements focused on avoiding the use of technical language and promoting evidence-based solutions. These align with the emphasis of the trainings and the relative ease of focusing on these areas. Most importantly, throughout the study period, five of the seven recommended angles were increasingly used. The use of key elements, on the other hand, fluctuated more and lacked a clear upward trend.
There are some contextual and methodological considerations that may have influenced the results: use of the angle and element that focused on promoting evidence-based solutions declined to a low in 2021, likely due to the fact that there were fewer solutions to focus on as resources for road safety efforts were shifted to COVID-19. The element “emphasizing the need for governments to make road safety a priority,” also declined in 2020, likely due to reprioritization for COVID-19. In certain cases, we saw a decline of angles and elements from 2017 to 2018 or 2019 and then a peak in 2021. This included the angle and element that focused on the human story, such as including advocate and survivor perspectives, and acknowledging that RTCs are not accidents and are preventable. In 2017 data was collected for only half a year, and included two major media-generating events that focus on these topics: Bogota Road Safety week (October) and World Day of Remembrance for Road Traffic Victims (November). This may have skewed the results in 2017, while the increase in 2021 may instead capture the cumulative effects of the trainings within the context of what made sense to focus on during the COVID-19 pandemic.
Story angles that focused on the human story were underutilized overall. This includes looking at the effect of road traffic crashes on survivors’ and families’ quality of life and incorporating the perspectives of stakeholder groups such as advocates and survivors. However, though journalists were not focusing overall on the human story, they were increasingly integrating elements of it into their articles. The low use of these angles may also be due to the nature of the articles that were analyzed, which largely focused on government-led road safety initiatives rather than specific crashes. However, even if more challenging, it is still possible to incorporate the human story into this type of article, and should be prioritized (World Health Organization and Pulitzer Center, 2015; Lajeunesse 2022).
In the articles that were observed for this study, government representatives, namely, from the Secretary of Mobility, were the most cited sources of information, and road safety advocates were the least cited. Government representatives attended and participated in the trainings and are often quoted in statements released about road safety-related issues; therefore, they were more readily available as sources. Overall, a substantial number of articles cited experts such as planners or engineers; relying on such experts as sources is important in presenting road safety as a public health issue that has achievable solutions (Ralph et al., 2019). A content analysis of road-safety-related articles in the U.S. found that not a single article quoted this type of expert (Ralph et al., 2019). Therefore, our findings in this regard are positive. Trainings should continue to connect journalists with experts such as urban planners, while also focusing on diversifying perspectives by engaging road safety advocates, who remain under-cited.
Our findings show shifts in language choices, including language related to how incidents were described, if and how human elements were mentioned, and the assignment of blame. Use of terms more in line with best practice, such as “crash” and “collision,” were observed to have increased across the study period. However, a substantial number of articles continued to use the term “accident” to refer to road traffic crashes. The use of the term remained relatively consistent across the study period. This highlights the challenges in transitioning away from this terminology, and the need to undertake additional efforts to address it, which may include institutionalizing style guides within media houses (Adhya, 2015; Goddard et al., 2019; Ralph et al., 2019; Reid, 2021).
More than half of the articles referenced either “victims” or “vulnerable road users,” and this increased over time, as did the use of the term “person” to refer to victims/vulnerable road users. However, approximately 6 in 10 articles still identified victims/vulnerable road users by the mode of transportation they were using at the time of the crash (e.g., pedestrians, bicyclists, etc.) rather than as a person, which has the effect of dehumanizing victims and making it more challenging to garner sympathy or empathy to compel the reader to care more about road traffic deaths and injuries (English and Salmon, 2016; Magusin, 2017).
More than half of the articles did not mention the agent of the crash, which is a strategy to help reduce victim-blaming (Ralph et al., 2019); ideally, this mention would be situated in a thematic story that discusses system-level challenges and solutions. In those cases where an agent was named, 3 out of 10 times it was a “driver,” though some articles (about 1 in 10) referred to the agent as a vehicle, which has the effect of removing human responsibility and suggesting that crashes are unavoidable (World Health Organization, 2004; Magusin, 2017).
We did not notice an overall increase in the volume of articles across the study period; in fact, there were far fewer road-safety-related articles in 2021 than in other years. However, this is likely due to the COVID-19 pandemic, which dominated news coverage, and our methodology, which analyzed articles collected for 8 months of that year (January-August 2021) and did not include road safety media-generating days that take place at the end of the year. Over the study period, road safety coverage largely shifted from national to local outlets and from TV and radio to social media networks and blogs, likely due to COVID-19 dominating national and traditional media platforms. However, the shift to newer media could also be related to trends in these forms of media becoming increasingly used for news (Perdomo, 2022; Statista, 2023), highlighting the importance of engaging journalists from new media organizations in trainings.
5 Study limitations
There are several limitations to our study. First, the articles collected in this study were identified purposively. They were those that mentioned or were relevant to the Bloomberg Philanthropies Initiative for Global Road Safety’s partners and work, particularly addressing speed management, which means they may have been more likely than the average road safety article to use best practices and may not be representative of the full universe of road safety coverage. However, this helped ensure the relevance of the articles, and our findings of increased incorporation of best practices over time suggest an independent effect of the journalist trainings. Second, the COVID-19 pandemic dominated global media beginning in 2020, which likely affected the number and nature of publications addressing road safety issues in 2020–2021; the effect the pandemic may have had on our results has been described in our discussion section. Our collection period in 2021 also only covered part of the year and did not include September through December when there are annual road safety events that tend to garner heavy media coverage; this includes World Day of Remembrance for Road Traffic Victims in November and Bogota’s annual road safety week in October. Finally, our study cannot definitively establish a direct correlation between the journalist trainings and improved writing in road safety articles, as it did not examine articles published before and after the training, nor did it compare articles written by trained journalists with those by their untrained counterparts.
6 Conclusion
This study has demonstrated that over the course of the BIGRS journalist training initiative, road safety reporting in Colombia increasingly adhered to best practices by using WHO-recommended story angles and key elements. More articles used thematic framing that discussed the wider context of road safety issues and offered solutions that had been prioritized in the trainings.
There were also significant positive linguistic changes that contribute to increasing concern for road traffic victims and about crashes, such as increased reference to victims and vulnerable road users as people and use of the terms crash and collision. Yet, there continued to be an overreliance on referring to victims/vulnerable road users by their mode of transportation during a crash rather than as “people,” and on using the term “accident.” In many cases, articles also did not mention agents of crashes.
Our findings demonstrated that the “human story” angle that puts victims and vulnerable road users at the center of reporting was underused and requires more emphasis in trainings. This includes by relying on the voices of advocates as experts, and on addressing hurdles to transitioning past language that contributes to making road crashes seem inevitable and blameless rather than part of a preventable public health concern.
Based on the findings of this study, road safety stakeholders, including government road safety agencies, should consider strategic media engagement, such as journalist workshops, to equip media with knowledge on a comprehensive safe system approach to road safety and solutions that can save lives on the roads.
Data availability statement
The raw data supporting the conclusions of this article will be made available by the authors to other researchers on request, following publication. The researchers must sign a contract with Vital Strategies on data use.
Author contributions
KS: Conceptualization, Supervision, Writing–review and editing. RR-H: Conceptualization, Formal Analysis, Investigation, Methodology, Writing–original draft. EZ: Formal Analysis, Writing–original draft. NN: Formal Analysis, Investigation, Methodology, Writing–original draft. SM: Project administration, Resources, Supervision, Writing–review and editing. IM: Project administration, Resources, Supervision, Writing–review and editing. NM: Project administration, Resources, Supervision, Writing–review and editing.
Funding
The author(s) declare financial support was received for the research, authorship, and/or publication of this article. The Vital Strategies’ Road Safety Program is supported by a grant from Bloomberg Philanthropies. However, Bloomberg Philanthropies was not involved in any aspect of this study or the writing of this manuscript. The authors did not receive any additional remuneration to write this article.
Acknowledgments
The authors gratefully acknowledge Bloomberg Philanthropies for their generous support of this project, as well as the Colombia staff and international partners of the Bloomberg Philanthropies Initiative for Global Road Safety. The authors would also like to acknowledge Karen Schmidt for editorial support and Hana Raskin for her support in writing the paper.
Conflict of interest
The authors declare that the research was conducted in the absence of any commercial or financial relationships that could be construed as a potential conflict of interest.
Publisher’s note
All claims expressed in this article are solely those of the authors and do not necessarily represent those of their affiliated organizations, or those of the publisher, the editors and the reviewers. Any product that may be evaluated in this article, or claim that may be made by its manufacturer, is not guaranteed or endorsed by the publisher.
Footnotes
1We used the Spanish words “choque” and “siniestro” for “crash.” See Table 6 for the Spanish search terms for the other changes in language that were evaluated (e.g., accident, collision).
References
Adhya, E. (2015). Key elements of an effective style guide in the new age. Tech. Commun. 62 (3), 183–192.
Boufous, S., Aboss, A., and Montgomery, V. (2016). Reporting on cyclist crashes in Australian newspapers. Aust. N. Z. J. Public Health 40 (5), 490–492. doi:10.1111/1753-6405.12537
Coleman, R., Thorson, E., and Wilkins, L. (2011). Testing the effect of framing and sourcing in health news stories. J. Health Commun. 16 (9), 941–954. doi:10.1080/10810730.2011.561918
Connor, S. M., and Wesolowski, K. (2004). Newspaper framing of fatal motor vehicle crashes in four Midwestern cities in the United States, 1999–2000. Inj. Prev. 10 (3), 149–153. doi:10.1136/ip.2003.003376
Daniels, S., Brijs, T., and Keunen, D. (2010). Official reporting and newspaper coverage of road crashes: a case study. Saf. Sci. 48 (10), 1469–1476. doi:10.1016/j.ssci.2010.07.007
Davis, R. M., and Pless, B. (2001). BMJ bans "accidents". Bmj 322 (7298), 1320–1321. doi:10.1136/bmj.322.7298.1320
Easteal, Am P., Blatchford, A., Holland, K., and Sutherland, G. (2022). Teaching journalists about violence against women best reportage practices: an Australian case study. Journal. Pract. 16 (10), 2185–2201. doi:10.1080/17512786.2021.1886866
English, P., and Salmon, P. (2016). New laws, road wars, courtesy and animosity: cycling safety in Queensland newspapers. Saf. Sci. 89, 256–262. doi:10.1016/j.ssci.2016.06.023
Goddard, T., Ralph, K., Thigpen, C. G., and Iacobucci, E. (2019). Does news coverage of traffic crashes affect perceived blame and preferred solutions? Evidence from an experiment. Transp. Res. Interdiscip. Perspect. 3, 100073. doi:10.1016/j.trip.2019.100073
Gupta, M., Kakar, I. S., Peden, M., Altieri, E., and Jagnoor, J. (2021). Media coverage and framing of road traffic safety in India. BMJ Glob. Health 6 (3), e004499. doi:10.1136/bmjgh-2020-004499
International Transport Forum (2021). Road safety annual report 2021: the impact of COVID-19 Colombia. Paris: OECD Publishing. Available online at: https://www.itf-oecd.org/sites/default/files/docs/irtad-road-safety-annual-report-2021.pdf (Accessed September 5, 2023).
Isaac Kofi, Y., Edmund, N. L. B., Tagbor, H., Peter, D., Robert, Q., George Ernest, A., et al. (2010). Reporting on road traffic injury: content analysis of injuries and prevention opportunities in Ghanaian newspapers. Inj. Prev. 16 (3), 194–197. doi:10.1136/ip.2009.024174
Iyengar, S. (1991). Is anyone responsible? How television frames political issues. Chicago: University of Chicago Press.
Iyengar, S. (1996). Framing responsibility for political issues. Ann. Am. Acad. Political Soc. Sci. 546 (1), 59–70. doi:10.1177/0002716296546001006
Keliikoa, L. B., Thompson, M. D., Johnson, C. J., Cacal, S. L., Pirkle, C. M., and Sentell, T. L. (2022). Public health framing in local media coverage of crashes involving pedestrians or bicyclists in Hawai’i, 2019: a content analysis. Transp. Res. Interdiscip. Perspect. 13, 100525. doi:10.1016/j.trip.2021.100525
Kenez, S., O'Halloran, P., and Liamputtong, P. (2015). The portrayal of mental health in Australian daily newspapers. J. Public Health 39 (6), 513–517. doi:10.1111/1753-6405.12441
Lajeunesse, , et al. (2022). Shaping the narrative around traffic injury: a media framing guide for transportation and public health professionals. Chapel Hill, North Carolina: University of North Caroline Chapel Hill Collaborative Sciences Center for Road Safety; project R29. Available online at: https://www.roadsafety.unc.edu/docs/CSCRS_R29_FGuide.pdf (Accessed September 5, 2023).
Loftus, E. F., and Palmer, J. C. (1974). Reconstruction of automobile destruction: an example of the interaction between language and memory. J. Verbal Learn. Verbal Behav. 13 (5), 585–589. doi:10.1016/s0022-5371(74)80011-3
MacRitchie, V., and Seedat, M. (2008). Headlines and discourses in newspaper reports on traffic accidents. South Afr. J. Psychol. 38 (2), 337–354. doi:10.1177/008124630803800206
Magusin, H. (2017). If you want to get away with murder, use your car: a discursive content analysis of pedestrian traffic fatalities in news headlines. Earth Common J. 7 (1), 65–97. doi:10.31542/j.ecj.1229
Major, L. H. (2009). Break it to me harshly: the effects of intersecting news frames in lung cancer and obesity coverage. J. Health Commun. 14 (2), 174–188. doi:10.1080/10810730802659939
Mattingly, S., Bezboruah, K., Sloan, J., Reza, S., Nargesi, R., and Mahiyar, A. (2018). Blame-the-Victim policy narratives and state-level transportation policy decisions. Kalamazoo, MI: Transportation Research Center for Livable Communities. Available online at: https://wmich.edu/sites/default/files/attachments/u883/2018/TRCLC_RR_16-07_0.pdf (Accessed October 25, 2023).
McCombs, M. E., and Shaw, D. L. (1972). The agenda-setting function of mass media. Public Opin. Q. 36 (2), 176–187. doi:10.1086/267990
Ministerio de Salud y Protección Social y Agencia Nacional de Seguridad Vial (2020). Anuario de Siniestralidad Vial de Colombia 2019. Bogota, Colombia: ANSV. Available online at: https://www.minsalud.gov.co/sites/rid/Lists/BibliotecaDigital/RIDE/VS/PP/SA/anuario-nacional-siniestralidad-vial-colombia-2019.pdf (Accessed September 5, 2023).
Perdomo, V. G. (2022). Digital news report: Colombia. Oxford: Reuters Institute, University of Oxford. Available online at: https://reutersinstitute.politics.ox.ac.uk/digital-news-report/2022/colombia (Accessed September 5, 2023).
Political Declaration of the Road Safety (2022). Political declaration of the high-level meeting on improving global road Safety“The 2030 horizon for road safety: securing a decade of action and delivery.”. Available online at: https://www.un.org/pga/76/wp-content/uploads/sites/101/2022/06/23-June-Political-Declaration-on-Road-Safety.pdf (Accessed September 5, 2023).
Puspa Raj, P., Sudhamshu, D., Kannan, K., Sunil Kumar, J., and Julie, M. (2021). 3C.006 Enabling journalists to contribute to the road safety system: experience from Nepal. Inj. Prev. 27, A25. Suppl 2. doi:10.1136/injuryprev-2021-safety.76
Ralph, K., Iacobucci, E., Thigpen, C. G., and Goddard, T. (2019). Editorial patterns in bicyclist and pedestrian crash reporting. Transp. Res. Rec. 2673 (2), 663–671. doi:10.1177/0361198119825637
Reid, C. (2021). It’s crash not accident: road collision reporting guidelines issued. Forbes. Available online at: https://www.forbes.com/sites/carltonreid/2021/05/17/its-crash-not-accident-road-collision-reporting-guidelines-issued/?sh=5a56d23b2f2a (Accessed September 5, 2023).
Rosales, M., and Stallones, L. (2008). Coverage of motor vehicle crashes with injuries in U.S. newspapers, 1999-2002. J. Saf. Res. 39 (5), 477–482. doi:10.1016/j.jsr.2008.08.001
Scherr, S., Markiewitz, A., and Arendt, F. (2019). Effectiveness of a workshop intervention on responsible reporting on suicide among Swiss media professionals. Crisis 40 (6), 446–450. doi:10.1027/0227-5910/a000584
Sharpin, B. A., Harris, D., Dempster, H., and Menocal, R. A. (2018). Securing safe roads: the politics of change. Mexico City: World Resources Institute, Ross Center. Available online at: https://cdn.odi.org/media/documents/12132.pdf (Accessed October 25, 2023).
Statista (2023). Share of adults who use social media as a source of news in selected countries worldwide as of February 2023. Available online at: https://www.statista.com/statistics/718019/social-media-news-source/ (Accessed September 5, 2023).
Stromberg, J. (2015). We don’t say “plane accident.” We shouldn’t say “car accident” either. Washington: Vox. Available online at: https://www.vox.com/2015/7/20/8995151/crash-not-accident (Accessed October 25, 2023).
te Brömmelstroet, M. (2020). Framing systemic traffic violence: media coverage of Dutch traffic crashes. Transp. Res. Interdiscip. Perspect. 5, 100109. doi:10.1016/j.trip.2020.100109
Vital Strategies (2020). Reporting on traffic crashes: best practices. Available online at: https://www.vitalstrategies.org/resources/reporting-on-traffic-crashes-best-practices/ (Accessed September 5, 2023).
Vital Strategies (2021). A guide to conducting online focus groups. Available online at: https://www.vitalstrategies.org/wp-content/uploads/A-Guide-to-Conducting-Online-Focus-Groups.pdf (Accessed September 5, 2023).
Weinstein, D., Jung, K., Jauriqui, V., Rosenthal, E., and Valkenburgh, S. V. (2020). Media coverage of health issues and impact on audiences. Los Angeles, California: USC Annenberg Norman Lear Center. Available online at: https://learcenter.s3.us-west-1.amazonaws.com/cultureofhealth_landscapeanalysis.pdf (Accessed September 5, 2023).
World Bank Group Global Road Safety Facility (2023). Colombia's road safety country profile. Available online at: https://www.roadsafetyfacility.org/country/colombia (Accessed September 5, 2023).
World Health Organization (2004). World report on road traffic injury prevention. Geneva, Switzerland: WHO. Available online at: https://www.who.int/publications/i/item/world-report-on-road-traffic-injury-prevention (Accessed September 5, 2023).
World Health Organization (2016). The Global Health Observatory: estimated number of road traffic deaths (Colombia). Available online at: https://www.who.int/data/gho/data/indicators/indicator-details/GHO/estimated-number-of-road-traffic-deaths (Accessed September 5, 2023).
World Health Organization (2022). Fact sheet: road traffic injuries. Updated June 20, 2022. Available online at: https://www.who.int/news-room/fact-sheets/detail/road-traffic-injuries (Accessed September 5, 2023).
World Health Organization and Pulitzer Center (2015). Reporting on road safety A guide for journalists. Geneva, Switzerland: WHO. Available online at: https://apps.who.int/iris/bitstream/handle/10665/179826/9789241508933_eng.pdf?sequence=1&isAllowed=y (Accessed September 5, 2023).
World Health OrganizationUnited Nations Regional Commissions (2021). Global plan for the decade of action for road safety 2021-2030. Available online at: https://www.who.int/publications/m/item/global-plan-for-the-decade-of-action-for-road-safety-2021-2030 (Accessed October 25, 2023).
Zipper, D. (2021). The deadly myth that human error causes most car crashes: the atlantic. Available online at: https://www.theatlantic.com/ideas/archive/2021/11/deadly-myth-human-error-causes-most-car-crashes/620808/ (Accessed October 25, 2023).
Keywords: road safety, Colombia, road traffic crashes, journalist training, media coverage, content analysis, earned media
Citation: Saporito K, Rothenstein-Henry R, Zeynalova E, Negi NS, Mullin S, Morozova I and Murukutla N (2023) A content analysis of media coverage on road safety and road traffic crashes in Colombia. Front. Future Transp. 4:1295123. doi: 10.3389/ffutr.2023.1295123
Received: 20 September 2023; Accepted: 09 November 2023;
Published: 22 November 2023.
Edited by:
Jing Zhao, University of Shanghai for Science and Technology, ChinaReviewed by:
Pengfei Liu, University of Shanghai for Science and Technology, ChinaLi Song, Wuhan University of Technology, China
Copyright © 2023 Saporito, Rothenstein-Henry, Zeynalova, Negi, Mullin, Morozova and Murukutla. This is an open-access article distributed under the terms of the Creative Commons Attribution License (CC BY). The use, distribution or reproduction in other forums is permitted, provided the original author(s) and the copyright owner(s) are credited and that the original publication in this journal is cited, in accordance with accepted academic practice. No use, distribution or reproduction is permitted which does not comply with these terms.
*Correspondence: Elizaveta Zeynalova, ZXpleW5hbG92YUB2aXRhbHN0cmF0ZWdpZXMub3Jn