 Sarah-Kate Millar
 Benjamin Noël3
 Mai Geisen
 Robert Rein
 Stefanie Klatt
- 1Faculty of Health, University of Canterbury, Christchurch, New Zealand
- 2Auckland University of Technology, Sports Performance Institute New Zealand, Auckland, New Zealand
- 3German Sport University Cologne, Institute of Exercise Training and Sport Informatics, Cologne, Germany
Current evidence suggests that the speed of an object influences its time-to-arrival (TTA) estimation; in particular, greater speeds are associated with more inaccurate TTA estimates, which yield higher-risk decisions about approaching persons or objects. This study aims to investigate the impacts of bike speed and additional factors like bike type and gender of the cyclist on TTA estimates in a naturalistic cycling setting. Two experiments were performed to examine the influences of speed on TTA estimations with conventional pedelecs and e-bikes. The results indicate that a combination of factors (experiment 1) involving cyclist gender, cycle speed, and only the arrival distance of the bike at the point of decision making (experiment 2) affect the accuracy of TTA estimation. However, the inclusion of additional information on the cycle speed (based on paint on the front wheel) has no positive (experiment 1) or negative (experiment 2) influence on the evaluation.
1 Introduction
The need to determine the motion of an object is a common daily task that humans are very successful at. Motion judgment is necessary to intercept a moving person or a moving object, such as grabbing the handle of a swinging door or catching a ball in flight (Kistemaker et al., 2009). Similarly, motion judgments are also important when trying to avoid collision with a person or an object, e.g., when dodging another person on a busy crosswalk or when driving a car and avoiding collision with a cyclist when turning. In particular, avoiding collisions is an important skill when navigating road traffic. To complete these avoidance or collision tasks, humans have to estimate object motions or equivalently time to a collision (TTC) or the time to arrival (TTA) of an object. TTA refers to the time required for an object traveling at a certain speed in a certain direction to reach a specified point in space (Tresilian, 1995).
Typical road traffic conditions are characterized by participants using various means of transportation traveling at different speeds while constantly interacting with others, which is known to contribute to traffic accidents (Mitsakis et al., 2015). Recently, the introduction of e-scooters and pedelecs has significantly altered the distribution of utilization of transportation modes. Pedelecs are bicycles with electric pedal support (Vlakveld et al., 2021); they typically travel at speeds greater than those of conventional bikes and thereby increase the challenges for traffic participants when attempting to determine accurate TTA estimates necessary for navigating busy traffic environments (Twisk et al., 2021; Vlakveld et al., 2021; Simović et al., 2021). Unfortunately, the number of instances of collisions with cars, people, or bicycles is already high for conventional bikes; for example, there is a steadily increasing trend of serious road injuries involving pedelecs in the Netherlands (Poos et al., 2017). In particular, elderly populations seem to be affected to a greater extent (Poos et al., 2017). In this regard, studying the TTAs of cyclists (conventional and pedelec) are warranted to possibly reduce accident rates.
2 Aim and research questions
We specifically aim to evaluate whether and to what extent the use of contrast textures applied to bicycle wheels influence TTA estimates. In addition, the present study aims to explore if the TTA estimates are influenced by bike speed, gender of the rider, and bike type (conventional or e-bike). To answer these questions, two experiments were conducted: the first experiment investigates the influences of bike type, gender of the rider, bike speed, distance of the TTA estimate, and a single contrast line on the front wheel; the second experiment investigates the influences of a 50/50 white contrast texture on the front wheel of the bike and different bike speeds.
3 Related work
Schleinitz et al. (2016) analyzed the influences of approach speed and cycle type (i.e., conventional vs. e-bike) on TTA estimations at a simulated road intersection. Three different approach speeds were studied: 15, 20, and 25 km/h. The main findings of this study were as follows: TTA estimates increased with increasing bike speeds; there were indications of stereotype effects, where an older participant perceived vehicles as arriving much earlier than that indicated by younger participants; TTA estimates were greater for conventional bikes than e-bikes (Schleinitz et al., 2016). The authors argued that the pedaling frequency or perceived effort of the pedaler had an impact on the TTA estimations of cyclists by participants. This result indicated that a cyclist with a greater pedaling frequency had a shorter TTA than one with a smaller pedaling frequency (like those associated with e-bikes). As pedelecs are fitted with electric motors that are not always obvious from a cursory look at the bike, there is potential for conflicting information to arise when making TTA estimates. For example, it is perfectly possible for an elderly person riding a pedelec to travel at a much greater speed while appearing to ride relaxed and comfortably. Schleinitz et al. (2016) further showed a stereotype effect of older riders compared to younger riders, suggesting that preconceptions about the riders may play important roles when estimating TTA. Accordingly, it is reasonable to assume gender effects, where male riders may be perceived to be traveling faster than female riders. In line with this view, there is strong evidence of a stereotype effect of bicyclist behavior, where car drivers alter their behaviors based on the perceived gender of the rider. In a study by Walker (2007), it was found that car drivers allowed more distance when passing around a perceived female rider than a male rider. However, gendered differences were not investigated by Schleinitz et al. (2016). Given the increasing use of pedelecs on roads, this potential stereotype problem of viewing male vs. female riders is worth exploring to better understand behaviors toward cyclists on both pedelecs and bicycles. Given these gender stereotype effects, there may be greater impacts on cyclist safety based on the increasing number of pedelecs on roads (Petzoldt et al., 2017).
Cantisani et al. (2019) analyzed safety issues at urban intersections to highlight how trajectory conflicts between bicycles and vehicles can significantly increase collision risk; their probabilistic risk model demonstrated that exposure time and reaction time are key factors in accident prevention. These findings complement those reported by Schleinitz et al. (2016) by providing insights into safety at intersections, where the geometry and kinematics of road users play crucial roles in estimating potential hazards. The potentially conflicting information concerning pedaling frequency and bike speed may be attributed to the fact that unlike conventional bikes, which have cycle visual cues to help make timing estimates and predict the behaviors of cyclists in traffic (Hermeren et al., 2014), there is no direct (mechanical) relationship between pedaling frequency and cycle speed on a pedelec. With regard to a traditional cycle, there is a strong relationship between pedaling frequency and cycle speed (Hermeren et al., 2014) even when using gears; this means that even if a person pedals slowly, a bicycle assisted by an electric motor can travel at higher speeds. For instance, in Germany, the regulations allow motor assistance for speeds up to 25 km/h.
Johnsson et al. (2018) introduced the concept of surrogate safety indicators as alternatives to traditional accident-based safety evaluations. Their review emphasizes how critical traffic events, such as near-misses, can provide insights into the vulnerabilities experienced by cyclists and pedestrians. This aligns with the focus of our study on improving perceptual cues for better TTA estimations, as it suggests that alternative safety assessment methods could help identify risk factors that may not be evident from accident data alone. When examining more specific information sources from a bike, one would expect that the wheel speed would be a more accurate source of information for speed estimation than pedaling frequency. However, the speed of wheel rotations may be too high for the human visual information system to detect accurately (DeLucia, 2015). This motivates the idea of how people’s (pedestrians or drivers) estimations of the traveling speeds of others on bicycles may be influenced to avoid accidents. One way to explore this question is to compare riders on a conventional bike to those on a pedelec; here, even when the bikes are traveling the same speed (km/h), the pedaling frequency would be higher for the conventional bike to maintain the same speed as the pedelec.
A substantial factor contributing to accurate TTA estimates is the time or distance of an approaching object from the estimator. That is, people can make more accurate estimates when an object is close rather than far because of the looming effect, where the rate of expansion is greater when an object is closer (Lee, 1976). This finding has also been verified for TTA estimates of objects at a distance and found to be more accurate when the object is closer (Schleinitz et al., 2016). Zangenehpour et al. (2015) developed an automated classification system for tracking cyclists and pedestrians at intersections, where they demonstrated that video-based detection methods can help assess risk factors in mixed-traffic environments. Their methodology for identifying cyclist–vehicle conflicts is particularly relevant to studies examining how safety is influenced by visibility and motion perception. This supports the argument that contrast-enhancing features, such as those investigated in the present study, may improve TTA estimation accuracy and reduce collision risk.
In road traffic situations, decisions about TTA are required over a range of distances, that is, an individual (or estimator) standing on the road observing an approaching bike at various distances has to make a “cross now or do not cross yet decision” all the time. These decisions based on perceived TTA estimates are the same for drivers wanting to turn their vehicles across the road. In a study regarding TTA estimates of oncoming cars compared to motor bikes, which are similar in size to pedelecs, Lee and Sheppard (2017) observed misestimation of speed of approaching motorcycles compared to cars; this misestimation was cited to be potentially linked to the rate of optical expansion or looming errors rather than misperception of distance (Lee and Sheppard, 2017). Unfortunately, trying to create this naturalistic and representative decision environment when exploring differences in TTA estimates at multiple points close to the estimator (e.g., 5 m or 10 m away from the observer) remains to be fully explored.
Following the work by Schleinitz et al. (2016), the present study attempts to enhance local affordance information and consequently the estimation of speed or TTA using contrast textures on a bicycle wheel. Current evidence suggests that speed estimates are influenced by local rather than global perceptions (Conchillo et al., 2006). For example, Conchillo et al. (2006) found that perceptions were positively influenced by the availability of local flow information. Global perception entails large structural information about a scene (e.g., a bike or car moving on the road), whereas local perception is defined as local-level information that provides the small details useful for creating a clear representation of a visual scene (Kimchi, 1992; Dore et al., 2018), such as the contrast between bike movement and a stationary background. Accordingly, application of contrasting textures allows better estimation of object speed (DeLucia, 2015; von Helversen et al., 2013). The textural contrast can be increased by the addition of patterns that provide a fixed point of contrast to the texture information related to perceived motion (Lenoir et al., 1999). In the case of cycling, the wheel rotation against the ground may serve as a point of contrast.
4 Experiment 1
The purpose of experiment 1 was to investigate the influences of bike speed, gender of the rider, cycle type, distance from the decision point, and a wheel modification with a contrasting single white line (henceforth referred to as “line”) on TTA estimations by observers. Based on previous research, we hypothesized that higher speeds would result in less accurate TTA estimates (Petzoldt, 2014) and that a male cyclist would receive less accurate TTA estimates than a female cyclist. This latter prediction was based on research showing how rider stereotypes (e.g., young vs. old) (Joanisse et al., 2012) influenced speed perceptions. We also hypothesized that pedelec riders would receive more accurate TTA estimations (Schleinitz et al., 2016) and that the TTA estimates would be more accurate for decisions made 5 m from the arrival point than for 10 m (Lee and Sheppard, 2017). Finally, based on previous speed estimation work (Lenoir et al., 1999), we hypothesized that more accurate TTA estimates can be obtained with the addition of a single white contrast line to the cycle wheel than with unmarked wheels.
4.1 Methods
4.1.1 Participants
A total of 46 participants (Mage = 24.9 years, SD = 5.1 years), including 29 male and 17 female subjects, were recruited for experiment 1. The number of participants required was based on power analysis using G*Power 3.1 (Faul et al., 2007), which indicated that this sample size would result in sufficient power (0.80) to detect significant differences (α-level = 0.05, f = 0.25). The participants self-reported that they were physically and psychologically healthy and had normal or corrected-to-normal visual acuity. The inclusion criterion entailed possession of a valid driving license. Informed consent was obtained from each participant prior to testing, as per the guidelines of the Declaration of Helsinki, and ethical approval was obtained from the ethics committee of the German Sport University Cologne (no. 068/2019_1). The participants were recruited through a poster advertisement outlining the study in a large European city and asked to contact the researcher if interested. No monetary reward was offered for involvement in the study.
4.1.2 Experimental design
To investigate the hypotheses of the first experiment, we designed a video-based laboratory task. Video-based virtual environments have gained common support in recent years as tools for studying human behavior (Fajen and Warren, 2004; Bai and Warren, 2023). They are noted to be particularly successful when the real-world environment could involve dangerous situations for the participants, such as the participant might “actually get hit” by a moving object. Some experiments have shown no differences in distance estimates between virtual and real environments (Mohler et al., 2006), but this area needs further research. A within-subject design was used in this study, where all participants were presented the same video clip showing different levels of the factors tested (Table 1). Thus, the influences of the independent variables like cyclist gender (female or male), cycle type (conventional bike or e-bike) (Figure 1), distance from the decision point to the line (5 m or 10 m), single white line on the wheel (yes or no), and cycle speed (17 km/h, 20 km/h, or 23 km/h) on the dependent variable (TTA estimate) was investigated. All video clips were standardized to a duration of 5 s. Figure 2 shows a screenshot from one of the video clips.
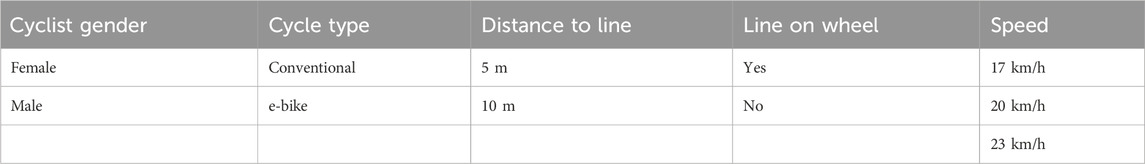
Table 1. Overview of all factors and their levels for experiment 1.

Figure 1. Bicycles shown in the videos for experiment 1. The image on the left shows a conventional bike, and the image on the right shows an e-bike.
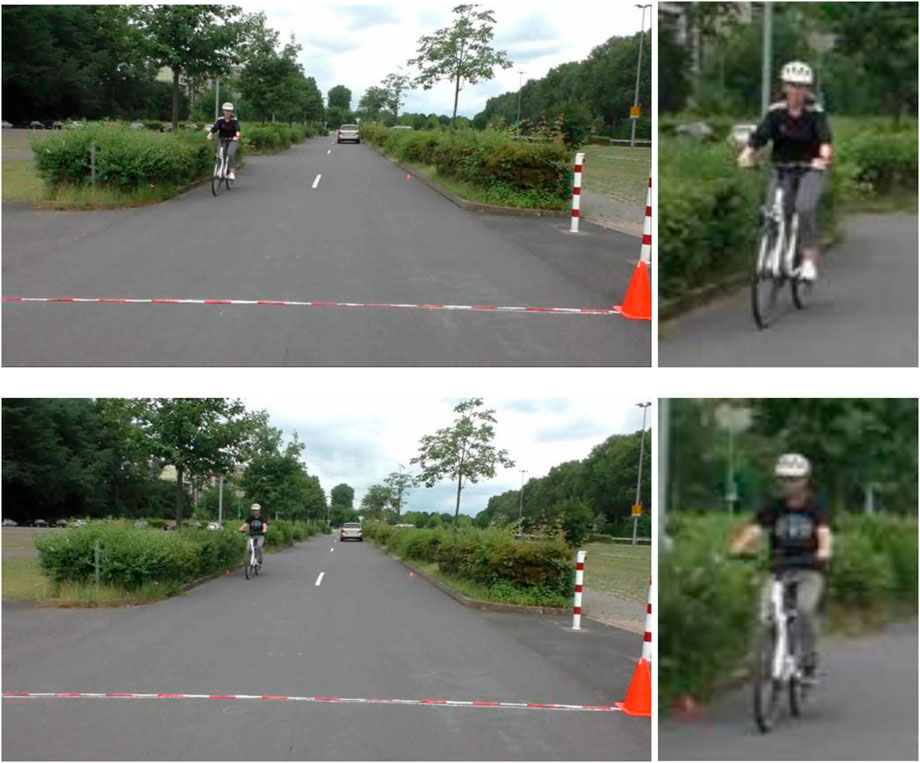
Figure 2. Screenshots from the videos presented in experiment 1. The images in the top row show a female cyclist (the complete scene is presented on the left; a close-up image is shown on the right), and the images in the bottom row show a male cyclist (the complete scene is presented on the left; a close-up image is shown on the right). Both cyclists approach the red and white striped line on different bicycles at different speeds.
4.1.3 Materials
Real-world videos of approaching bicycles were used in the experiment (Figure 2), and these videos were recorded on an unused marked road segment. All videos were recorded from the perspective of a car driver, i.e., the height of the driver’s line of sight when sitting in a car was considered equivalent to the height of the camera. The road was marked with a red and white striped tape to indicate the point of potential collision between the oncoming cyclist and driver when turning left. This line was the reference with respect to which the TTA was estimated. The video clips stopped when the rider was either 5 m or 10 m away from this line so that the participants could estimate the TTA. When riding the e-bike, the cyclists were free to choose the level of assistance needed to meet each of the three speeds (17, 20, or 23 km/h). The only restriction imposed was that the e-bike had to maintain a pedaling frequency of 90 bpm (low condition, equivalent to 45 rpm) and that the conventional bike had to maintain a pedaling frequency of 155 bpm (high condition, equivalent to 78 rpm). Each cyclist listened to a metronome through a phone while cycling to maintain the set rates. The cyclists were allowed enough practice time to familiarize themselves with maintaining the required cadence so that the metronome would not interfere with their natural riding behavior. A speedometer with a large screen was fitted on each bike so that the rider knew their speed. The riders were also allowed lengthy approach times to ensure consistent travel within the set during filming. Recordings with inconsistent speeds were deleted and repeated by the rider. The videos were then cut to a length of 5 s, where each video ended either 5 m or 10 m away from the red/white line. The videos were next presented to the participants using a large projection of height 2 m and width 3.55 m at an aspect ratio of 16:9 to provide a realistic view of the cyclist.
4.1.4 Procedures
After providing written informed consent, the participants received instructions about the experiment. The participants were asked to stand at a distance of 4 m from the projection wall and were provided a computer mouse connected to the test laptop; they would then use their right or dominant hand to respond to the videos by mouse click. The participants were instructed to imagine themselves sitting in the driver’s seat of a car and waiting to turn left. The participants were also instructed to observe the cyclist approaching the striped line to simulate the perspective of the car driver. As soon as the cyclist reached a distance of either 5 m or 10 m from the line, the screen turned black. Then, the participants had to estimate the exact time at which the cyclist would have crossed the line at the front wheel of the bicycle and respond via the computer mouse accordingly. This is known as a coincidence anticipation task or predication motion task. In between trials, the participants were allowed short breaks of approximately 2 s; each participant was allowed to complete two test runs, following which a total of 48 videos were shown.
4.1.5 Analysis
The accuracies of the TTA estimates were determined by comparing the actual TTA for each condition with the TTA estimate for each trial by each participant. The difference between the actual and estimated values was obtained in seconds and was considered as the measure of accuracy. For the intra-individual analysis, the absolute values of the TTA responses of each participant were examined and subjected to a 2 (gender: male, female) × 2 (cycle type: conventional, e-bike) × 2 (distance from decision point to the line: 5 m, 10 m) × 2 (line: yes, no) × 3 (cycle speed: 17 km/h, 20 km/h, 23 km/h) ANOVA with repeated measures for all factors to examine the participant accuracies on TTA estimations. In the case of sphericity violations, the Greenhouse–Geisser correction was applied. All statistical tests were performed using SPSS 27. The significance level was set at α = 0.05. The effect sizes were assessed in terms of eta-squared (η2) and interpreted in line with the guidelines provided by Cohen (1988).
4.2 Results and discussion
On average, the absolute value of the deviation of the participant estimates from the actual TTA was 457 ms (95% confidence interval (CI): [375, 538]). The ANOVA results indicated several influences on the participants’ TTA estimates (see summary in Table 2). These included cyclist gender (F(1, 38) = 6.634, p = 0.014, η2 = 0.149), cycle speed (F(2, 76) = 12.126, p < 0.001, η2 = 0.242), distance from the decision point to the line (F(1, 38) = 23.082, p < 0.001, η2 = 0.378), and inclusion of the line on the wheel (F(1, 38) = 11.164, p = 0.002, η2 = 0.227); however, the bike type (F(1, 38) = 2.308, p = 0.137, η2 = 0.058) was observed to not have an influence on the accuracy of TTA estimation. For cases involving a male cyclist, the participants were less accurate in judging TTA than in cases involving a female cyclist (479 ms vs. 434 ms; mean difference = 45 ms; 95% CI: [9.71, 81.05]); further, the accuracies were better for the no line condition than the line condition (435 ms vs. 478 ms; mean difference = 43 ms; 95% CI: [16.87, 68.72]) and 5 m distance than the 10 m distance (339 ms vs. 574 ms; mean difference = 235 ms; 95% CI: [136, 334]). Post hoc pairwise comparisons for different cycle speeds using Bonferroni correction showed that the 17 km/h condition (480 ms, p < 0.001, mean difference = 72 ms, 95% CI: [24, 120]) and 20 km/h condition (482 ms, p < 0.001, mean difference = 74 ms, 95% CI: [28, 120]) differed from the 23 km/h condition (407.8 ms) but not from each other.
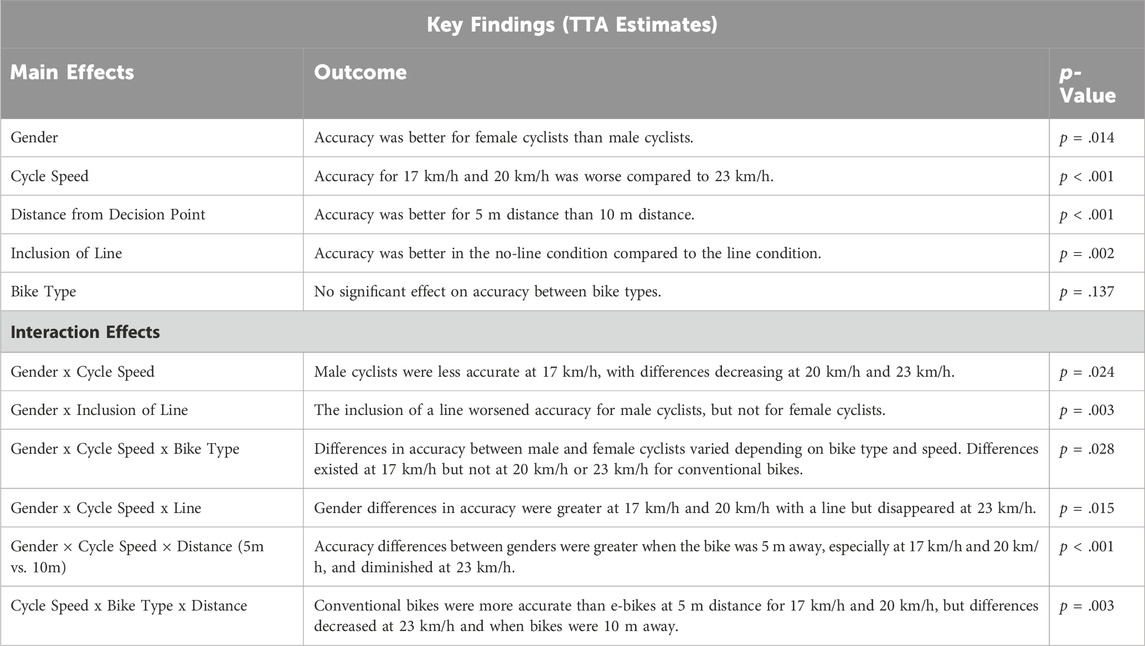
Table 2. Overview of statistical results and key findings of experiment 1.
In addition to these main effects, several interaction effects were observed. First, we noted a two-way interaction between gender and cycle speed (F(2, 76) = 3.932, p = 0.024, η2 = 0.094). Although the TTA estimation accuracy for a male cyclist was worse than that for a female rider at 17 km/h (533 ms vs. 428 ms), the difference decreased for cyclists at 20 km/h (501 ms vs. 463 ms) and disappeared for the 23 km/h condition (404 ms vs. 412 ms). Second, there was an interaction between gender and inclusion of the white line (F(1, 38) = 9.983, p = 0.003, η2 = 0.208), indicating that there was a negative effect of including the line for male cyclists (439 ms vs. 519 ms) but not for female cyclists (431 ms vs. 437 ms). We also noted three-way interactions among gender, cycle speed, and bike type (F(2, 76) = 3.757, p = 0.028, η2 = 0.09); among gender, cycle speed, and line (F(2, 76) = 4.476, p = 0.015, η2 = 0.105); as well as among gender, cycle speed, and distance from the decision point line (F(2, 76) = 9.447, p < 0.001, η2 = 0.199). Although the differences between both genders decreased from the slowest to the fastest condition when riding e-bikes, such differences existed only at the 17 km/h condition but not at the 20 km/h and 23 km/h conditions when riding conventional bikes. Similarly, in the no-line condition, the differences between the genders decreased continuously (from 17 km/h to 20 km/h and 23 km/h), whereas the differences between male and female cyclists remained constant for cycle speeds of 17 km/h and 20 km/h before disappearing for cycle speeds of 23 km/h in the presence of the line. When the bike was 10 m away when the video stopped, there was a continuous decrease in gender-based differences from the slowest to fastest conditions; however, when the bike was 5 m away, the differences between the genders in judgment accuracy increased from the 17 km/h to 20 km/h condition but were lowest for the 23 km/h condition. There was another three-way interaction among speed, bike type, and distance from the decision point (F(2, 76) = 6.315, p = 0.003, η2 = 0.142). Although the TTA values for conventional bikes were judged more accurately than for e-bikes when the video stopped at a distance of 5 m, the differences between the bikes depended on the cycling speed: the difference was 22 ms at 17 km/h, increased to 152 ms at 20 km/h, and disappeared at 23 km/h (1 ms). This pattern was somewhat different when the videos stopped at a distance of 10 m, where the differences were 32 ms, −28 ms, and 4 ms for the 17 km/h, 20 km/h, and 23 km/h conditions, respectively.
These results indicate that multiple factors influence the accuracies of TTA estimates, with gender and cycle speed playing significant roles. The findings suggest that gender-based perceptual biases exist, particularly at lower speeds, where male cyclists were judged with lower accuracies than female cyclists. Furthermore, the presence of a white line on the wheel negatively affected judgment accuracy, particularly for male cyclists, indicating a potential distraction effect or misinterpretation of speed-related cues. Interestingly, cycle type (e-bike vs. conventional) did not independently affect accuracy but showed complex interactions with speed and distance from the decision point. This suggests that the visual perception of speed of an e-bike may be influenced by multiple cues rather than a single distinguishing factor like pedaling frequency. These findings emphasize the need for further research into the manner in which perceptual biases and additional visual modifications affect road safety. The practical implications of these findings include potential reconsideration of adding visual markers to bicycle wheels as they may not always enhance visibility in ways that improve TTA accuracy.
5 Experiment 2
The findings of experiment 1 indicate that the addition of a single white painted line on the front wheel on both the conventional bike and e-bike can result in more inaccurate TTA values based on cycle speed than with a non-painted (normal) wheel. This change in participant behavior was contrary to the original hypothesis, for which there may be two possible reasons: the single white painted line on the wheel was not clearly visible when the bike wheel was moving quickly; the local information of the white stripe on the wheel shifted the observer’s focus away from other important information on the bike speed, thus causing a distraction effect that conflicts with the local and global information sources (Dore et al., 2018; Navon, 1981; Isaak and Fawcett, 1997). Therefore, experiment 2 had a 50/50 white/black painted front wheel on the bike to test if this would change the TTA estimates. The choice of the 50/50 painted wheel was attributable to the potential limitation of experiment 1, where the participants maybe not being able to see the local information on the tire with one white line; hence, this 50/50 contrast was aimed at removing this potential issue. The same set of bike speeds as experiment 1 were used in this part of the study.
The difference in bike speed is an important consideration as the bikes are free to travel at a wide variety of speeds; therefore, understanding the impact of the modified tire on the range of speeds can help inform its potential impact. The other significant result from experiment 1 was that the participants were more accurate with their TTA estimations when the video ended 5 m rather than 10 m before the arrival line. While this is a strong result, it remains to be seen whether the same result can be obtained at different speeds with the 50/50 modified wheel. Thus, experiment 2 aimed to assess the impacts of a 50/50 white-and-black painted front tire on an e-bike at three speeds (17, 20, and 23 km/h) and to evaluate its effects at distances of 5 m and 10 m prior to expected arrival at the designated line.
5.1 Methods
5.1.1 Participants
Twenty-six subjects (22.58 ± 2.24 years, 14 male and 12 female) participated in experiment 2. The participants provided written informed consent before participating in the study, as noted previously.
5.1.2 Experimental design
A second video-based laboratory experiment was designed to investigate the hypotheses of experiment 2. The factors and factor levels within experiment 2 are listed in Table 3. In contrast to experiment 1, the cyclist gender was female only. The bike type did not impact TTA estimates in experiment 1 (at least not independent of two or more factors), so only e-bikes were used in this experiment, of which one bike had half of a wheel painted white (Figure 3). The approach distances to the striped line (5 m or 10 m) remained the same as in the other experiments, and the recordings were obtained in the same manner under midday sunlight. Three different speeds were included in the test design, i.e., 17, 20, and 23 km/h. The dependent variable was the participant estimates of TTA.
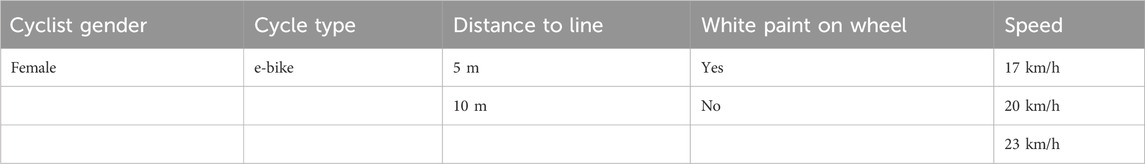
Table 3. Overview of all factors and their levels for experiment 2.
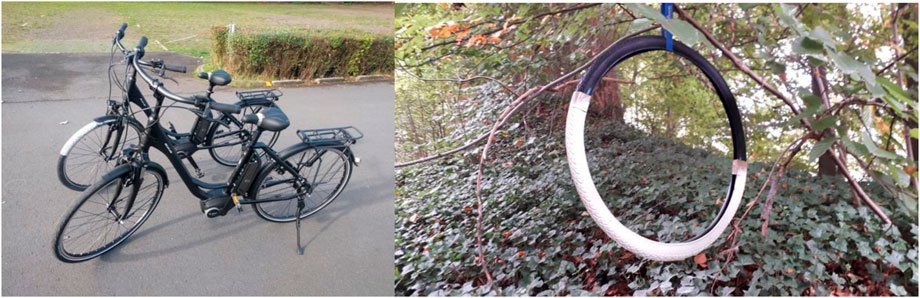
Figure 3. E-bikes shown in the videos within experiment 2. The image on the left shows both e-bikes, where one bike has half of its front wheel painted white and the other does not have this marking. The painted front wheel is presented as a close-up in the image on the right.
5.1.3 Materials and procedures
The video sequences of duration 5 s were comparable to those used in experiment 1 and showed a female cyclist riding an e-bike with or without a modified half-white painted wheel (Figure 3). The cyclist was riding at one of the three preset speeds toward a line marked on the road, which was considered as the arrival point. All other aspects of the design, namely, distance to line, pedaling frequency, metronome usage, video presentation via a projector, and participant distance from the wall, were identical to those of experiment 1. The experimental procedures and test settings remained the same as those used in experiment 1. The participants were instructed to indicate the arrival of the cyclist in the video at the striped line that was considered to be their position as a car driver. After two practice test runs, a total of 24 videos were shown.
5.1.4 Analysis
Similar to experiment 1, we determined the factor influences on the TTA estimates. Therefore, the obtained responses were submitted to a 3 (cycle speed: 17 km/h, 20 km/h, 23 km/h) × 2 (50/50 paint on the wheel: yes, no) × 2 (distance between the decision point and line: 5 m, 10 m) ANOVA with repeated measures on all three factors. In the case of any sphericity violations, the Greenhouse–Geisser correction was applied. All statistical tests were performed using SPSS 27. The significance level was set at α = 0.05. The effect sizes were assessed in terms of eta-squared (η2) and interpreted in line with the guidelines of Cohen (1988).
5.2 Results and discussion
On average, the participant estimates of TTA deviated from the actual TTA by 518 ms (95% CI: [392, 645]). The results of ANOVA showed no differences between the speed conditions (F(1.6, 40.17) = 1.267, p = 0.285, η2 = 0.048) but showed the influences of the distance between the decision point and striped line (F(1, 25) = 14.079, p < 0.001, η2 = 0.36) as well as presence of paint on the wheel (F(1, 25) = 8.042, p = 0.009, η2 = 0.243). On average, the participants were more accurate in cases where the bike was 5 m away from the line at the end of the video than 10 m (431 ms vs. 605 ms; mean difference = 174 ms; 95% CI: [78, 269]). The participants were also more accurate in their TTA estimates in cases without the painted front wheel than with paint (476 ms vs. 561 ms; mean difference = 86 ms; 95% CI: [23, 148]). In contrast to experiment 1, no relevant interaction effects were found (all p > 0.146). Table 4 summarizes the results observed for experiment 2.
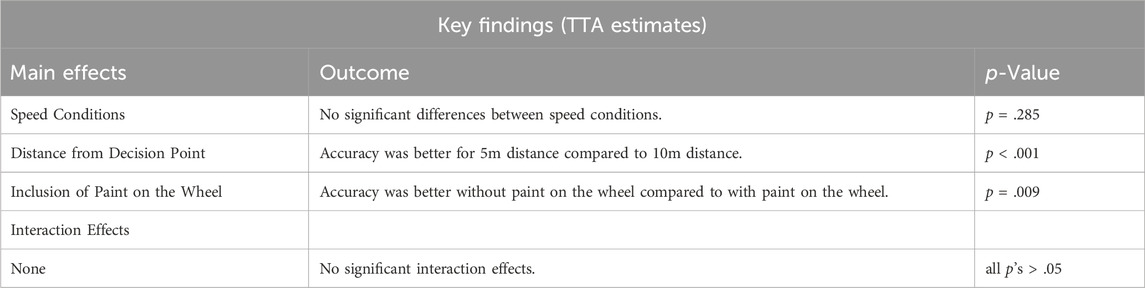
Table 4. Overview of statistical results and key findings of Experiment 2.
These results highlight that the most accurate TTA estimates are obtained when the bike is closer to the decision point, which is in agreement with prior research on time-to-collision (TTC) estimation accuracies (Lee, 1976; Milner and Goodale, 2006). Moreover, visual modification of the wheel had a detrimental effect on TTA accuracy, likely owing to a distraction effect that interfered with the perception of relevant motion cues. These findings have important implications for road safety, particularly for ensuring that bicycle visibility modifications enhance rather than impair the perceptual accuracy.
6 General discussion
This study sought to extend the understanding of TTA estimates of an approaching bicycle under various conditions, including different cycle speeds, gender of the cyclist, bike types, distance to the decision point (5 m/10 m), and visual modification of the front wheel of the bike, via two experiments. The results from experiment 1 reveal large effects of the approach speed of the bike and distance before TTC at which the decision was made as well as strong negative effects of paint stripe on the front wheel and gender of the cyclist. Experiment 2 tested the hypotheses that cycle speed and a more prominent visual modification to the front wheel would influence TTA estimates. The results of experiment 2 showed a large impact on TTA estimates when the salience of the front tire was modified; however, the effect found was not in the predicted direction. Experiment 2 also revealed that the strength of TTA estimation was influenced by the TTC distance. The significant interaction effects observed, such as those among the cyclist gender, speed, and distance, underscore the complexity of the perceptual and cognitive processes involved in TTA estimations. These results may partly reflect stereotypical biases or limitations in the availability of relevant visual cues. Conversely, the absence of significant effects for certain interactions, like that between bike type and speed, highlights the need for further studies in ecologically valid environments to account for a broader range of perceptual inputs.
One of the unexpected findings of this study was the negative impact of white paint on the front wheel of the bicycle. This result indicates a conflict between the local and global motion cues, leading to distraction and reduced focus on other relevant visual information. Theories on local vs. global information processing (Dore et al., 2018; Navon, 1981) suggest that such additional visual cues can sometimes lead to attention overload. Similar effects have been noted in studies examining the integration of conflicting perceptual cues (Isaak and Fawcett, 1997). These theoretical perspectives provide a potential explanation for the observed pattern and underscore the importance of considering both perceptual and cognitive factors in future research. Cantisani et al. (2019) also highlight how the intersection geometry and cyclist exposure time influence road safety; their probabilistic model suggests that even minor variations in traffic dynamics can significantly alter collision risks. These insights align with our findings and emphasize the importance of understanding the interactions among distance, visual cues, and perceived motion in the TTA estimations.
In both experiments, the most significant finding was that the TTC distance had the largest effect on TTA estimation accuracy. In particular, the participants were significantly more accurate when making TTA estimates when the bike was 5 m away from the TTC line than 10 m. This result is linked to the fact that people make more accurate TTA estimations when an object is closer to them than when they are away as the rate of expansion is greater when an object is closer (Lee, 1976; Milner and Goodale, 2006). This finding was also associated with TTA estimates of objects at a distance than in the vicinity and showed greater TTA accuracy for closer objects (Schleinitz et al., 2016).
One of the unexpected results of this study was the inconsistent impact of cycle speed on TTA estimation. This is in contrast with previous research (Horswill et al., 2005; Schleinitz et al., 2016), which showed that approach speed had considerable impact on TTA estimation. Experiment 1 showed significant differences for the lower 17 km/h and 20 km/h speeds than the higher 23 km/h speed, but the two lower speeds did not differ significantly from each other. Therefore, there is no consistent finding that supports increased speed equating to more inaccurate TTA estimations like in previous research. Experiment 2 did not show significant differences in TTA estimations when the bike speed varied. Johnsson et al. (2018) introduced surrogate safety indicators as alternatives to accident-based safety analysis; these indicators allow earlier identification of risk factors that may contribute to perceptual errors. This perspective aligns with our findings and suggests that TTA misjudgments could be a part of a broader set of risk indicators beyond simple collision events.
Experiment 1 tested a stereotype hypothesis, where TTA estimations for male cyclists would be shorter than those for female cyclists regardless of their bike types or speeds. A strong result clearly demonstrated that the gender of the cyclist impacted TTA estimation. In particular, the estimates were more inaccurate when viewing male cyclists. There was also a consistent finding that viewing a male cyclist traveling at 17 km/h either on an e-bike or a conventional bike produced more inaccurate results than when viewing a female cyclist at that same speed. This finding is new with regard to cycle speed and bike type, but it supports the stereotype effect on the speed of the vehicle from the perspectives of both a car passenger (Conchillo et al., 2006) and pedestrian (Semb, 1969).
A key focus of the study was understanding the potential impacts on TTA estimations between viewing conventional bikes and e-bikes when traveling at the same speed. Based on previous research (Schleinitz et al., 2016) we hypothesized that there would be a TTA estimation difference because of the cadence of the pedaling frequency between the two bike types when traveling at the same speed; this means that for a conventional bike to travel at the same speed as an e-bike, the cyclist would have higher cadence. In the present study, this difference in pedaling frequency was 45 rpm vs. 78 rpm, which could be perceived as a difference in effort and hence a higher bike speed. Surprisingly, this hypothesis was not supported in this study, and there was no significant difference between the two bike types; however, there were 2-way and 3-way interaction effects with the bike type, so this variable may not be completely discounted from future research efforts. Zangenehpour et al. (2015) provide further insights by demonstrating how automated tracking and classification of road users can help refine safety models and perceptual error analysis; their video-based methods could serve as future avenues for research to better capture the challenges of real-world TTA estimates.
Finally, an important focus of this study in terms of the two experiments was the introduction of contrasting visual manipulation of color on the front wheel of the bike to influence local affordance information. This focus was meant to assist observers with better detection of bike speeds through more accurate observations of wheel speeds, thereby improving their TTA estimates. The results from both experiments clearly demonstrated that providing additional information on the front wheel negatively affected TTA estimates than not having such information. One possible reason for this finding could be that the additional information on the wheel produced a distraction effect, producing conflict between the local and global information sources (Dore et al., 2018; Isaak and Fawcett, 1997; Navon, 1981). Another reason could be that there were multiple changes in conditions given the bike type, speed, gender of the cyclist, and TTC distance, so that the additional information was not detected and utilized as anticipated. Future research should thus explore the roles of perceptual and cognitive factors in TTA estimations, particularly under ecologically valid conditions that allow a broader range of perceptual cues. The findings of this study provide an initial understanding of the interactions between variables like gender and speed while highlighting areas where these effects are not significant, warranting additional investigations.
7 Conclusion
In conclusion, this study contributes to understanding the perceptions regarding cycling behaviors and its TTA estimates in the following two areas. First, the distance between the observer and approaching bike at the point of TTC decision has a large impact. In particular, the accuracy of decisions involving a distance of 10 m from TTC is a concern, with people potentially thinking that they have sufficient time to cross in front of a bike but end up in its direct path and a collision. Accurate detection of the speed of an e-bike than a conventional bike is also a concern as these are highly likely to be traveling at different speeds, which could again result in pedestrian collisions or near-miss situations when the bike is traveling in excess of 25 km/h. A simple suggestion here would be that e-bikes or their front wheels have a different color, such as a bright color, compared to other bikes on the road. From the authors’ perspectives and based on these results, future research in this area should include certain key factors. Studies may be untaken in an ecologically representative environment using natural settings and be less lab-based as this would allow the participants the ability to observe more information from the angles of their choice. Second, a larger number of subjects must be involved in such studies, thereby allowing a greater cross section of participants and conditions to be tested with stronger power and better statistical analyses.
Data availability statement
The raw data supporting the conclusions of this article will be made available by the authors without undue reservation.
Ethics statement
The studies involving humans were approved by the German Sport University Cologne (no. 068/2019_1). The studies were conducted in accordance with all local legislation and institutional requirements. The participants provided their written informed consent to participate in this study.
Author contributions
S-KM: conceptualization, investigation, methodology, validation, visualization, writing – original draft, and writing – review and editing. BN: formal analysis, supervision, and writing – review and editing. MG: data curation, investigation, project administration, and writing – review and editing. RR: conceptualization, data curation, formal analysis, methodology, and writing – review and editing. SK: conceptualization, investigation, methodology, resources, supervision, and writing – review and editing.
Funding
The author(s) declare that no financial support was received for the research and/or publication of this article.
Acknowledgments
The authors would like to thank the participants involved in this study for their time and effort.
Conflict of interest
The authors declare that the research was conducted in the absence of any commercial or financial relationships that could be construed as a potential conflict of interest.
Generative AI statement
The authors declare that no Generative AI was used in the creation of this manuscript.
Publisher’s note
All claims expressed in this article are solely those of the authors and do not necessarily represent those of their affiliated organizations, or those of the publisher, the editors and the reviewers. Any product that may be evaluated in this article, or claim that may be made by its manufacturer, is not guaranteed or endorsed by the publisher.
References
Bai, J., and Warren, W. H. (2023). Relative rate of expansion controls speed in one-dimensional pedestrian following. J. Vis. 23 (10), 3. doi:10.1167/jov.23.10.3
Cantisani, G., Moretti, L., and De Andrade Barbosa, Y. (2019). Safety problems in urban cycling mobility: a quantitative risk analysis at urban intersections. Safety 5 (1), 6. doi:10.3390/safety5010006
Cohen, J. (1988). Statistical power analysis for the behavioral sciences. 2nd ed. Hillsdale, NJ: Lawrence Erlbaum Associates.
Conchillo, A., Recarte, M. A., Nunes, L., and Ruiz, T. (2006). Comparing speed estimations from a moving vehicle in different traffic scenarios: absence versus presence of traffic flow. Span. J. Psychol. 9 (1), 32–37. doi:10.1017/s1138741600005941
DeLucia, P. R. (2015). “Perception of collision,” in The Cambridge handbook of applied perception research (Cambridge University Press), I, 568–591. doi:10.1017/CBO9780511973017.035
Dore, P., Dumani, A., Wyatt, G., and Shepherd, A. J. (2018). Links between global and local shape perception, coloured backgrounds, colour discrimination, and non-verbal IQ. Vis. Res. 151, 31–40. doi:10.1016/j.visres.2018.02.004
Fajen, B. R., and Warren, W. H. (2004). Visual guidance of intercepting a moving target on foot. Perception 33, 689–715. doi:10.1068/p5236
Faul, F., Erdfelder, E., Lang, A. G., and Buchner, A. (2007). G* Power 3: A flexible statistical power analysis program for the social, behavioral, and biomedical sciences. Behav. Res. Methods, 39 (2), 175–191.
Hemeren, P., Johannesson, M., Lebram, M., Eriksson, F., Ekman, K., and Veto, P. (2014). “The use of visual cues to determine the intent of cyclists in traffic,” in IEEE International Inter-Disciplinary Conference on Cognitive Methods in Situation Awareness and Decision Support (CogSIMA) (San Antonio: IEEE), 464. 47–51. doi:10.1109/cogsima.2014.6816539
Horswill, M. S., Helman, S., Ardiles, P., and Wann, J. P. (2005). Motorcycle accident risk could Be inflated by a time to arrival illusion. Optometry Vis. Sci. 82, 740–746. doi:10.1097/01.opx.0000175563.21423.50
Isaak, M. I., and Fawcett, S. L. (1997). Attention facilitates sequential recruitment in the perception of motion direction. Perception 26 (1_Suppl. l), 189. doi:10.1068/v970188
Joanisse, M., Gagnon, S., and Voloaca, M. (2012). Overly cautious and dangerous: an empirical evidence of the older driver stereotypes. Accid. Analysis Prev. 45, 802–810. doi:10.1016/j.aap.2011.11.002
Johnsson, C., Laureshyn, A., and De Ceunynck, T. (2018). In search of surrogate safety indicators for vulnerable road users: a review of surrogate safety indicators. Transp. Rev. 38 (6), 765–785. doi:10.1080/01441647.2018.1442888
Kimchi, R. (1992). Primacy of wholistic processing and global/local paradigm: a critical review. Psychol. Bull. 112, 24–38. doi:10.1037//0033-2909.112.1.24
Kistemaker, D. A., Faber, H., and Beek, P. J. (2009). Catching fly balls: a simulation study of the Chapman strategy. Hum. Mov. Sci. 28, 236–249. doi:10.1016/j.humov.2008.11.001
Lee, D. N. (1976). A theory of visual control of braking based on information about time-to-collision. Perception 5 (4), 437–459. doi:10.1068/p050437
Lee, Y. M., and Sheppard, E. (2017)). Differences in gap acceptance for approaching cars and motorcycles at junctions: what causes the size-arrival effect? Transp. Res. Part F Traffic Psychol. Behav., 50, 50–54. doi:10.1016/j.trf.2017.07.006
Lenoir, M., Musch, E., Janssens, M., Thiery, E., and Uyttenhove, J. (1999). Intercepting moving objects during self-motion. J. Mot. Behav. 31 (1), 55–67. doi:10.1080/00222899909601891
Milner, D., and Goodale, M. (2006). The visual brain in action, 27. New York, United States: Oxford University Press.
Mitsakis, E., Salanova Grau, J. M., Chrysohoou, E., and Aifadopoulou, G. (2015). A robust method for real time estimation of travel times for dense urban road networks using point-to-point detectors. Transport 30 (3), 264–272. doi:10.3846/16484142.2015.1078845
Mohler, B. J., Creem-Regehr, S. H., and Thompson, W. B. (2006). “The influence of feedback on egocentric distance judgments in real and virtual environments,” in ACM SIGGRAPH symposium on applied perception in graphics and visualization, 9–14.
Navon, D. (1981). The forest revisited: more on global precedence. Psychol. Res. 43 (1), 1–32. doi:10.1007/BF00309635
Petzoldt, T. (2014). On the relationship between pedestrian gap acceptance and time to arrival estimates. Accid. Analysis and Prev. 72, 127–133. doi:10.1016/j.aap.2014.06.019
Petzoldt, T., Schleinitz, K., Heilmann, S., and Gehlert, T. (2017). Traffic conflicts and their contextual factors when riding conventional vs. electric bicycles. Transp. Res. part F traffic Psychol. Behav. 46, 477–490. doi:10.1016/j.trf.2016.06.010
Poos, H. P. A. M. J., Lefarth, T. L., Harbers, J. S., Wendt, K. W., El Moumni, M., and Reininga, I. H. F. (2017). E-bikers are more often seriously injured in bicycle accidents: results from the Groningen bicycle accident database. Ned. Tijdschr. Geneeskd. 161 (20), D1520. Available online at: https://europepmc.org/article/MED/28537540.
Schleinitz, K., Petzoldt, T., Krems, J. F., and Gehlert, T. (2016). The influence of speed, cyclists' age, pedaling frequency, and observer age on observers' time to arrival judgments of approaching bicycles and e-bikes. Accid. Analysis Prev. 92, 113–121. doi:10.1016/j.aap.2016.03.020
Semb, G. (1969). Scaling automobile speed. Percept. Psychophys. 5 (2), 97–101. doi:10.3758/BF03210530
Simović, S., Ivanišević, T., Trifunović, A., Čičević, S., and Taranović, D. (2021). What affects the E-bicycle speed perception in the era of eco-sustainable mobility: a driving simulator study. Sustainability 13 (9), 5252. doi:10.3390/su13095252
Tresilian, J. R. (1995). Perceptual and cognitive processes in time-to-contact estimation: analysis of prediction-motion and relative judgment tasks. Percept. and Psychophys. 57, 231–245. doi:10.3758/BF03206510
Twisk, D., Stelling, A., Van Gent, P., De Groot, J., and Vlakveld, W. (2021). Speed characteristics of speed pedelecs, pedelecs and conventional bicycles in naturalistic urban and rural traffic conditions. Accid. Analysis and Prev., 150, 105940. doi:10.1016/j.aap.2020.105940
Vlakveld, W., Mons, C., Kamphuis, K., Stelling, A., and Twisk, D. (2021). Traffic conflicts involving speed-pedelecs (fast electric bicycles): a naturalistic riding study. Accid. Analysis and Prev., 158, 106201. doi:10.1016/j.aap.2021.106201
von Helversen, B., Schooler, L. J., and Czienskowski, U. (2013). Are stripes beneficial? Dazzle camouflage influences perceived speed and hit rates. PLoS ONE 8 (4), e61173. doi:10.1371/journal.pone.0061173
Walker, I. (2007). Drivers overtaking bicyclists: objective data on the effects of riding position, helmet use, vehicle type and apparent gender. Accid. Analysis and Prev. 39 (2), 417–425. doi:10.1016/j.aap.2006.08.010
Keywords: time to arrival, e-bike, vision manipulation, perception, estimation, electric bicycle, time to collision, judgment
Citation: Millar S-K, Noël B, Geisen M, Rein R and Klatt S (2025) Effects of speed, gender, and visual wheel modifications on time-to-arrival judgments of cyclists. Front. Future Transp. 6:1514936. doi: 10.3389/ffutr.2025.1514936
Received: 21 October 2024; Accepted: 02 May 2025;
Published: 04 June 2025.
Edited by:
Alireza Talebpour, University of Illinois at Urbana-Champaign, United StatesReviewed by:
Wesley Kumfer, University of North Carolina at Chapel Hill, United StatesJia Yao, Dalian University of Technology, China
Copyright © 2025 Millar, Noël, Geisen, Rein and Klatt. This is an open-access article distributed under the terms of the Creative Commons Attribution License (CC BY). The use, distribution or reproduction in other forums is permitted, provided the original author(s) and the copyright owner(s) are credited and that the original publication in this journal is cited, in accordance with accepted academic practice. No use, distribution or reproduction is permitted which does not comply with these terms.
*Correspondence: Sarah-Kate Millar, c2FyYWgta2F0ZS5taWxsYXJAY2FudGVyYnVyeS5hYy5ueg==