 Sevin Mohammadi
 Audrey Olivier
 Andrew Smyth
- 1Department of Civil Engineering and Engineering Mechanics, Columbia University, New York, NY, United States
- 2Sonny Astani Department of Civil and Environmental Engineering, University of Southern California, Los Angeles, CA, United States
Emergency medical services (EMS) are a crucial component of urban safety and responsiveness, and optimizing their operations aligns with the broader goals of creating safe, resilient cities. This study focuses on improving the EMS dispatching process by leveraging urban mobility data collected by connected vehicles and simulation. EMS dispatching is inherently sequential and dynamic, where each decision impacts future resource availability. Traditional greedy approaches, which dispatch the nearest available unit without considering supply-demand dynamics in the surrounding area, can lead to suboptimal outcomes. This study introduces a penalty metric that quantifies supply-demand levels within each ambulance’s catchment zone—defined by isochrones that delineate the area the ambulance can reach within an allowable time—prior to dispatch. This metric forms the foundation of a dynamic penalty-based dispatching strategy that penalizes dispatches from high-demand, low-coverage areas for low-priority calls, ultimately conserving resources for high-priority emergencies. The heuristic method was tested simulating EMS operations in Manhattan, New York. Simulation results showed that 90% of episodes with the heuristic policy had a mean response time of less than 6 min for high-priority calls, compared to only 75% with the conventional greedy approach. This paper presents a proof-of-concept study that introduces a novel ambulance dispatching policy and contributes to the optimization of emergency response systems in urban environments. Additionally, this study demonstrates how smart technologies and large-scale mobility data can enhance decision-making support tools, improving EMS efficiency and resource utilization and aligning with sustainability goals.
1 Introduction
Emergency medical services (EMS) are a critical component of urban safety and responsiveness. Optimizing their operations to ensure efficient responses and smart resource utilization for high-priority emergencies supports the broader goals of creating safe, sustainable, and resilient cities. In the realm of emergency management and service delivery, the concept of dispatching plays a pivotal role in ensuring the timely and effective allocation of resources to needs. In sustainable cities, efficient dispatching and matching optimizes resource use, reduces carbon emission, and ensures the community safety and healthcare by timely responding to the emergencies (Yoon and Albert, 2021; Li et al., 2024b; Meshkani and Farooq, 2022; Li W. et al., 2024; Rautenstrauss et al., 2023; Jagtenberg et al., 2017; Olivier et al., 2022). Dispatching, at its core, involves the process of efficiently sending out personnel or vehicles in response to specific requests or incidents, such as emergency calls, delivery orders, or transportation requests. The decision-making process involved in dispatching is inherently sequential and dynamic. Each dispatching decision not only addresses an immediate need but also influences subsequent decisions and the availability of resources in the future. This interconnectedness underscores the necessity of adopting a strategic approach to decision-making, where the implications of each action are carefully considered in light of their impact on the system’s state and in turn the system’s ability to respond in a timely manner to upcoming tasks. The importance of timely response becomes even more critical in the context of emergency medical services (EMS). Here, the primary goal extends beyond efficiency and resource utilization to encompass the health and survival of patients. An optimal EMS dispatching policy aims to minimize response times and ensures that the right resources are available at the right time, thereby significantly improving patient care outcomes and the overall effectiveness of the emergency response system.
The most common and practical dispatching rule follows a greedy policy that dispatches the closest appropriate idle service to the request. However, studies on dispatching, such as those conducted on ride-hailing platforms, have shown that this greedy policy tends to be myopic and suboptimal (Yan et al., 2020; Özkan and Ward, 2020; Qin et al., 2020). Therefore, a forward-looking policy that considers the longer-term impact of the current matching decisions is likely to perform better than the greedy policy, since the current dispatch decision affects the availability and distribution of the resources in the future (Özkan and Ward, 2020).
In the ride-hailing platform the optimization objective of the system encompasses maximizing the drivers income and minimizing the passengers pick up time. In the case of dispatching electrified vehicles to mitigate the carbon emissions, charging and battery swapping demands (Sayarshad et al., 2020; Sheng et al., 2023), as well as range limit (Li X. et al., 2024) are also incorporated into the efficient dispatching objective. In general, the forward looking policy in ride-hailing platform differs from the emergency unit dispatching in which the main contributing factor to the optimization objective is either minimizing the incident response time or possibly more importantly minimizing the fraction of late responses for severe incidents. On the other hand, in the ride-hailing system, the policy aims to balance passenger pick-up time and drivers’ earnings through future matches which typically differs from the foremost objective of an emergency response system.
From the perspective of ambulance dispatching, sending the appropriate closest idle unit without carefully analyzing the supply and demand level in the unit’s catchment area may be a suboptimal decision. To explain further, consider a scenario where for the received call, multiple ambulances can reach the incident location within a certain acceptable time. Among those, the closest one may be covering an area with a higher rate of incident calls, increasing the likelihood that this unit will be needed shortly for a high-priority call thereafter. Moreover, this unit’s catchment region may have overall a limited coverage in terms of available units nearby. Therefore, it might not be a good decision to deploy this ambulance for the less severe incident call based solely on its shortest travel time to the incident location. Instead, it could be more effective to utilize slightly farther unit in moderate situations if the call priority is perceived as low, reserving the closest ambulance for potential high-priority calls in near-future. Therefore, sending a nearby ambulance to attend to a lower priority patient could potentially result in those ambulances being unavailable for future urgent calls in the vicinity (Sudtachat et al., 2014).
This study aims to develop a new metric that quantifies the supply and demand level of each emergency unit’s catchment zone. When combined with travel time metric, this approach enables more informed dispatch decisions, thereby improving response times for both the current and future emergencies. This proactive approach ensures better availability of ambulances for subsequent high-priority calls. Our approach involves constructing an end-to-end discrete event simulation model designed to replicate the dynamics of EMS operations under various dispatching policies. The temporal dependency of the dispatching decisions suggests modeling the response process as a Markov decision process (MDP), which effectively models the sequential decision-making that aims to optimize a long-term objective (Xu et al., 2018). Thus, a reinforcement learning (RL) agent is trained within a small scale synthesized simulation environment seeking the potential optimal policy to demonstrate the myopic nature of the greedy policy. Next, a heuristic-based dispatching policy using the proposed metric is designed to approximate the optimal policy and its effectiveness is evaluated for large-scale synthesized simulation environment. The need for this model arises from the complexity and scale of real-world scenarios, which often exceed the processing capabilities required to train an optimal RL agent. By simplifying the decision-making process, the heuristic model enhances scalability and practicality for a large-scale applications, providing a more feasible approach to managing the dynamic demands of such environments. Therefore, the primary contribution of this paper is the introduction of a novel decision-making criterion for emergency unit dispatching that strikes a balance between practicality and optimality. Unlike the simple but myopic greedy policy, the proposed heuristic-based approach offers a scalable solution that effectively addresses the complexity of real-world medical emergency scenarios. In contrast to the computationally intensive process of training a reinforcement learning agent or the complex dispatching algorithms used in ride-hailing services, this heuristic model offers an enhanced yet practical alternative for large-scale applications, meeting the EMS need for tools that are both transparent and computationally accessible. In contrast to MDP-based and deep reinforcement learning approaches, our method avoids the need to train large policy tables or deep neural networks for policy approximation, and it does not involve solving complex value functions or performing computationally intensive iterative updates at runtime. Instead, it relies on an interpretable penalty metric that can be evaluated in real time with minimal computational overhead.
2 Related work
Optimizing EMS emergency response involves addressing multiple operational dimensions, such as the strategic positioning of ambulances, dynamic strategies for their relocation or redeployment, and the development of optimal dispatching policies. Key studies in these areas include works on ambulance positioning (Bertsimas and Ng, 2019; Lanzarone et al., 2018; Comi et al., 2018), dynamic redeployment (Maxwell et al., 2010; Sudtachat et al., 2016), and dispatching policies (Haghani et al., 2004; Schmid, 2012; Jagtenberg et al., 2017; Yoon and Albert, 2021). Although dynamic relocation is a major focus in most research, its implementation becomes increasingly complex and potentially confusing as the number of units and the complexity of the environment grow (Haghani et al., 2004; Andersson and Värbrand, 2007). Consequently, some studies concentrate on refining dispatching policies. The discussion around the use of a greedy dispatching policy—the approach of sending the appropriate closest idle unit to address a request—has been ongoing in both ride-hailing order dispatching and EMS unit dispatching. References such as Qin et al. (2020) and Azagirre et al. (2024) for ride-hailing and a range of studies for EMS such as Carter et al. (1972), Andersson and Värbrand (2007), Lee (2011), Jagtenberg et al. (2017), and Carvalho et al. (2020) have highlighted that despite its practicality and simplicity, the greedy policy can be myopic. While it might offer a straightforward solution, especially in the context of EMS where rapid response is critical, this policy does not necessarily ensure long-term system-level optimality.
An alternative strategy involves choosing an ambulance for dispatch based on the shortest travel time with less reduction in the system’s readiness to handle subsequent emergency calls. Andersson and Värbrand (2007), Lee (2017), and Carvalho et al. (2020) explore various models to quantify and optimize this readiness through so-called preparedness metric. Andersson and Värbrand (2007) introduced a measure of preparedness as an indicator of the EMS system’s capability to respond to both current and future calls. They developed a mathematical model for assessing zone-level preparedness, which calculates the sum of each ambulance’s contribution to the preparedness of its subzone. This contribution is weighted by the inverse of the ambulance’s travel time to the subzone and further adjusted by the call rate or population of the subzone. Lee (2017) proposed a model that calculates preparedness factoring in that ambulance engaged with a call. Then, preparedness is inversely proportional to the sum of the shortest reach time of each subzone by an available ambulance, adjusted by the call rate of that subzone. The dispatch decision prioritizes the ambulance whose deployment maximizes the ratio of weighted preparedness to its travel time to the subzone. Carvalho et al. (2020) expanded on this metric by integrating a temporal aspect, allowing both the call rate and travel times to vary over time. An alternative approach involves dispatching an ambulance that offers the least marginal coverage to the region, as discussed by Jagtenberg et al. (2017). They calculate the marginal coverage for each idle ambulance through the dynamic Maximum Expected Covering Location Problem (MEXCLP), a method also explored by Daskin (1983) and Jagtenberg et al. (2015). In the field of ambulance location, coverage is defined as the measure indicating the proportion of calls an ambulance can respond to within a specific response time threshold, and covering models aim to optimally position ambulances to maintain the system’s coverage level. Yoon and Albert (2021) applied this concept of coverage in their dynamic dispatching policy by incorporating the probability that a call of a particular type can be reached by a certain unit type within the response time threshold into the reward function of MDP model. This probability is calculated using the coverage function, specifically the Maximal Covering Location Problem with Probabilistic Response Time (MCLP + PR), as detailed by Erkut et al. (2009).
Common approaches for deriving optimal dispatching policies include using Markov Decision Process (MDP) simulations (McLay and Mayorga, 2013; Jagtenberg et al., 2015; Yoon and Albert, 2021), constrained MDP employed by Albert (2023) to account for a priority list in obtaining more intuitive optimal restricted dispatching policies, employing reinforcement learning techniques (Liu et al., 2020; Hua and Zaman, 2022), applying approximate dynamic programming (Albert, 2023; Schmid, 2012) and heuristics-based policies proposed by several studies, including Bandara et al. (2014), Yoon and Albert (2021), and Jagtenberg et al. (2015). Table 1 classifies the reviewed dispatch policies based on the policy derivation approach.
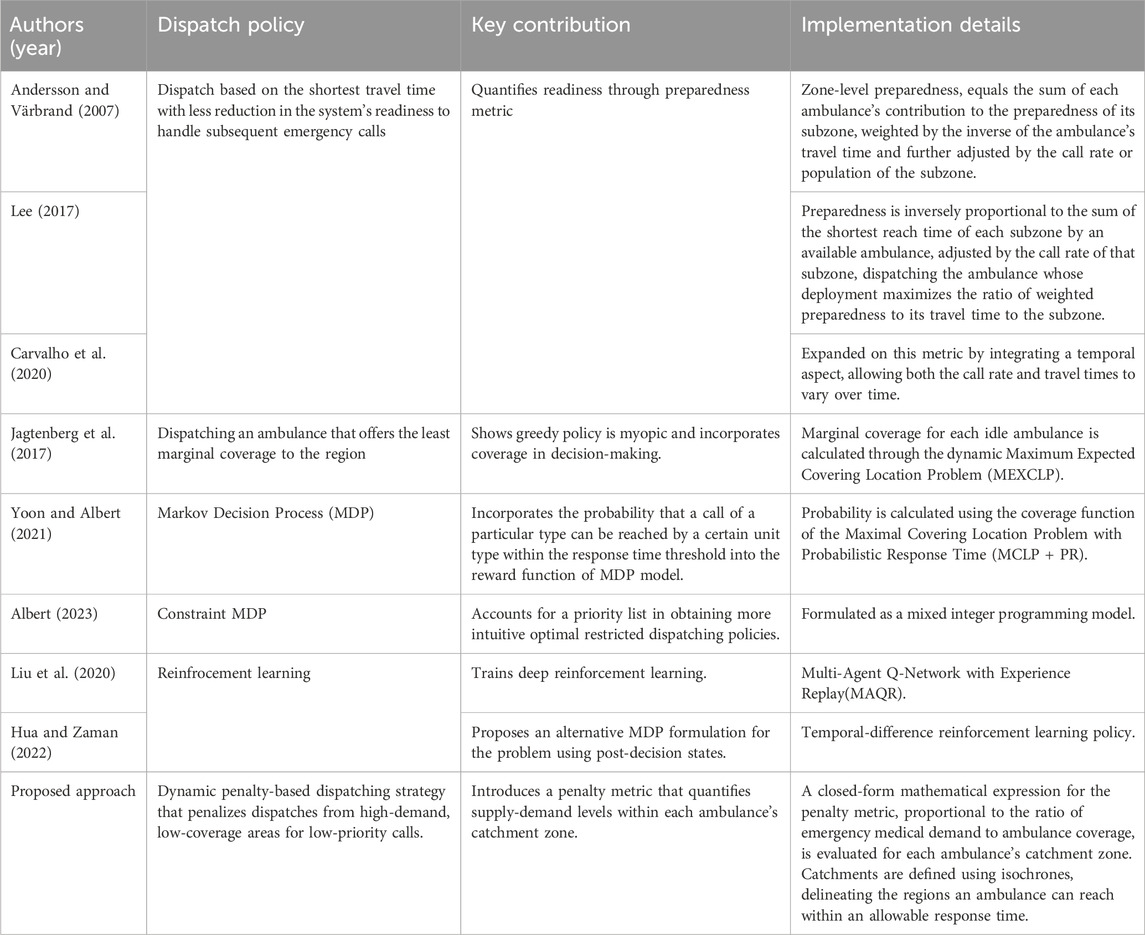
Table 1. Summary of ambulance dispatching policies.
Several studies, including those by McLay and Mayorga (2013), Bandara et al. (2014), Sudtachat et al. (2014), Yoon and Albert (2021), and Albert (2023) take into account the call priority, distinguishing between high and low severity levels in their modeling. Additionally, these studies consider the type of ambulance dispatched—either Basic Life Support (BLS) or Advanced Life Support (ALS)—based on the severity of the call, as discussed by Yoon and Albert (2021) and Sudtachat et al. (2014). Call priority which is perceived upon call arrival is typically classified to different levels based on call severity or risk (McLay and Mayorga, 2013; Bandara et al., 2014; Sudtachat et al., 2014; Yoon and Albert, 2021) from most severe to the least severe incidents. Recently, Rautenstrauss et al. (2023) modeled dispatching accounting for the ambulance split using Hypercube queuing model. Ambulance split which means designating ambulances to certain patient categories such as suspected or known cases is shown to be practical to restrict the risk of infection of EMS response personnel during a pandemic (Chow-In Ko et al., 2004; Rautenstrauss et al., 2023). Many dispatch policies offer a prioritized list of ambulances for incident response. However, due to the dynamic nature of the environment—such as fluctuating availability and locations of idle ambulances—relying exclusively on these predefined lists can be inadequate. As environmental conditions change, dispatch strategies must adapt in real-time to ensure efficient response times. Rather than using a static priority list, this study introduces a real-time decision making criterion with a closed-form mathematical expression to respond based on dynamic state of the system as incident calls come in. This new criterion incorporates the varying levels of ambulance coverage and the demand conditions within each candidate ambulance’s catchment area, ensuring that resource allocation dynamically adapts to changes in the environment.
3 Methodology
This section outlines the modeling framework for the proposed ambulance dispatch policy. We begin by deriving a mathematical formulation for the penalty metric, which quantifies ambulance supply relative to emergency call demand within each unit’s catchment zone. This metric captures spatial variability in both demand and resource availability, offering a more informed basis for dispatch decisions beyond the conventional nearest-unit (greedy) policy. To illustrate the myopic nature of the nearest-unit approach, we formulate the dispatching problem as a Markov Decision Process (MDP), embedding the penalty metric into the reward function to enable reinforcement learning-based policy development in a synthetic environment. We then introduce a heuristic-based dispatching strategy that leverages the penalty metric as a feasible alternative to RL-based optimization in the large city-scale simulation. Finally, we present the Discrete Event Simulation (DES) framework used to model EMS system dynamics, evaluate the proposed policies under realistic operational scenarios, and assess their effectiveness in improving dispatch outcomes.
3.1 Proposed penalty metric
We aim to explore the potential sub-optimality of a greedy policy that involves dispatching the closest idle emergency unit by conceptualizing an example scenario. Consider a simplified example depicted in Figure 1a. Suppose, the red star marks the location of a patient, while the positions of three nearby idle ambulances,
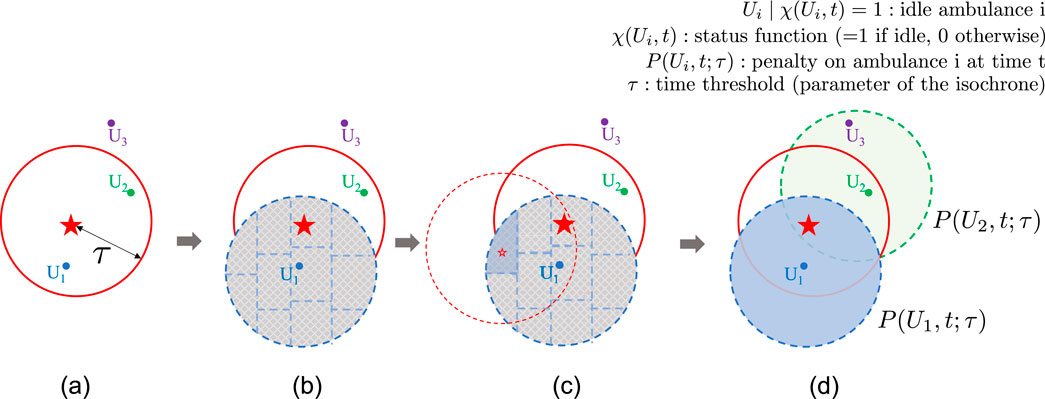
Figure 1. Conceptual framework for penalty calculation based on the analysis of demand and coverage within ambulance 1’s catchment zone. (a) Blue, green, and purple points mark three ambulances’ locations. Red filled star marks patient location. Red circle is the isochrone centered at the patient’s location to mask the ambulances that can reach the patient in less than a certain time τ. (b) The Blue dashed circle shows the ambulance 1 (U1) catchment area and dashed blue lines divide each zone into sub-zones. (c) Unfilled red stars denote the center of the sub-zone, and dashed red circle represents its corresponding isochrone used to count idle ambulances that can reach each sub-zone center within time τ. (d) Calculated penalties for candidate ambulances based on the quantified supply and demand in their respective catchment zones, highlighted in blue for U1 and green for U2. (A similar procedure is applied to calculate the penalty for ambulance U2.).
Ultimately, to account for such scenarios, a new penalty metric is designed, proportional to the demand-to-coverage ratio, which captures the demand and coverage levels within each candidate ambulance’s catchment area. This metric is then used as a penalty on the ambulance to guide the dispatching choice effectively. The mathematical model of the proposed penalty metric is detailed in Equations 1–3.
where
3.2 MDP model description
The EMS systems are typically organized around a central control hub that oversees decision-making and operational activities. The primary goal is to ensure rapid response to calls while also optimizing resources to enhance long-term response efficiency. Consequently, using a Markov Decision Process (MDP) framework is effective for modeling the decision processes in the EMS response system, as it focuses on optimizing long-term outcomes. In this study, we train a centralized reinforcement learning (RL) agent, specifically a Q-learning agent, to develop a potential optimal dispatching policy. Q-learning is a model-free RL algorithm that learns the value of taking specific actions in given states to maximize cumulative rewards. This RL agent observes the state of the environment, analyzes requests, and makes dispatching decisions that transition the environment to a new state and receives rewards. Under certain conditions such as enough exploration of every discrete state-action pair, Q-learning is guaranteed to converge to the optimal policy (Watkins and Dayan, 1992). Specifically, Q-learning converges to the optimal action-value function if all state-action pairs are visited infinitely often and the learning rate decays appropriately over time. Typically, EMS optimization models aim to reduce the average response time or the fraction of late responses. Hence, the reward function can incorporate either the immediate response time or an indicator of whether the response time exceeds a specified acceptable threshold.
Next, we detail the component of MDP modeling utilized for the optimization of the unit dispatching policy including the state representation, action space, and the reward function.
The state of the environment at any time step
The action at time
For simplification, we assume that the system operates within a stationary environment, meaning the rate of emergency call arrivals remains constant over time. Consequently, the Markov Decision Process (MDP) used in this study is formulated for an infinite time horizon, and continuous time is discretized into small intervals, specifically, one time unit in our case. Therefore, state transitions can occur at each time unit. For example, if action
where
3.3 Heuristic-based dispatching policy
Q-learning can converge to the optimal policy (Watkins and Dayan, 1992), making it effective for demonstrating the potential sub-optimality of the greedy policy in smaller-scale problems. However, it is not suitable for larger scales due to the complexity and computational demands of real-world scenarios. This complexity often surpasses the processing capabilities required to train an optimal RL agent. Therefore, a heuristic model with new decision making criterion is designed to simplify the decision-making process and enhance the scalability and practicality for large-scale applications while managing the dynamic demands of such environments. In this new criterion, the decision on which ambulance to dispatch is based on a compromise between minimizing travel time and choosing the ambulance with the lowest penalty as shown in Equation 7.
where
3.4 Discrete event simulation
In order to validate the effectiveness of the proposed penalty metric in guiding the ambulance dispatch policy toward the optimal policy, an end-to-end discrete event simulation (DES) model is built to synthetically model the operation of EMS response system. DES allows decision-makers to experiment with changes in system configurations, resource allocations, or operational policies to observe potential impacts on system performance without disrupting the real system (Golazad et al., 2024). The typical workflow of a DES model starts with the initialization of the system state, followed by the sequential processing of events, and the consequent updating of the system state after each event. The simulation runs until a specified end condition is met. In the discrete event simulation model, an incident generator simulates the emergency calls across various locations using a Poisson distribution, with the rate of incidents varying spatially. Such spatial variation can arise due to varying regional vulnerability influenced by factors such as non-uniform population densities, demographic distributions, or disparities in urban infrastructure across different areas (Bittencourt et al., 2024). Following the arrival of an incident call, a corresponding patient object is created within the simulation. This object stores essential details about the patient, such as their location, the time of the call, the time when an emergency unit is assigned, the time the ambulance arrives at the patient’s location, and, if necessary, information pertaining to hospital care and other related aspects. Additionally, an ambulance object is created for each ambulance, encapsulating features such as its base location, current location (which is updated at each simulation time step while the ambulance is in motion), and timestamps for key discrete events. These events include the trip’s start time when the ambulance is assigned to a call, as well as the times the ambulance arrives at and departs from both the scene and the hospital. The simulation model incorporates a road network graph constructor that replicates the geographical layout of the road network and locations within the simulation environment. Using this road network graph, the travel time model identifies the shortest path between two coordinates and estimates the corresponding travel time. At each decision point for ambulance selection, the penalty module is invoked to calculate penalties for idle ambulances within the reach of the incident, as determined by the isochrones. These penalties are based on the current state of the environment and the characteristics of each ambulance’s catchment area. The penalty module utilizes the constructed road network graph to define both the ambulances’ catchment zones and the incident’s reach zone by generating the isochrones. The sequence of time points and ambulance location updates in the discrete event simulation is schematically illustrated in the Figures 2a,b, respectively. Figure 2a outlines the chronological progress of events, showcasing the flow from incident call arrival through ambulance dispatch, patient care, and if necessary, hospital transfer. It also highlights the cycle through which an ambulance becomes idle and ready for a new dispatch. This availability occurs immediately after finishing on-scene care at the patient’s location or following the completion of a hospital transfer, enabling the ambulance to be dispatched again even while it is en route back to its base station. The proposed heuristic-based dispatching strategy is presented in Algorithm 1 and Algorithm 2.
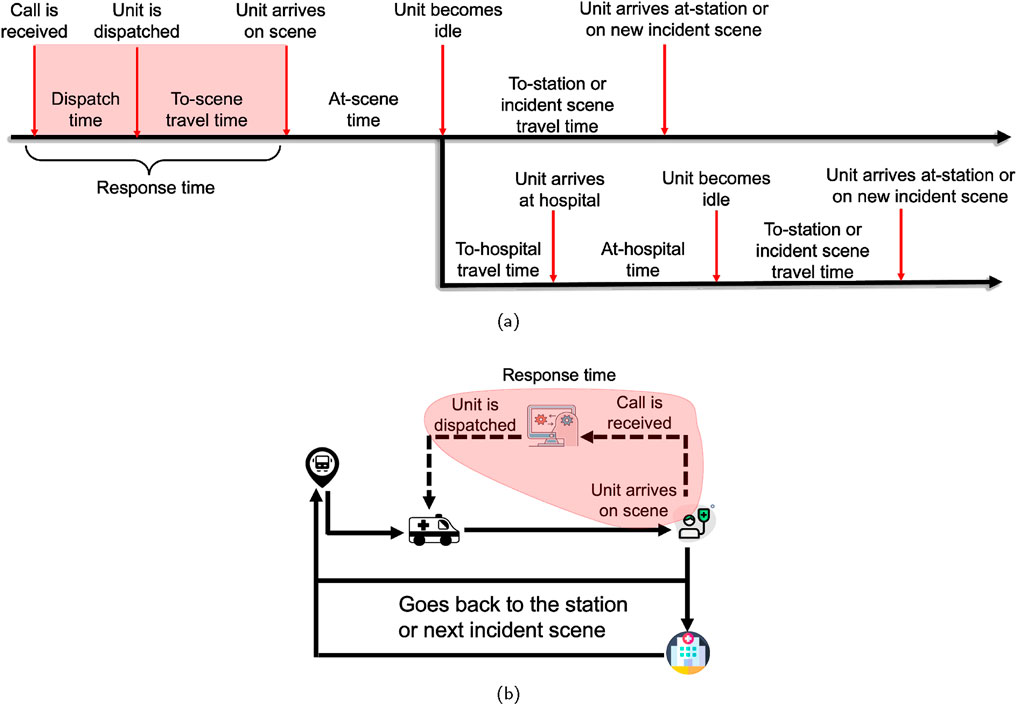
Figure 2. Snapshots of (a) time instances, and (b) location instances of the ambulance in discrete event simulation.
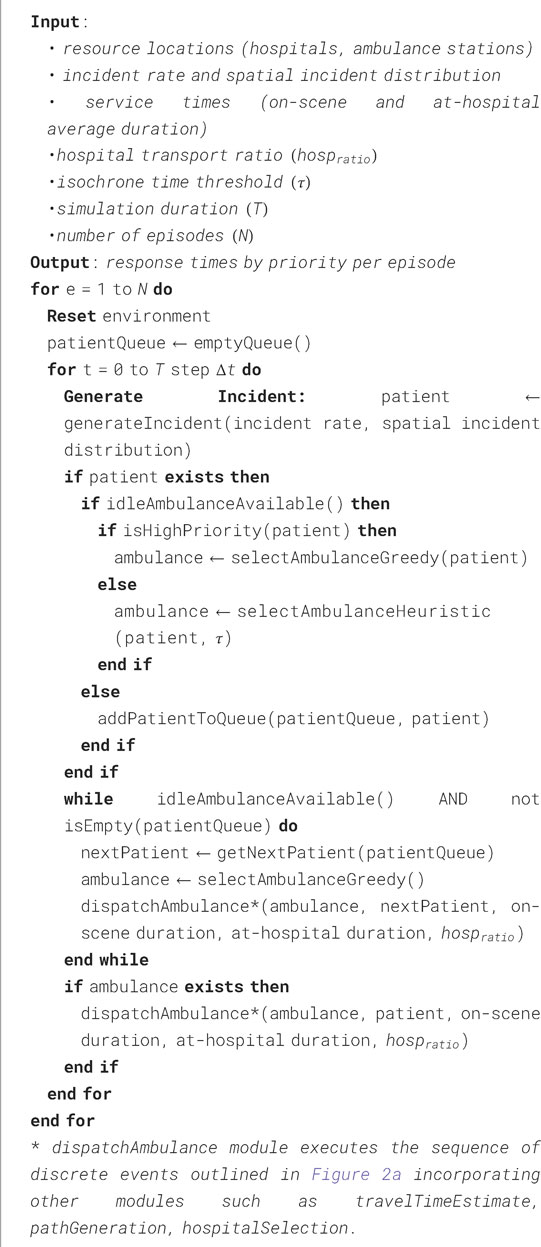
Algorithm 1.Dispatching with Heuristic Policy.
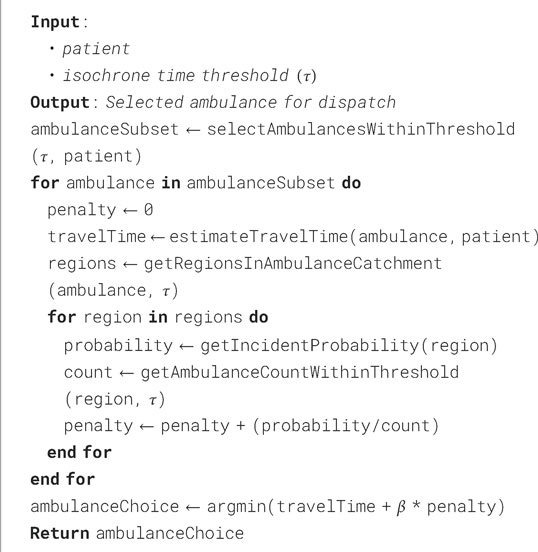
Algorithm 2.SelectAmbulanceHeuristic.
4 Simulations and results
In the following sections, two synthetic environments of different scales and configurations are designed. In the small-scale environment, three policies—greedy, Q-learning, and heuristic—are compared, while in the large-scale setting, the greedy and heuristic policies are evaluated. Finally, the proposed heuristic-based policy is applied to simulate the emergency response system in Manhattan, New York, and is compared against the greedy policy. The comparison metrics include the distribution of episode mean response times and the fraction of responses in each episode that exceed a specified threshold. This threshold, typically set by regional EMS regulatory agencies, determines whether a response is classified as late or on-time.
4.1 Simulation 1: small scale setting
The small-scale setup is strategically chosen to manage the complexity of the state-action space, which facilitates the exploration of optimal strategies through a Q-learning algorithm. In a controlled setting, this approach increases the likelihood of converging to an optimal policy. The simulation setup, depicted in Figure 3a, consists of a
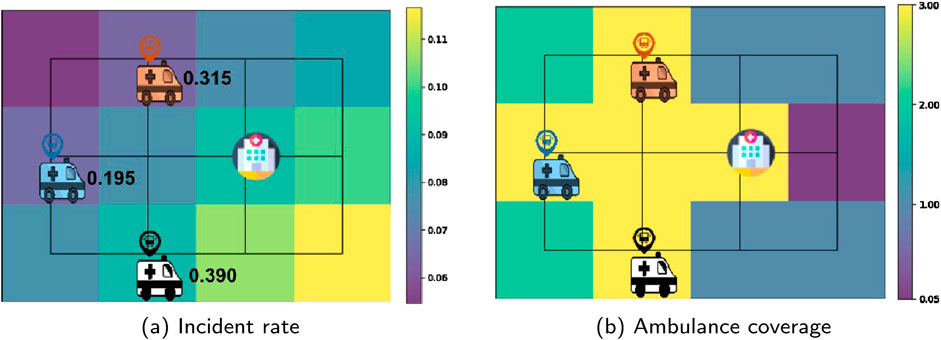
Figure 3. The locations of hospitals and ambulance bases in the Simulation 1 environment with (a) normalized incident rate distribution in the background. The values represent the ambulance penalties, calculated based on the environment reset. (b) Coverage map calculated with isochrone parameter
4.1.1 Simulation 1: penalty coefficient selection
The optimal value for the penalty coefficient,
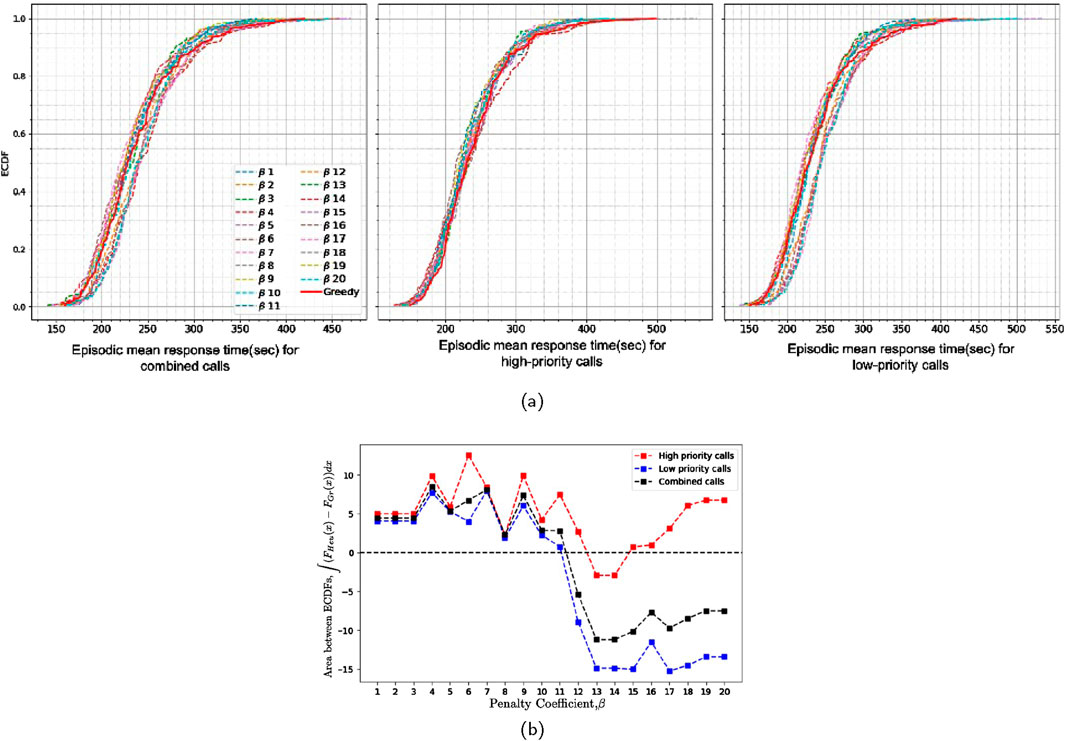
Figure 4. (a) Empirical cumulative distribution of episode means for heuristic policy conducted with varying penalty coefficients (β) and the greedy policy, and (b) area between ECDFs of episode mean response times of heuristic policy conducted with varying penalty coefficients (β) and the greedy policy in simulation 1 (200 episodes for each experiment).
4.1.2 Simulation 1: response time analysis
Figure 5 represents the flow map of responses which visualizes ambulance dispatching pattern for each dispatching policy. Each arrow represents a dispatch event, with the direction pointing from the dispatched ambulance’s location to the responded incident location. The thickness and color of the arrows indicate the frequency and volume of dispatches to various incident locations, providing a clear overview of response patterns and the distribution of ambulance activity across different areas. The contrast between the patterns underscores the differences in ambulance selection between the heuristic, Q-learning, and greedy policies. As shown in Figure 3a, the blue ambulance (located at first column second row) has the lowest penalty value, while the white ambulance (located at second column third row) has the highest. This indicates that the white ambulance is more likely to be busy due to the high incident rate and consequently high demand in the east and southeast parts of the study area. In the pattern resulting from the penalty-based policy shown by Figure 5c, it is observed that the blue ambulance is contributing to the east point incidents (5->6->7->8), a pattern weakly seen in the greedy policy (Figure 5a). Similarly, in the Q-learning policy, the orange ambulance, which has a lower penalty than the white ambulance, is more engaged with incidents on the east side compared to the greedy policy. Moreover, in Figures 5b,c which correspond to QL and heuristic policies, respectively, the northern links (e.g., 2->6) appear relatively weaker compared to the greedy policy pattern shown in Figure 5a. This indicates that the white ambulance is dispatched less frequently to incidents in the northern directions due to higher penalty value. Notably, the heuristic policy penalizes dispatching of high penalty ambulances for only low-priority calls, while for high-priority calls, the simulation adheres to the greedy choice (see the detailed penalty-based dispatching policy in Algorithm 1 and Algorithm 2). This behavior of deploying ambulances from low-demand and properly covered regions for low-priority calls is enabled by the penalty definition concept. Such behavior results in saving the response time for high-priority calls, as illustrated by the empirical cumulative distribution functions (ECDF) of episode mean response times in Figure 6a. Since these ECDFs are associated with the mean response times at each episode, to better evaluate the responses within each episode, the fraction of responses that exceed a time threshold (In this case, 4 min) is also obtained, and their ECDFs are depicted in Figure 6b. The comparison of the distributions reveals that responses to high-priority calls are improved when using both Q-learning and penalty-based policies. For instance, the greedy policy keeps the fraction of response times exceeding the 4 min threshold under 25% in only 65% of the episodes. In contrast, Q-learning or penalty-based policies achieve this in 80% of the episodes. In other words, Q-learning or penalty-based policies perform better than the greedy policy in keeping the response times below 4 min in a larger percentage of episodes.
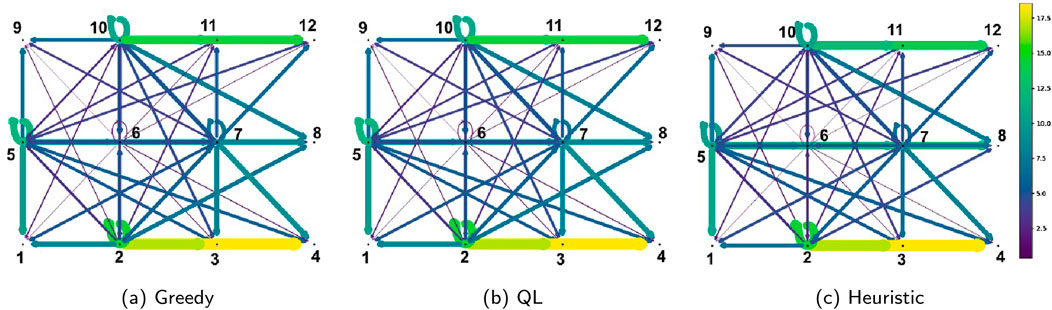
Figure 5. Response patterns for three policies in Simulation 1: (a) greedy, (b) Q-learning, and (c) heuristic (penalty-based). Based on the response pattern under the heuristic policy shown in (c), it is evident that the blue ambulance (located at point 5 with lowest penalty) is also responding to incidents at the eastern locations (points 5->6->7->8), a pattern weakly observed under the greedy policy as seen in (a).
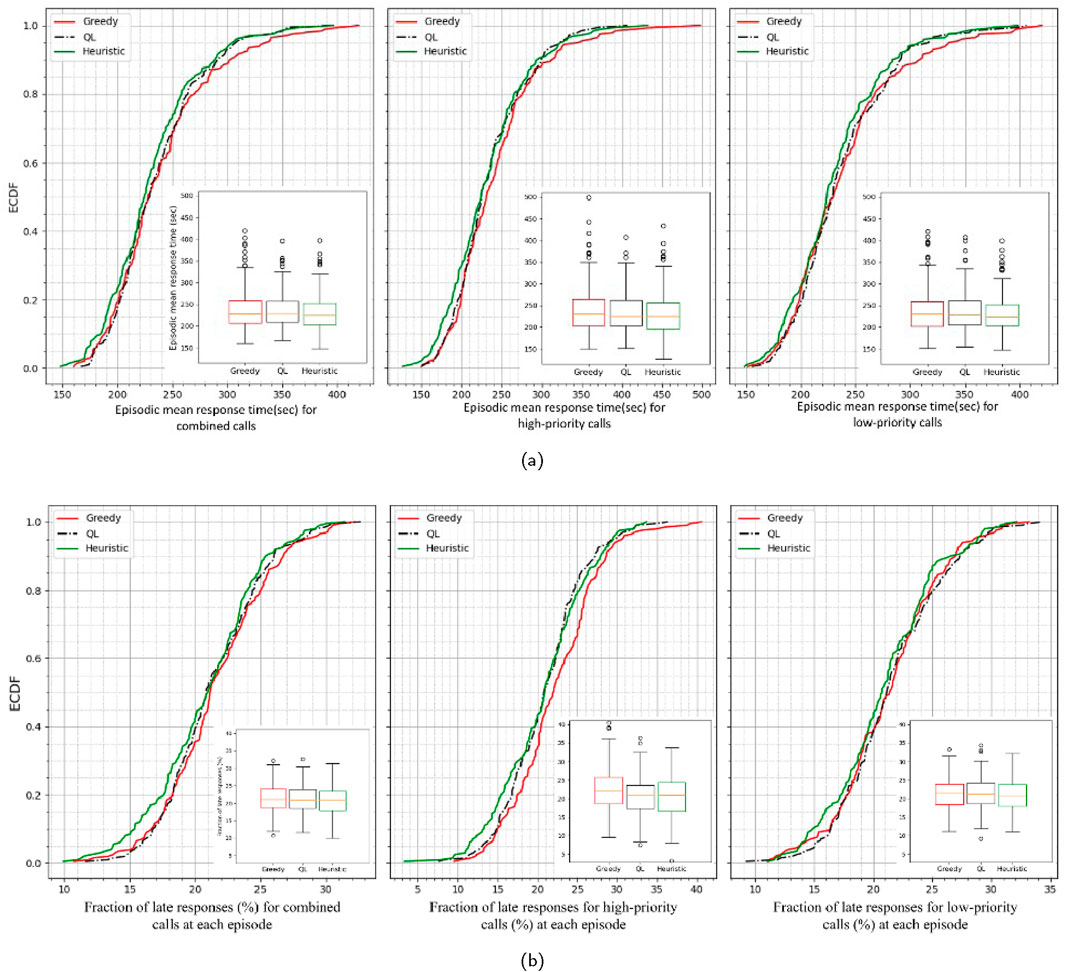
Figure 6. Empirical cumulative distribution of (a) episode means and (b) episode fractions of response times greater than time threshold (=4 min) in simulation 1 (200 episodes). The leftmost, middle, and rightmost ECDFs correspond to combined, high priority, and low priority calls, respectively. Both the greedy and optimal Q-learning policies demonstrate improvements in response times.
4.2 Simulation 2: large scale setting
In this section, the experiment region is expanded to test and evaluate the new policy against the greedy policy within a larger-scale setup. Due to relatively large state-action space and lower chance of converging to the global optimal policy, the Q-learning algorithm is not applied in this scenario. Expanding the environment size would proportionally increase the state-action space, significantly elevating the computational demands for training a Q-learning agent. The experimental setup, depicted in Figure 7a, consists of a
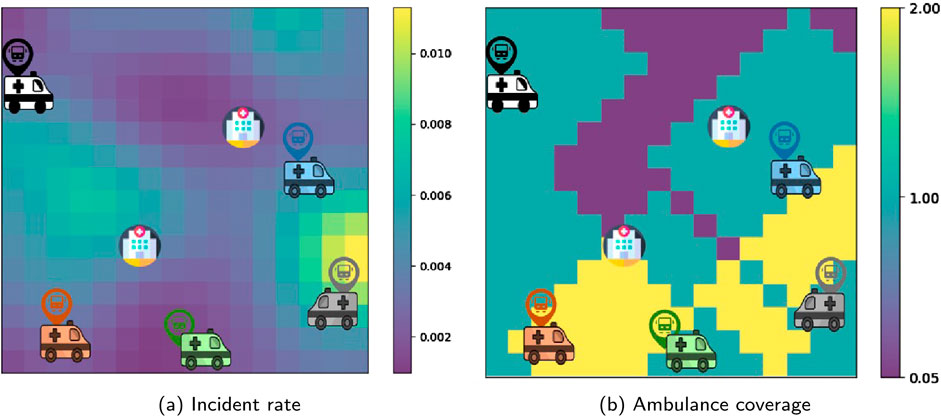
Figure 7. The locations of hospitals and ambulance bases in the Simulation 2 environment with (a) normalized incident rate distribution in the background and (b) coverage map calculated with isochrone parameter τ = 6 min at the environment reset. This is the coverage based on which penalties are calculated (denominator in Equation 1).
4.2.1 Simulation 2: penalty coefficient selection
In this simulation, the parameter
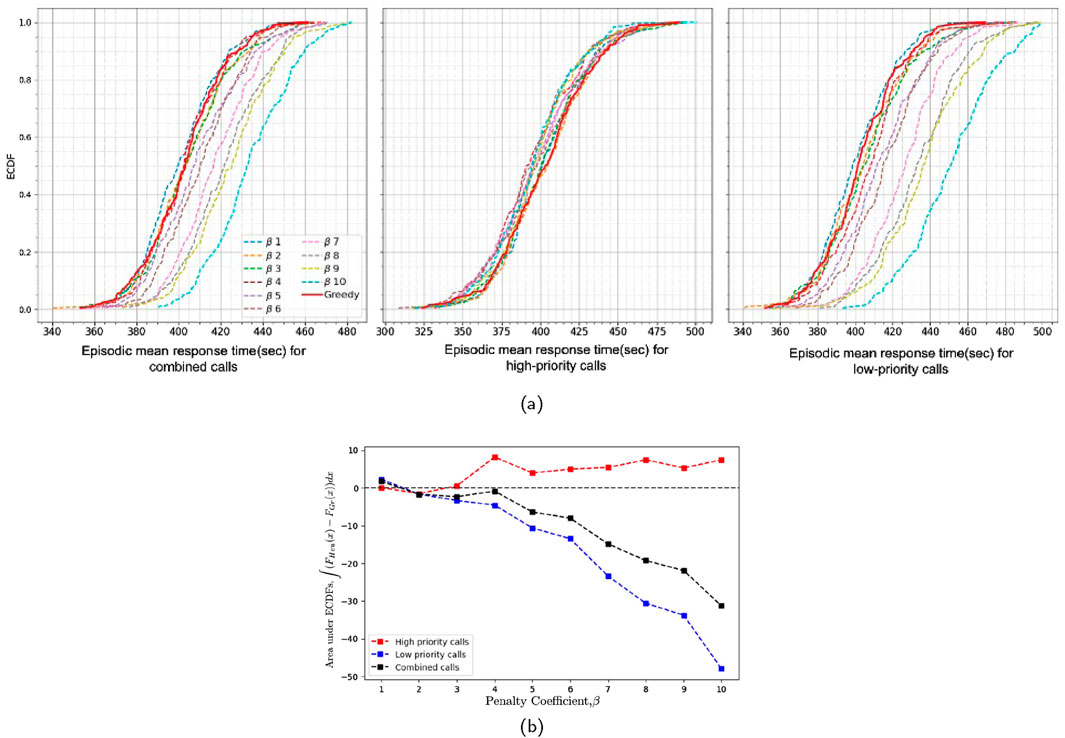
Figure 8. (a) Empirical cumulative distribution of episode means for heuristic policy conducted with varying penalty coefficients (β) and the greedy policy, and (b) the area between ECDFs of episode mean response times of heuristic policy conducted with varying penalty coefficients (β) and the greedy policy in simulation 2 (200 episodes for each experiment).
4.2.2 Simulation 2: response time analysis
Similarly, Figures 9a,b display the empirical cumulative distribution of episode means and fraction of response times exceeding a specified time threshold (assumed 8 min in this case), over 200 episodes. These figures demonstrate that the heuristic policy improves response times for high-priority calls (middle plot) but compromises response times for low-priority calls, as shown in the rightmost plots. With the heuristic policy, the ECDFs of the episode means and the fractions of response times exceeding specified time threshold for high-priority calls are consistently above those of the greedy policy across nearly the entire range of the x-axis. For example, in Figure 9b, the greedy dispatch policy maintains the fraction of late responses below 30% in only 55% of episodes, while the heuristic policy achieves this in 70% of episodes. Consequently, the two ECDFs can be similarly compared and interpreted for all other proportions of late responses. Based on the results from two experiments differing in size and resource distribution, we found that achieving improved response behavior with the penalty-based policy compared to the greedy policy requires balancing the decision criterion between proximity of the ambulances and the penalty assigned to them. This balance can be adjusted using the parameter

Figure 9. Empirical cumulative distribution of (a) episode means and (b) episode fractions of response times greater than time threshold (=8 min) (b) in simulation 2 (200 episodes). The leftmost, middle and rightmost ECDFs are associated with combined, high priority and low priority calls, respectively.
4.3 Simulation 3: emergency response in Manhattan, New York
In this section, the EMS response in the Manhattan borough of New York city is simulated using the heuristic-based ambulance dispatching policy and compared with the greedy policy. The simulation includes 100 idle units stationed at designated cross-street locations and 14 hospitals across Manhattan. The locations of these stations and hospitals are depicted in Figure 10a. Incidents are generated using Poisson distribution with the average rate across the entire region of an incident per minute. The on-scene and at-hospital durations are generated using exponential distribution with rate of 21 and 35 min, respectively. The borough is divided into regions and the incident probabilities are generated with Dirichlet distribution having incident counts for each region. These values are derived from a sample of historical incident data from the year 2019. The paths of to-incident, to-hospital and to-stations trips are assumed to be the path with the shortest travel time for which the travel times are estimated by road network analysis using speed profiles of the road segments. For the shortest-path inference, a directed graph was constructed using NetworkX (Hagberg et al., 2008) to represent the New York City road network. The graph was built using geographic base information from the Lion shapefile, which contains New York City street data and is publicly available on the New York City open data website (NYC Department of City Planning, 2025). The speed data representing mobility pattern in New York City shown in Figure 11 are obtained from telematics data collected from approximately 4,500 city-owned vehicles, and managed by the New York City Department of Citywide Administrative Services (NYC DCAS). The data were map-matched and the aggregated speed profiles of each road segment were obtained (Alrassy, 2020; Alrassy et al., 2021). The shortest path travel times for ambulances are calibrated using the regression model equation
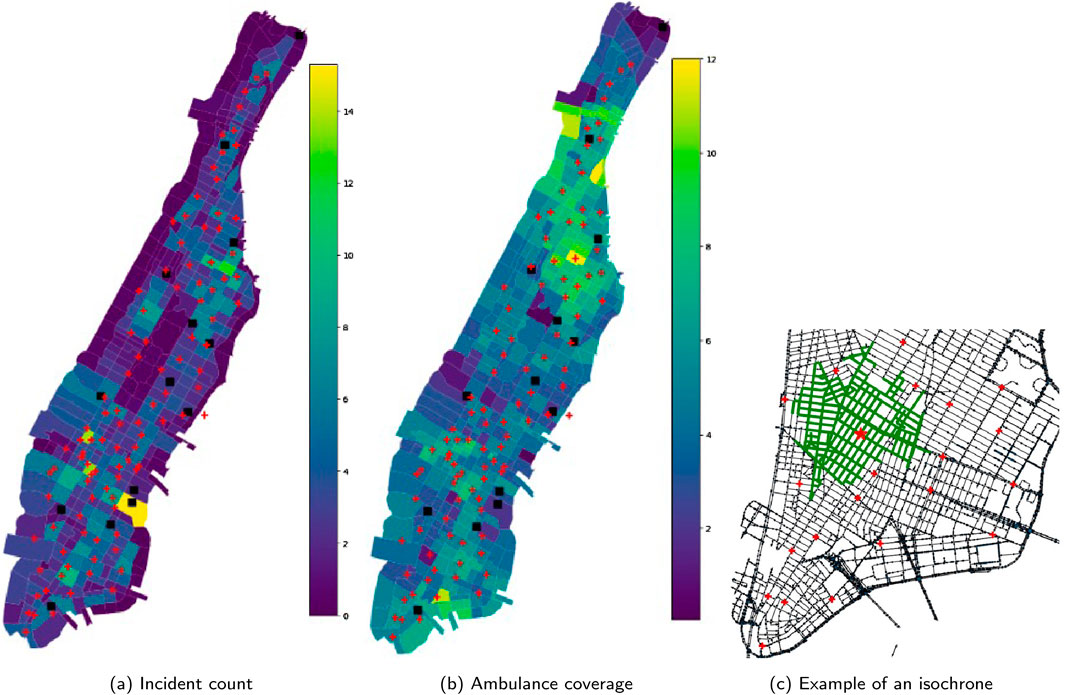
Figure 10. The locations of the EMS units stations shown by red plus signs and hospitals shown by black squares with (a) average daily incident count distribution in the background and (b) the coverage map calculated with isochrone parameter τ = 8 min at the environment reset. This is the coverage based on which penalties are calculated (denominator in Equation 1). (c) Example of an isochrone centered at the location marked with the red star.
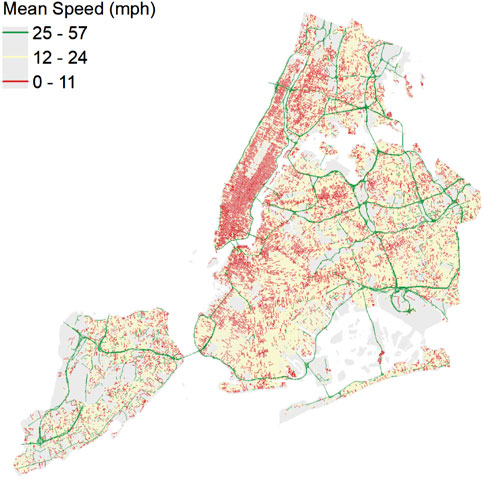
Figure 11. Traffic pattern derived by analyzing telematics data from DCAS used for estimating the travel time and trajectory, as well as to form isochr ones.
4.3.1 Simulation 3: penalty coefficient selection
In this real-scale simulation, the parameter
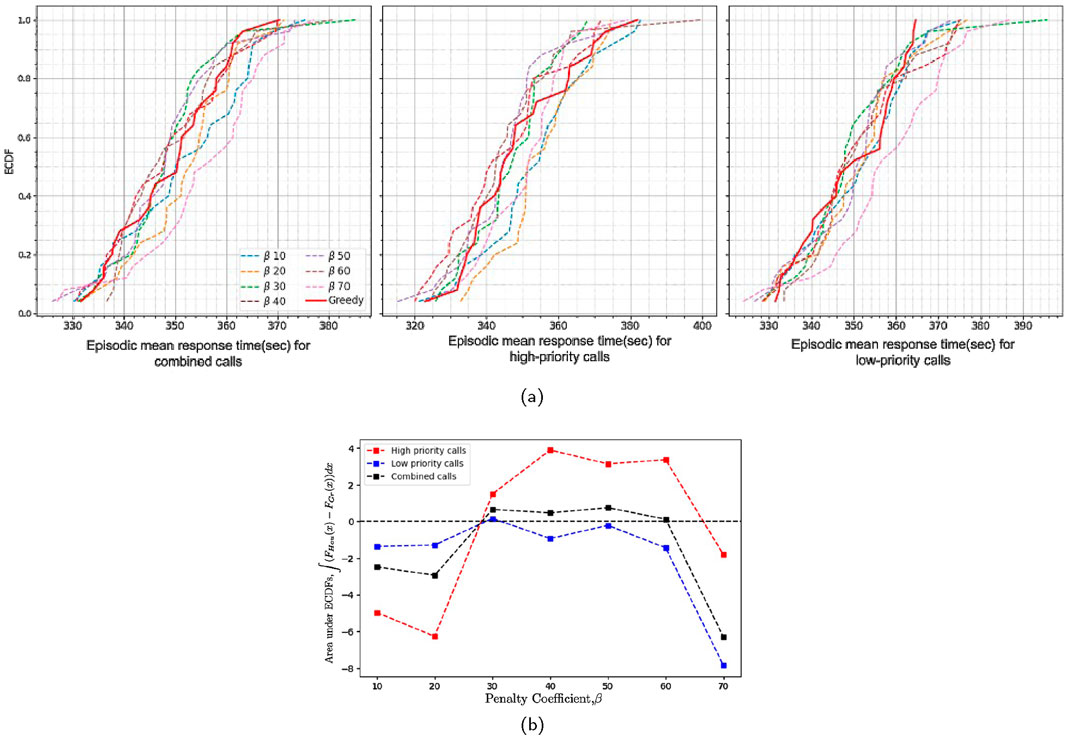
Figure 12. (a) Empirical cumulative distribution of episode means for heuristic policy conducted with varying penalty coefficients (β) and the greedy policy for combined (leftmost), high priority (middle), and low priority (rightmost) calls, and (b) the area between ECDFs of episode mean response times of heuristic policy conducted with varying penalty coefficients (β) and the greedy policy (b) in simulated emergency response in Manhattan (25 episodes for each experiment).
4.3.2 Simulation 3: response time analysis
Figure 13a displays the ECDF for the episode means of simulated response times in Manhattan over 25 episodes. The ECDF of the heuristic policy (green dashed line) generally lies above the ECDF of the greedy policy (red solid line) specifically for high priority calls. Although the greedy policy tends to offer better performance for shorter response times in low-priority calls, the heuristic policy outperforms it for longer response times in low-priority calls (right plot) and overall for high-priority calls (middle plot). Figure 13a indicates that the heuristic policy results in 90% of episodes having a mean response time of less than 6 min for high-priority calls, compared to 75% for the greedy policy. The box plots in the leftmost and middle figures suggest that heuristic method responds faster than the greedy method for high priority calls and has less variability in response times. Similarly, in the Figure 13b that presents ECDFs for episode medians of simulated emergency response times, the distribution plot for the heuristic method being higher than that of the greedy method suggests that for any target response time on the x-axis, the percentage of episodes with median response times less than or equal to that target is greater for the heuristic method. For example, 55% of the episodes have median response times less than or equal to 325 s (5.4 min) in the heuristic method which is higher compared to the greedy policy that achieves this in 40% of the episodes. Similarly, since the mean or median represents aggregate measures, analyzing the fraction of late responses, i.e., responses with time exceeding a certain threshold (here 6 min), provides additional insight into the response pattern within each episode. Figure 13c presents the ECDFs of fraction of late responses over 25 episodes for simulated emergency response in Manhattan using both greedy and heuristic policies. In this figure, for high priority calls the ECDF for the heuristic method (green dashed line) lies above the ECDF for the greedy method (red solid line). This indicates that, for any target fraction of responses taking longer than 6 min for high priority calls, a higher proportion of episodes fall below that target for the heuristic method compared to the greedy method. This means that the heuristic method is better at keeping the late fractions low. For instance, as shown in Figure 13c, in almost 75% of the episodes, the heuristic policy keeps the fraction of responses for high priority calls exceeding 6 min below 40% while the greedy policy achieves this in 65% of episodes. In conclusion, the response time analysis shows that the penalty-based policy leads to better ambulance choice decisions that particularly leads to fast response for high-priority calls, compared to the greedy policy in this simulation.
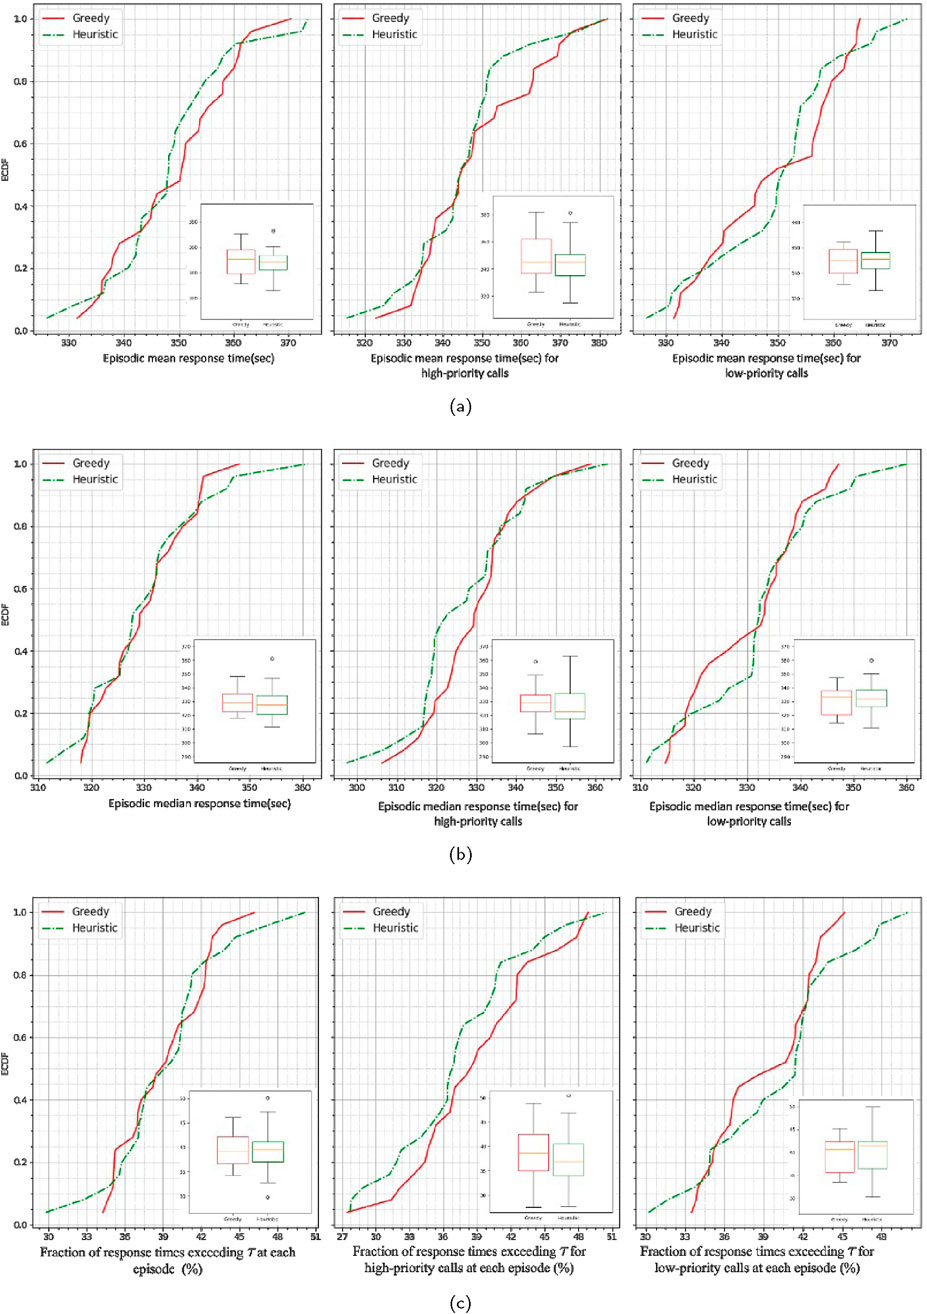
Figure 13. Empirical cumulative distribution of (a) episode means, (b) episode medians, and (c) episode fractions of response times greater than threshold 6 min (c) for combined (leftmost), high priority (middle), and low priority (rightmost) calls in simulated emergency response in Manhattan (25 episodes).
5 Conclusion
In ambulance dispatching, selecting the nearest available unit without considering the supply-demand dynamics in its catchment area can lead to suboptimal decisions. This issue becomes apparent when, among several ambulances capable of reaching an incident within an acceptable time, the nearest one covers a region with a high call rate and limited nearby unit availability. Dispatching this ambulance based solely on proximity can compromise resource availability in that area, especially for future high-priority calls. This study introduces a penalty metric that quantifies the supply-demand levels within each ambulance’s catchment zone before dispatching, forming the basis of a heuristic-based dispatching policy for EMS decision-making. This policy balances ambulance proximity with the dynamic supply-demand conditions in ambulance zone, as quantified by the penalty metric.
By using a discrete event simulation integrated with a Q-learning agent that incorporates both the new penalty metric and travel time into the learning process of the potential optimal dispatching policy, the EMS response in a small-scale environment was modeled as a Markov Decision Process (MDP). The resulting response behavior was then compared to the greedy policy, revealing the myopic nature of the greedy dispatching approach. In the subsequent large-scale simulation conducted with both greedy and heuristic, the response time analysis showed that the heuristic approach outperforms the greedy policy, particularly for high-priority emergencies. Unlike the computationally intensive process of training a reinforcement learning agent to find an optimal policy, the proposed heuristic model offers an improved yet practical alternative for large-scale applications. The effectiveness of the proposed dynamic-penalty based heuristic was also evaluated in a real-world urban setting. When applied to EMS response in Manhattan, New York, the heuristic policy results in 90% of episodes having a mean response time of less than 6 min for high-priority calls, compared to 75% for the greedy policy. These findings highlight the practicality and effectiveness of the heuristic approach in real-world, city-scale EMS responses, offering a more efficient and proactive solution for improving emergency response times while preserving resource availability for future high-priority calls. While finding the optimal dispatching policy is a key research focus in ride-hailing services, leading to the development of complex algorithms and frameworks, these services face less uncertainty regarding where and when vehicles will become available compared to emergency response situations, which are inherently more challenging. Moreover, ride-sharing companies are equipped with advanced computing infrastructure and data storage, enabling them to run sophisticated real-time optimization schemes. In contrast, EMS requires more transparent yet computationally accessible tools, such as the heuristics proposed in this paper. It is important to clarify that the findings of this study aim to provide insights into emergency response optimization, not to recommend an immediate shift to the new policy. This work is primarily for study purposes, aiming to contribute to the broader understanding of emergency response systems and their optimization.
This paper presents a proof-of-concept study aiming at developing a novel ambulance dispatching policy in response to emergency calls that incorporates penalties imposed on ambulances while balancing proximity and penalties in dispatch decision making. Even though the effectiveness of this policy was evaluated through conducting different simulations, further improvements are required. For instance one limitation of this study, and a recommendation for future research, is the incorporation of time evolution in simulation. This includes accounting for the temporal variation in incident calls and traffic fluctuations in a day and day of weeks which can significantly affect pathfinding and travel time estimation. Additionally, from an operational perspective, various factors should be considered in a comprehensive end-to-end simulation. These factors include ambulance types, such as Advanced Life Support (ALS) and Basic Life Support (BLS), and more detailed incident severity segmentation. In reality, severity often involves multiple classes rather than the binary classification (high or low priority) used in this study. Addressing these aspects would be a valuable future direction following this proof-of-concept work.
Data availability statement
The data analyzed in this study is subject to the following licenses/restrictions: The data that has been used is confidential. Requests to access these datasets should be directed to Andrew W. Smyth, YXdzMTZAY29sdW1iaWEuZWR1.
Author contributions
SM: Conceptualization, Data curation, Formal Analysis, Investigation, Methodology, Software, Validation, Visualization, Writing – original draft, Writing – review and editing. AO: Conceptualization, Supervision, Writing – review and editing. AS: Conceptualization, Funding acquisition, Project administration, Resources, Supervision, Writing – review and editing.
Funding
The author(s) declare that financial support was received for the research and/or publication of this article. This work was supported by the National Science Foundation (NSF) and Center for Smart Streetscapes (CS3) under NSF Cooperative Agreement No. EEC-2133516.
Conflict of interest
The authors declare that the research was conducted in the absence of any commercial or financial relationships that could be construed as a potential conflict of interest.
Generative AI statement
The author(s) declare that no Generative AI was used in the creation of this manuscript.
Publisher’s note
All claims expressed in this article are solely those of the authors and do not necessarily represent those of their affiliated organizations, or those of the publisher, the editors and the reviewers. Any product that may be evaluated in this article, or claim that may be made by its manufacturer, is not guaranteed or endorsed by the publisher.
References
Albert, L. A. (2023). A mixed-integer programming model for identifying intuitive ambulance dispatching policies. J. Operational Res. Soc. 74, 2300–2311. doi:10.1080/01605682.2022.2139646
Alrassy, P. (2020). Map data integration technique with large-scale fleet telematics data as road safety surrogate measures in the New York metropolitan area. Columbia University.
Alrassy, P., Jang, J., and Smyth, A. W. (2021). Obd-data-assisted cost-based map-matching algorithm for low-sampled telematics data in urban environments. IEEE Trans. Intelligent Transp. Syst. 23, 12094–12107. doi:10.1109/tits.2021.3109851
Amaran, S., Sahinidis, N. V., Sharda, B., and Bury, S. J. (2016). Simulation optimization: a review of algorithms and applications. Ann. Operations Res. 240, 351–380. doi:10.1007/s10479-015-2019-x
Andersson, T., and Värbrand, P. (2007). Decision support tools for ambulance dispatch and relocation. J. Operational Res. Soc. 58, 195–201. doi:10.1057/palgrave.jors.2602174
Azagirre, X., Balwally, A., Candeli, G., Chamandy, N., Han, B., King, A., et al. (2024). A better match for drivers and riders: reinforcement learning at lyft. Inf. J. Appl. Anal. 54, 71–83. doi:10.1287/inte.2023.0083
Bandara, D., Mayorga, M. E., and McLay, L. A. (2014). Priority dispatching strategies for ems systems. J. Operational Res. Soc. 65, 572–587. doi:10.1057/jors.2013.95
Bertsimas, D., and Ng, Y. (2019). Robust and stochastic formulations for ambulance deployment and dispatch. Eur. J. Operational Res. 279, 557–571. doi:10.1016/j.ejor.2019.05.011
Bittencourt, J. C. N., Costa, D. G., Portugal, P., and Vasques, F. (2024). A data-driven clustering approach for assessing spatiotemporal vulnerability to urban emergencies. Sustain. Cities Soc. 108, 105477. doi:10.1016/j.scs.2024.105477
Carter, G. M., Chaiken, J. M., and Ignall, E. (1972). Response areas for two emergency units. Operations Res. 20, 571–594. doi:10.1287/opre.20.3.571
Carvalho, A., Captivo, M., and Marques, I. (2020). Integrating the ambulance dispatching and relocation problems to maximize system’s preparedness. Eur. J. Operational Res. 283, 1064–1080. doi:10.1016/j.ejor.2019.11.056
Chow-In Ko, P., Chen, W. J., Huei-Ming Ma, M., Chiang, W. C., Su, C. P., Huang, C. H., et al. (2004). Emergency medical services utilization during an outbreak of severe acute respiratory syndrome (sars) and the incidence of sars-associated coronavirus infection among emergency medical technicians. Acad. Emerg. Med. 11, 903–911. doi:10.1111/j.1553-2712.2004.tb00780.x
Comi, A., Persia, L., Nuzzolo, A., and Polimeni, A. (2018). “Exploring temporal and spatial structure of urban road accidents: some empirical evidences from rome,” in Conference on sustainable urban mobility (Springer), 147–155.
Daskin, M. S. (1983). A maximum expected covering location model: formulation, properties and heuristic solution. Transp. Sci. 17, 48–70. doi:10.1287/trsc.17.1.48
Erkut, E., Ingolfsson, A., Sim, T., and Erdoğan, G. (2009). Computational comparison of five maximal covering models for locating ambulances. Geogr. Anal. 41, 43–65. doi:10.1111/j.1538-4632.2009.00747.x
Golazad, S., Heravi, G., AminShokravi, A., and Mohammadi, A. (2024). Integrating gis, agent-based, and discrete event simulation to evaluate patient distribution policies for enhancing urban healthcare access network resilience. Sustain. Cities Soc. 111, 105559. doi:10.1016/j.scs.2024.105559
Hagberg, A., Swart, P., and S Chult, D. (2008). Exploring network structure, dynamics, and function using NetworkX. Los Alamos, NM (United States): Los Alamos National Lab.LANL. Technical Report.
Haghani, A., Tian, Q., and Hu, H. (2004). Simulation model for real-time emergency vehicle dispatching and routing. Transp. Res. Rec. 1882, 176–183. doi:10.3141/1882-21
Hua, C., and Zaman, T. (2022). “Optimal dispatch in emergency service system via reinforcement learning,” in AI and analytics for public health: proceedings of the 2020 INFORMS international conference on service science (Springer), 75–87.
Huang, S., and Ontañón, S. (2020). A closer look at invalid action masking in policy gradient algorithms. doi:10.48550/arXiv.2006.14171
Jagtenberg, C. J., Bhulai, S., and van der Mei, R. D. (2015). An efficient heuristic for real-time ambulance redeployment. Operations Res. Health Care 4, 27–35. doi:10.1016/j.orhc.2015.01.001
Jagtenberg, C. J., Bhulai, S., and van der Mei, R. D. (2017). Dynamic ambulance dispatching: is the closest-idle policy always optimal? Health care Manag. Sci. 20, 517–531. doi:10.1007/s10729-016-9368-0
Lanzarone, E., Galluccio, E., Bélanger, V., Nicoletta, V., and Ruiz, A. (2018). “A recursive optimization-simulation approach for the ambulance location and dispatching problem,” in 2018 winter simulation conference (WSC) (IEEE), 2530–2541.
Lee, S. (2011). The role of preparedness in ambulance dispatching. J. Operational Res. Soc. 62, 1888–1897. doi:10.1057/jors.2010.145
Lee, S. (2017). A new preparedness policy for ems logistics. Health care Manag. Sci. 20, 105–114. doi:10.1007/s10729-015-9340-4
Li, W., Jiang, R., Wu, H., Xie, J., Zhao, Y., Li, F., et al. (2024a). A new two-stage emergency material distribution framework for urban rainstorm and flood disasters to promote the sdgs. Sustain. Cities Soc. 112, 105645. doi:10.1016/j.scs.2024.105645
Li, X., Normandin-Taillon, H., Wang, C., and Huang, X. (2024b). Bm-rcwtsg: an integrated matching framework for electric vehicle ride-hailing services under stochastic guidance. Sustain. Cities Soc. 108, 105485. doi:10.1016/j.scs.2024.105485
Liu, K., Li, X., Zou, C. C., Huang, H., and Fu, Y. (2020). “Ambulance dispatch via deep reinforcement learning,” in Proceedings of the 28th international conference on advances in geographic information systems, 123–126.
Maxwell, M. S., Restrepo, M., Henderson, S. G., and Topaloglu, H. (2010). Approximate dynamic programming for ambulance redeployment. Inf. J. Comput. 22, 266–281. doi:10.1287/ijoc.1090.0345
McLay, L. A., and Mayorga, M. E. (2013). A model for optimally dispatching ambulances to emergency calls with classification errors in patient priorities. IIE Trans. 45, 1–24. doi:10.1080/0740817x.2012.665200
Meshkani, S. M., and Farooq, B. (2022). A generalized ride-matching approach for sustainable shared mobility. Sustain. Cities Soc. 76, 103383. doi:10.1016/j.scs.2021.103383
Mohammadi, S., Olivier, A., and Smyth, A. (2023). Probabilistic prediction of trip travel time and its variability using hierarchical bayesian learning. ASCE-ASME J. Risk Uncertain. Eng. Syst. Part A Civ. Eng. 9, 04023011. doi:10.1061/ajrua6.rueng-981
Mohammadi, S., and Smyth, A. W. (2024). Nlp-enabled trajectory map-matching in urban road networks using transformer sequence-to-sequence model. doi:10.48550/arXiv.2404.12460
NYC Department of City Planning (2025). LION single line street base map. Available online at: https://www1.nyc.gov/site/planning/data-maps/open-data/dwn-lion.page.
Olivier, A., Adams, M., Mohammadi, S., Smyth, A., Thomson, K., Kepler, T., et al. (2022). Data analytics for improved closest hospital suggestion for ems operations in new york city. Sustain. Cities Soc. 86, 104104. doi:10.1016/j.scs.2022.104104
Olivier, A., Mohammadi, S., Smyth, A. W., and Adams, M. (2023). Bayesian neural networks with physics-aware regularization for probabilistic travel time modeling. Computer-Aided Civ. Infrastructure Eng. 38, 2614–2631. doi:10.1111/mice.13047
Özkan, E., and Ward, A. R. (2020). Dynamic matching for real-time ride sharing. Stoch. Syst. 10, 29–70. doi:10.1287/stsy.2019.0037
Qin, Z., Tang, X., Jiao, Y., Zhang, F., Xu, Z., Zhu, H., et al. (2020). Ride-hailing order dispatching at didi via reinforcement learning. Inf. J. Appl. Anal. 50, 272–286. doi:10.1287/inte.2020.1047
Rautenstrauss, M., Martin, L., and Minner, S. (2023). Ambulance dispatching during a pandemic: tradeoffs of categorizing patients and allocating ambulances. Eur. J. Operational Res. 304, 239–254. doi:10.1016/j.ejor.2021.11.051
Sayarshad, H. R., Mahmoodian, V., and Gao, H. O. (2020). Non-myopic dynamic routing of electric taxis with battery swapping stations. Sustain. Cities Soc. 57, 102113. doi:10.1016/j.scs.2020.102113
Schmid, V. (2012). Solving the dynamic ambulance relocation and dispatching problem using approximate dynamic programming. Eur. J. operational Res. 219, 611–621. doi:10.1016/j.ejor.2011.10.043
Sheng, Y., Lin, Y., Zeng, H., Yu, Y., Guo, Q., and Xie, S. (2023). Emission-concerned coordinated dispatching of electrified autonomous mobility-on-demand system and power system incorporating heterogeneous spatiotemporal scales. Sustain. Cities Soc. 98, 104755. doi:10.1016/j.scs.2023.104755
Sudtachat, K., Mayorga, M. E., and McLay, L. A. (2014). Recommendations for dispatching emergency vehicles under multitiered response via simulation. Int. Trans. Operational Res. 21, 581–617. doi:10.1111/itor.12083
Sudtachat, K., Mayorga, M. E., and Mclay, L. A. (2016). A nested-compliance table policy for emergency medical service systems under relocation. Omega 58, 154–168. doi:10.1016/j.omega.2015.06.001
Watkins, C. J., and Dayan, P. (1992). Q-learning. Mach. Learn. 8, 279–292. doi:10.1023/a:1022676722315
Xu, Z., Li, Z., Guan, Q., Zhang, D., Li, Q., Nan, J., et al. (2018). “Large-scale order dispatch in on-demand ride-hailing platforms: a learning and planning approach,” in Proceedings of the 24th ACM SIGKDD international conference on knowledge discovery and data mining, 905–913.
Yan, C., Zhu, H., Korolko, N., and Woodard, D. (2020). Dynamic pricing and matching in ride-hailing platforms. Nav. Res. Logist. (NRL) 67, 705–724. doi:10.1002/nav.21872
Keywords: ambulance dispatching policy, emergency response optimization, penalty metric, heuristic-based policy, city emergency response simulation, traffic pattern, discrete event simulation, reinforcement learning
Citation: Mohammadi S, Olivier A and Smyth A (2025) Dynamic penalty-based dispatching decision-making for improved emergency response in urban environments: a heuristic approach. Front. Future Transp. 6:1540502. doi: 10.3389/ffutr.2025.1540502
Received: 18 January 2025; Accepted: 28 April 2025;
Published: 20 May 2025.
Edited by:
Alireza Talebpour, University of Illinois at Urbana-Champaign, United StatesReviewed by:
Antonio Comi, University of Rome Tor Vergata, ItalyGihyeob An, University of Illinois at Urbana-Champaign, United States
Copyright © 2025 Mohammadi, Olivier and Smyth. This is an open-access article distributed under the terms of the Creative Commons Attribution License (CC BY). The use, distribution or reproduction in other forums is permitted, provided the original author(s) and the copyright owner(s) are credited and that the original publication in this journal is cited, in accordance with accepted academic practice. No use, distribution or reproduction is permitted which does not comply with these terms.
*Correspondence: Andrew Smyth, YXdzMTZAY29sdW1iaWEuZWR1