


 Ming-Chang Chiang1,2
- 1 Laboratory of Neuro Imaging, Department of Neurology, University of California Los Angeles School of Medicine, Los Angeles, CA, USA
- 2 Department of Biomedical Engineering, National Yang-Ming University, Taipei, Taiwan
The quest to identify genes that influence disease is now being extended to find genes that affect biological markers of disease, or endophenotypes. Brain images, in particular, provide exquisitely detailed measures of anatomy, function, and connectivity in the living brain, and have identified characteristic features for many neurological and psychiatric disorders. The emerging field of imaging genomics is discovering important genetic variants associated with brain structure and function, which in turn influence disease risk and fundamental cognitive processes. Statistical approaches for testing genetic associations are not straightforward to apply to brain images because the data in brain images is spatially complex and generally high dimensional. Neuroimaging phenotypes typically include 3D maps across many points in the brain, fiber tracts, shape-based analyses, and connectivity matrices, or networks. These complex data types require new methods for data reduction and joint consideration of the image and the genome. Image-wide, genome-wide searches are now feasible, but they can be greatly empowered by sparse regression or hierarchical clustering methods that isolate promising features, boosting statistical power. Here we review the evolution of statistical approaches to assess genetic influences on the brain. We outline the current state of multivariate statistics in imaging genomics, and future directions, including meta-analysis. We emphasize the power of novel multivariate approaches to discover reliable genetic influences with small effect sizes.
Introduction
Over the past decade, public and private funding institutions have invested billions of dollars in the fields of human neuroimaging and genetics (Akil et al., 2010). Recently, researchers have sought to use quantitative measures from brain images to test how genetic variation influences the brain. Imaging measures are thought to have a simpler genetic architecture than diagnostic measures based on cognitive or clinical assessments (Gottesman and Gould, 2003). In other words, the penetrance of an individual genetic polymorphism is expected to be higher at the imaging level than at the diagnostic level. As such, imaging-derived traits may offer more power to detect how specific genes contribute to brain disease. Genetic analysis of images has been used to discover how susceptibility genes affect brain integrity (Braskie et al., 2011b). Recent studies have revealed gene effects operating within an entire population, in the form of a 3D brain map (Thompson et al., 2001; Stein et al., 2010a; Hibar et al., 2011).
Optimally merging these two well-developed fields requires innovative mathematics and computational methods, guided by genomics and neuroscience. Imaging genetics is still a nascent field, and many studies are relatively simplistic – they generally test how a single genetic variant, or a small set of such variants (usually single nucleotide polymorphisms, or SNPs) are associated with a single summary measure of the brain. These studies begin to bridge the gap between the two fields, but do not take full advantage of advanced methods from either field, which can survey the entire genome or allow an image-wide search. By contrast, multivariate statistical methods such as machine learning and sparse regression can handle high dimensional datasets. Many of these are being adapted to analyze a range of brain processes and biological markers of disease.
In this review, we summarize the recent evolution of imaging genetics, from candidate gene studies to multilocus methods and genome-wide searches to genome-wide, image-wide searches. We explain how images are used in different ways, ranging from single region-of-interest (ROI) methods – that assess the volume or shape of a specific brain region, such as the hippocampus – to voxelwise approaches that survey the whole brain at once in 3D. In these efforts, multivariate, “multilocus” techniques can model how several genetic variants affect the brain at once. Specialized approaches – such as sparse coding methods – can simultaneously handle the high dimensionality and high degree of correlation observed across the genome and in image-derived maps.
Candidate Gene Studies
In studies that scan a large number of patients or controls, candidate gene studies have often been used to assess genetic effects on the brain. This approach is appealing as one can test biologically plausible hypotheses and determine how specific, well-studied genetic variations affect brain structure and function. Early studies, for instance, explored how genes related to serotonin transport affected measures extracted from single-photon emission computed tomography (SPECT) and functional magnetic resonance imaging (fMRI; Heinz et al., 2000; Hariri et al., 2002). Serotonin’s role in neurotransmission and neuromodulation – and the well-known anatomy of the monoamine systems – made it possible to frame and confirm testable hypotheses for pertinent regions such as the raphe nuclei and amygdala (Munafo et al., 2008).
Candidate gene studies, such as those above, may assess a single measure derived from a specific ROI in the image. This may be the whole brain, or a subregion such as the gray matter, or the volume or mean activation of a subcortical region. More recently, voxel-by-voxel searches have been conducted to assess candidate gene effects throughout the whole brain in 3D. This unbiased search across the brain makes no prior assumptions on which regions may be affected. Statistical maps are also widely used in neuroimaging. Spatial statistics, such as principal components analysis (PCA) or ICA, may also be performed for dimension reduction, and multiple comparisons corrections, such as the false discovery rate (FDR) method, can help to decide if a pattern of gene effects is significant across the voxels searched. For example, Ho et al. (2010) investigated the effects of a proxy SNP in the fat mass and obesity-associated (FTO) gene reliably associated with increased risk for obesity (rs3751812; Frayling et al., 2007) on brain structure. They used MRI along with tensor-based morphometry (TBM), to evaluate 206 healthy elderly subjects. FTO risk allele carriers had lower frontal and occipital lobe volumes (Figure 1). In such studies, maps of statistical associations are created by performing separate association tests at each imaging voxel in the brain. As the number of statistical tests is very large, a standard correction for multiple comparisons can be used, such as the FDR method (Benjamini and Hochberg, 1995) or its more advanced variants such as topological FDR (Chumbley et al., 2010), which consider the geometry of the effects. These corrections assess how likely it is that the overall pattern of associations could be observed by chance. Voxel-based analyses may also be informed by prior hypotheses: ROI may be defined as search regions, such as the temporal lobes, to include prior information on the expected location or patterns of effects (Stein et al., 2010a).
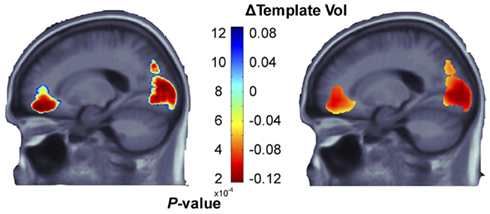
Figure 1. p-values (corrected using the false discovery rate method; left panel) and corresponding regression coefficients (right) show the statistical associations between a candidate single nucleotide polymorphism in the FTO gene (which is associated with higher risk of obesity) and tensor-based morphometry maps derived from anatomical MRI scans of the brain. Significant associations with regional brain volumes are detected in the occipital and frontal lobes. Clearly, if other regions had been specified in advance as the target of study, association effects may have been missed. Adapted from Ho et al. (2010).
Brain imaging measures used in genetic studies should ideally be highly heritable and be genetically related to a biological process affected by genetic variation, such as a disease process (Gottesman and Gould, 2003; Glahn et al., 2007; Winkler et al., 2010). Some argue that the use of imaging endophenotypes should boost power to detect genetic variants that have reliable but small effects on disease status (Meyer-Lindenberg and Weinberger, 2006). One neuroimaging modality that shows great promise in candidate gene studies is diffusion tensor imaging (DTI), which assesses the fiber integrity of the brain’s white matter. DTI is based on the observation that myelination restricts water diffusion, and disease processes typically increase water diffusion across cell membranes (Beaulieu, 2002). Some DTI-derived measures, such as the fractional anisotropy (FA) of diffusion, are widely accepted as measuring brain integrity. FA is highly heritable (Chiang et al., 2009; Kochunov et al., 2010) and is consistently altered in a range of developmental and psychiatric disorders (Thomason and Thompson, 2011). Candidate polymorphisms already associated with brain disorders may be surveyed to discover associations with maps of DTI parameters such as FA. One recent DTI study of young healthy adults (Braskie et al., 2011a), studied the voxelwise effects of the rs11136000 SNP in the recently discovered Alzheimer’s disease (AD) risk gene, CLU. Significant associations were detected in several anatomical regions that undergo atrophy in AD (Figure 2). In similar candidate gene studies using DTI, other genes such as BDNF (Chiang et al., 2011a) and COMT (Thomason et al., 2010) have been found to influence white matter structure, with carriers of one variant showing consistently higher or lower FA.
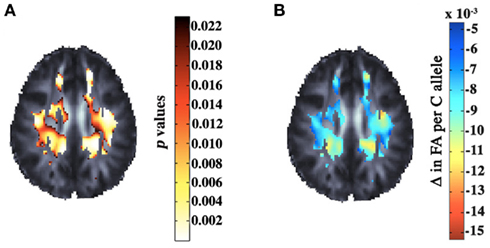
Figure 2. Corrected p-values (A) and regression coefficients (B) are shown for the voxelwise effects of a candidate polymorphism in the CLU gene – a highly prevalent Alzheimer’s susceptibility gene – on fractional anisotropy maps derived from DTI scans of 398 young adults. The axial slice shows the extensive influence of the genetic variant on white matter structure. Adapted from Braskie et al. (2011a).
Genome-Wide Associations with Single Imaging Measures
Candidate gene studies have successfully discovered patterns of brain differences associated with genetic variants whose function is relatively well-known (such as ApoE, for example – a risk gene for late-onset AD; Shaw et al., 2007). The choice of a candidate gene, however, requires a strong prior hypothesis, and most of the genetic determinants of the highly heritable imaging measures (connectivity or cortical thickness, for example) are unknown. In most candidate gene studies in imaging, there is a correction for multiple comparisons to control the rate of false discoveries across the image, but this does not take into account the genetic variant tested, or the fact that it could have been selected from a wide list of possibly associated genes. In genetics, and by extension imaging genetics, there is a high risk of false-positive findings unless appropriate corrections are made. Moving beyond candidate gene studies to an unbiased search of the whole genome clearly requires an appropriate genome-wide significance criterion. Otherwise, many false-positive associations will be reported that would not be replicated in the future (Ioannidis, 2005).
Genome-wide association (GWA) studies typically assess associations between hundreds of thousands of SNPs and a phenotype of interest (such as a disease, or a specific image-derived measure). GWA studies have discovered hundreds of common risk loci for diseases and traits in recent years (Hindorff et al., 2009). GWA studies are frequently conducted for discrete, case–control phenotypes, such as the diagnosis of a specific disease (such as AD or schizophrenia vs. healthy control). These studies, however, are limited as participants do not always fall clearly into unique diagnostic categories, and may vary in dimensions not relevant to disease (Pearson and Manolio, 2008). For neuropsychiatric disorders in particular, symptoms expressed by members of specific diagnostic groups may be highly heterogeneous – and there may also be substantial co-morbidity and overlap in symptom profiles across disorders (Psychiatric GWAS Consortium Coordinating Committee et al., 2009; Hall and Smoller, 2010).
Measures derived from brain images in principle are closer to the underlying biology of gene action, offering an alternative target for genome-wide searches, by serving as intermediate phenotypes or endophenotypes for GWA studies (Gottesman and Gould, 2003; Hall and Smoller, 2010). Several imaging GWA scans have been published: Potkin et al. (2009b) identified SNPs in two genes (RSRC1 and ARHGAP18) that showed associations with a blood-oxygen-level dependent (BOLD) contrast measure from a brain region implicated in schizophrenia. Similarly, Stein et al. (2010a) discovered a SNP in the GRIN2B gene (rs10845840) and an intergenic SNP (rs2456930) associated with an MRI-derived TBM) measure of temporal lobe volume in 740 elderly subjects from the AD Neuroimaging Initiative. In these and other studies, linear regressions are used to assess the additive or dominant allelic effect of each SNP, after adjusting for covariates such as age and sex, and the confounding effects of population stratification (e.g., Potkin et al., 2009a). This yields p-values assessing the evidence for the association of each SNP with the imaging summary chosen. The overall significance of any one SNP effect is then assessed through a form of genome-wide correction for multiple comparisons. Commonly, a nominal p-value less than 5 × 10⁻⁸ is used.
The GWA study design has been extended to analyze whole images, but one of the shortcomings of all GWAS studies is their limited power (or alternatively, the large sample sizes needed) to detect relevant gene variants. Most SNPs affecting the brain have modest effect sizes (often explaining <1% of the variance in a quantitative phenotype). Meta-analysis can provide added statistical power to discover variants with small effects. Replication, and meta-analysis in particular, have been widely embraced as a way to aggregate evidence from multiple genetic studies, including studies of disease risk, and normally varying traits such as height (de Bakker et al., 2008; McCarthy et al., 2008; Zeggini and Ioannidis, 2009; Yang et al., 2010).
Even so, most imaging GWA studies consider under a thousand subjects, so are limited in detection power. This led many researchers in the field to band together to search for relevant genetic associations with imaging traits meta-analytically, in many large samples. One promising initiative is called Enhancing Neuro Imaging Genetics through Meta-Analysis (ENIGMA) and is currently accepting research groups who want to become involved in meta-analytic imaging genomics projects (http://enigma.loni.ucla.edu/). The ENIGMA pilot project is a large meta-analysis to discover genes associated with hippocampal volume on brain MRI in over 9,000 subjects scanned by 21 research centers (The ENIGMA Consortium, 2011). Future imaging genetics studies may rely on large meta-analyses and international collaborations to overcome the low power and relatively small effect sizes. However, some genetic associations can be found and replicated without vast meta-analytic approaches like ENIGMA. For example, Stein et al. (2011) discovered and replicated an association between caudate volume and the SNP rs163030 located in and around two genes, WDR41 and PDE8B. These genes are involved in dopamine signaling and development; a Mendelian mutation in one leads to severe caudate atrophy. Similarly, Joyner et al. (2009) replicated an association with cortical surface area in a common variant (rs2239464) of the MECP2 gene, which is linked to microencephaly and other morphological brain disorders.
Genetic Analysis of Mass Univariate Imaging Phenotypes
Studying a single imaging measure with a genome-wide search is as limited as picking a single candidate gene from the entire genome – it may not fully reflect how a given genetic variant influences the brain, or it may miss an important effect by being too restrictive. Important links may be overlooked if a gene variant influences a brain feature present but not measured in the images. To broaden the range of measures surveyed in each image, Shen et al. (2010) studied patients with AD and mild cognitive impairment (MCI) using whole-brain voxel-based morphometry (VBM; Good et al., 2001) and split the brain into 142 cortical and subcortical ROIs using the segmentation software package FreeSurfer (Fischl et al., 2002). The VBM measure within each ROI was averaged for each subject and those values were used as traits for GWA scans. One SNP, rs6463843, from the NXPH1 gene, was significantly associated with gray matter density in the hippocampus, and had broad morphometric effects in a post hoc exploratory analysis. While this study found plausible results, the computation of summaries from ROI may miss patterns of effects that lie only partially within the chosen ROI. As such, a combination of map-based and ROI-based methods seems ideal.
Some researchers have combined unbiased tests of association across the genome with unbiased searches of the entire brain, instead of relying on summary measures derived from ROI. Combining GWA scans with an image-wide search is computationally intensive, requiring new methods to handle the high dimensionality and multiple statistical comparisons. Three dimensional brain images may contain over 100,000 voxels, and a completely unbiased search may test up to one million SNPs for association at each voxel. This is extremely computationally intensive, but can be completed in a feasible time frame if the process is parallelized. Stein et al. (2010b) performed a full GWA scan at each voxel in maps of regional brain volume calculated by TBM (Leow et al., 2005). Sixteen billion tests of association were conducted – in a so-called “voxelwise genome-wide association study” (vGWAS). To accommodate the huge number of statistical tests performed, only the most highly associated SNP at each voxel was stored. The p-value distribution for the top SNP was modeled as a beta distribution, Beta(1, n), where n is an estimate of the effective number of independent tests performed (Ewens and Grant, 2001). The resulting distribution of minimum p-values across the genome, assembled from voxels across the image, was transformed into a uniform distribution in the null case for multiple comparisons correction across the image. FDR was used to correct for multiple comparisons across the image, and to assess whether credible effects had been detected (Benjamini and Hochberg, 1995). Several top SNPs were associated with moderate regional brain volume differences; many were in genes that are expressed in the brain (Figure 3). However, no SNPs passed the strict correction for multiple comparisons. The Stein et al. study was a proof of concept, showing that a completely unbiased search of the genome is feasible with imaging phenotypes. However, the huge correction for multiple comparisons across the image and genome are practically insurmountable unless the effect size or cohort size is very large. In addition, the vGWA study required 27 h when spread across 500 CPUs; this is more computational power than most researchers typically have access to. Clearly, an optimal balance must be made between pure discovery methods, unconstrained by prior hypotheses, and those that invoke prior biological information to boost power and reduce the multiple comparisons correction.
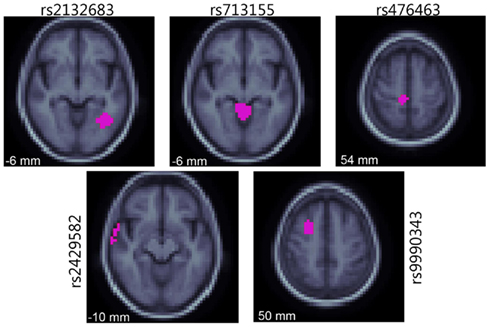
Figure 3. The five most highly associated SNPs identified by vGWAS are shown on slices of an averaged brain MRI template, indicating regions where these SNPs were the most highly associated out of all SNPs (in purple). Coordinates refer to the ICBM standard space, and the cohort is the ADNI sample. Adapted from Stein et al. (2010a).
Multivariate Imaging Genetics Methods
Multivariate methods can be used to assess the joint effect of multiple genetic variants simultaneously, and are widely used in genetics (Phillips and Belknap, 2002; Gianola et al., 2003; Cantor et al., 2010). For example, set-based permutation methods use gene annotation information and linkage disequilibrium values to group univariate p-values from traditional GWA studies into gene-based test statistics (Hoh et al., 2001; Purcell et al., 2007). Set-based approaches use prior information on gene structure to incorporate all genotyped SNPs in a given gene into a single test statistic. This can offer, in some cases, greater power than univariate statistical tests to detect SNP effects. Combining univariate p-values into a single gene-based test also reduces the total number of tests performed, alleviating the multiple comparisons correction. It can also aggregate the cumulative evidence of association across a gene block to account for allelic heterogeneity (Hoh et al., 2001). Individual SNP p-values may not achieve the genome-wide significance level for a traditional GWA study (nominally p < 5 × 10⁻⁸), but if several SNPs in the same LD block show moderate association, the combined evidence for association may be enough to beat a gene-wide significance level (nominally p < 5 × 10⁻⁶). For example, one study examined SNPs from the SORL1 gene for association with hippocampal volume in healthy elderly controls (Bralten et al., 2011). While they did not find evidence for association of individual SNPs in a discovery and replication dataset, a gene-based test found evidence of association in both datasets. Some set-based statistics may be derived from the separate p-values from the individual univariate tests, enabling post hoc analysis of published studies. A major issue in applying set-based statistics in imaging genetics is that the permutation procedure applied across SNP groupings would be very computationally intensive. Set-based methods are currently not feasible to apply at >100,000 voxels, as a single gene test takes around 5 min (or 22.8 years to test a single gene at every voxel of the full brain on one CPU). In addition, combining SNPs by p-value may miss an important effect where a set of SNPs from the same gene have moderate covariance, but explain different portions of variance in the phenotype. In other words, if they were considered together in the same model, the overall variance explained may be greater than its univariate significance level would imply.
An alternative to set-based methods is to group SNPs into a single statistical model and then test that model for overall association. One classical example of this strategy is multiple linear regression (MLR). However, a problem with applying MLR to genetic data is that SNPs tend to be highly correlated, as they co-segregate in haplotype blocks (Frazer et al., 2007). The MLR is highly sensitive to collinearity among predictors; the inversion step in calculating regression coefficients involves a matrix that is not full rank as the variables are collinear. This leads to wildly inaccurate Beta value estimates and SE (Kleinbaum, 2007). To avoid collinearity in multivariate analysis of genetic data, dimensionality is often reduced using sparse regression methods, such as penalized or principal components regression (PCReg).
Some data reduction methods compute a new set of statistically orthogonal variables, for inclusion in a classical MLR model. A data reduction method such as PCA transforms a matrix of SNP predictors into a new orthogonal set of predictors, ranked in descending order based on the amount of the variance in the data that each component explains (Jolliffe, 2002). The output of PCA is typically a matrix that explains the same amount of the overall variance as the original predictors, but without the collinearity. As the individual components are sorted by amount of variance they explain, the resulting statistical models can strike an efficient balance between the total variance explained (the number of components to include) and the number of degrees of freedom used (model complexity increases as more variance components are included).
One method, known as PCReg first performs PCA on a set of predictors. It then builds a multiple partial-F regression model where the number of components included is based on the desired proportion of variance to be explained (Massy, 1965). Wang and Abbott (2008) used PCReg to group SNPs into a single multivariate test statistic. Hibar et al. (2011) extended this method to be applicable to images, conducting gene-based tests at each voxel with PCReg. They used an automated method (Altshuler et al., 2005; Hemminger et al., 2006; Hinrichs et al., 2006) to group SNPs based on gene membership, resulting in 18,044 unique genes. Using the set of SNPs in each individual gene as predictors, Hibar et al. used PCReg to assess the degree of association for every gene at every voxel in the full brain. The resulting method was termed a voxelwise “gene-wide” association study vGeneWAS. By compressing the SNPs into gene-based tests, the total number of tests was reduced to around 500 million tests from the 16 billion tests in vGWAS. However, even with this much smaller number of tests, no genes identified passed correction for multiple comparisons. The most highly associated gene, GAB2, showed strong credibility as it is consistently associated with neurodegenerative disorders such as AD (Reiman et al., 2007). In addition, Hibar et al. (2011) simulated full brain parametric maps using statistical priors based on their observed data to show that observed clusters of associated genes were larger than would be expected by chance. This provides evidence that vGeneWAS is a valid and powerful multivariate method to detect gene effects in full brain neuroimaging data. A head-to-head comparison of vGWAS and vGeneWAS was also performed on the same datasets. The cumulative distribution function (CDF) plots of p-values for each study show that the FDR in the multivariate vGeneWAS was controlled at a lower rate than in the mass univariate vGWAS method (Figure 4).
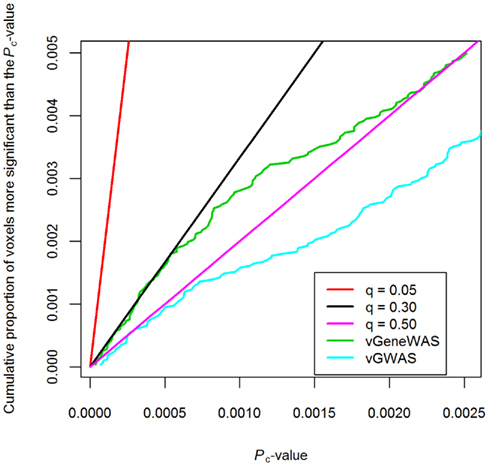
Figure 4. Cumulative distribution function (CDF) plot of corrected p-values from vGeneWAS (Hibar et al., 2011) and vGWAS (Stein et al., 2010b) analyses. vGWAS could only be controlled for false-positives at q = 0.50 threshold, while vGeneWAS could be controlled for false-positives at q = 0.30. The difference in q-value thresholds for the CDF of the p-values obtained from both studies on the same dataset suggests that the gene-based analysis is more powerful, though neither study controlled the false-positive rate at the nominal q = 0.05 threshold.
An extension of PCReg and other data reduction techniques is to perform data reduction on both the genome and the 3D brain imaging traits. One approach that appears to be promising is parallel independent components analysis (Parallel ICA or PICA; Liu et al., 2009). Parallel ICA works by first performing PCA on a set of SNPs and also a different PCA on a voxelwise imaging measure. Next, a modified version of ICA is applied to both modalities and independent factors from each modality are chosen simultaneously by a correlation measure (hence “parallel” ICA). Selecting imaging features and SNPs together can be more powerful than mass univariate tests of voxelwise imaging traits as the total number of tests is greatly reduced. For example, Liu et al. (2009) used pre-processed fMRI maps from 43 healthy controls and 20 schizophrenia patients and a pre-selected set of 384 SNPs chosen for their potential associations with schizophrenia. Via a t-test, Liu et al. (2009) demonstrated that genetic components (p = 0.001) and fMRI BOLD (p = 0.0006) response loadings from parallel ICA were able to distinguish healthy subjects from patients with schizophrenia, with reasonable accuracy. Similar approaches have been applied to structural MRI (Jagannathan et al., 2010). The PICA method is quite promising, but several challenges remain. As Parallel ICA requires an initial round of PCA, it is difficult to recover which SNP sets are contributing to a given component and similarly it is difficult to localize the 3D spatial effect contributing to each component from the image. This may make it difficult to interpret and replicate specific findings. In addition, it is not clear how data reduction methods will perform with whole genome and full brain data. Liu et al. (2009) and Jagannathan et al. (2010) both performed considerable downsampling of the images, reducing the total number of voxels included in the Parallel ICA model. In addition, both studies tested only small sets of pre-selected SNPs instead of data from the full genome, or a standard 500,000 SNP genome-wide scan. The power of Parallel ICA to find common components may be greatly reduced if there is additional noise from genome-wide data. Liu et al. (2009) found that as the amount of random noise increased, so did the number of independent components. As the number of independent components increases, the power to detect associations decreases. Also querying full brain phenotypes for effects of genetic variants, another recently proposed multivariate method by Chiang et al. (2011b), identified patterns of voxels in a DTI image with a common genetic determination, and aggregated them to boost power in GWA (Figure 5). Approximately 5,000 brain regions were selected, where genetic influences accounted for >60% of the total variation of white matter integrity. From these, a 5,000 × 5,000 correlation matrix was obtained. Hierarchical clustering was used to select the largest clusters, and these voxels were defined to be ROIs. The mean FAs for these ROIs were then tested for evidence of association with all SNPs genotyped across the genome. By identifying a genetic network that influences white matter integrity over multiple brain regions, Chiang et al. (2011b) were able to boost power to detect associations between FA in these brain areas and SNPs from the whole genome. In all, they identified 24 SNPs with genome-wide significance, which is unusual for a study with fewer than 1,000 subjects. To ensure the findings are not false-positives, however, simulations of imaging and genomic data may be necessary (as carried out by Vounou et al., 2010 see below).
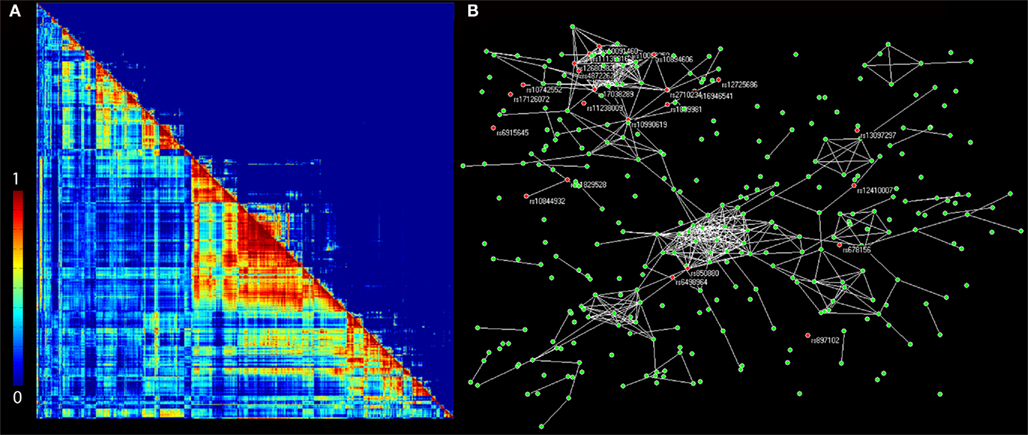
Figure 5. Clustering regions of a brain image that have common genetic determination. In a DTI study of twins, the known kinship structure made it possible to estimate the genetic correlation matrix and a “topological overlap (TO)” index matrix. This was used to gage the similarity of genetic influences on all pairs of brain regions (A). The 18 largest clusters – parts of the image with common genetic influences – were selected as regions of interest (ROIs) for GWAS. By associating the mean white matter integrity of these regions with genetic variants, a genetic interconnection network was obtained (B), where each network node represents a single SNP (colored circles). The figure shows only those SNPs associated with white matter integrity in at least one ROI with a significance p-value < 10−5. SNPs whose associations reach genome-wide significance are colored in red, with their names labeled. White lines indicate that SNPs are “connected,” i.e., their effects on white matter integrity are strongly correlated. Adapted from Chiang et al. (2011b).
Variants near each other on the genome can be highly correlated due to linkage disequilibrium. This leads to problems if all variants are included in a standard multiple regression model to predict the values of a trait. To address this, many new mathematical methods have been used to handle the high dimensionality in the genome (a p ≫ n problem) and interactions between genetic variants. These include penalized and sparse regression techniques, such as ridge regression (Hoerl, 1962), the least absolute shrinkage and selection operator (LASSO; Tibshirani, 1996), the elastic net (Zou and Hastie, 2005), and penalized orthogonal-components regression (Malo et al., 2008; Cho et al., 2009; Lin et al., 2009; Zhang et al., 2009; Chen et al., 2010). The various penalty terms (e.g., L1 in LASSO and L2 in ridge) in the regularized regression methods can incorporate large numbers of correlated variants with possible interaction terms, in single models. These methods show high statistical power in analyses with both real and simulated data. Although these studies are almost invariably applied to case–control GWA studies, similar approaches may be applied to imaging phenotypes. Kohannim et al. (2011a), for instance, implemented ridge regression to study the association of genomic scanning windows with MRI-derived temporal lobe and hippocampal volume. They reported boosting of power in detecting effects of several SNPs, when compared to univariate imaging GWA. One statistical challenge of such sliding-window approaches is finding optimal window sizes, which can capture the correlation structure in the genomic data without adding excessive degrees of freedom to the model. Kohannim et al. considered several fixed, scanning window sizes (50, 100, 500, and 1000 kbp) in their study, and found boosting of power in detecting SNPs with different window sizes for different genomic regions. A more flexible approach may incorporate information such as the sample size and variant-specific LD structure into the selection of optimal window sizes for each genomic region (e.g., Li et al., 2007). This could ensure that SNPs are not missed due to inappropriate window sizes. In addition, L1-driven methods, such as LASSO, may provide greater detection power by selecting sparse sets of genomic variants in association with imaging measures (Kohannim et al., submitted). As discussed above, however, multivariate methods can be applied not only to the genome, but also to the images, which are also high dimensional and show high spatial correlations. Sparse and penalized models can be useful in these situations as well. Vounou et al. (2010) applied a sparse reduced-rank regression (sRRR) method to detect whole genome-whole image associations. They computed a matrix of regression coefficients, C, whose rank was p (number of SNP genotypes) times q (the number of imaging phenotypes, or pre-defined anatomical ROIs in their case). They reduced the rank of this large matrix to r, by factorizing the matrix into the product of a p × r matrix, B, and an r × q matrix, A, and constraining A and B to be sparse (Figure 6). To evaluate the power of their method and compare it to that of mass univariate modeling, Vounou et al. generated realistic, simulated imaging and genetic data. Using the FoRward Evolution of GENomic rEgions (FREGENE) software, and the ADNI baseline T1-weighted MRI dataset, they obtained a simulated dataset, to which they introduced genetic effects in a number of ROIs. It was not feasible for the investigators to consider all possible genetic effect sizes and sample sizes, but they were able to show boosted power for all parameter settings they explored. Setting the desired, reduced-rank r equal to 2 or 3, they obtained higher sensitivities with sRRR at any given specificity for a sample size of 500. When they increased the sample size from 500 to 1,000, they noted gains in sensitivities with sRRR, which were more considerable than the merely linear gains obtained with univariate modeling. They also demonstrated that boosted sensitivities obtained with sRRR increase with higher numbers of SNPs; sensitivity ratios (sRRR/mass univariate modeling) could be boosted even further to ratios far exceeding 5 (observed with 40,000 SNPs) with numbers of SNPs considered in a typical GWAS (e.g., 500,000 SNPs). Direct power comparisons between association methods on DNA microarray data show that models that incorporate linear combinations of variables perform better than those that perform simple data reduction (Bovelstad et al., 2007). Bovelstad et al. found that the penalized method, ridge regression, was more powerful than LASSO, PCReg, supervised PCReg, and partial least squares regression (PLS), when it comes to predicting survival rates in cancer patients from DNA microarray data. In the future, direct comparisons of methods on imaging genetics data could inform the direction of new methods development.
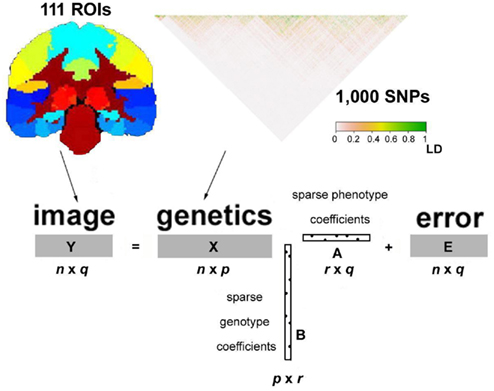
Figure 6. Imaging and genomic data are incorporated into a sparse, reduced-rank regression model, where regions of interest (ROIs), and single nucleotide polymorphisms (SNPs) attain sparse coefficients, simultaneously. This approach can select pertinent SNPs and ROIs. In simulations, it demonstrates higher power than mass univariate models for detecting effects of genetic variants. Adapted with authors’ and publishers’ permission from Vounou et al. (2010).
Comprehensive modeling of whole-brain voxelwise and genome-wide data remains challenging, due to the high dimensionality of the data. This causes both statistical and computational problems. Recently, there have been new developments applying sparse regression methods to genome-wide data; one such method is iterative sure independence screening (ISIS; Fan and Lv, 2008; Fan and Song, 2010; He and Lin, 2011). ISIS is an iterative selection procedure that builds a marginal model using the cyclic coordinate descent (CCD; Friedman et al., 2010) algorithm with the LASSO and combines it with a conditional model of interactions based on pairwise correlations. The combined model has lower dimensionality, but effects of individual SNPs are still identifiable, as are SNP–SNP interactions. This method appears to be promising for discovery-based searches of the genome. ISIS has not yet been applied to brain images, but it should be feasible. Methods such as ISIS could also be modified to jointly select imaging phenotypes and genomic data as done by Vounou et al. (2010) but without first having to select ROI or only a small subset of SNPs from the genome.
Conclusion
The field of imaging genetics started with candidate gene studies, where hypotheses about gene action on brain structure and function could be tested in a novel way. More recently, candidate gene studies have been extended to investigate voxelwise associations between genetic variants and images of the brain, to map 3D profiles of genetic effects without requiring a priori selection of ROI.
To consider the entirety of the genome and discover potentially new variants, however, GWA studies have been introduced to the field of imaging genetics. In these studies, quantitative measures derived from images are considered as intermediate phenotypes, which are in some respects closer to the underlying biology of brain disorders and processes of interest. Despite their unbiased consideration of the whole genome, the standard, univariate GWA approach considers only one SNP at a time and has several limitations. From a genetic perspective, it does not take into account the interdependence between genetic variants due to linkage disequilibrium; and in regard to imaging, such studies typically rely on single summary measures from images, which only weakly represent the wealth of information in a full 3D scan.
Among the most promising applications of imaging genetics are those that use sparse methods to reduce the data dimensionality. Sparse methods create efficient models, and boost power to identify patterns of association. A major advantage of penalized or sparse regression methods is that they accommodate collinearity inherent in the genome and in the images, but they still offer a familiar regression framework to accommodate covariates and confounding variables. Penalized regression models may include a large number of genetic predictors. This may discover genetic effects undetected by other data reduction methods, such as PICA and PCReg. For studies of large 3D statistical maps of imaging phenotypes, methods to penalize the selection of both voxels from the image and associated genetic variants from the genome seem to have higher power than related discovery-based methods. Even so, this is largely an empirical question that depends on the structure of the true signal. Indeed, Vounou et al. (2010) demonstrated the increased power of the sRRR method, which favors the selection of an efficient set of ROI and a reduced number of SNPs has increased power. A major limitation of penalized methods is that they may fail to converge on a solution when the data dimensions are very high. Even methods designed for p ≫ n problems such as least angle regression (Efron et al., 2004) tend to fail when given a full 3D imaging phenotype. This illustrates why current implementations of penalized regression in imaging genetics often rely on prior “groupings” of voxels or sliding windows in the genome. These prior groupings do not appear to be motivated by strong prior hypotheses, but by limitations in the statistical modeling. Methods similar to ISIS (Fan and Lv, 2008; Fan and Song, 2010; He and Lin, 2011) designed for ultra-high dimensional datasets will likely be useful for future imaging genetics projects.
Once we have a set of validated genetic variants that affect the brain, multivariate models may be used to combine imaging, genetics, and other physiological biomarkers to predict outcomes in patients with brain disorders. The resulting combination of imaging and genetic data, with other biomarkers, can be used to predict an individual’s personalized aggregate risk for specific types of brain disorders. As genomic and proteomic data are added, prognosis and diagnosis may be possible at an earlier stage or more accurate than is possible with current biomarkers. Machine learning algorithms (e.g., decision trees, support vector machines, and neural networks) have shown promise for making disease predictions from genomic and proteomic data (Cruz and Wishart, 2007). Similar approaches may be useful in psychiatry research, and neuroimaging measures such as fiber anisotropy from diffusion imaging may help in making early predictions of brain integrity from genes. In a recent, preliminary study, our group incorporated several candidate polymorphisms in a multi-SNP, machine learning model, to predict personal measures of fiber integrity in the corpus callosum (Kohannim et al., 2011b). Ideally, by incorporating both genomic and proteomic data from larger cohorts, one may be able to obtain personalized “scores” for brain integrity from biomarker profiles. This has considerable implications for prevention and early treatment of brain pathology.
Conflict of Interest Statement
The authors declare that the research was conducted in the absence of any commercial or financial relationships that could be construed as a potential conflict of interest.
Acknowledgments
This work is supported in part by NIH grants R01 EB008432, EB008281 HD050735 AG020098, RC2 AG036535, P41 RR013642 (to Paul M. Thompson). Derrek P. Hibar is partially supported by NSF grant DGE-0707424. Omid Kohannim was supported in part by the UCLA MSTP. Jason L. Stein is partially supported by a T32 post-doctoral training grant in Neurobehavioral Genetics.
References
Akil, H., Brenner, S., Kandel, E., Kendler, K. S., King, M. C., Scolnick, E., Watson, J. D., and Zoghbi, H. Y. (2010). Medicine. The future of psychiatric research: genomes and neural circuits. Science 327, 1580–1581.
Altshuler, D., Brooks, L. D., Chakravarti, A., Collins, F. S., Daly, M. J., Donnelly, P., Gibbs, R. A., Belmont, J. W., Boudreau, A., Leal, S. M., Hardenbol, P., Pasternak, S., Wheeler, D. A., Willis, T. D., Yu, F. L., Yang, H. M., Zeng, C. Q., Gao, Y., Hu, H. R., Hu, W. T., Li, C. H., Lin, W., Liu, S. Q., Pan, H., Tang, X. L., Wang, J., Wang, W., Yu, J., Zhang, B., Zhang, Q. R., Zhao, H. B., Zhao, H., Zhou, J., Gabriel, S. B., Barry, R., Blumenstiel, B., Camargo, A., Defelice, M., Faggart, M., Goyette, M., Gupta, S., Moore, J., Nguyen, H., Onofrio, R. C., Parkin, M., Roy, J., Stahl, E., Winchester, E., Ziaugra, L., Shen, Y., Yao, Z. J., Huang, W., Chu, X., He, Y. G., Jin, L., Liu, Y. F., Shen, Y. Y., Sun, W. W., Wang, H. F., Wang, Y., Wang, Y., Wang, Y., Xiong, X. Y., Xu, L., Waye, M. M. Y., Tsui, S. K. W., Xue, H., Wong, J. T. F., Galver, I. L. M., Fan, J. B., Murray, S. S., Oliphant, A. R., Chee, M. S., Montpetit, A., Chagnon, F., Ferretti, V., Leboeuf, M., Olivier, J. F., Phillips, M. S., Roumy, S., Sallee, C., Verner, A., Hudson, T. J., Frazer, K. A., Ballinger, D. G., Cox, D. R., Hinds, D. A., Stuve, L. L., Kwok, P. Y., Cai, D. M., Koboldt, D. C., Miller, R. D., Pawlikowska, L., Taillon-Miller, P., Xiao, M., Tsui, L. C., Mak, W., Sham, P. C., Song, Y. Q., Tam, P. K. H., Nakamura, Y., Kawaguchi, T., Kitamoto, T., Morizono, T., Nagashima, A., Ohnishi, Y., Sekine, A., Tanaka, T., Tsunoda, T., Deloukas, P., Bird, C. P., Delgado, M., Dermitzakis, E. T., Gwilliam, R., Hunt, S., Morrison, J., Powell, D., Stranger, B. E., Whittaker, P., Bentley, D. R., Daly, M. J., de Bakker, P. I. W., Barrett, J., Fry, B., Maller, J., McCarroll, S., Patterson, N., Pe’er, I., Purcell, S., Richter, D. J., Sabeti, P., Saxena, R., Schaffner, S. F., Varilly, P., Stein, L. D., Krishnan, L., Smith, A. V., Thorisson, G. A., Chen, P. E., Cutler, D. J., Kashuk, C. S., Lin, S., Abecasis, G. R., Guan, W. H., Munro, H. M., Qin, Z. H. S., Thomas, D. J., McVean, G., Bottolo, L., Eyheramendy, S., Freeman, C., Marchini, J., Myers, S., Spencer, C., Stephens, M., Cardon, L. R., Clarke, G., Evans, D. M., Morris, A. P., Weir, B. S., Tsunoda, T., Mullikin, J. C., Sherry, S. T., Feolo, M., Zhang, H. C., Zeng, C. Q., Zhao, H., Matsuda, I., Fukushima, Y., Macer, D. R., Suda, E., Rotimi, C. N., Adebamowo, C. A., Ajayi, I., Aniagwu, T., Marshall, P. A., Nkwodimmah, C., Royal, C. D. M., Leppert, M. F., Dixon, M., Peiffer, A., Qiu, R. Z., Kent, A., Kato, K., Niikawa, N., Adewole, I. F., Knoppers, B. M., Foster, M. W., Clayton, E. W., Muzny, D., Nazareth, L., Sodergren, E., Weinstock, G. M., Wheeler, D. A., Yakub, I., Gabriel, S. B., Richter, D. J., Ziaugra, L., Birren, B. W., Wilson, R. K., Fulton, L. L., Rogers, J., Burton, J., Carter, N. P., Clee, C. M., Griffiths, M., Jones, M. C., McLay, K., Plumb, R. W., Ross, M. T., Sims, S. K., Willey, D. L., Chen, Z., Han, H., Kang, L., Godbout, M., Wallenburg, J. C., Archeveque, P. L., Bellemare, G., Saeki, K., Wang, H. G., An, D. C., Fu, H. B., Li, Q., Wang, Z., Wang, R. W., Holden, A. L., Brooks, L. D., McEwen, J. E., Bird, C. R., Guyer, M. S., Nailer, P. J., Wang, V. O., Peterson, J. L., Shi, M., Spiegel, J., Sung, L. M., Witonsky, J., Zacharia, L. F., Kennedy, K., Jamieson, R., Stewart, J., and the International HapMap Consortium. (2005). A haplotype map of the human genome. Nature 437, 1299–1320.
Beaulieu, C. (2002). The basis of anisotropic water diffusion in the nervous system – a technical review. NMR Biomed. 15, 433–455.
Benjamini, Y., and Hochberg, Y. (1995). Controlling the false discovery rate: a practical and powerful approach to multiple testing. J. R. Stat. Soc. Series B Stat. Methodol. 57, 289–300.
Bovelstad, H. M., Nygard, S., Storvold, H. L., Aldrin, M., Borgan, O., Frigessi, A., and Lingjaerde, O. C. (2007). Predicting survival from microarray data – a comparative study. Bioinformatics 23, 2080–2087.
Bralten, J., Arias-Vasquez, A., Makkinje, R., Veltman, J. A., Brunner, H. G., Fernandez, G., Rijpkema, M., and Franke, B. (2011). Association of the Alzheimer’s gene SORL1 with hippocampal volume in young, healthy adults. Am. J. Psychiatry 168, 1083–1089.
Braskie, M. N., Jahanshad, N., Stein, J. L., Barysheva, M., McMahon, K. L., de Zubicaray, G. I., Martin, N. G., Wright, M. J., Ringman, J. M., Toga, A. W., and Thompson, P. M. (2011a). Common Alzheimer’s disease risk variant within the CLU gene affects white matter microstructure in young adults. J. Neurosci. 31, 6764–6770.
Braskie, M. N., Ringman, J. M., and Thompson, P. M. (2011b). Neuroimaging measures as endophenotypes in Alzheimer’s disease. Int. J. Alzheimers Dis. 31, 490140.
Cantor, R. M., Lange, K., and Sinsheimer, J. S. (2010). Prioritizing GWAS results: a review of statistical methods and recommendations for their application. Am. J. Hum. Genet. 86, 6–22.
Chen, L. S., Hutter, C. M., Potter, J. D., Liu, Y., Prentice, R. L., Peters, U., and Hsu, L. (2010). Insights into colon cancer etiology via a regularized approach to gene set analysis of GWAS data. Am. J. Hum. Genet. 86, 860–871.
Chiang, M. C., Barysheva, M., Shattuck, D. W., Lee, A. D., Madsen, S. K., Avedissian, C., Klunder, A. D., Toga, A. W., McMahon, K. L., de Zubicaray, G. I., Wright, M. J., Srivastava, A., Balov, N., and Thompson, P. M. (2009). Genetics of brain fiber architecture and intellectual performance. J. Neurosci. 29, 2212–2224.
Chiang, M. C., Barysheva, M., Toga, A. W., Medland, S. E., Hansell, N. K., James, M. R., McMahon, K. L., de Zubicaray, G. I., Martin, N. G., Wright, M. J., and Thompson, P. M. (2011a). BDNF gene effects on brain circuitry replicated in 455 twins. Neuroimage 55, 448–454.
Chiang, M. C., Barysheva, M., McMahon, K. L., de Zubicaray, G. I., Johnson, K., Martin, N. G., Toga, A. W., Wright, M. J., and Thompson, P. M. (2011b). “Hierarchical clustering of the genetic connectivity matrix reveals the network topology of gene action on brain microstructure: an N=531 twin study,” in International Workshop on Biomedical Imaging (ISBI), Chicago, IL, 832–835.
Cho, S., Kim, H., Oh, S., Kim, K., and Park, T. (2009). Elastic-net regularization approaches for genome-wide association studies of rheumatoid arthritis. BMC Proc. 15, S7–S25. PMID: 20018015.
Chumbley, J., Worsley, K., Flandin, G., and Friston, K. (2010). Topological FDR for neuroimaging. Neuroimage 49, 3057–3064.
Cruz, J. A., and Wishart, D. S. (2007). Applications of machine learning in cancer prediction and prognosis. Cancer Inform. 2, 59–77.
de Bakker, P. I., Ferreira, M. A., Jia, X., Neale, B. M., Raychaudhuri, S., and Voight, B. F. (2008). Practical aspects of imputation-driven meta-analysis of genome-wide association studies. Hum. Mol. Genet. 17, R122–R128.
Efron, B., Hastie, T., Johnstone, I., and Tibshirani, R. (2004). Least angle regression. Ann. Stat. 32, 407–451.
Ewens, W. J., and Grant, G. (2001). Statistical Methods in Bioinformatics: An Introduction. New York: Springer.
Fan, J. Q., and Lv, J. C. (2008). Sure independence screening for ultrahigh dimensional feature space. J. R. Stat. Soc. Series B Stat. Methodol. 70, 849–883.
Fan, J. Q., and Song, R. (2010). Sure independence screening in generalized linear models with Np-dimensionality. Ann. Stat. 38, 3567–3604.
Fischl, B., Salat, D. H., Busa, E., Albert, M., Dieterich, M., Haselgrove, C., Van Der Kouwe, A., Killiany, R., Kennedy, D., Klaveness, S., Montillo, A., Makris, N., Rosen, B., and Dale, A. M. (2002). Whole brain segmentation: automated labeling of neuroanatomical structures in the human brain. Neuron 33, 341–355.
Frayling, T. M., Timpson, N. J., Weedon, M. N., Zeggini, E., Freathy, R. M., Lindgren, C. M., Perry, J. R., Elliott, K. S., Lango, H., Rayner, N. W., Shields, B., Harries, L. W., Barrett, J. C., Ellard, S., Groves, C. J., Knight, B., Patch, A. M., Ness, A. R., Ebrahim, S., Lawlor, D. A., Ring, S. M., Ben-Shlomo, Y., Jarvelin, M. R., Sovio, U., Bennett, A. J., Melzer, D., Ferrucci, L., Loos, R. J., Barroso, I., Wareham, N. J., Karpe, F., Owen, K. R., Cardon, L. R., Walker, M., Hitman, G. A., Palmer, C. N., Doney, A. S., Morris, A. D., Smith, G. D., Hattersley, A. T., and McCarthy, M. I. (2007). A common variant in the FTO gene is associated with body mass index and predisposes to childhood and adult obesity. Science 316, 889–894.
Frazer, K. A., Ballinger, D. G., Cox, D. R., Hinds, D. A., Stuve, L. L., Gibbs, R. A., Belmont, J. W., Boudreau, A., Hardenbol, P., Leal, S. M., Pasternak, S., Wheeler, D. A., Willis, T. D., Yu, F., Yang, H., Zeng, C., Gao, Y., Hu, H., Hu, W., Li, C., Lin, W., Liu, S., Pan, H., Tang, X., Wang, J., Wang, W., Yu, J., Zhang, B., Zhang, Q., Zhao, H., Zhou, J., Gabriel, S. B., Barry, R., Blumenstiel, B., Camargo, A., Defelice, M., Faggart, M., Goyette, M., Gupta, S., Moore, J., Nguyen, H., Onofrio, R. C., Parkin, M., Roy, J., Stahl, E., Winchester, E., Ziaugra, L., Altshuler, D., Shen, Y., Yao, Z., Huang, W., Chu, X., He, Y., Jin, L., Liu, Y., Sun, W., Wang, H., Wang, Y., Xiong, X., Xu, L., Waye, M. M., Tsui, S. K., Xue, H., Wong, J. T., Galver, L. M., Fan, J. B., Gunderson, K., Murray, S. S., Oliphant, A. R., Chee, M. S., Montpetit, A., Chagnon, F., Ferretti, V., Leboeuf, M., Olivier, J. F., Phillips, M. S., Roumy, S., Sallee, C., Verner, A., Hudson, T. J., Kwok, P. Y., Cai, D., Koboldt, D. C., Miller, R. D., Pawlikowska, L., Taillon-Miller, P., Xiao, M., Tsui, L. C., Mak, W., Song, Y. Q., Tam, P. K., Nakamura, Y., Kawaguchi, T., Kitamoto, T., Morizono, T., Nagashima, A., Ohnishi, Y., Sekine, A., Tanaka, T., Tsunoda, T., Deloukas, P., Bird, C. P., Delgado, M., Dermitzakis, E. T., Gwilliam, R., Hunt, S., Morrison, J., Powell, D., Stranger, B. E., Whittaker, P., Bentley, D. R., Daly, M. J., de Bakker, P. I., Barrett, J., Chretien, Y. R., Maller, J., McCarroll, S., Patterson, N., Pe’er, I., Price, A., Purcell, S., Richter, D. J., Sabeti, P., Saxena, R., Schaffner, S. F., Sham, P. C., Varilly, P., Altshuler, D., Stein, L. D., Krishnan, L., Smith, A. V., Tello-Ruiz, M. K., Thorisson, G. A., Chakravarti, A., Chen, P. E., Cutler, D. J., Kashuk, C. S., Lin, S., Abecasis, G. R., Guan, W., Li, Y., Munro, H. M., Qin, Z. S., Thomas, D. J., McVean, G., Auton, A., Bottolo, L., Cardin, N., Eyheramendy, S., Freeman, C., Marchini, J., Myers, S., Spencer, C., Stephens, M., Donnelly, P., Cardon, L. R., Clarke, G., Evans, D. M., Morris, A. P., Weir, B. S., Tsunoda, T., Mullikin, J. C., Sherry, S. T., Feolo, M., Skol, A., Zhang, H., Zeng, C., Zhao, H., Matsuda, I., Fukushima, Y., Macer, D. R., Suda, E., Rotimi, C. N., Adebamowo, C. A., Ajayi, I., Aniagwu, T., Marshall, P. A., Nkwodimmah, C., Royal, C. D., Leppert, M. F., Dixon, M., Peiffer, A., Qiu, R., Kent, A., Kato, K., Niikawa, N., Adewole, I. F., Knoppers, B. M., Foster, M. W., Clayton, E. W., Watkin, J., Gibbs, R. A., Belmont, J. W., Muzny, D., Nazareth, L., Sodergren, E., Weinstock, G. M., Wheeler, D. A., Yakub, I., Gabriel, S. B., Onofrio, R. C., Richter, D. J., Ziaugra, L., Birren, B. W., Daly, M. J., Altshuler, D., Wilson, R. K., Fulton, L. L., Rogers, J., Burton, J., Carter, N. P., Clee, C. M., Griffiths, M., Jones, M. C., McLay, K., Plumb, R. W., Ross, M. T., Sims, S. K., Willey, D. L., Chen, Z., Han, H., Kang, L., Godbout, M., Wallenburg, J. C., L’Archevêque, P., Bellemare, G., Saeki, K., Wang, H., An, D., Fu, H., Li, Q., Wang, Z., Wang, R., Holden, A. L., Brooks, L. D., McEwen, J. E., Guyer, M. S., Wang, V. O., Peterson, J. L., Shi, M., Spiegel, J., Sung, L. M., Zacharia, L. F., Collins, F. S., Kennedy, K., Jamieson, R., and Stewart, J. (2007). A second generation human haplotype map of over 3.1 million SNPs. Nature 449, 851–861.
Friedman, J., Hastie, T., and Tibshirani, R. (2010). Regularization paths for generalized linear models via coordinate descent. J. Stat. Softw. 33, 1–22.
Gianola, D., Perez-Enciso, M., and Toro, M. A. (2003). On marker-assisted prediction of genetic value: beyond the ridge. Genetics 163, 347–365.
Glahn, D. C., Thompson, P. M., and Blangero, J. (2007). Neuroimaging endophenotypes: strategies for finding genes influencing brain structure and function. Hum. Brain Mapp. 28, 488–501.
Good, C. D., Johnsrude, I. S., Ashburner, J., Henson, R. N., Friston, K. J., and Frackowiak, R. S. (2001). A voxel-based morphometric study of ageing in 465 normal adult human brains. Neuroimage 14, 21–36.
Gottesman, I. I., and Gould, T. D. (2003). The endophenotype concept in psychiatry: etymology and strategic intentions. Am. J. Psychiatry 160, 636–645.
Hall, M. H., and Smoller, J. W. (2010). A new role for endophenotypes in the GWAS era: functional characterization of risk variants. Harv. Rev. Psychiatry 18, 67–74.
Hariri, A. R., Mattay, V. S., Tessitore, A., Kolachana, B., Fera, F., Goldman, D., Egan, M. F., and Weinberger, D. R. (2002). Serotonin transporter genetic variation and the response of the human amygdala. Science 297, 400–403.
He, Q., and Lin, D. Y. (2011). A variable selection method for genome-wide association studies. Bioinformatics 27, 1–8.
Heinz, A., Jones, D. W., Mazzanti, C., Goldman, D., Ragan, P., Hommer, D., Linnoila, M., and Weinberger, D. R. (2000). A relationship between serotonin transporter genotype and in vivo protein expression and alcohol neurotoxicity. Biol. Psychiatry 47, 643–649.
Hemminger, B. M., Saelim, B., and Sullivan, P. F. (2006). TAMAL: an integrated approach to choosing SNPs for genetic studies of human complex traits. Bioinformatics 22, 626–627.
Hibar, D. P., Stein, J. L., Kohannim, O., Jahanshad, N., Saykin, A. J., Shen, L., Kim, S., Pankratz, N., Foroud, T., Huentelman, M. J., Potkin, S. G., Jack, C. R. Jr., Weiner, M. W., Toga, A. W., and Thompson, P. M. (2011). Voxelwise gene-wide association study (vGeneWAS): multivariate gene-based association testing in 731 elderly subjects. Neuroimage 56, 1875–1891.
Hindorff, L. A., Sethupathy, P., Junkins, H. A., Ramos, E. M., Mehta, J. P., Collins, F. S., and Manolio, T. A. (2009). Potential etiologic and functional implications of genome-wide association loci for human diseases and traits. Proc. Natl. Acad. Sci. U.S.A. 106, 9362–9367.
Hinrichs, A. S., Karolchik, D., Baertsch, R., Barber, G. P., Bejerano, G., Clawson, H., Diekhans, M., Furey, T. S., Harte, R. A., Hsu, F., Hillman-Jackson, J., Kuhn, R. M., Pedersen, J. S., Pohl, A., Raney, B. J., Rosenbloom, K. R., Siepel, A., Smith, K. E., Sugnet, C. W., Sultan-Qurraie, A., Thomas, D. J., Trumbower, H., Weber, R. J., Weirauch, M., Zweig, A. S., Haussler, D., and Kent, W. J. (2006). The UCSC genome browser database: update 2006. Nucleic Acids Res. 34, D590–D598.
Ho, A. J., Stein, J. L., Hua, X., Lee, S., Hibar, D. P., Leow, A. D., Dinov, I. D., Toga, A. W., Saykin, A. J., Shen, L., Foroud, T., Pankratz, N., Huentelman, M. J., Craig, D. W., Gerber, J. D., Allen, A. N., Corneveaux, J. J., Stephan, D. A., DeCarli, C. S., DeChairo, B. M., Potkin, S. G., Jack, C. R. Jr., Weiner, M. W., Raji, C. A., Lopez, O. L., Becker, J. T., Carmichael, O. T., Thompson, P. M., and Alzheimer’s Disease Neuroimaging Initiative. (2010). A commonly carried allele of the obesity-related FTO gene is associated with reduced brain volume in the healthy elderly. Proc. Natl. Acad. Sci. U.S.A. 107, 8404–8409.
Hoerl, A. E. (1962). Application of ridge analysis to regression problems. Chem. Eng. Prog. 58, 54–59.
Hoh, J., Wille, A., and Ott, J. (2001). Trimming, weighting, and grouping SNPs in human case-control association studies. Genome Res. 11, 2115–2119.
Ioannidis, J. P. (2005). Why most published research findings are false. PLoS Med. 2, e124. doi: 10.1371/journal.pmed.0020124
Jagannathan, K., Calhoun, V. D., Gelernter, J., Stevens, M. C., Liu, J., Bolognani, F., Windemuth, A., Ruaño, G., Assaf, M., and Pearlson, G. D. (2010). Genetic associations of brain structural networks in schizophrenia: a preliminary study. Biol. Psychiatry 68, 657–666.
Joyner, A. H., Roddey, J. C., Bloss, C. S., Bakken, T. E., Rimol, L. M., Melle, I., Agartz, I., Djurovic, S., Topol, E. J., Schork, N. J., Andreassen, O. A., and Dale, A. M. (2009). A common MECP2 haplotype associates with reduced cortical surface area in humans in two independent populations. Proc. Natl. Acad. Sci. U.S.A. 106, 15483–15488.
Kleinbaum, D. G. (2007). Applied Regression Analysis and Other Multivariable Methods. Belmont, CA: Brooks/Cole.
Kochunov, P., Glahn, D. C., Lancaster, J. L., Winkler, A. M., Smith, S., Thompson, P. M., Almasy, L., Duggirala, R., Fox, P. T., and Blangero, J. (2010). Genetics of microstructure of cerebral white matter using diffusion tensor imaging. Neuroimage 53, 1109–1116.
Kohannim, O., Hibar, D. P., Stein, J. L., Jahanshad, N., Jack, C. R. Jr., Weiner, M. W., Toga, A. W., and Thompson, P. M. (2011a). “Boosting power to detect genetic associations in imaging using multi-locus, genome-wide scans and ridge regression,” International Workshop on Biomedical Imaging (ISBI), Chicago, IL, 1855–1859.
Kohannim, O., Jahanshad, N., Braskie, M. N., Stein, J. L., Chiang, M. C., Reese, A. H., Toga, A. W., McMahon, K. L., de Zubicaray, G. I., Medland, S. E., Montgomery, G. M., Whitfield, J. B., Martin, N. G., Wright, M. W., and Thompson, P. M. (2011b). Personalized prediction of brain fiber integrity in 396 young adults based on genotyping of multiple common genetic variants. Abstr. Soc. Neurosci.
Leow, A., Huang, S. C., Geng, A., Becker, J., Davis, S., Toga, A., and Thompson, P. (2005). Inverse consistent mapping in 3D deformable image registration: its construction and statistical properties. Inf. Process. Med. Imaging 19, 493–503.
Li, Y., Sung, W., and Liu, J. J. (2007). Association mapping via regularized regression analysis of single-nucleotide–polymorphism haplotypes in variable-sized sliding windows. Am. J. Hum. Genet. 80, 705–715.
Lin, Y., Zhang, M., Wang, L., Pungpapong, V., Fleet, J. C., and Zhang, D. (2009). Simultaneous genome-wide association studies of anti-cyclic citrullinated peptide in rheumatoid arthritis using penalized orthogonal-components regression. BMC Proc. 15, S7–S20. PMID: 20018010.
Liu, J., Pearlson, G., Windemuth, A., Ruano, G., Perrone-Bizzozero, N. I., and Calhoun, V. (2009). Combining fMRI and SNP data to investigate connections between brain function and genetics using parallel ICA. Hum. Brain Mapp. 30, 241–255.
Malo, N., Libiger, O., and Schork, N. J. (2008). Accommodating linkage disequilibrium in genetic-association analyses via ridge regression. Am. J. Hum. Genet. 82, 375–385.
Massy, W. F. (1965). Principal components regression in exploratory statistical research. J. Am. Stat. Assoc. 60, 234–256.
McCarthy, M. I., Abecasis, G. R., Cardon, L. R., Goldstein, D. B., Little, J., Ioannidis, J. P., and Hirschhorn, J. N. (2008). Genome-wide association studies for complex traits: consensus, uncertainty and challenges. Nat. Rev. Genet. 9, 356–369.
Meyer-Lindenberg, A., and Weinberger, D. R. (2006). Intermediate phenotypes and genetic mechanisms of psychiatric disorders. Nat. Rev. Neurosci. 7, 818–827.
Munafo, M. R., Brown, S. M., and Hariri, A. R. (2008). Serotonin transporter (5-HTTLPR) genotype and amygdala activation: a meta-analysis. Biol. Psychiatry 63, 852–857.
Pearson, T. A., and Manolio, T. A. (2008). How to interpret a genome-wide association study. JAMA 299, 1335–1344.
Phillips, T. J., and Belknap, J. K. (2002). Complex-trait genetics: emergence of multivariate strategies. Nat. Rev. Neurosci. 3, 478–485.
Potkin, S. G., Guffanti, G., Lakatos, A., Turner, J. A., Kruggel, F., Fallon, J. H., Saykin, A. J., Orro, A., Lupoli, S., Salvi, E., Weiner, M., Macciardi, F., and Alzheimer’s Disease Neuroimaging Initiative. (2009a). Hippocampal atrophy as a quantitative trait in a genome-wide association study identifying novel susceptibility genes for Alzheimer’s disease. PLoS ONE 4, e6501. doi: 10.1371/journal.pone.0006501
Potkin, S. G., Turner, J. A., Fallon, J. A., Lakatos, A., Keator, D. B., Guffanti, G., and Macciardi, F. (2009b). Gene discovery through imaging genetics: identification of two novel genes associated with schizophrenia. Mol. Psychiatry 14, 416–428.
Psychiatric GWAS Consortium Coordinating Committee, Cichon, S., Craddock, N., Daly, M., Faraone, S. V., Gejman, P. V., Kelsoe, J., Lehner, T., Levinson, D. F., Moran, A., Sklar, P., and Sullivan, P. F. (2009). Genomewide association studies: history, rationale, and prospects for psychiatric disorders. Am. J. Psychiatry 166, 540–556.
Purcell, S., Neale, B., Todd-Brown, K., Thomas, L., Ferreira, M. A., Bender, D., Maller, J., Sklar, P., De Bakker, P. I., Daly, M. J., and Sham, P. C. (2007). PLINK: a tool set for whole-genome association and population-based linkage analyses. Am. J. Hum. Genet. 81, 559–575.
Reiman, E. M., Webster, J. A., Myers, A. J., Hardy, J., Dunckley, T., Zismann, V. L., Joshipura, K. D., Pearson, J. V., Hu-Lince, D., Huentelman, M. J., Craig, D. W., Coon, K. D., Liang, W. S., Herbert, R. H., Beach, T., Rohrer, K. C., Zhao, A. S., Leung, D., Bryden, L., Marlowe, L., Kaleem, M., Mastroeni, D., Grover, A., Heward, C. B., Ravid, R., Rogers, J., Hutton, M. L., Melquist, S., Petersen, R. C., Alexander, G. E., Caselli, R. J., Kukull, W., Papassotiropoulos, A., and Stephan, D. A. (2007). GAB2 alleles modify Alzheimer’s risk in APOE epsilon4 carriers. Neuron 54, 713–720.
Shaw, L. M., Korecka, M., Clark, C. M., Lee, V. M., and Trojanowski, J. Q. (2007). Biomarkers of neurodegeneration for diagnosis and monitoring therapeutics. Nat. Rev. Drug Discov. 6, 295–303.
Shen, L., Kim, S., Risacher, S. L., Nho, K., Swaminathan, S., West, J. D., Foroud, T., Pankratz, N., Moore, J. H., Sloan, C. D., Huentelman, M. J., Craig, D. W., Dechairo, B. M., Potkin, S. G., Jack, C. R. Jr., Weiner, M. W., and Saykin, A. J. (2010). Whole genome association study of brain-wide imaging phenotypes for identifying quantitative trait loci in MCI and AD: a study of the ADNI cohort. Neuroimage 53, 1051–1063.
Stein, J. L., Hibar, D. P., Madsen, S. K., Khamis, M., Mcmahon, K. L., De Zubicaray, G. I., Hansell, N. K., Montgomery, G. W., Martin, N. G., Wright, M. J., Saykin, A. J., Jack, C. R. Jr., Weiner, M. W., Toga, A. W., and Thompson, P. M. (2011). Discovery and replication of dopamine-related gene effects on caudate volume in young and elderly populations (N=1198) using genome-wide search. Mol. Psychiatry 16, 927–937.
Stein, J. L., Hua, X., Morra, J. H., Lee, S., Hibar, D. P., Ho, A. J., Leow, A. D., Toga, A. W., Sul, J. H., Kang, H. M., Eskin, E., Saykin, A. J., Shen, L., Foroud, T., Pankratz, N., Huentelman, M. J., Craig, D. W., Gerber, J. D., Allen, A. N., Corneveaux, J. J., Stephan, D. A., Webster, J., DeChairo, B. M., Potkin, S. G., Jack, C. R. Jr., Weiner, M. W., Thompson, P. M., and Alzheimer’s Disease Neuroimaging Initiative. (2010a). Genome-wide analysis reveals novel genes influencing temporal lobe structure with relevance to neurodegeneration in Alzheimer’s disease. Neuroimage 51, 542–554.
Stein, J. L., Hua, X., Lee, S., Ho, A. J., Leow, A. D., Toga, A. W., Saykin, A. J., Shen, L., Foroud, T., Pankratz, N., Huentelman, M. J., Craig, D. W., Gerber, J. D., Allen, A. N., Corneveaux, J. J., Dechairo, B. M., Potkin, S. G., Weiner, M. W., and Thompson, P. (2010b). Voxelwise genome-wide association study (vGWAS). Neuroimage 53, 1160–1174.
The ENIGMA Consortium. (2011). “Genome-wide association meta-analysis of hippocampal volume: results from the ENIGMA Consortium,” in Organization for Human Brain Mapping Conference, Quebec City.
Thomason, M. E., Dougherty, R. F., Colich, N. L., Perry, L. M., Rykhlevskaia, E. I., Louro, H. M., Hallmayer, J. F., Waugh, C. E., Bammer, R., Glover, G. H., and Gotlib, I. H. (2010). COMT genotype affects prefrontal white matter pathways in children and adolescents. Neuroimage 53, 926–934.
Thomason, M. E., and Thompson, P. M. (2011). Diffusion imaging, white matter, and psychopathology. Annu. Rev. Clin. Psychol. 7, 63–85.
Thompson, P. M., Cannon, T. D., Narr, K. L., Van Erp, T., Poutanen, V. P., Huttunen, M., Lonnqvist, J., Standertskjold-Nordenstam, C. G., Kaprio, J., Khaledy, M., Dail, R., Zoumalan, C. I., and Toga, A. W. (2001). Genetic influences on brain structure. Nat. Neurosci. 4, 1253–1258.
Tibshirani, R. (1996). Regression Shrinkage and Selection via the Lasso. J. R. Stat. Soc. Series B Stat. Methodol. 58, 267–288.
Vounou, M., Nichols, T. E., Montana, G., and Alzheimer’s Disease Neuroimaging Initiative. (2010). Discovering genetic associations with high-dimensional neuroimaging phenotypes: a sparse reduced-rank regression approach. Neuroimage 53, 1147–1159.
Wang, K., and Abbott, D. (2008). A principal components regression approach to multilocus genetic association studies. Genet. Epidemiol. 32, 108–118.
Winkler, A. M., Kochunov, P., Blangero, J., Almasy, L., Zilles, K., Fox, P. T., Duggirala, R., and Glahn, D. C. (2010). Cortical thickness or grey matter volume? The importance of selecting the phenotype for imaging genetics studies. Neuroimage 53, 1135–1146.
Yang, J., Benyamin, B., Mcevoy, B. P., Gordon, S., Henders, A. K., Nyholt, D. R., Madden, P. A., Heath, A. C., Martin, N. G., Montgomery, G. W., Goddard, M. E., and Visscher, P. M. (2010). Common SNPs explain a large proportion of the heritability for human height. Nat. Genet. 42, 565–569.
Zeggini, E., and Ioannidis, J. P. (2009). Meta-analysis in genome-wide association studies. Pharmacogenomics 10, 191–201.
Zhang, D., Lin, Y., and Zhang, M. (2009). Penalized orthogonal-components regression for large p small n Data. Electron. J. Stat. 3, 781–796.
Keywords: GWAS, MRI, brain, penalized regression, sparse regression
Citation: Hibar DP, Kohannim O, Stein JL, Chiang M-C and Thompson PM (2011) Multilocus genetic analysis of brain images. Front. Gene. 2:73. doi: 10.3389/fgene.2011.00073
Received: 28 July 2011; Paper pending published: 15 August 2011;
Accepted: 03 October 2011; Published online: 21 October 2011.
Edited by:
Lin S. Chen, The University of Chicago, USAReviewed by:
Li Shen, Indiana University School of Medicine, USADonghui Yan, Fred Hutchinson Cancer Research Center, USA
Hongyuan Cao, The University of Chicago, USA
Copyright: © 2011 Hibar, Kohannim, Stein, Chiang and Thompson. This is an open-access article subject to a non-exclusive license between the authors and Frontiers Media SA, which permits use, distribution and reproduction in other forums, provided the original authors and source are credited and other Frontiers conditions are complied with.
*Correspondence: Paul M. Thompson, Laboratory of Neuro Imaging, Department of Neurology, University of California Los Angeles School of Medicine, Neuroscience Research Building 225E, 635 Charles Young Drive, Los Angeles, CA 90095-1769, USA. e-mail:dGhvbXBzb25AbG9uaS51Y2xhLmVkdQ==
†Derrek P. Hibar and Omid Kohannim have contributed equally to this work.