 Paola Sebastiani1*
 Alberto Riva2
 Monty Montano3
 Phillip Pham4
 Ali Torkamani4
 Eugene Scherba5
 Gary Benson5 Jacqueline N. Milton1 Clinton T. Baldwin6,7 Stacy Andersen8
 Nicholas J. Schork4
 Martin H. Steinberg9
 Thomas T. Perls8*
- 1 Department of Biostatistics, Boston University School of Public Health, Boston, MA, USA
- 2 Department of Molecular Genetics and Microbiology, University of Florida, Gainesville, FL, USA
- 3 Division Infectious Diseases, Department of Medicine, Boston University School of Medicine, Boston, MA, USA
- 4 The Scripps Research Institute and the Scripps Translational Science Institute, La Jolla, CA, USA
- 5 Department of Computer Science, Boston University, Boston, MA, USA
- 6 Department of Medicine, Boston Medical Center, Boston University School of Medicine, Boston, MA, USA
- 7 Department of Pediatrics, Boston Medical Center, Boston University School of Medicine, Boston, MA, USA
- 8 Geriatrics Section, Department of Medicine, Boston Medical Center, Boston University School of Medicine, Boston, MA, USA
- 9 Hematology Division, Department of Medicine, Boston Medical Center, Boston University School of Medicine, Boston, MA, USA
Supercentenarians (age 110+ years old) generally delay or escape age-related diseases and disability well beyond the age of 100 and this exceptional survival is likely to be influenced by a genetic predisposition that includes both common and rare genetic variants. In this report, we describe the complete genomic sequences of male and female supercentenarians, both age >114 years old. We show that: (1) the sequence variant spectrum of these two individuals’ DNA sequences is largely comparable to existing non-supercentenarian genomes; (2) the two individuals do not appear to carry most of the well-established human longevity enabling variants already reported in the literature; (3) they have a comparable number of known disease-associated variants relative to most human genomes sequenced to-date; (4) approximately 1% of the variants these individuals possess are novel and may point to new genes involved in exceptional longevity; and (5) both individuals are enriched for coding variants near longevity-associated variants that we discovered through a large genome-wide association study. These analyses suggest that there are both common and rare longevity-associated variants that may counter the effects of disease-predisposing variants and extend lifespan. The continued analysis of the genomes of these and other rare individuals who have survived to extremely old ages should provide insight into the processes that contribute to the maintenance of health during extreme aging.
Introduction
Human aging is affected by genes, life style, and environmental factors. The genetic contribution to average human aging can be modest with genes explaining ∼20–25% of the variability of human survival to the mid-eighties (Herskind et al., 1996; Fraser and Shavlik, 2001). By contrast, genetic factors may have greater impact on survival to the ninth through eleventh decades (Tan et al., 2008). Notably, exceptional longevity is rare and may involve biological mechanisms that differ from those implicated in usual human aging.
The nature and contribution of genetic variation to exceptional longevity remains unclear, particularly the role for undiscovered rare genetic variants with large effects and/or the presence of many common genetic variants with small effects (Bloss et al., 2010). Exceptional longevity is typically characterized by strong familiality (Perls et al., 2000, 2002; Atzmon et al., 2005; Schoenmaker et al., 2006) as well as a marked delay in disability (Terry et al., 2008) and, as human lifespan is approached at about age 110 years, many such individuals compress not only disability but also age-related diseases (Andersen et al., 2011). Studies of centenarians have provided strong evidence to support the hypothesis that a genetic contribution to human exceptional longevity is decisive, although only a small number of genetic variants with modest effects have been irrefutably linked to this phenotype (Schachter et al., 1994; Barzilai et al., 2003; Christensen et al., 2006; Wheeler and Kim, 2011). The technology of next generation sequencing provides a tool to generate data that may eventually provide an answer (Metzker, 2009).
In this report, we describe the complete DNA sequences of two supercentenarians, a male and a female, both ages >114 years old. Although these data cannot provide conclusive evidence about the genetic determination of human exceptional longevity, they are the first step toward the generation of a comprehensive reference panel of exceptionally long-lived individuals. The data also provide interesting insights into genetic backgrounds that are conducive to exceptional longevity and allow us to test different models of exceptional longevity.
Results
Subjects’ Characteristics
Figure 1 shows some of the characteristics of the two subjects, PG17 (female) and PG26 (male). We are purposefully vague about the exact ages of these individuals to maintain their confidentiality and decrease the risk of their being identified. Both individuals were Caucasians enrolled in the New England Centenarian Study (NECS), and were reassessed annually until their deaths (Andersen et al., 2011). Their European ancestry was verified by genome-wide principal component analysis. They were selected for our sequencing study because of their exceptional lifespans and health histories, and the extreme delays in the ages of onset of disability that they exhibited. The bottom panel of Figure 1 shows the average scores of cognitive and physical functions of the female (PG17) and the male (PG26) relative to trajectories of cognitive and functional declines that we generated using longitudinal data of more than 1,300 centenarians and their nonagenarian siblings (Andersen et al., 2011). While the decline of physical function of the female matches the average trend of supercentenarians enrolled in the NECS (n = 104), the male maintained functional independence until at least the last 6 months of his life. The average Blessed Information–Memory–Concentration Test scores (measures of cognitive function) of both subjects were higher than the average of the NECS supercentenarian sample, until their deaths. The man had substantial longevity in his family; 25% of his siblings lived past the age of 100 and 50% lived past the age of 90 years. Unfortunately we did not have complete information about the family history of the woman.
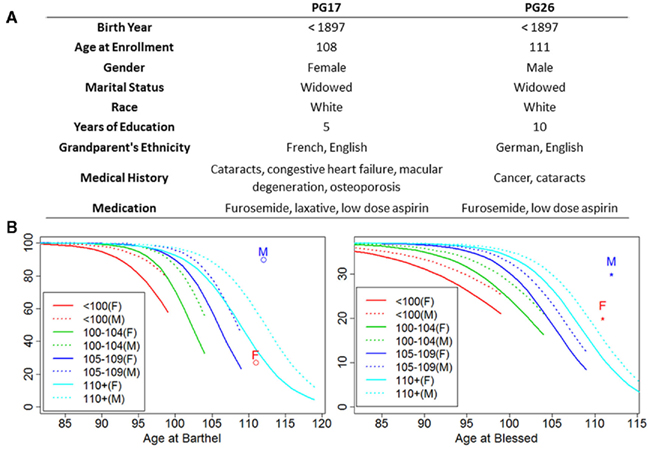
Figure 1. Summary of patients’ characteristics. (A) The woman (PG17) had no medical history other than the births of her children until her early nineties when she had cataracts removed. She did not develop the listed diseases until the last few years of her life. Except for the surgically cured obstructing but non-metastatic colon cancer in his seventies, the man (PG26) was exceptionally healthy until the last year of his life. Ancestry was confirmed by genome-wide PCA analysis. (B) Average functional and cognitive status of the two subjects relative to other NECS subjects (M = PG26 and F = PG17). The trajectories of physical and cognitive functional declines were computed using Bayesian logistic regression of Barthel and Blessed score as explained in Andersen et al. (2011) and for each age group they are truncated by the maximum age for their defined age ranges (e.g., 99 years for nonagenarians, 104 for centenarians, 109 for semi-supercentenarians, and 119 for supercentenarians).
Description of the DNA Sequencing
DNA from both individuals was sequenced using the Illumina Genome Analyzer II by Illumina’s Clinical Laboratory Service, using paired-end reads of 100 bp producing 1,650,463,996 reads for the woman and 1,804,595,182 reads for the man. Reads were mapped to the genome reference NCBI36 and NCBI37 using the procedures described in Figure A1 in Appendix. Both reference genomes were used because some databases have not yet completed the transition to NCBI37. The Eland aligner (Bentley et al., 2008) mapped more than 75% of the reads for the woman and more than 79% of the reads for the man with 95–96% rates of genome coverage. Both the rates of mapped reads and genome coverage are comparable to others reports (Wang et al., 2008; Kim et al., 2009). The average depth of coverage was 36 for the woman and 43 for the man (Table A1 in Appendix) and it was higher than the average of 30× recommended by the manufacturer1. We also used the BWA aligner (Li and Durbin, 2009) with more relaxed thresholds on the number of allowed mismatched per read, and aligned 1,334,406,235 reads for the woman (80.85%), 1,559,315,652 reads for the man (86.41%) and reached 99% genome coverage. Average depth of coverage with BWA was 47 for the woman and 55 for the man. The results from the two aligners were used for variant calling as explained next.
Variant Calling (SNPs and Indels)
Single nucleotide polymorphisms (SNPs) were called using the Illumina CASAVA (Bentley et al., 2008) software and SAMTools (Li et al., 2009). The CASAVA algorithm called 3,334,819 SNPs for the woman and 3,476,407 SNPs for the man, while SAMTools called 3,613,388 SNPs for the woman and 3,659,978 for the man. 3,084,838 SNPs for the woman and 3,255,051 SNPs for the man were called by both SNP callers with >99% concordant genotype calls, and these SNPs were used in all subsequent analyses (Figure 2A). The use of concordant SNP calls between the two methods does risk limiting the true SNP discovery rate but minimizes the false discovery rate and also helps remove low quality SNP calls. Figure A2A in Appendix displays the number of SNPs by chromosome called by both SNP callers. The male subject had a consistently larger number of SNPs than the female subject in each chromosome, with the exception of chromosome X. Figure A2B in Appendix displays the distribution of Phred scores calculated with SAMTools for the SNPs with consensus call. Figure A2C in Appendix displays the distribution of reads coverage used for SNP calling with CASAVA for the SNPs with consensus call. Both Figures A2B,C in Appendix show high quality SNPs.
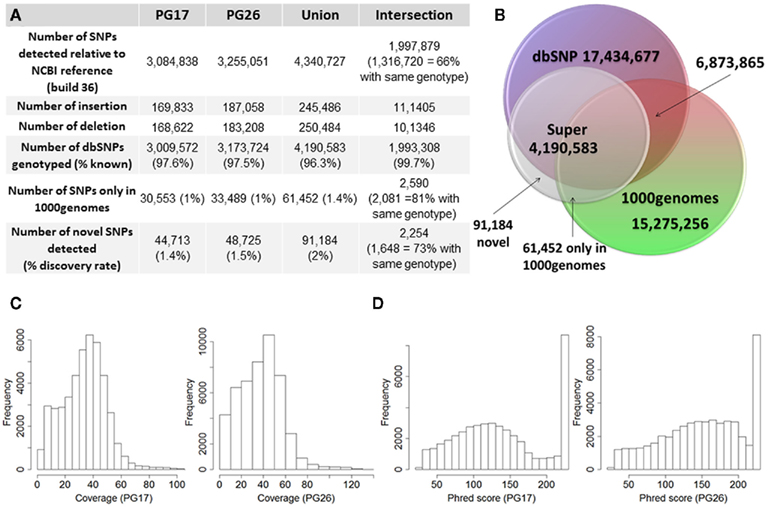
Figure 2. (A) Summary of SNPs and small insertions and deletions (Indels) detected in the two sequences, their union and intersection. The January 2011 release of the 1000 Genomes was used to compare the SNPs detected in the two sequences that were not found in dbSNP. (B) Venn diagram that illustrates the proportion of known and novel SNPs in the woman (PG17) and man (PG26) combined. (C) Distribution of effective coverage (reads used to call genotypes in CASAVA) for novel SNPs. (D) Distribution of Phred scores for the novel SNPs. The Phred scores were computed with BWA/SAMTools.
The two subjects shared 1,997,897 SNPs, and 66% of these SNPs had the same genotypes (Figure 2A). Comparison with dbSNP 132 and the 1000 Genomes database2 showed that 97.6 and 97.5% of SNPs in the female and the male subjects were in dbSNP, and up to 99.7% of the SNPs in common between the two subjects were in dbSNP. Only 1% of the SNPs in both individuals’ sequences were reported in the 1000 Genomes database but not in dbSNP, and 2,590 of these SNPs were shared between the two subjects, 81% of which with the same genotypes. 44,713 SNPs in the woman and 48,725 SNPs in the man were neither in dbSNP nor in the 1000 Genomes database, and were therefore labeled “novel.” Only 2,254 of these novel SNPs were shared between the two subjects, and 73% of these were called with the same genotypes. Figure 2 summarizes these findings. The decreasing trend of shared SNPs that were either in the 1000 Genomes database or novel is consistent with these SNPs being rare in the population.
The number of called SNPs in the man and the fraction of novel SNPs in both subjects were consistent with the projections made by The 1000 Genomes Project Consortium (2010). The number of SNPs in the woman was smaller than the expected 3.3 million, and to investigate this issue further, we used SNP array data generated with the Illumina 610 array to describe the genome-wide structure of chromosomal alterations in the woman. The analysis showed that her genome was characterized by significant stretches of homozygosity across many chromosomes (Figure A3 in Appendix). These runs of homozygosity might be consistent with inbreeding amongst her ancestors (Nalls et al., 2009). The same analysis in the man showed no similar stretches of homozygosity (Figure A4 in Appendix).
For additional assessment of the quality of the data, we computed the concordance between genotype calls in the sequences of the two subjects and their SNP array data. For both subjects, the concordance between genotype calls of SNPs in the array and SNPs in the sequences was >99.7%. In addition, more than 98% of the SNPs in the array not included in the list of called SNPs from the sequencing were homozygous for the referent allele. Transition to transversion ratios (2.11 in the man and 2.07 in the woman) were consistent with the expected number in Caucasians (Ebersberger et al., 2002), and comparable to other Caucasian genomes (see Tables A2–A4 in Appendix; Drmanac et al., 2009; The 1000 Genomes Project Consortium, 2010) and also to genomes from other racial groups (Wang et al., 2008; Kim et al., 2009; Moore et al., 2011). The transition to transversion ratio of the novel SNPs was comparable to the whole set (2.12 in the woman and 2.05 in the man), while the transition to transversion ratio in the SNPs that were reported only in the 1000 Genomes was slightly higher (Table A4 in Appendix). The rates of heterozygous to homozygous genotypes were 1.41 in the man and 1.24 in the woman. While the heterozygous to homozygous genotypes ratio of the woman was identical to that found in the whole genome sequence of Craig Venter (Levy et al., 2007; Table A3 in Appendix), the heterozygote to homozygote ratio in the man was higher but comparable to values in other whole genome sequences (Moore et al., 2011). The heterozygous to homozygous ratio of novel SNPs ranged between 6.3 and 9.2, while the heterozygous to homozygous ratio of SNPs discovered in the 1000 Genomes was 7.12 in the woman and 14.6 in the man. This higher ratio is consistent with novel SNPs being much rarer. Figure A5, A6 in Appendix show that these rates are robust to different thresholds for depth of coverage.
We used both SAMTools and Dindel (Albers et al., 2011) to call small insertions and deletions (Indels) as described in the Methods, and selected only those indels that were detected by both algorithms, had a Phred score of 30 or higher, and passed the default quality filters in Dindel. Figure A7 in Appendix shows the distribution of coverage and Phred scores for the Indels that passed the quality control filters. Both subjects were carriers of a number of insertions and deletions that is comparable to other published results of Caucasian genomes (Table A4 in Appendix).
Functional Annotation
We used a suite of bioinformatics tools assembled and built by researchers at The Scripps Research Institute (Torkamani et al., 2011) to characterize SNPs and Indels by location, functional role, and predicted impact. Figure 3A gives a summary of SNP locations and functional roles. Approximately 37% of the positions where the two subjects differed from the reference genome were in protein coding genes, but only about 2% of these positions were coding SNPs, and less than 50% of these coding SNPs were non-synonymous or missense variants. The rate of non-synonymous SNPs in coding regions was similar to other genomes (Figure 3B). The rate of coding SNPs was comparable to the average rate in nine European ancestry whole genome sequences generated at Complete Genomics (unpublished data provided to author Nicholas J. Schork but available for download at: http://www.completegenomics.com/sequence-data/download-data/) and higher than the rate observed in the whole genome of Venter or non-Caucasian genomes (AK, CH, and YRI) based on published data (Figure 3B and Kim et al., 2009). The distribution of types of coding variants was not different from the nine Complete Genomics genomes that were annotated in the same manner (Figures 3C,D). The inferred rates of SNPs with deleterious effects were also not different from the rates noted in the nine whole genomes sequences (Figure 3E). We conducted a similar analysis of small insertions and deletions and the results are summarized in Figures A8 and A9 in Appendix.
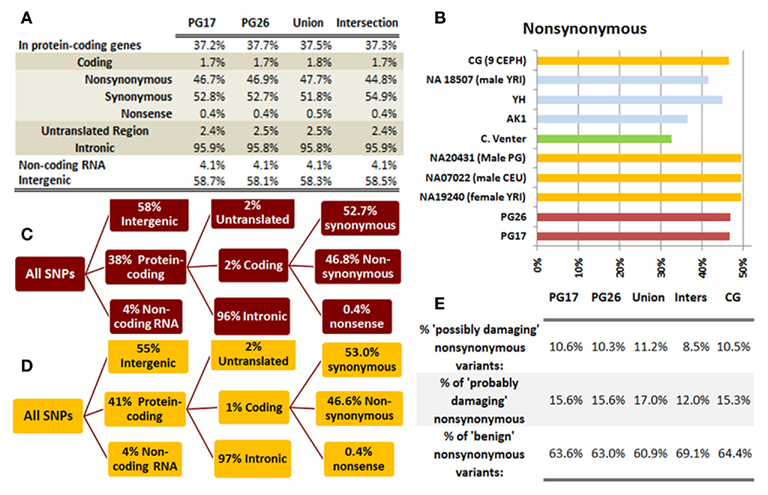
Figure 3. (A) functional annotation of SNPs in PG17 (female), PG26 (male), their union and intersection. Multiple transcripts of the same genes were counted individually. (B) Rate of non-synonymous SNPs in coding SNPs in PG17 and PG26 (brown) and other whole genome sequences generated at Complete Genomics (orange), Sanger (green), and Illumina (blue). CG (9 CEPH) is the average rate of non-synonymous SNPs in nine whole genome sequences generated at Complete Genomics. The rates of non-synonymous SNPs in Venter (green), AK, CH, and YRI (blue) are from publications (see Table A2 in Appendix for references). (C,D) Compare the distribution of SNPs locations and role in PG17 and PG26 (brown) and nine whole genome sequences generated at Complete Genomics (orange). (E) Provides a summary of the predicted impact of coding SNPs in PG17, PG26, their union and intersection, and the summary in nine Caucasians genotyped at complete genomics and annotated in the same way as PG17 and PG26.
Different Genetic Models of Exceptional Longevity
We used the whole genome sequences of these two subjects to test different hypotheses about the genetics of exceptional longevity. These non-exclusive hypotheses and the results of the analyses are described in the sections that follow.
Hypothesis 1: the “metabolic” hypothesis
Genes involved in the insulin pathway (Guarente and Kenyon, 2000; Kops et al., 2002; Bonafe et al., 2003; Holzenberger et al., 2003; Lee et al., 2003; Kojima et al., 2004; Al-Regaiey et al., 2005; Arai et al., 2008; Suh et al., 2008; Willcox et al., 2008; Pawlikowska et al., 2009), caloric restriction (Kuro-o et al., 1997; Vaziri et al., 2001; Arking et al., 2002; Chua et al., 2005; Kurosu et al., 2005; Kuningas et al., 2007), and lipid metabolism (Barzilai et al., 2003, 2006) have notable impacts upon lifespan and therefore have been a natural focus for consideration in investigating the genetic basis of exceptional longevity. We compiled a table of 16 variants that have been associated with exceptional longevity in candidate gene studies based on evidence from animal models of aging and related pathways (Table 1). This compilation was not intended to be comprehensive, but rather an initial attempt at testing the hypothesis. The entire sequences of the two subjects will be posted on dbGaP3 so that investigators can investigate other candidate genes, especially those that receive attention in the future after our analyses have been published.
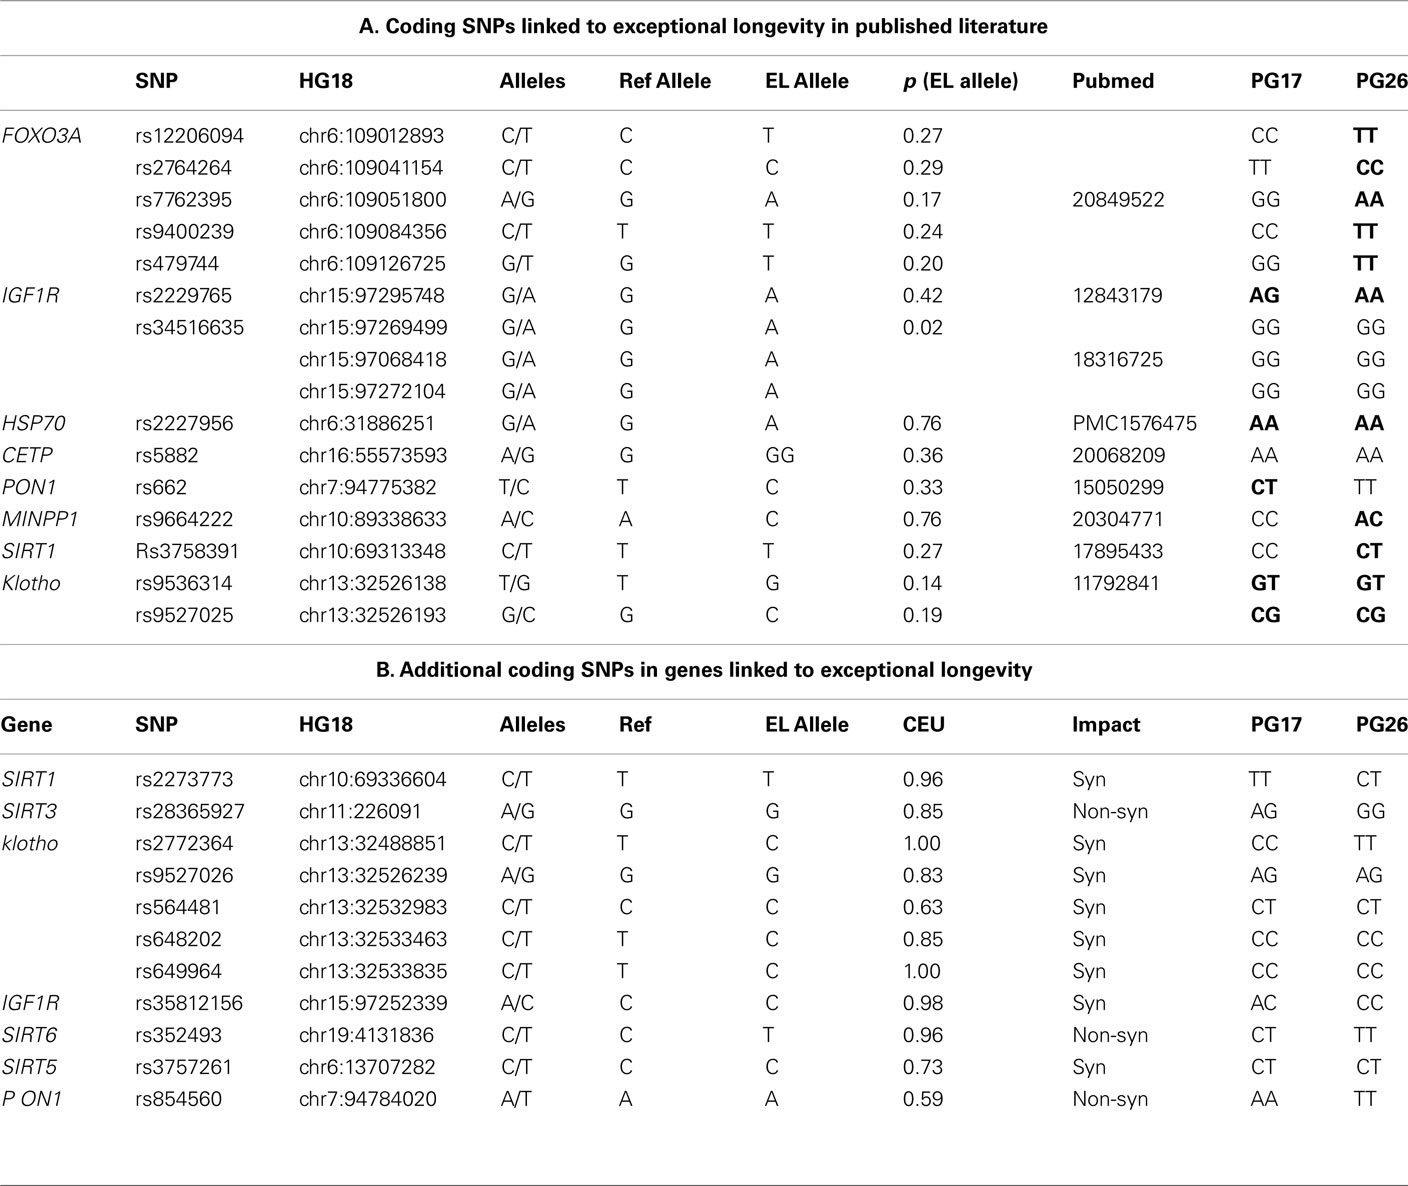
Table 1. (A) List of SNPs that were linked to aging and exceptional longevity in the literature based on candidate gene studies and/or animal models. Columns 5–7 define the referent allele (Ref Allele), the allele that was associated with longevity (EL Allele), and the frequency of the longevity allele in Caucasians from dbSNP. Boldface highlights genotypes with one or more longevity variants. (B) All additional coding SNPs in the list of candidate genes in which PG17 or PG26 carry non-referent alleles. Column 7 (CEU) reports the frequency of the referent alleles in Caucasians from dbSNP.
The woman was homozygous for only one of the 16 longevity variants (allele A of rs2227956 in HSP70), and heterozygous for 4 others. The man was homozygous for seven longevity variants and heterozygous for four. Neither of the two sequences carried the longevity-associated variant of CETP that was found in Ashkenazi Jewish centenarians (Barzilai et al., 2003). The man carried a cluster of longevity variants in FOXO3A, but the woman did not, and only one longevity variant in IGF1R was found in both subjects. Both carried the same genotypes of rs9536314 and rs9527025 in KL. We also examined additional coding SNPs in the candidate genes in which the two subjects carried different alleles from the reference genome (Table 1). Eleven additional SNPs were found in metabolic genes (IGF1R, Sirtuins genes, KL, and PON1) but no additional SNPs were found in FOXO3A. All of the variants in Table 1 carried by PG17 and PG26 were common in Caucasians, with the exclusion of the T allele of SNP rs2772364 in KL in the man. Whether these additional SNPs are present in the cited studies but were not reported is unknown. The different genetic profiles of these candidate genes in the two supercentenarians suggest that even if the variants in Table 1 may have a role in longevity they are not critical to exceptional longevity in all humans. Additionally, the impact of these variants must be considered within the context of other as of yet undiscovered longevity- and disease-associated variants.
Hypothesis 2: the lack of disease-associated variants hypothesis
As noted earlier, both subjects markedly delayed both disability and age-related diseases until very late in their lives. We tested the hypothesis that these two whole genome sequences did not include disease-predisposing variants or, if they did, the number was significantly lower compared to currently available genomes. We compiled a list of 62,339 disease-annotated variants from the Human Genome Mutation Database (HGMD@; Stenson et al., 2009), which are mainly rare variants, and the NHGRI GWAS catalog (Hindorff et al., 2011), which contains both rare and common disease-associated variants. This list included 100 variants with presumed protective effects, and 62,239 with presumed deleterious effects. We then assessed how many of these disease variants were in the two sequences. Table S1 in Supplementary Material reports the list of disease-annotated variants in each subject.
Figure 4A shows that while the two sequences include only 1% of mutations from the HGMD, they include approximately 50% of the mutations that were linked to common diseases in genome-wide association studies. More than 50% of all the noted mutations were heterozygous, but this number was smaller when we only considered coding mutations from the HGMD. Figure 4B shows the breakdown of these variants by disease group and by role: (1) either damaging, if they are associated with increased risk for disease, or (2) protective if the mutations are known to decrease disease risk relative to the general population. Only 1% of known disease-annotated mutations in the woman were protective, while 2% of known disease-annotated mutations in the man were protective. The woman carried at least 30 mutations that were linked to Alzheimer’s disease and amyotrophic lateral sclerosis and one mutation linked to decreased risk for Alzheimer’s disease (CT genotype for rs2736911 in ARMS2, Gatta et al., 2008), 201 mutations associated with cancer, including 27 associated with increased risk for breast cancer and one mutation with reduced risk for breast cancer (GG genotype of rs2295283 in MIIP; Song et al., 2010), 44 associated with lung cancer, and 30 associated with colorectal cancer. She also carried 52 mutations associated with heart disease, 136 associated with diabetes, 12 linked to macular degeneration that she was diagnosed with after the age of 100 years. The man carried 37 mutations associated with increased risk for colon cancer, including several mutations in EXO1. Indeed, he presented with an obstructing colon cancer (adenocarcinoma) in his mid-seventies that was cured by surgical resection but amazingly there were no metastases despite the size of the obstructing mass. His load of disease-predisposing variants was comparable to the female subject. For example, he had 44 mutations associated with lung cancer, and 33 mutations associated with Parkinson’s disease. Regarding the APOE alleles, the male subject was heterozygous for SNP rs7412 in APOE and homozygous TT for SNPrs429358 in APOE and therefore he carried the ε2/ε3 alleles of APOE that are considered at less risk for Alzheimer’s disease. The woman was homozygous for both rs7412 and rs429358, and therefore she carried ε3/ε3 alleles of APOE which is considered the neutral allele.
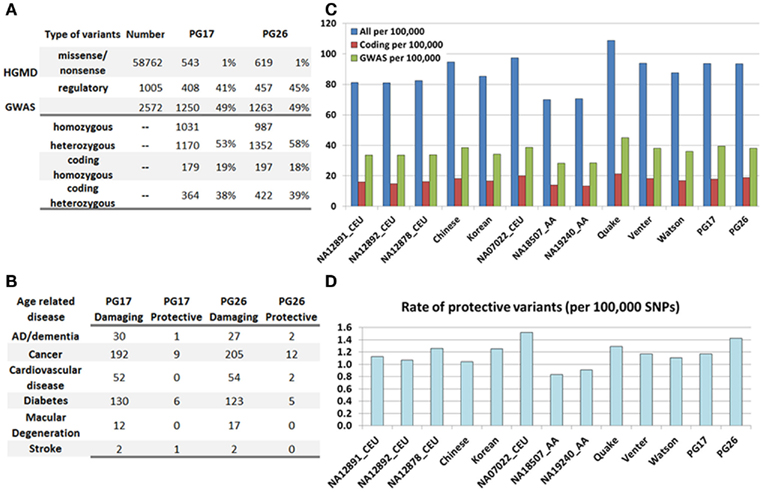
Figure 4. (A) Summary of SNPs associated with disease in the HGMD and the GWAS catalog, and number of these SNPs and rates found in PG17 and PG26. (B) Number of SNPs in PG17 and PG26 that have either a known protective or deleterious role in major age-related diseases. (C) The bar plot shows the rate of disease-annotated variants in PG17 and PG26 and 11 other whole genome sequences. We did not include in this analysis the genomes of NA12878 and NA18507 that were sequenced with SOLID. Blue: all SNPs from HGMD and GWAS; red: only coding SNPs from HGMD; green: only SNPs from GWAS. Rates are per 100,000 SNPs. (D). Rate of protective variants in PG17 and PG26 and 11 other whole genome sequences. The major difference seems to be race related rather than subject related.
The bar plot in Figure 4C shows the rate of disease-associated variants in both subjects and 11 additional genomes described in Moore et al. (2011) and The 1000 Genomes Project Consortium (2010), normalized to the overall number of variants used in each genome. Although the actual number of variants may depend on the sequencing technology and mapping algorithm, the rates normalized to the overall number of called SNPs should allow for relative comparisons. We observed no reduction in the rate of disease-annotated variants in the woman and man compared to the Venter and Watson genomes, and even higher rates compared to the high coverage trio of Caucasians included in the 1000 Genomes project (NA12891, NA12892, and NA12878). The major differences appear to be race-specific, with subjects of African ancestry carrying a smaller rate of disease-annotated variants (either protective or damaging) compared to Asians and Caucasians. These differences may be ancestral differences or they might reflect the better knowledge of genetic variants in Caucasians (Lohmueller et al., 2008). We also examined the rate of protective variants in the 13 genomes (Figure 4D) and, although the rate of known protective variants in PG26 was higher than in PG17, it was smaller than in NA07022. The genome of NA07022 was sequenced at Complete Genomics and the overall number of called variants was similar to that found in PG26 (Table A4 in Appendix).
Overall, the two subjects carried 403 disease-associated variants with the same genotype (Table S1 in Supplementary Material), but only 209 of these were coding variants, and in only 76 of these positions the two sequences were homozygous for the risk allele. For example, both subjects were CC homozygotes for rs222859 (YBX2, chromosome 17). This gene is associated with male infertility, and the male subject did not have children (but we have no additional information). Both subjects were homozygous for the A allele of rs4880 in SOD2. The alternative allele G is a missense mutation that changes the amino acid valine to alanine. The common allele A has been associated with increased oxidative stress that should act negatively on lifespan, and increased risk for cardiovascular disease and susceptibility to cancer (Bastaki et al., 2006). However, there is conflicting evidence about the role of this SNP with some studies that show a protective effect of the A allele in specific genetic backgrounds4. Similarly, the two subjects carried the same heterozygous genotype for SNP rs4641 in LMNA and the same homozygous genotype GG for SNP rs1801195 in WRN. The LMNA gene, which encodes the nuclear envelope proteins lamin A and lamin C, has been associated with the progeroid (premature aging-like) syndrome, Hutchinson–Gilford syndrome (Eriksson et al., 2003). Although the T allele of rs4641 was associated with increased fat mass in elderly twins and increased risk for diabetes, the increased fat mass may be associated with decreased muscle wasting at older ages (Wegner et al., 2010). The WRN gene is a DNA helicase and exonuclease that plays a role in DNA repair and another progeroid syndrome, Werner’s Syndrome (Gray et al., 1997). SNP rs1801195 was associated with decreased risk for myocardial infarction.
This analysis shows that the two supercentenarians did not carry a smaller rate of disease-associated variants compared to other genomes.
Hypothesis 3: the rare variants hypothesis
One of the explanations for the small number of genetic variants irrefutably linked to exceptional longevity (Schachter et al., 1994; Barzilai et al., 2003; Christensen et al., 2006) is that rare or private mutations shared in families may be the major genetic determinants of this phenotype (Wheeler and Kim, 2011). To test this hypothesis, we characterized the novel mutations in these two supercentenarians in terms of functional role and possible links to age-related diseases. Each subject’s sequence had ∼45,000 novel SNPs (Figure 2A), of which 372 and 442 were coding SNPs in the woman and the man, respectively, and approximately 2% of all novel mutations were coding. This rate is comparable to the overall rate of coding SNPs (Figure A3 in Appendix). These novel coding mutations are listed in Table S2 in Supplementary Material. We then used the DAVID functional annotation tool5 to determine whether the genes carrying the novel mutations were enriched in particular functional categories, or had been associated to categories of age-related diseases. The woman had 428 genes with novel mutations (including all possible transcripts) and the man had 500 genes with novel mutations. In both subjects the most significantly enriched category of genes with novel coding mutations was “alternative splicing” (205 genes in the man and 179 genes in the woman, enrichment score p-value <5E-04 after Bonferroni correction). In addition, 15 of the genes with novel mutations in the woman were in the “Immunoglobulin subtype 2” domain (enrichment score p-value 0.01, after Bonferroni correction). In the man, 22 of the genes with novel mutations were in the “Cadherin 6/Cell adhesion” domain (enrichment score p-value 0.03 after Bonferroni correction), and 6 of the genes were in the “von Willebrand factor/coagulation” domain (p-value 0.01). The prominence of novel mutations in genes that direct alternative splicing suggests the importance of determining the transcriptomes of these two subjects and other supercentenarians and doing so from specific tissue types. This suggests that transcriptional profiling by next generation RNA sequencing (RNA seq) of RNA from cells obtained or derived from centenarians could be informative in understanding potentially unique expression patterns in these individuals.
Eleven of the genes with novel mutations in the woman were linked to the class of diseases “infection” in the genetic association database (LTBP2, IL16, SELL, CABIN1, IRF4, KIR2DL3, DDX5, KIR2DL2, IFNGR2, TLR9, GJB2, p-value 0.066 that however does not remain significant after Bonferroni correction), but no additional disease categories were found to be significantly enriched. Thirty six genes with novel coding mutations in the man were linked to the disease classes “infection” and “immune.” These genes collectively point to the innate immune response and extracellular matrix remodeling genes collectively arguing for immune and tissue homeostasis as a nodal point for these subjects.
Figure 5A shows the distribution of genes with novel coding mutations in the woman (PG17) and the man (PG26) by specific diseases. The woman had a higher rate of novel mutations in genes linked to immune diseases and infections, as well as hematological diseases and development compared to the man. The man had a higher rate of novel mutations in genes linked to cancer, cardiovascular disease, neurological disease, and metabolism. To test whether the distributions of genes with novel mutations were significantly enriched for these disease categories, we generated reference distributions for the disease-annotated genes by randomly selecting genes from the whole list of genes with coding SNPs in the two subjects. The genes were annotated by disease groups and average rates and SD were computed in 1,000 resampled sets. The analysis showed that the rate of genes with novel coding SNPs annotated as “development,” “immune,” “infection,” and “renal” differed from the distributions expected if the genes were selected at random in the woman (Figure 5B). Interestingly, while the rate of genes with novel coding mutations annotated as “immune” and “infection” in the man was higher than the mean rate, it was not significantly different from what is expected by chance (Figure 5C). The significant enrichment of these disease categories in the woman but not the man suggests that the woman may be enriched for private mutations that promote exceptional longevity while the man may be enriched for more common longevity-associated variants. Figure 5D shows some examples of novel variants.
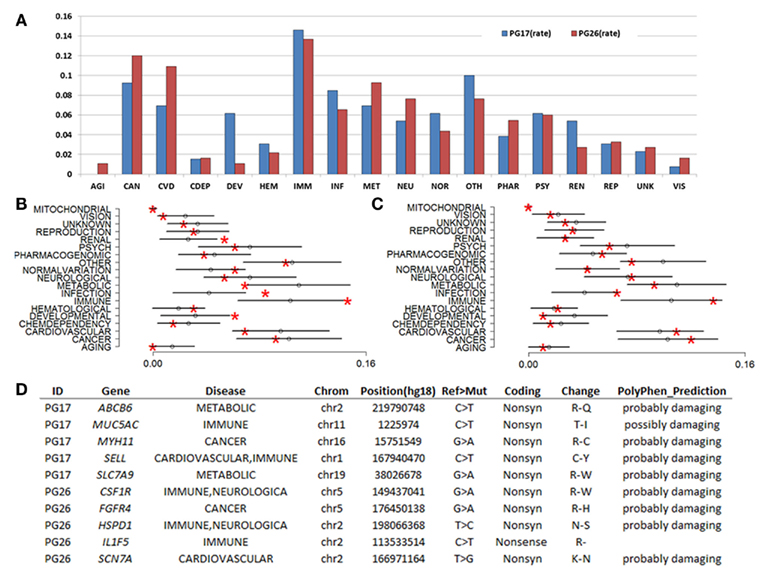
Figure 5. (A) Rates of genes with novel coding mutations annotated by disease. Disease groups are as in the labels of (B,C). Note that the woman did not carry any novel mutations in known aging genes, and neither of them carried novel coding SNPs in mitochondrial genes. (B) Resampling-based distributions of the rates of disease-annotated genes in PG17 when ∼400 genes were selected at random from the list of genes with coding SNPs. Red asterisks display the rate of disease-annotated genes with novel coding mutations in PG17. Distributions are based on 1,000 simulations. Error bars represent mean rate ± 2 SD. (C) Resampling-based distributions of the rates of disease-annotated genes in PG26 when ∼500 genes were selected at random in the list of genes with coding SNPs. Distributions are based on 1,000 simulations. (D) A sample of novel mutations in the female (PG17) and male (PG26). The complete list is in Table S2 in Supplementary Material.
Hypothesis 4: the enrichment of longevity variants hypothesis
In a genome-wide association study of exceptional longevity with 801 centenarians (median age at death 104 years) and 914 genetically matched controls, we identified 281 SNPs that were significantly associated with exceptional longevity and could be used to predict the phenotype with 78% sensitivity for a replication set with a mean age of 108 years (Sebastiani et al., 2012). Both subjects were included in this analysis and they carried 130 (46%) and 149 (53%) of the SNP alleles that increase the posterior probability of exceptional longevity. We called these variants that increase the posterior probability of exceptional longevity “longevity-associated variants.” Overall, the genetic profile of the woman translated into a 4.88 posterior odds for exceptional longevity, while the genetic profile of the man translated into an 11.5 posterior odds for exceptional longevity. Since the majority of SNPs in the genetic model in Sebastiani et al. (2012) were based on convenience rules used to design commercial SNP arrays, we investigated whether the longevity-associated variants in genes were close to coding SNPs in the sequences of the two subjects that are reported in either dbSNP or HGMD. We identified 63 and 68 longevity-associated variants in the woman and the man (86 was the sum total for the two subjects’ data combined, Table S3 in Supplementary Material) that were in genes. One of the 86 SNPs was a coding SNP in LY6G6F (HLA-B complex in Chromosome 6) and both subjects were heterozygous at this position. Seventeen (20%) of the remaining 85 SNPs were within 10 kb from coding mutations, 33 (39%) were within 50 kb from coding mutations, and 51 (60%) within 500 kb from coding mutations (Figure 6A). This analysis suggests that the two individuals’ sequences are enriched for coding SNPs in proximity of the longevity-associated variants and Figure 6B shows a selection of the closest coding mutations. Compared to SNPs randomly selected from the list of SNPs that were studied in the original genome-wide association study, the longevity-associated SNPs were much closer to coding SNPs (Figure 6C) and therefore this enrichment of coding mutations is not what we would expect by chance. Similar results were found in Smith et al. (2011). Based on this analysis, the two sequences appear to be enriched for coding mutations in close proximity to longevity-associated variants that were discovered through a genome-wide association study, and the results reinforce our hypothesis that exceptional longevity is determined by many longevity-associated variants that may counteract the effect of deleterious or disease-predisposing variants.
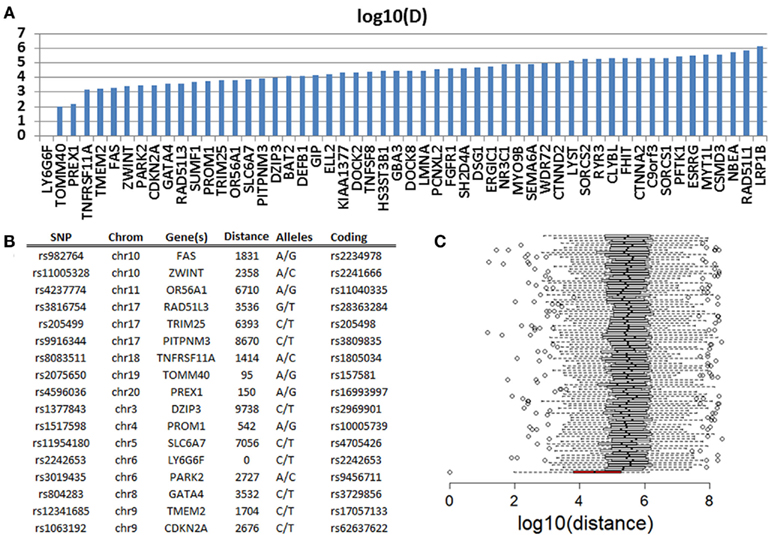
Figure 6. (A) Distance in log 10 (bp) of 51 SNPs that are predictive of exceptional longevity and nearest non-referent coding SNPs in PG17 and PG26. (B) Details of the 17 SNPs that are within 10 kb from coding SNPs. (C) The box plot in red shows the distribution of log 10 (bp) distance between the longevity-associated variants and the closest coding SNPs in PG17 and PG26. The 100 box plots in white show the distributions of the distance between SNPs chosen at random from the SNPs included in the genome-wide association study in Sebastiani et al. (2012) and the closest coding SNPs in PG17 and PG26. Wiskhers extend to 1.5 SD from the quartiles and circles represent outliers.
Discussion
We generated the whole genome sequences of a male and a female supercentenarian who were selected for this study because of both their exceptional lifespan and healthspan. Although two sequences do not provide sufficient data for general inference on the genetics of exceptional longevity, they are a first step toward the generation of a reference panel of exceptionally long-lived individuals and provide some interesting insights about genetic backgrounds that might be conducive to exceptional longevity. The $10 million Archon Genomics X Prize6 will greatly expand this reference panel with extremely accurate, 100 “medical grade” and economically feasible whole genome sequences of centenarians sequenced by multiple competing teams. It was recently announced that over 1,000 individuals who have lived to at least age 80 without suffering from any common chronic diseases will have their entire genomes sequenced and made available to the scientific community for use as a reference panel7.
The analysis of next generation sequence data is still very challenging, and no single mapping and variant calling algorithm has emerged as the standard tool to use. Therefore, we used two algorithms to select a set of robust variants to examine further. The specifically selected data show that the genetic architectures of the two subjects are comparable to published sequenced genomes, particularly in terms of rates of coding variants and predicted damaging variants, and it is likely that overall differences seen between genomes are due to different platforms, algorithms, and annotation methods rather than major structural changes that can be linked to exceptional longevity, at least in the case of germ line mutations.
We also used the genome sequences of these two subjects to test different genetic models of exceptional longevity. The insulin pathway, caloric restriction, and lipid metabolism significantly influence lifespan in other organisms including the mouse, fly, and worm (Christensen et al., 2006) and have provided natural candidates for the genetics of human exceptional longevity. Our analysis shows that while the man had several of the noted longevity variants in metabolic genes, particularly FOXO3A, the woman was homozygous only for one variant in HSP70 that is also common in the population. No additional novel coding SNPs in these putative genes were discovered, and the different genetic profiles of these candidate genes in the two supercentenarians suggest that not all of the genetic variants associated with exceptional longevity to-date are necessary to achieve such survival, and even if some of these variants may have a role in longevity there are likely many more yet to be discovered. This suggests that the metabolic hypothesis may be just one of the many paths to exceptional lifespan.
One of the hypothetical genetic models of exceptional longevity is that, in order for centenarians to achieve their exceptional survival, they must lack disease-predisposing variants. Phenotypically, there is evidence that this is not necessarily the case, since approximately 40% of centenarians have had onset of age-related diseases before the age of 80 (Evert et al., 2003). On the other hand, we have observed that supercentenarians tend to escape both age-related diseases and disability at least beyond the age of 105 years, as in the case of the two subjects in this study (Andersen et al., 2011). Therefore, we tested whether the genome of these two subjects had lower rates of disease-associated variants compared to other published genomes. Surprisingly, both supercentenarians turned out to be carriers of many disease-associated variants, and the rates of disease-associated variants and protective variants in the genomes of these two supercentenarians did not differ from known genomes. These findings raise several possibilities. For example, some of the common disease-associated variants found through genome-wide association studies may have very little penetrance and this fact would be consistent with their limited predictive values noted in various studies (Paynter et al., 2010; Wang et al., 2011). An alternative hypothesis is that centenarians may carry protective variants that counter the effect of damaging variants. The enrichment of coding variants nearby SNPs that were found associated with exceptional longevity in our genome-wide association study (Sebastiani et al., 2012) supports this hypothesis. An interesting finding from the analysis of disease-annotated variants is the evidence that several genes may have pleiotropic effects, and the same gene that can increase risk for disease might also increase the ability to live long lives. Good examples are the LMNA and WRN genes, or alleles of SOD2 that were found to have protective or damaging roles based on the genetic background. This hypothesis suggests that an analysis that considers individuals variants out of their “genetic context” may not be informative and better methods to analyze the effect of genetic profiles are needed.
An alternative, complementary hypothesis is that variants, possibly rare, not hitherto associated with health maintenance, compensate for disease-causing variants among the healthy elderly. In this light, the genomes of these two supercentenarians were not particularly enriched for novel variants, although the stringency of our approach to variant calling may have increased the false negative rate to reduce the false-positive rate. Nevertheless, the 1% novel variants discovered through this analysis may lead to the discovery of novel genes involved with exceptional longevity. The observation that the novel variants were in genes implicated in “alternative splicing” highlights the importance of pursuing follow-up studies involving transcriptome sequencing from different cells and tissues to identify RNA isoforms or expression profiles that may be important for exceptional longevity.
In summary, the two supercentenarian genomes we studied have different features including, for example, a number of private mutations in specific categories of genes in the case of the woman but not the man. Other ongoing studies of centenarians are showing that different centenarian genomes have different characteristics (Cirulli et al., 2011; Holstege et al., 2011). Rates of disease-associated variants that are similar to samples of much younger subjects point to the importance of epigenetic phenomena and the critical presence of longevity-associated variants in extreme longevity. The enrichment for coding mutations near longevity-associated variants and the enrichment in novel mutations suggest that a combination of rare and common variants contribute to the genetic background that allows some individuals to live beyond the 11th decade.
It is also likely that environmental factors and possibly the genetic ancestry may influence the likelihood of an individual to live long ages directly or by interacting with the genetic background. The NECS has shown that the chance of male and female siblings of centenarians to live past 100 can be 8 and 17 times higher than the risk in the general population (Perls et al., 2002). Consistent with this observation, our data suggest that the genetic contribution increases with older and older ages as the limit of lifespan is approached (Sebastiani et al., 2012). The male supercentenarian included in this study had strong longevity in his family. Although we do not have information about the family history of the female supercentenarian, she has living offspring who are approaching their nineties in good health and are currently enrolled in the NECS. The heterogeneity of the results herein suggest that sequencing additional exceptionally old individuals of different genetic ancestry and possibly their family members will provide the critical information to understand roles of common and rare genetic determinants of exceptional longevity and healthspan.
Materials and Methods
Ethics Statement
Subjects provided informed consent and this project was approved by the Boston University Medical Campus Institutional Review Board.
Subjects
The man and woman were both age 114+ years at the time of blood collection for DNA extraction. Their age was confirmed by birth/baptism certificates and early U.S. Census entries. For both subjects we examined the European ancestry by principal component analysis of genome-wide genotype data, as described in Sebastiani et al. (2012), and the male had German ancestry, while the female had a mixed French, Celtic background (see Figure A10 in Appendix). The man had been enrolled in the NECS for 2 years and the woman for 6 years prior to the sequencing study and their functional and cognitive status were determined every 1–2 years. Measures of physical (Barthel Index; Mahoney and Barthel, 1965; Sinoff and Ore, 1997) and cognitive function (Blessed Information–Memory–Concentration Test; Blessed et al., 1968; Kawas et al., 1995) were obtained annually. The Barthel Index measures the ability to independently perform activities of daily living with a score ranging between 0 and 100. Scores of 80–100 indicate independent functioning, 60–79 require minimal assistance, 40–59 indicate partial dependence, 20–39 indicate very dependent, and 0–19 indicate total dependence for performing activities of daily living. The Blessed Information–Memory–Concentration Test scores global cognition on a scale 0–37. Scores of 34 or greater represent no impairment, 27–33 indicate mild impairment, 21–26 signify moderate impairment, and less than 20 are associated with severe impairment (Kawas et al., 1995). The man’s Barthel Index and Blessed scores indicated that he was highly functional within a year of his death. He had no history of age-related illnesses except for cataracts (removed at age 74 years) and an osteoporotic fracture at age 109 years. He had a colon cancer in his seventies that was surgically removed. His only medication for years was an aspirin per day. The woman subject was cognitively intact 6 years prior to the sequencing study and then demonstrated a steady decline in cognitive and functional status. She was physically independent up to age 105 years, but then had a decline in her physical function disproportionate to her decline in cognitive function, likely due to progressive and severe frailty. She had no reported age-related illnesses except hypertension and relatively recently diagnosed dry macular degeneration. She had been on only two medications, both diuretics, during the last few years of her life.
Sequencing
Peripheral blood was obtained from each subject and used for DNA extraction. DNA samples were sequenced using a GAII sequencer at the Illumina Clinical Service Laboratory (San Diego, CA) using 100 bp paired-end reads. Fastq files were generated from the image files using the Illumina pipeline software (Firecrest for image analysis and Bustard for base calling).
Mapping
Reads in Fastq files were mapped to the NCBI36 reference genome including all chromosomes and Mt DNA using the Eland aligner (Bentley et al., 2008) and BWA (Li and Durbin, 2009; The BWA version we used was 0.5.9-r16). The Eland_pair alignment algorithm was used to map paired ends with more than 95% genomic coverage (Figure A11, Table A1 in Appendix). Reads that aligned to more than one region of the reference genome or that were of low quality were excluded. The BWA algorithm was used to map paired end with the options
aln -n 4 -o 1 -e 2 -k 2 -l 35 -R 5
to limit the maximum edit distance to 4, the maximum number of gap opens to 1, the maximum number of gap extensions to 2, the maximum number of edit distance in the seed to 2, the seed to the first 35 bases, and to proceed with suboptimal alignment if there are no more than 5 best hits. The more relaxed thresholds produced a larger number of aligned reads [1,559,315,652 aligned reads for PG26 (86.41%) and 1,334,406,235 aligned reads for PG17 (80.85%)].
SNP Calling
Single nucleotide polymorphisms were called using the CASAVA algorithm (see http://www.illumina.com/software/genomestudio_software.ilmn and Bentley et al., 2008) and SAMTools (http://samtools.sourceforge.net/ and Li et al., 2009). PCR duplicates were removed before running the SNP caller algorithms using SAMTools. The CASAVA algorithm calls SNPs in two steps, first alleles are called based on base calls, alignment and quality scores, and then SNPs genotypes are called based on allele calls and read depths. Alleles scores are approximately equivalent to a Phred score divided by 10, where the Phred score is −10 log 10 of the posterior probability that the allele call is wrong, and alleles with allele scores <3 (approximately Phred score <30, and hence error rate >0.1%) are filtered out. Homozygote genotypes are called at positions where an allele that differs from the reference genome at that position has a score >10 and the read depth is <3 (mean depth) per chromosome. Heterozygote genotypes are called when both alleles have a score >6 (Phred score >60), and the ratio between the scores of the two alleles is less than 3. Additional details are in the supporting manual8. In addition, SAMTools was used to generate pileup files from the reads aligned with BWA in the form of variant calling format files. SNPs with Phred score <30 were filtered out.
Identification of Novel Variants
We annotated the single polymorphic bases that differ from the reference genome (hg18) against dbSNP build 132 and the summary data distributed by the 1000 Genomes project9 that were published using coordinates of the UCSC release hg19 of the human genome. We used the liftover conversion tool in the UCSC Genome Browser to convert genomic coordinates from hg18 to hg19, and then calculated the number of polymorphic bases in the sequences of PG17 and PG26 that are not in dbSNP 132 but were reported in the December 2010 data release from the 1000 Genomes project. With the exception of 65 positions that map to 22 unique regions in hg18 and could not be remapped to hg19, all others were successfully translated, and more than 65% of the variants not in dbSNP were found in the 1000 Genomes data release. We also checked novel variants to detect mapping errors and tried to remove novel variants that were within few bases as those could be due to mapping errors. After this annotation, approximately 1.5% of the SNPs from the original set that were not found in dbSNP or 1000 Genomes were labeled as “novel” (Figure 2A). These steps were conducted with Genephony10, an online tool for the manipulation of large datasets of genomic information (Nuzzo and Riva, 2009).
Additional Genomes
We identified 15 additional whole genome sequences for comparison. The samples and references are in Table A2 in Appendix.
SNP Quality
We assessed SNP call quality using several measures.
Runs of Homozygosity
We used SNP array data genotyped with the Illumina array to describe the genome-wide structure of chromosomal alterations of PG17 and PG26. The two samples were genotyped with the Illumina 610 array (PG17) and 1M array (PG26) and data were processed as described in Sebastiani et al. (2012). We computed the B allele frequency (a measure of heterozygosity/homozygosity) and the log R ratio (a measure of signal intensity that relates to copy number variations) using Illumina BeadStudio. The plot of B allele frequency in Figure A3 in Appendix showed that there are significant stretches of homozygosity across many chromosomes (see red arrows). However, this was not associated with a shift in log R ratio at these locations suggesting that this was not due to big deletions but probably to inbreeding of her ancestors with distant relatives that resulted in higher homozygosity. The same analysis for PG26 is displayed in Figure A4 in Appendix.
Concordance with Genotype Calls
We compared genotype calls detected from next generation sequence analysis against the genotype calls determined with SNP array analysis. Missing genotypes were ignored.
Transition to Transversion Ratios and Rate of Heterozygosity
We calculated the number of transitions (A ↔ G or C ↔ T) and transversions (A ↔ C,T; C ↔ G; and T ↔ G) and their rate in all called SNPs, in SNPs reported only in the 1000 Genomes project, and in novel SNPs. Rates of heterozygosity were computed by the ratio of the number of heterozygous calls versus homozygous calls only for the SNPs with alleles that differ from the reference genome.
Indel Calling
For short indel finding, the reads were mapped to the human reference genome (NCBI build 37) using BWA in paired-end mode with default settings except for the following differences in BWA aln module: to control false-positive rate, the maximum edit distance in mapped end (-n) was lowered from 5 (default for 100 bp reads) to 4, and, to increase pairing accuracy, the seed size (-l) was decreased to 20 and the number of best hits to search in suboptimal alignments (-R) was increased to 100. In BWA sampe module, the number of occurrences for one end (-o) was increased to 10 million.
We found that using BWA with the last three parameters reduces the number of discordant pairs and pairs with ends mapped to different chromosomes without sacrificing overall alignment accuracy. Since Dindel uses both ends of discordant pairs for realignment and for calculation of variant qualities, we wanted to keep the number of discordant pairs low. The BAM alignment files produced by BWA were merged and split by chromosomes, library and read group information was added, and duplicates were removed on per-library basis using Picard MarkDuplicates. Short indel calls were made using Dindel and SAMTools mpileup. Since our data were relatively high coverage, before running Dindel, candidate indels were selected with – minCount parameter set to 3 using the script in the Dindel package. SAMTools mpileup was run with mapping quality coefficient – C50. For the mitochondrial chromosomes where coverage exceeded 3,000 due to high sample copy number, we increased maximum depth in mpileup to one million. Only indels that were called by both algorithms and had a Phred score >30 were selected for further annotation.
Functional Annotation
For bioinformatics analysis, we used the complementary genome-wide variant annotation tools embedded in a suite of tools developed by researchers at The Scripps Research Institute (Torkamani et al., 2011) as well as Genephony (Nuzzo and Riva, 2009). These tools integrate different approaches to assessing the likely functional significance of DNA sequence variants based on information such as genomic region, functional elements they reside in, conservation of nucleotides, biophysical properties of the nucleotide or amino acid sequence they reside in, known role in gene/protein function, disease associations. These annotations provide insights that link specific variants to gene function by predicting whether or not the variant impacts, e.g., a transcription factor binding site, or a microRNA binding site, a splice site, and/or whether they impact the function of a proteins. These tools both incorporate and go well beyond other available tools for variant functional prediction such as SIFT and POLYPHEN by considering more information as well as regulatory genomic elements.
List of Disease-Annotated Variants
We compiled this list by merging disease-annotated variants from the HGMD11 with the catalog of genome-wide association studies12. We completed the list of variants in the GWAS catalog by searching for the unreported SNP alleles, and then compared the full sequences of PG17 and PG26 to detect the SNPs with risk alleles. Note that for this analysis we used the assembled sequences and not only the SNPs that were called by the SNP caller algorithms, because several of the risk alleles are actually the reference allele in the hg18 version of the human genome. All SNPs in the catalog were recoded according to the forward strand to make the results comparable to the whole genome sequences. We analyzed the number of risk alleles stratified by whether they belong to a coding SNP. Protective variants were identified by searching for the key-words “reduced risk” in disease annotation.
Enrichment Analysis
We used the David functional tool (Huang da et al., 2009) to annotate genes by functional role and association with diseases. The disease associations are based on the genetic association database and disease classes derived in Zhang et al. (2010). To test whether the distributions of genes with novel mutations in PG17 and PG26 were significantly enriched for the found disease categories, we generated reference distributions as follows. We randomly selected 421 genes from the whole list of genes with coding SNPs in PG17 and 500 genes from the whole list of genes with coding SNPs in PG26, and the genes lists were annotated by disease groups. We repeated the random selection 1,000 times and then computed average rates and SD.
Longevity-Associated Variants
We detected the longevity-associated variants in PG17 and PG26 as those genotypes that increase the posterior probability of exceptional longevity in the two subjects in the list of 281 SNPs reported in Sebastiani et al. (2012). We selected the longevity-associated variants that were in genes, searched the closest coding mutation called by the SNPs callers or the closets coding mutations in the HGMD for each longevity variants and then computed the physical distances. Genes that did not have any coding mutation in the sequences were ignored. To build reference distributions, we randomly selected 281 SNPs from the list of SNPs that were included in the genome-wide association study of exceptional longevity as described in Sebastiani et al. (2012), selected the SNPs located in genes and searched for the closest coding mutation in the same genes that were called by the SNP callers or were in the HGMD. The box plot in Figure 6C shows 100 replications of random selection.
Conflict of Interest Statement
The authors declare that the research was conducted in the absence of any commercial or financial relationships that could be construed as a potential conflict of interest.
Acknowledgments
This work was funded by grants from the National Institute on Aging R56-AG027216 (Clinton T. Baldwin), R01HL087681 (Martin H. Steinberg), K24AG025727 and a Glenn Foundation for Medical Research Breakthroughs in Gerontology Award (Thomas T. Perls), National Science Foundation IIS-1017621 (Gary Benson), NIH/NCRR UL1 RR025774; NIH/NHLBI R01 HL089655-03; and NIH/NIDA R01 DA030976, and the Price Foundation and Scripps Genomic Medicine (Ali Torkamani, Nicholas J. Schork, Phillip Pham). We are beholden to the very special and wonderful subjects of this study for their interest and participation.
Supplementary Material
The Supplementary Material for this article can be found online at http://www.frontiersin.org/genetics_of_aging/10.3389/fgene.2011.00090/abstract
Footnotes
- ^http://www.illumina.com/Documents/products/technotes/technote_snp_caller_sequencing.pdf
- ^http://www.1000genomes.org/
- ^http://www.ncbi.nlm.nih.gov/gap
- ^http://www.snpedia.com/index.php/Rs4880
- ^http://david.abcc.ncifcrf.gov/
- ^http://genomics.xprize.org/
- ^http://ir.completegenomics.com/releasedetail.cfm?ReleaseID=610178
- ^http://www.illumina.com/software/genomestudio_software.ilmn
- ^ftp://ftp-trace.ncbi.nih.gov/1000genomes/ftp/release/2010_11/
- ^http://genome.ufl.edu/gp/
- ^http://www.hgmd.org/
- ^http://www.genome.gov/gwastudies/
References
Albers, C. A., Lunter, G., MacArthur, D. G., McVean, G., Ouwehand, W. H., and Durbin, R. (2011). Dindel: accurate indel calls from short-read data. Genome Res. 21, 961–973.
Al-Regaiey, K. A., Masternak, M. M., Bonkowski, M., Sun, L., and Bartke, A. (2005). Long-lived growth hormone receptor knockout mice: interaction of reduced insulin-like growth factor i/insulin signaling and caloric restriction. Endocrinology 146, 851–860.
Andersen, S., Sebastiani, P., Dworkis, D. A., Feldman, L., and Perls, T. T. (2011). Health span approximates life span amongst many supercentenarians. J. Gerontol. A Biol. Sci. Med. Sci. doi: 10.1093/gerona/glr223. [Epub ahead of print].
Arai, Y., Takayama, M., Gondo, Y., Inagaki, H., Yamamura, K., Nakazawa, S., Kojima, T., Ebihara, Y., Shimizu, K., Masui, Y., Kitagawa, K., Takebayashi, T., and Hirose, N. (2008). Adipose endocrine function, insulin-like growth factor-1 axis, and exceptional survival beyond 100 years of age. J. Gerontol. A Biol. Sci. Med. Sci. 63, 1209–1218.
Arking, D. E., Krebsova, A., Macek, M. Sr., Macek, M. Jr., Arking, A., Mian, I. S., Fried, L., Hamosh, A., Dey, S., McIntosh, I., and Dietz, H. C. (2002). Association of human aging with a functional variant of klotho. Proc. Natl. Acad. Sci. U.S.A. 99, 856–861.
Atzmon, G., Rincon, M., Rabizadeh, P., and Barzilai, N. (2005). Biological evidence for inheritance of exceptional longevity. Mech. Ageing Dev. 126, 341–345.
Barzilai, N., Atzmon, G., Derby, C. A., Bauman, J. M., and Lipton, R. B. (2006). A genotype of exceptional longevity is associated with preservation of cognitive function. Neurology 67, 2170–2175.
Barzilai, N., Atzmon, G., Schechter, C., Schaefer, E. J., Cupples, A. L., Lipton, R., Cheng, S., and Shuldiner, A. R. (2003). Unique lipoprotein phenotype and genotype associated with exceptional longevity. JAMA 290, 2030–2040.
Bastaki, M., Huen, K., Manzanillo, P., Chande, N., Chen, C., Balmes, J. R., Tager, I. B., and Holland, N. (2006). Genotype-activity relationship for Mn-superoxide dismutase, glutathione peroxidase 1 and catalase in humans. Pharmacogenet. Genomics 16, 279–286.
Bentley, D. R., Balasubramanian, S., Swerdlow, H. P., Smith, G. P., Milton, J., Brown, C. G., Hall, K. P., Evers, D. J., Barnes, C. L., Bignell, H. R., Boutell, J. M., Bryant, J., Carter, R. J., Keira Cheetham, R., Cox, A. J., Ellis, D. J., Flatbush, M. R., Gormley, N. A., Humphray, S. J., Irving, L. J., Karbelashvili, M. S., Kirk, S. M., Li, H., Liu, X., Maisinger, K. S., Murray, L. J., Obradovic, B., Ost, T., Parkinson, M. L., Pratt, M. R., Rasolonjatovo, I. M., Reed, M. T., Rigatti, R., Rodighiero, C., Ross, M. T., Sabot, A., Sankar, S. V., Scally, A., Schroth, G. P., Smith, M. E., Smith, V. P., Spiridou, A., Torrance, P. E., Tzonev, S. S., Vermaas, E. H., Walter, K., Wu, X., Zhang, L., Alam, M. D., Anastasi, C., Aniebo, I. C., Bailey, D. M., Bancarz, I. R., Banerjee, S., Barbour, S. G., Baybayan, P. A., Benoit, V. A., Benson, K. F., Bevis, C., Black, P. J., Boodhun, A., Brennan, J. S., Bridgham, J. A., Brown, R. C., Brown, A. A., Buermann, D. H., Bundu, A. A., Burrows, J. C., Carter, N. P., Castillo, N., Chiara E. Catenazzi, M., Chang, S., Neil Cooley, R., Crake, N. R., Dada, O. O., Diakoumakos, K. D., Dominguez-Fernandez, B., Earnshaw, D. J., Egbujor, U. C., Elmore, D. W., Etchin, S. S., Ewan, M. R., Fedurco, M., Fraser, L. J., Fuentes Fajardo, K. V., Scott Furey, W., George, D., Gietzen, K. J., Goddard, C. P., Golda, G. S., Granieri, P. A., Green, D. E., Gustafson, D. L., Hansen, N. F., Harnish, K., Haudenschild, C. D., Heyer, N. I., Hims, M. M., Ho, J. T., Horgan, A. M., Hoschler, K., Hurwitz, S., Ivanov, D. V., Johnson, M. Q., James, T., Huw Jones, T. A., Kang, G. D., Kerelska, T. H., Kersey, A. D., Khrebtukova, I., Kindwall, A. P., Kingsbury, Z., Kokko-Gonzales, P. I., Kumar, A., Laurent, M. A., Lawley, C. T., Lee, S. E., Lee, X., Liao, A. K., Loch, J. A., Lok, M., Luo, S., Mammen, R. M., Martin, J. W., McCauley, P. G., McNitt, P., Mehta, P., Moon, K. W., Mullens, J. W., Newington, T., Ning, Z., Ling Ng, B., Novo, S. M., O’Neill, M. J., Osborne, M. A., Osnowski, A., Ostadan, O., Paraschos, L. L., Pickering, L., Pike, A. C., Pike, A. C., Chris Pinkard, D., Pliskin, D. P., Podhasky, J., Quijano, V. J., Raczy, C., Rae, V. H., Rawlings, S. R., Chiva Rodriguez, A., Roe, P. M., Rogers, J., Rogert Bacigalupo, M. C., Romanov, N., Romieu, A., Roth, R. K., Rourke, N. J., Ruediger, S. T., Rusman, E., Sanches-Kuiper, R. M., Schenker, M. R., Seoane, J. M., Shaw, R. J., Shiver, M. K., Short, S. W., Sizto, N. L., Sluis, J. P., Smith, M. A., Ernest Sohna Sohna, J., Spence, E. J., Stevens, K., Sutton, N., Szajkowski, L., Tregidgo, C. L., Turcatti, G., Vandevondele, S., Verhovsky, Y., Virk, S. M., Wakelin, S., Walcott, G. C., Wang, J., Worsley, G. J., Yan, J., Yau, L., Zuerlein, M., Rogers, J., Mullikin, J. C., Hurles, M. E., McCooke, N. J., West, J. S., Oaks, F. L., Lundberg, P. L., Klenerman, D., Durbin, R., and Smith, A. J. (2008). Accurate whole human genome sequencing using reversible terminator chemistry. Nature 456, 53–59.
Blessed, G., Tomlinson, B. E., and Roth, M. (1968). The association between quantitative measures of dementia and of senile change in the cerebral grey matter of elderly subjects. Br. J. Psychiatry 114, 797–811.
Bloss, C. S., Pawlikowska, L., and Schork, N. J. (2010). Contemporary human genetic strategies in aging research. Ageing Res. Rev. 10, 191–200.
Bonafe, M., Barbieri, M., Marchegiani, F., Olivieri, F., Ragno, E., Giampieri, C., Mugianesi, E., Centurelli, M., Franceschi, C., and Paolisso, G. (2003). Polymorphic variants of insulin-like growth factor I (IGF-I) receptor and phosphoinositide 3-kinase genes affect IGF-I plasma levels and human longevity: cues for an evolutionarily conserved mechanism of life span control. J. Clin. Endocrinol. Metab. 88, 3299–3304.
Christensen, K., Johnson, T. E., and Vaupel, J. W. (2006). The quest for genetic determinants of human longevity: challenges and insights. Nat. Rev. Genet. 7, 436–448.
Chua, K. F., Mostoslavsky, R., Lombard, D. B., Pang, W. W., Saito, S., Franco, S., Kaushal, D., Cheng, H. L., Fischer, M. R., Stokes, N., Murphy, M. M., Appella, E., and Alt, F. W. (2005). Mammalian SIRT1 limits replicative life span in response to chronic genotoxic stress. Cell Metab. 2, 67–76.
Cirulli, E. T., Zhu, M., Shianna, K. V., Ge, D., and Goldstein, D. B. (2011). Next Generation Sequencing of Centenarian and Control Genomes. Montreal: ACHG.
Drmanac, R., Sparks, A. B., Callow, M. J., Halpern, A. L., Burns, N. L., Kermani, B. G., Carnevali, P., Nazarenko, I., Nilsen, G. B., Yeung, G., Dahl, F., Fernandez, A., Staker, B., Pant, K. P., Baccash, J., Borcherding, A. P., Brownley, A., Cedeno, R., Chen, L., Chernikoff, D., Cheung, A., Chirita, R., Curson, B., Ebert, J. C., Hacker, C. R., Hartlage, R., Hauser, B., Huang, S., Jiang, Y., Karpinchyk, V., Koenig, M., Kong, C., Landers, T., Le, C., Liu, J., McBride, C. E., Morenzoni, M., Morey, R. E., Mutch, K., Perazich, H., Perry, K., Peters, B. A., Peterson, J., Pethiyagoda, C. L., Pothuraju, K., Richter, C., Rosenbaum, A. M., Roy, S., Shafto, J., Sharanhovich, U., Shannon, K. W., Sheppy, C. G., Sun, M., Thakuria, J. V., Tran, A., Vu, D., Zaranek, A. W., Wu, X., Drmanac, S., Oliphant, A. R., Banyai, W. C., Martin, B., Ballinger, D. G., Church, G. M., and Reid, C. A. (2009). Human genome sequencing using unchained base reads on self-assembling DNA nanoarrays. Science 327, 78–81.
Ebersberger, I., Metzler, D., Schwarz, C., and Paabo, S. (2002). Genomewide comparison of DNA sequences between humans and chimpanzees. Am. J. Hum. Genet. 70, 1490–1497.
Eriksson, M., Brown, W. T., Gordon, L. B., Glynn, M. W., Singer, J., Scott, L., Erdos, M. R., Robbins, C. M., Moses, T. Y., Berglund, P., Dutra, A., Pak, E., Durkin, S., Csoka, A. B., Boehnke, M., Glover, T. W., and Collins, F. S. (2003). Recurrent de novo point mutations in lamin A cause Hutchinson-Gilford progeria syndrome. Nature 423, 293–298.
Evert, J., Lawler, E., Bogan, H., and Perls, T. (2003). Morbidity profiles of centenarians: survivors, delayers, and escapers. J. Gerontol. A Biol. Sci. Med. Sci. 58, 232–237.
Fraser, G. E., and Shavlik, D. J. (2001). Ten years of life: is it a matter of choice? Arch. Intern. Med. 161, 1645–1652.
Gatta, L. B., Vitali, M., Zanola, A., Venturelli, E., Fenoglio, C., Galimberti, D., Scarpini, E., and Finazzi, D. (2008). Polymorphisms in the LOC387715/ARMS2 putative gene and the risk for Alzheimer’s disease. Dement. Geriatr. Cogn. Disord. 26, 169–174.
Gray, M. D., Shen, J. C., Kamath-Loeb, A. S., Blank, A., Sopher, B. L., Martin, G. M., Oshima, J., and Loeb, L. A. (1997). The Werner syndrome protein is a DNA helicase. Nat. Genet. 17, 100–103.
Guarente, L., and Kenyon, C. (2000). Genetic pathways that regulate ageing in model organisms. Nature 408, 255–262.
Herskind, A. M., McGue, M., Holm, N. V., Sorensen, T. I., Harvald, B., and Vaupel, J. W. (1996). The heritability of human longevity: a population-based study of 2872 Danish twin pairs born 1870-1900. Hum. Genet. 97, 319–323.
Hindorff, L. A., Junkins, H. A., Mehta, J. P., and Manolio, T. A. (2011). A Catalog of Published Genome-Wide Association Studies. Available at: http://www.genome.gov/gwastudies/ [accessed April 30, 2011].
Holstege, H., Sie, D., Harkins, T., Lee, C., Ross, T., McLaughlin, S., Shah, M., Ylstra, B., Meijer, G., Meijers-Heijboer, H., Heutink, P., Shaw Murray, S., Reinders, M., Holstege, G., Sistermans, E., and Levy, S. (2011). A Longevity Reference Genome Generated From the World’s Oldest Woman. Montreal: ACHG.
Holzenberger, M., Dupont, J., Ducos, B., Leneuve, P., Geloen, A., Even, P. C., Cervera, P., and Le Bouc, Y. (2003). IGF-1 receptor regulates lifespan and resistance to oxidative stress in mice. Nature 421, 182–187.
Huang da, W., Sherman, B. T., and Lempicki, R. A. (2009). Systematic and integrative analysis of large gene lists using DAVID bioinformatics resources. Nat. Protoc. 4, 44–57.
Kawas, C., Karagiozis, H., Resau, L., Corrada, M., and Brookmeyer, R. (1995). Reliability of the blessed telephone information-memory-concentration test. J. Geriatr. Psychiatry Neurol. 8, 238–242.
Kim, J. I., Ju, Y. S., Park, H., Kim, S., Lee, S., Yi, J. H., Mudge, J., Miller, N. A., Hong, D., Bell, C. J., Kim, H. S., Chung, I. S., Lee, W. C., Lee, J. S., Seo, S. H., Yun, J. Y., Woo, H. N., Lee, H., Suh, D., Lee, S., Kim, H. J., Yavartanoo, M., Kwak, M., Zheng, Y., Lee, M. K., Park, H., Kim, J. Y., Gokcumen, O., Mills, R. E., Zaranek, A. W., Thakuria, J., Wu, X., Kim, R. W., Huntley, J. J., Luo, S., Schroth, G. P., Wu, T. D., Kim, H., Yang, K. S., Park, W. Y., Kim, H., Church, G. M., Lee, C., Kingsmore, S. F., and Seo, J. S. (2009). A highly annotated whole-genome sequence of a Korean individual. Nature 460, 1011–1015.
Kojima, T., Kamei, H., Aizu, T., Arai, Y., Takayama, M., Nakazawa, S., Ebihara, Y., Inagaki, H., Masui, Y., Gondo, Y., Sakaki, Y., and Hirose, N. (2004). Association analysis between longevity in the Japanese population and polymorphic variants of genes involved in insulin and insulin-like growth factor 1 signaling pathways. Exp. Gerontol. 39, 1595–1598.
Kops, G. J., Dansen, T. B., Polderman, P. E., Saarloos, I., Wirtz, K. W., Coffer, P. J., Huang, T. T., Bos, J. L., Medema, R. H., and Burgering, B. M. (2002). Forkhead transcription factor FOXO3a protects quiescent cells from oxidative stress. Nature 419, 316–321.
Kuningas, M., Putters, M., Westendorp, R. G., Slagboom, P. E., and van Heemst, D. (2007). SIRT1 gene, age-related diseases, and mortality: the Leiden 85-plus study. J. Gerontol. A Biol. Sci. Med. Sci. 62, 960–965.
Kuro-o, M., Matsumura, Y., Aizawa, H., Kawaguchi, H., Suga, T., Utsugi, T., Ohyama, Y., Kurabayashi, M., Kaname, T., Kume, E., Iwasaki, H., Iida, A., Shiraki-Iida, T., Nishikawa, S., Nagai, R., and Nabeshima, Y. I. (1997). Mutation of the mouse klotho gene leads to a syndrome resembling ageing. Nature 390, 45–51.
Kurosu, H., Yamamoto, M., Clark, J. D., Pastor, J. V., Nandi, A., Gurnani, P., McGuinness, O. P., Chikuda, H., Yamaguchi, M., Kawaguchi, H., Shimomura, I., Takayama, Y., Herz, J., Kahn, C. R., Rosenblatt, K. P., and Kuro-o, M. (2005). Suppression of aging in mice by the hormone Klotho. Science 309, 1829–1833.
Lee, S. S., Kennedy, S., Tolonen, A. C., and Ruvkun, G. (2003). DAF-16 target genes that control C. elegans life-span and metabolism. Science 300, 644–647.
Levy, S., Sutton, G., Ng, P. C., Feuk, L., Halpern, A. L., Walenz, B. P., Axelrod, N., Huang, J., Kirkness, E. F., Denisov, G., Lin, Y., MacDonald, J. R., Pang, A. W., Shago, M., Stockwell, T. B., Tsiamouri, A., Bafna, V., Bansal, V., Kravitz, S. A., Busam, D. A., Beeson, K. Y., McIntosh, T. C., Remington, K. A., Abril, J. F., Gill, J., Borman, J., Rogers, Y. H., Frazier, M. E., Scherer, S. W., Strausberg, R. L., and Venter, J. C. (2007). The diploid genome sequence of an individual human. PLoS Biol. 5, e254. doi: 10.1371/journal.pbio.0050254
Li, H., and Durbin, R. (2009). Fast and accurate short read alignment with Burrows-Wheeler transform. Bioinformatics 25, 1754–1760.
Li, H., Handsaker, B., Wysoker, A., Fennell, T., Ruan, J., Homer, N., Marth, G., Abecasis, G., Durbin, R., and 1000 Genome Project Data Processing Subgroup. (2009). The Sequence Alignment/Map format and SAMtools. Bioinformatics 25, 2078–2079.
Lohmueller, K. E., Indap, A. R., Schmidt, S., Boyko, A. R., Hernandez, R. D., Hubisz, M. J., Sninsky, J. J., White, T. J., Sunyaev, S. R., Nielsen, R., Clark, A. G., and Bustamante, C. D. (2008). Proportionally more deleterious genetic variation in European than in African populations. Nature 451, 994–997.
Mahoney, F. I., and Barthel, D. W. (1965). Functional evaluation: the Barthel Index. Md. State Med. J. 14, 61–65.
Moore, B., Hu, H., Singleton, M., Reese, M. G., De La Vega, F. M., and Yandell, M. (2011). Global analysis of disease-related DNA sequence variation in 10 healthy individuals: implications for whole genome-based clinical diagnostics. Genet. Med. 13, 210–217.
Nalls, M. A., Simon-Sanchez, J., Gibbs, J. R., Paisan-Ruiz, C., Bras, J. T., Tanaka, T., Matarin, M., Scholz, S., Weitz, C., Harris, T. B., Ferrucci, L., Hardy, J., and Singleton, A. B. (2009). Measures of autozygosity in decline: globalization, urbanization, and its implications for medical genetics. PLoS Genet. 5, e1000415. doi: 10.1371/journal.pgen.1000415.
Nuzzo, A., and Riva, A. (2009). Genephony: a knowledge management tool for genome-wide research. BMC Bioinformatics 10, 278. doi: 10.1186/1471-2105-10-278
Paynter, N. P., Chasman, D. I., Pare, G., Buring, J. E., Cook, N. R., Miletich, J. P., and Ridker, P. M. (2010). Association between a literature-based genetic risk score and cardiovascular events in women. JAMA 303, 631–637.
Pawlikowska, L., Hu, D., Huntsman, S., Sung, A., Chu, C., Chen, J., Joyner, A. H., Schork, N. J., Hsueh, W. C., Reiner, A. P., Psaty, B. M., Atzmon, G., Barzilai, N., Cummings, S. R., Browner, W. S., Kwok, P. Y., Ziv, E., and Study of Osteoporotic Fractures. (2009). Association of common genetic variation in the insulin/IGF1 signaling pathway with human longevity. Aging Cell 8, 460–472.
Perls, T., Shea-Drinkwater, M., Bowen-Flynn, J., Ridge, S. B., Kang, S., Joyce, E., Daly, M., Brewster, S. J., Kunkel, L., and Puca, A. A. (2000). Exceptional familial clustering for extreme longevity in humans. J. Am. Geriatr. Soc. 48, 1483–1485.
Perls, T. T., Wilmoth, J., Levenson, R., Drinkwater, M., Cohen, M., Bogan, H., Joyce, E., Brewster, S., Kunkel, L., and Puca, A. (2002). Life-long sustained mortality advantage of siblings of centenarians. Proc. Natl. Acad. Sci. U.S.A. 99, 8442–8447.
Schachter, F., Faure-Delanef, L., Guenot, F., Rouger, H., Froguel, P., Lesueur-Ginot, L., and Cohen, D. (1994). Genetic associations with human longevity at the APOE and ACE loci. Nat. Genet. 6, 29–32.
Schoenmaker, M., de Craen, A. J., de Meijer, P. H., Beekman, M., Blauw, G. J., Slagboom, P. E., and Westendorp, R. G. (2006). Evidence of genetic enrichment for exceptional survival using a family approach: the Leiden Longevity Study. Eur. J. Hum. Genet. 14, 79–84.
Sebastiani, P., Solovieff, N., DeWan, A., Walsh, K., Puca, A., Hartley, S. W., Melista, E., Andersen, S., Dworkis, D. A., Wilk, J. B., Myers, R. H., Steinberg, M. H., Montano, M., Baldwin, C. T., Hoh, J., and Perls, T. T. (2012). Genetic signatures of exceptional longevity in humans. PLoS ONE. doi: 10.1371/journal.pone.0029848
Sinoff, G., and Ore, L. (1997). The Barthel activities of daily living index: self-reporting versus actual performance in the old-old (> or = 75 years). J. Am. Geriatr. Soc. 45, 832–836.
Smith, E. N., Koller, D. L., Panganiban, C., Szelinger, S., Zhang, P., Badner, J. A., Barrett, T. B., Berrettini, W. H., Bloss, C. S., Byerley, W., Coryell, W., Edenberg, H. J., Foroud, T., Gershon, E. S., Greenwood, T. A., Guo, Y., Hipolito, M., Keating, B. J., Lawson, W. B., Liu, C., Mahon, P. B., McInnis, M. G., McMahon, F. J., McKinney, R., Murray, S. S., Nievergelt, C. M., Nurnberger, J. I. Jr., Nwulia, E. A., Potash, J. B., Rice, J., Schulze, T. G., Scheftner, W. A., Shilling, P. D., Zandi, P. P., Zöllner, S., Craig, D. W., Schork, N. J., and Kelsoe, J. R. (2011). Genome-wide association of bipolar disorder suggests an enrichment of replicable associations in regions near genes. PLoS Genet. 7, e1002134. doi: 10.1371/journal.pgen.1002134
Solovieff, N., Hartley, S. W., Baldwin, C. T., Perls, T. T., Steinberg, M. H., and Sebastiani, P. (2010). Clustering by genetic ancestry using genome-wide data. BMC Genet. 11, 108. doi: 10.1186/1471-2164-11-108
Song, F., Ji, P., Zheng, H., Wang, Y., Hao, X., Wei, Q., Zhang, W., and Chen, K. (2010). Definition of a functional single nucleotide polymorphism in the cell migration inhibitory gene MIIP that affects the risk of breast cancer. Cancer Res. 70, 1024–1032.
Stenson, P. D., Mort, M., Ball, E. V., Howells, K., Phillips, A. D., Thomas, N. S., and Cooper, D. N. (2009). The Human Gene Mutation Database: 2008 update. Genome Med. 1, 13.
Suh, Y., Atzmon, G., Cho, M. O., Hwang, D., Liu, B., Leahy, D. J., Barzilai, N., and Cohen, P. (2008). Functionally significant insulin-like growth factor I receptor mutations in centenarians. Proc. Natl. Acad. Sci. U.S.A. 105, 3438–3442.
Tan, Q., Zhao, J. H., Zhang, D., Kruse, T. A., and Christensen, K. (2008). Power for genetic association study of human longevity using the case-control design. Am. J. Epidemiol. 168, 890–896.
Terry, D. F., Sebastiani, P., Andersen, S. L., and Perls, T. T. (2008). Disentangling the roles of disability and morbidity in survival to exceptional old age. Arch. Intern. Med. 168, 277–283.
The 1000 Genomes Project Consortium. (2010). A map of human genome variation from population-scale sequencing. Nature 467, 1061–1073.
Torkamani, A., Scott-Van Zeeland, A. A., Topol, E. J., and Schork, N. J. (2011). Annotating individual human genomes. Genomics 98, 233–241.
Vaziri, H., Dessain, S., Eaton, E. N., Imaii, S. I., Frye, A. R., Pandita, T. K., Guarente, L., and Weinberg, R. A. (2001). hSir2 (SirT1) functions as an NAD-dependent p53 deacetylase. Cell 107, 149–159.
Wang, J., Wang, W., Li, R., Li, Y., Tian, G., Goodman, L., Fan, W., Zhang, J., Li, J., Zhang, J., Guo, Y., Feng, B., Li, H., Lu, Y., Fang, X., Liang, H., Du, Z., Li, D., Zhao, Y., Hu, Y., Yang, Z., Zheng, H., Hellmann, I., Inouye, M., Pool, J., Yi, X., Zhao, J., Duan, J., Zhou, Y., Qin, J., Ma, L., Li, G., Yang, Z., Zhang, G., Yang, B., Yu, C., Liang, F., Li, W., Li, S., Li, D., Ni, P., Ruan, J., Li, Q., Zhu, H., Liu, D., Lu, Z., Li, N., Guo, G., Zhang, J., Ye, J., Fang, L., Hao, Q., Chen, Q., Liang, Y., Su, Y., San, A., Ping, C., Yang, S., Chen, F., Li, L., Zhou, K., Zheng, H., Ren, Y., Yang, L., Gao, Y., Yang, G., Li, Z., Feng, X., Kristiansen, K., Wong, G. K., Nielsen, R., Durbin, R., Bolund, L., Zhang, X., Li, S., Yang, H., and Wang, J. (2008). The diploid genome sequence of an Asian individual. Nature 456, 60–65.
Wang, J. H., Pappas, D., De Jager, P. L., Pelletier, D., de Bakker, P. I., Kappos, L., Polman, C. H., Australian and New Zealand Multiple Sclerosis Genetics Consortium (ANZgene), Chibnik, L. B., Hafler, D. A., Matthews, P. M., Hauser, S. L., Baranzini, S. E., and Oksenberg, J. R. (2011). Modeling the cumulative genetic risk for multiple sclerosis from genome-wide association data. Genome Med. 3, 3.
Wegner, L., Anthonsen, S., Bork-Jensen, J., Dalgaard, L., Hansen, T., Pedersen, O., Poulsen, P., and Vaag, A. (2010). LMNA rs4641 and the muscle lamin A and C isoforms in twins – metabolic implications and transcriptional regulation. J. Clin. Endocrinol. Metab. 95, 3884–3892.
Wheeler, H. E., and Kim, S. K. (2011). Genetics and genomics of human ageing. Philos. Trans. R. Soc. Lond. B Biol. Sci. 366, 43–50.
Willcox, B. J., Donlon, T. A., He, Q., Chen, R., Grove, J. S., Yano, K., Masaki, K. H., Willcox, D. C., Rodriguez, B., and Curb, J. D. (2008). FOXO3A genotype is strongly associated with human longevity. Proc. Natl. Acad. Sci. U.S.A. 105, 13987–13992.
Zhang, Y., De, S., Garner, J. R., Smith, K., Wang, S. A., and Becker, K. G. (2010). Systematic analysis, comparison, and integration of disease based human genetic association data and mouse genetic phenotypic information. BMC Med. Genomics 3, 1. doi: 10.1186/1755-8794-3-1
Appendix
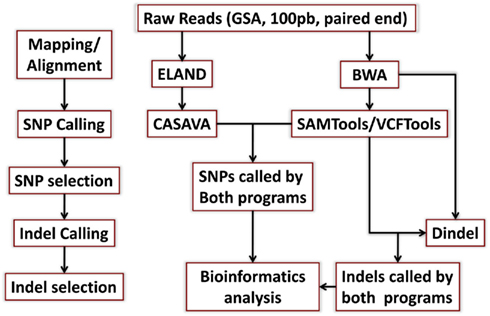
Figure A1. Schematic of the mapping/alignment and variant calling steps. We used the Eland and BWA aligners to map reads to the reference genome, and CASAVA and SAMTools to call SNPs as explained in Section “Materials and Methods.” Short insertion and deletions were called using SAMTools and Dindel. Only variants that were called by both algorithms and passed quality control filters were included in the follow-up analyses.
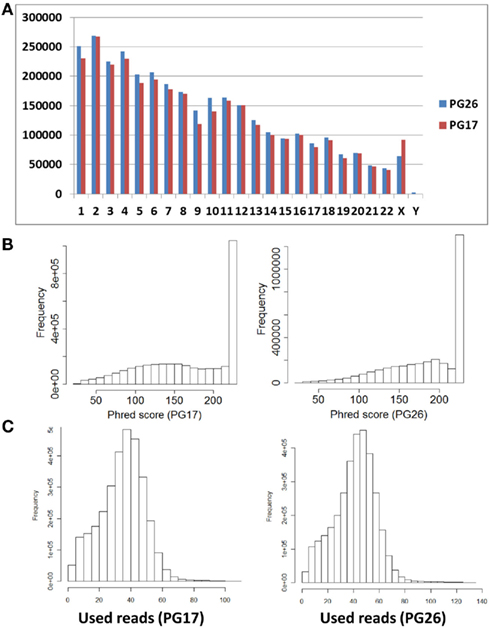
Figure A2. (A) Number of SNPs called by both SNP callers, the CASAVA algorithm and SAMTools, with >99% concordant genotype calls, by chromosome. (B) Distribution of Phred scores in SNPs called in PG17 and PG26 (From SAMTools). (C) Distribution of reads used for SNPs calling in PG17 and PG26 (From CASAVA). The median number of used reads was 36 in PG17 and 43 in PG26.
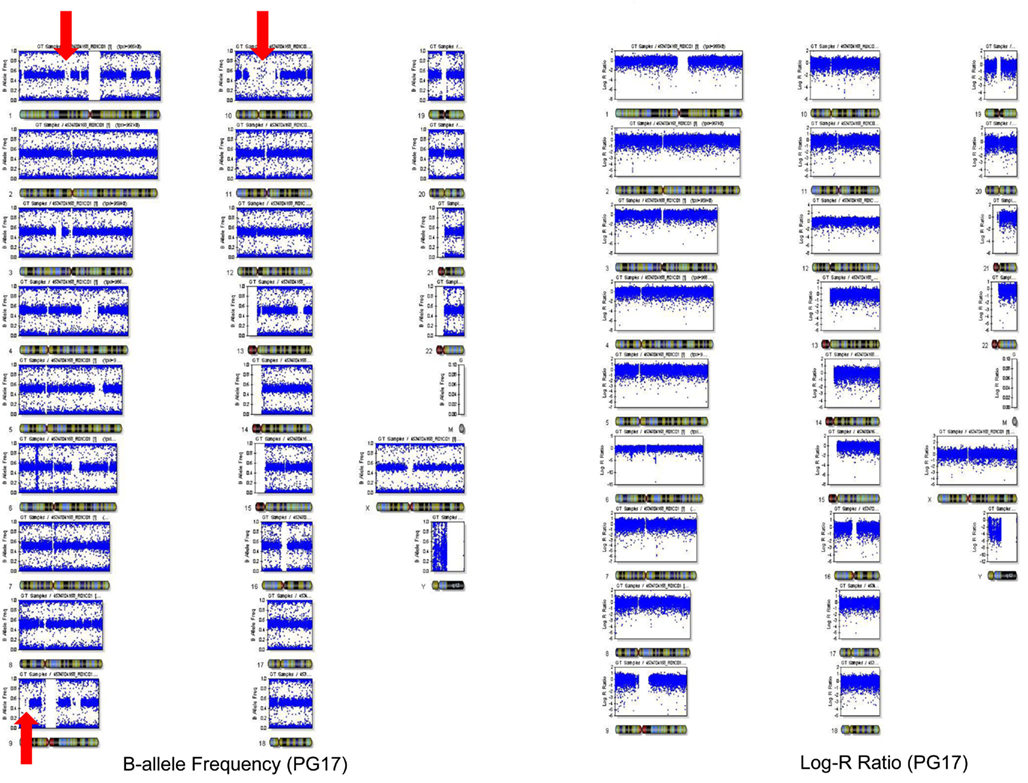
Figure A3. Plot of the B allele frequency (a measure of heterozygosity/homozygosity) and the log R ratio (a measure of signal intensity that relates to copy number variations) using Illumina BeadStudio. The plot of B allele frequency shows that there are significant stretches of homozygosity across many chromosomes (see red arrows). However, this was not associated with a shift in log R ratio at these locations suggesting that this was not due to big deletions but probably to inbreeding of her ancestors with distant relatives that resulted in higher homozygosity.
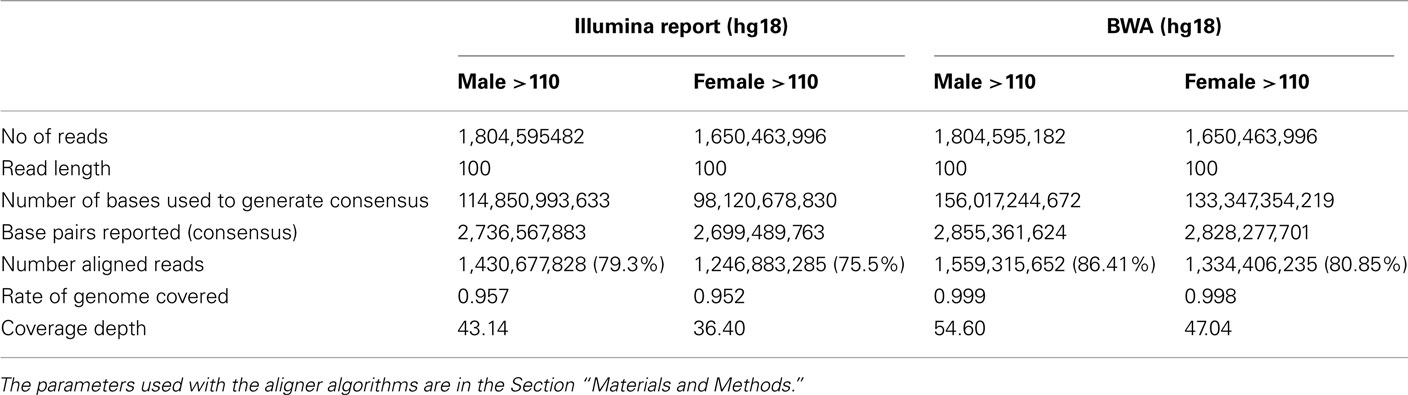
Table A1. Summary of sequencing and mapping using the Illumina aligner and the BWA aligner.
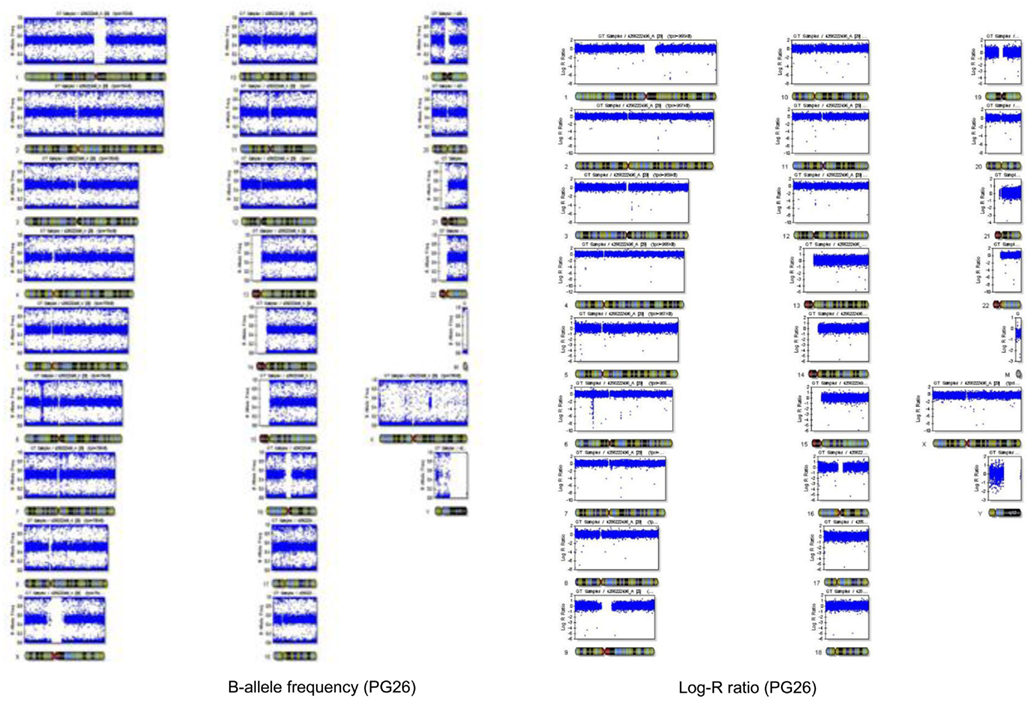
Figure A4. Plot of the B allele frequency and the log R ratio in PG26. The plot of B allele frequency shows that there are no large structural variations.
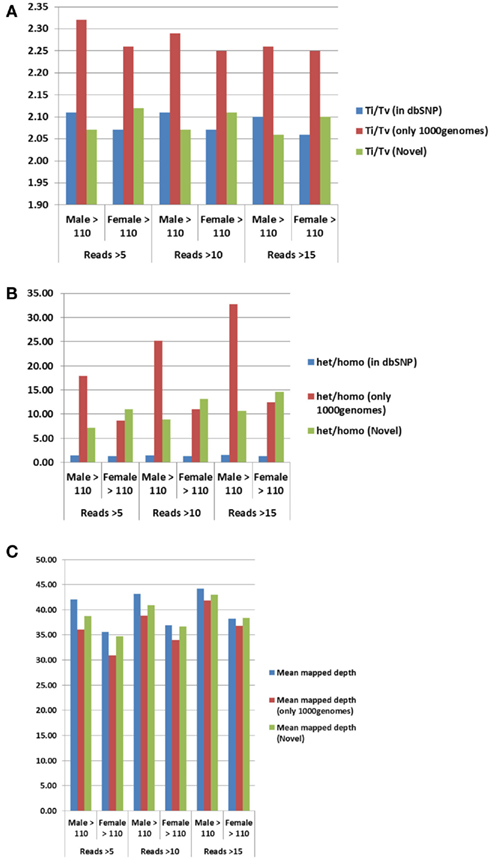
Figure A5. Trends in QC parameters. We evaluated the effect of tighter thresholds on the minimum coverage (=number of reads) on the transition to transversion ratio (A), the heterozygous to homozygous ratios (B) and the mean depths (C). The quality parameters appear to be stable for different thresholds on minimum coverage.
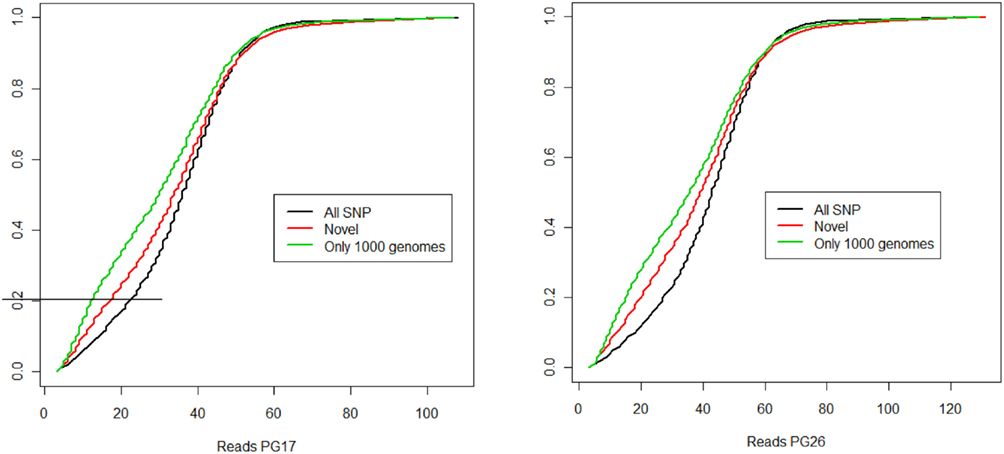
Figure A6. Cumulative distributions of depth. The plots show the cumulative distributions of SNPs with coverage < values in the x-axes. For example, 80% of the reads in PG17 have more than 20-fold coverage.
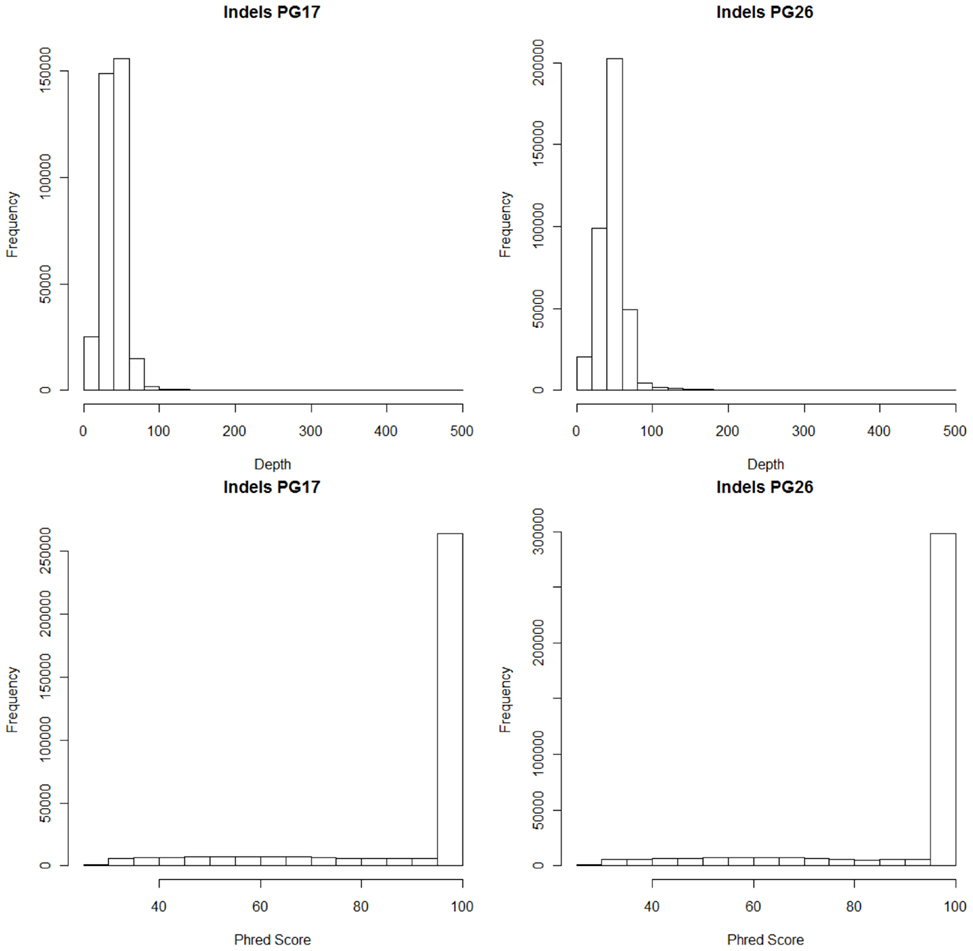
Figure A7. Distribution of coverage and Phred scores of indels.
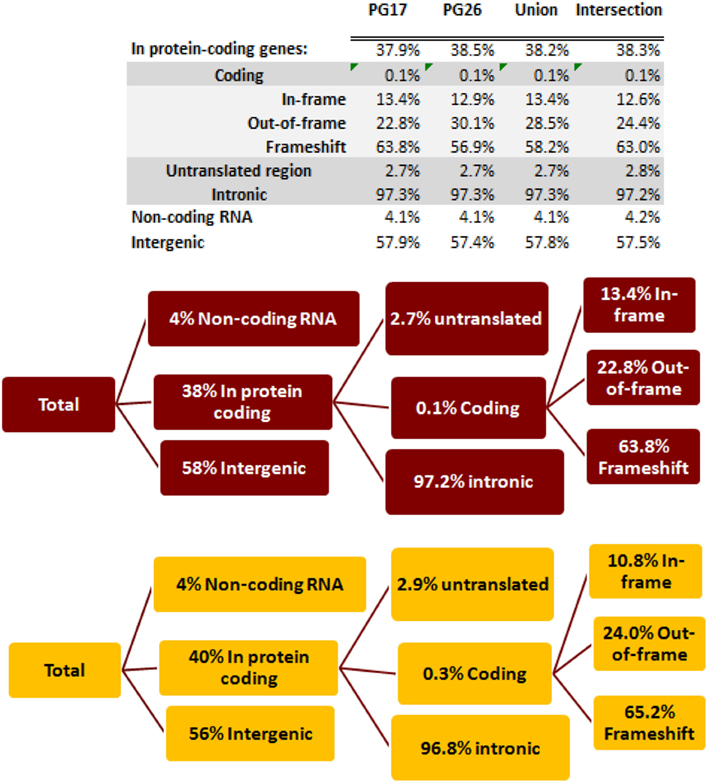
Figure A8. Functional analysis of the insertions detected in PG17 and PG26, their union and intersection. The chart in maroon shows the breakdown of insertions and the rate of coding insertions in PG17 and PG26. The chart in orange shows the summary of insertions in nine whole genomes generated from complete genomics and annotated in the same way as PG17 and PG26.
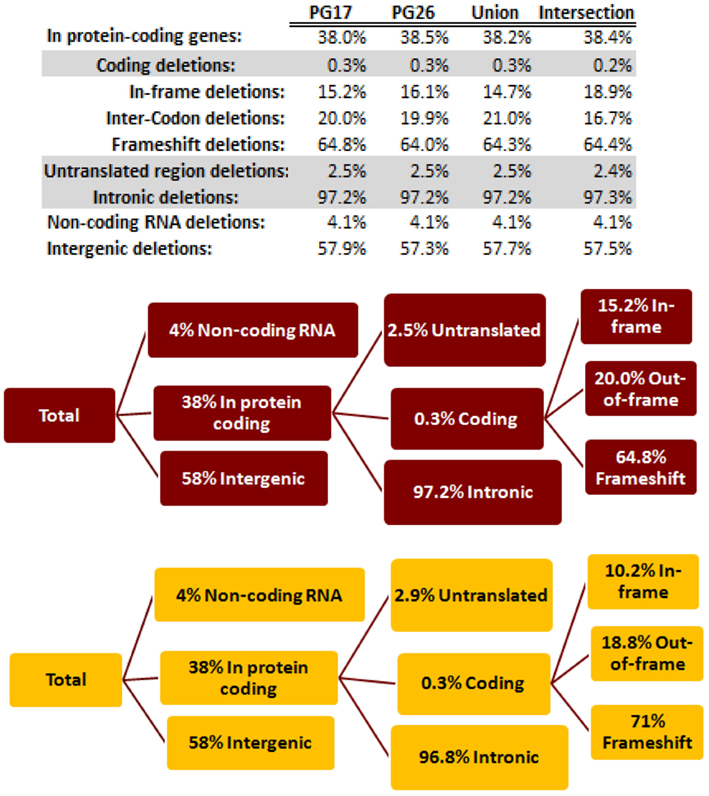
Figure A9. Functional analysis of the deletions detected in PG17 and PG26, their union and intersection. The chart in maroon shows the breakdown of deletions and the rate of coding deletions in PG17 and PG26. The chart in orange shows the summary of deletions in nine whole genomes generated from complete genomics and annotated in the same way as PG17 and PG26.
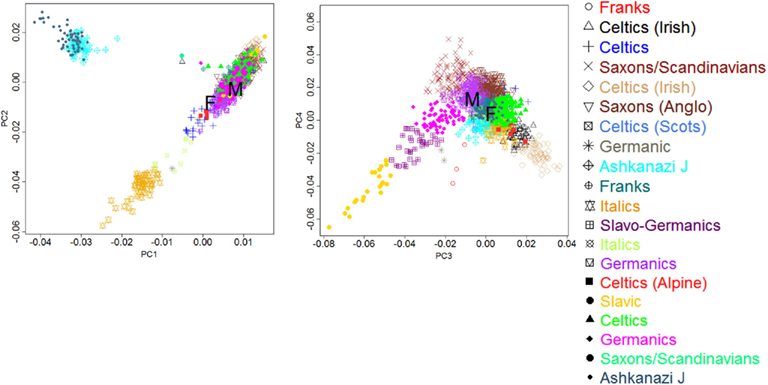
Figure A10. Population structure of the two supercentenarians. The two scatter plots display the principal components 1 and 2 (PCI and 2 PC2, top panels), and principal components 3 and 4 (PC3 and PC4, bottom panels) in 801 subjects from the NECS that were estimated using genome-wide data. We colored the points by one of 16 ancestral groups that were inferred using an algorithm described in Solovieff et al. (2010). The clusters were then labeled by ethnicity using the information about mother tongue and place of birth of NECS subjects and their parents. Based on the coordinates of the PCs of two subjects in the plots, we confirmed that the female had a mixed French/British ancestry, while the males had mainly a Germanic ancestry.
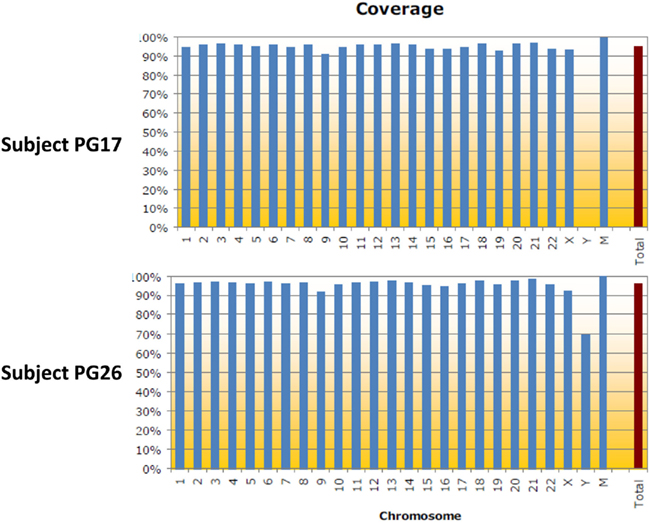
Figure A11. Genomic Coverage from ELAND. Barplots show the % of genomic coverage per chromosome when the reads were mapped to HG18 using the Illumina Elander aligner.
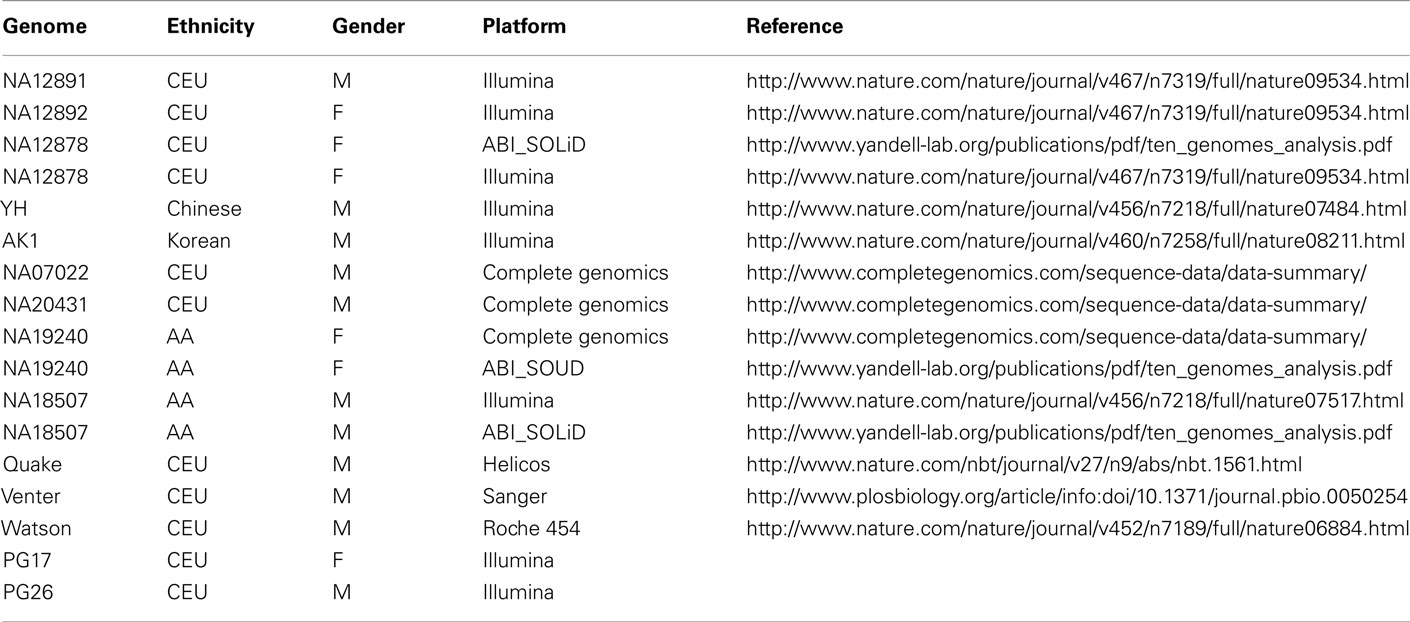
Table A2. List of genome sequences that were used for comparisons with PG17 and PG26.
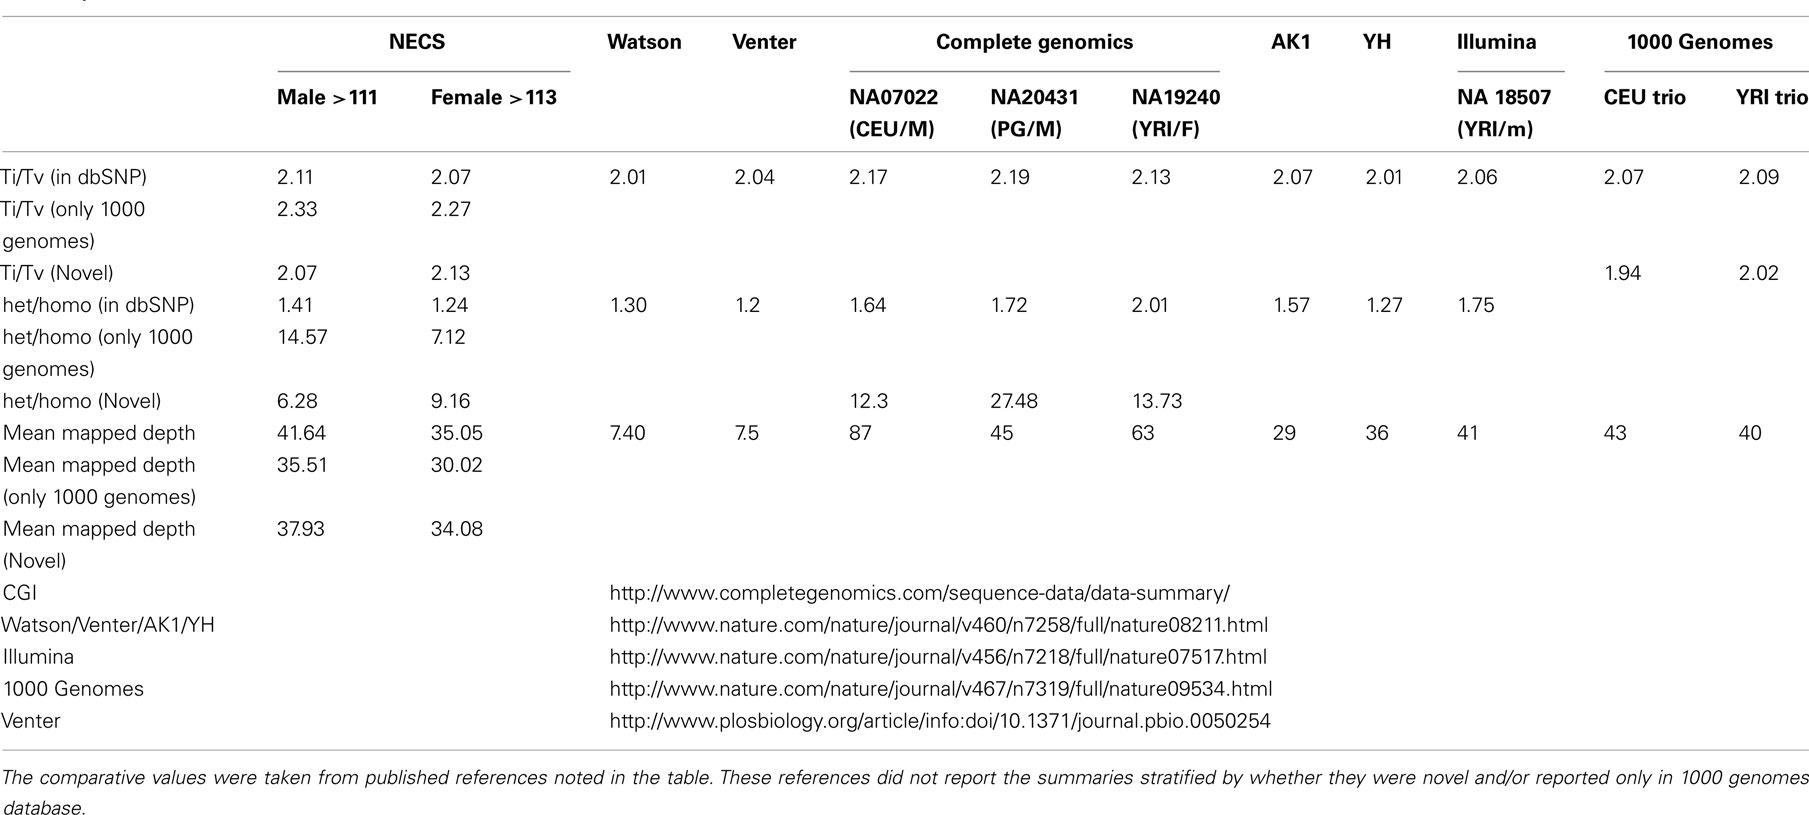
Table A3. Comparison of SNPs summaries in different genomes.
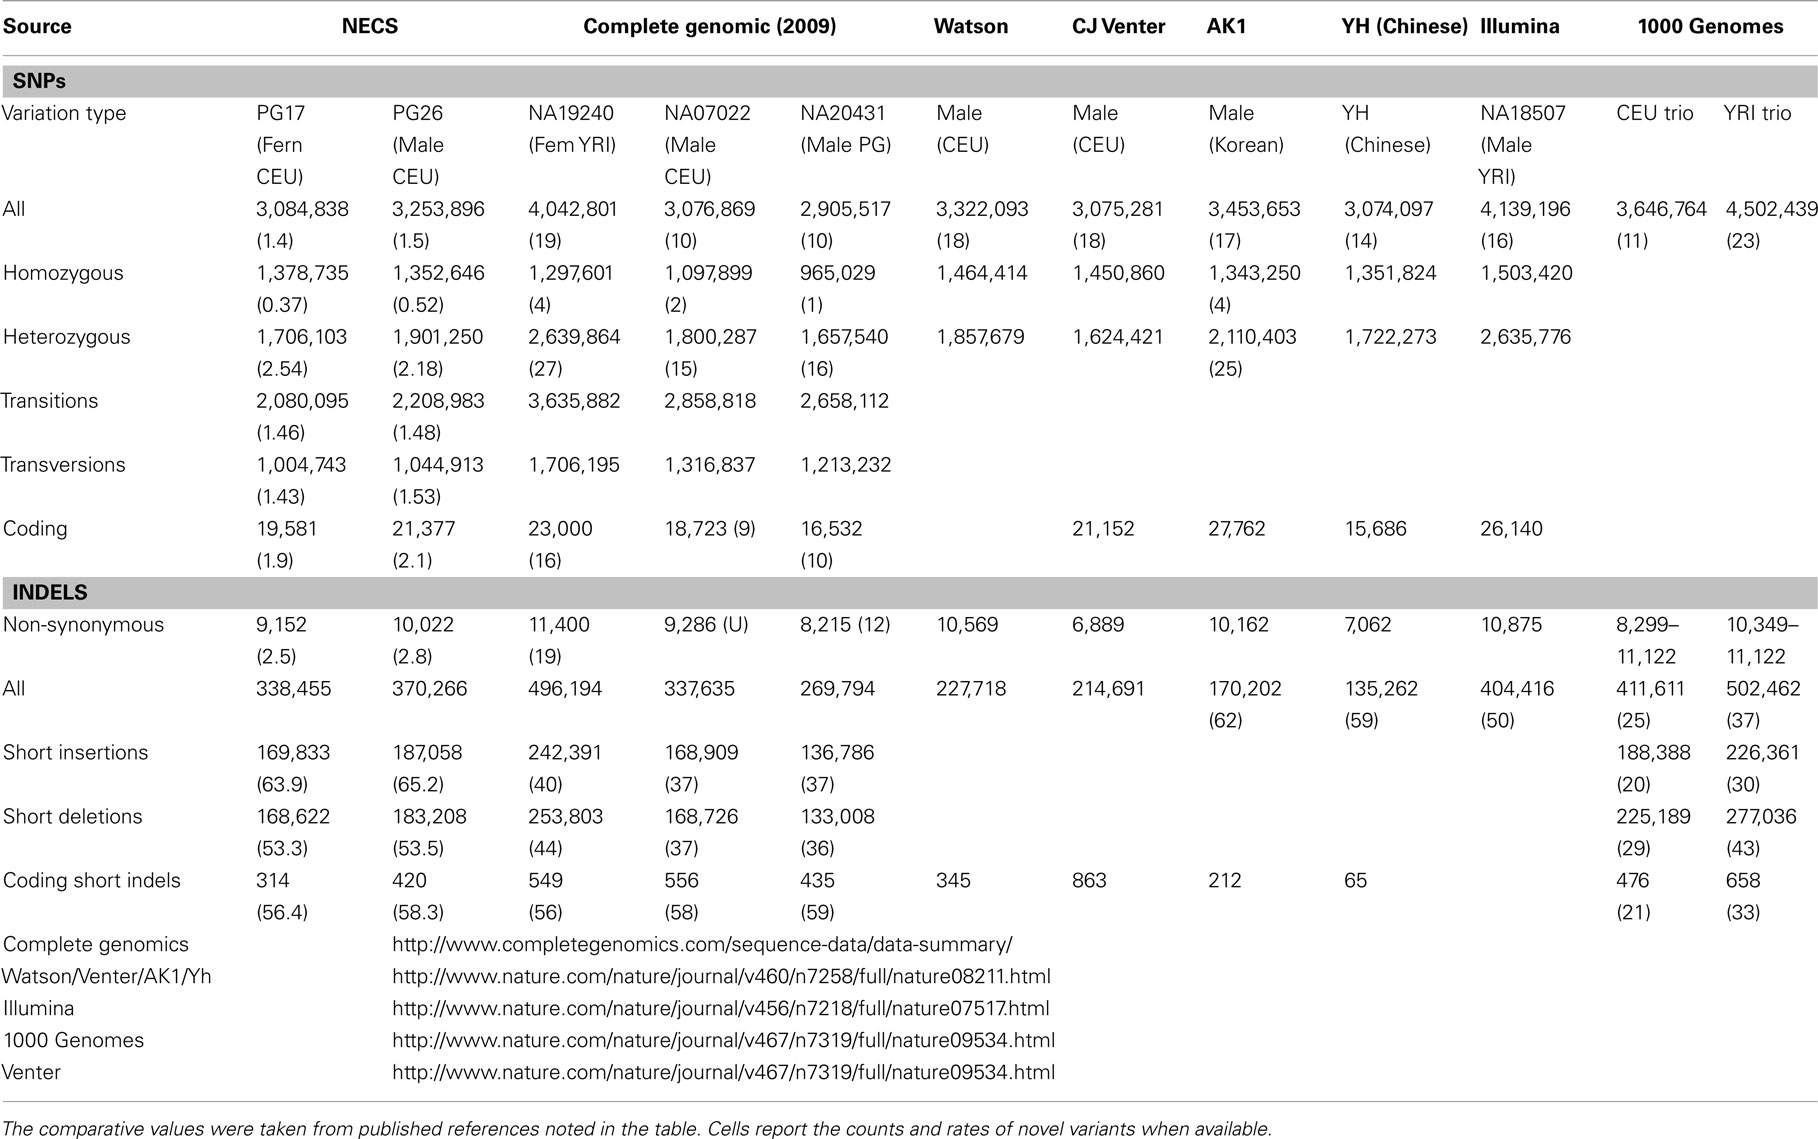
Table A4. Comparison of SNPs summaries in different genomes.
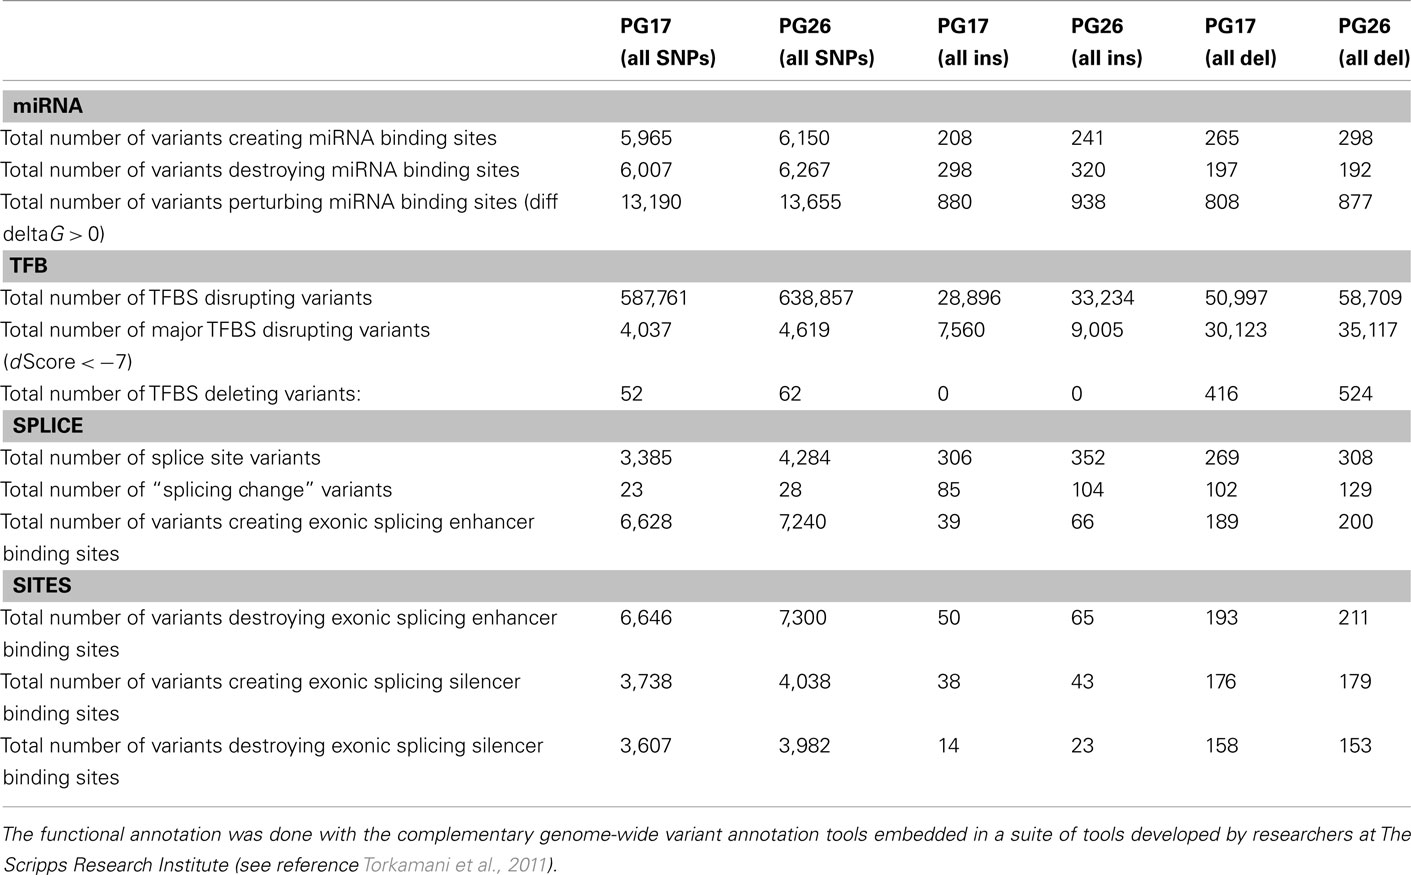
Table A5. Predicted functions (TFBS and miRs).
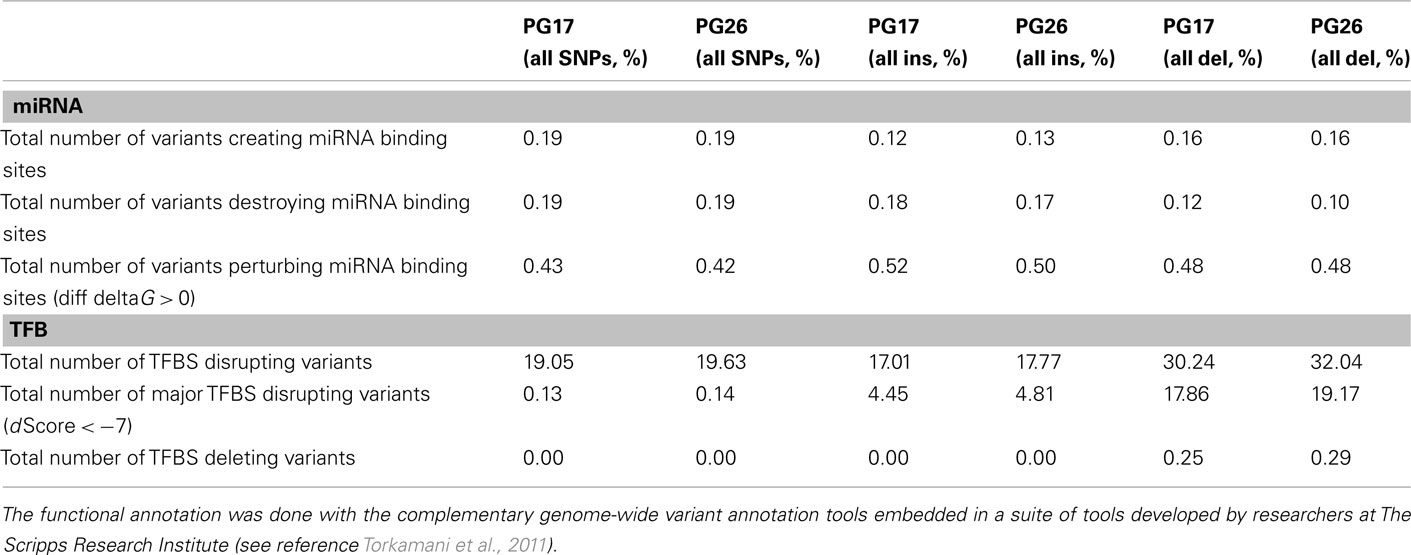
Table A6. Rates of SNPs and indels that affect microRNAs and transcription factor binding sites (TFBS).
Keywords: whole genome sequence, genetics, longevity, centenarian, supercentenarian, aging
Citation: Sebastiani P, Riva A, Montano M, Pham P, Torkamani A, Scherba E, Benson G, Milton JN, Baldwin CT, Andersen S, Schork NJ, Steinberg MH and Perls TT (2012) Whole genome sequences of a male and female supercentenarian, ages greater than 114 years. Front. Gene. 2:90. doi: 10.3389/fgene.2011.00090
Received: 20 October 2011; Accepted: 04 December 2011;
Published online: 03 January 2012.
Edited by:
Thomas Flatt, Vetmeduni Vienna, AustriaCopyright: © 2012 Sebastiani, Riva, Montano, Pham, Torkamani, Scherba, Benson, Milton, Baldwin, Andersen, Schork, Steinberg and Perls. This is an open-access article distributed under the terms of the Creative Commons Attribution Non Commercial License, which permits non-commercial use, distribution, and reproduction in other forums, provided the original authors and source are credited.
*Correspondence: Paola Sebastiani, Department of Biostatistics, Boston University School of Public Health, 801 Massachusetts Avenue, Room 317, Boston, MA 02118, USA. e-mail:c2ViYXNAYnUuZWR1; Thomas T. Perls, Geriatrics Section, Boston University Medical Campus, 88 E Newton St, Boston, MA 02118, USA. e-mail:dGhwZXJsc0BidS5lZHU=