


- 1 School of Medical Sciences, College of Life Sciences and Medicine, University of Aberdeen, Aberdeen, UK
- 2 Department of Human Genetics, The University of Chicago, Chicago, IL, USA
- 3 Department of Psychiatry and Behavioral Neuroscience, The University of Chicago, Chicago, IL, USA
Properties of muscle fibers, i.e., their type, number and size, are important determinants of functional characteristics of skeletal muscle, and of the quality of meat in livestock. Genetic factors play an important role in determining variation in fiber properties, however, specific genes remain largely elusive. We examined histological properties of soleus muscle fibers in two strains of mice exhibiting a twofold difference in muscle mass, LG/J and SM/J, and their F2 intercross. The total number of muscle fibers (555 ± 106; mean ± SD) did not differ between the strains or between males and females. A higher percentage of type I fibers was observed in the LG/J compared to the SM/J strain (P < 0.001) in both males (45 ± 3 vs. 37 ± 4%) and females (58 ± 4 vs. 41 ± 3%). Across strains, females had a higher percentage of type I fibers than males (P < 0.001), and the sex effect was greater in the LG/J strain (strain-by-sex interaction, P < 0.001). The cross-sectional area (CSA) did not differ between type I and type IIA fibers, but was greater in the LG/J than the SM/J strain (1365 ± 268 vs. 825 ± 229 μm2, P < 0.001). Three significant quantitative trait locus (QTL) affecting CSA for type I and type IIA fibers mapped to chromosomes (Chr) 1, 6, and 11 and three suggestive QTL for percentage of type I fibers mapped to Chr 2, 3, and 4. Within each significant QTL, regions of conserved synteny were also implicated in variation of similar traits in an analogous study in pigs. Our results provide the evidence that the intercross between the SM/J and LG/J strains is a promising model to search for genes affecting muscle fiber properties.
Introduction
Skeletal muscle has numerous biological functions including locomotion, thermoregulation, respiration, postural support, protection of bones and viscera, and also serves as a repository of amino acids in times of starvation or disease. Muscle tissue in livestock provides an essential source of dietary proteins containing a rich supply of micronutrients and essential amino acids for the growing human population.
Properties of skeletal muscle are determined mainly by the number, type, and size of muscle fibers. Based on rodent studies, the number of fibers is set during embryogenesis (Ontell et al., 1988), while fiber growth occurs mainly during postnatal life (Wirtz et al., 1983). Muscle fibers are heterogeneous and can vary in size and functional properties, such as their ability to develop contractile power and resistance to fatigue (Bottinelli and Reggiani, 2000). Human skeletal muscles are mainly comprised of a mixture of type I, IIA, and IIX muscle fibers (Schiaffino, 2010). Varying proportions of those fiber types affect functional properties of the muscle. Postural muscles, such as the soleus, predominantly consist of oxidative, fatigue resistant, type I fibers, whereas the proportion of glycolytic, fast twitch, type II fibers is higher in the phasic muscles (Johnson et al., 1973).
However, there is a substantial individual variation in the proportion of fiber types of homologous muscles in humans (Thorstensson et al., 1976). This variation has both functional and metabolic consequences. For instance, in sports, a high proportion of type I fibers appeared favorable for endurance events, whereas a low proportion of these fibers is suitable for speed, strength, and power events (Costill et al., 1976). Fiber types also appeared to be associated with the overall metabolism. For example, the risk of insulin resistance, obesity, and high blood pressure declines with an increasing proportion of type I fibers (Lillioja et al., 1987; Wade et al., 1990; Hernelahti et al., 2005). In livestock, the proportion of different fiber types is an important determinant of the commercial value of meat. A high proportion of type I fibers is a desirable trait leading to more tender and favorable meat quality (Sosnicki, 1987).
Genetic factors play an important role in the individual variation of muscle fiber types. Heritability estimates of the proportion of type I fibers range between 0.4 and 0.9 in humans (Komi et al., 1977; Simoneau and Bouchard, 1995). The effect of genetic factors has also been demonstrated for muscle fiber properties in mice (Nimmo et al., 1985; Totsuka et al., 2003; Girgenrath et al., 2005; Rehfeldt et al., 2005; Guderley et al., 2008), cattle (Stavaux et al., 1994), sheep (Koohmaraie et al., 1995; Carpenter et al., 1996), and pigs (Van den Maagdenberg et al., 2008). However, specific genes underlying these effects remain largely unknown.
Mice have been extensively used to study the biology of skeletal muscle. The soleus, unlike most of the muscles in mouse, consists of type I and type IIA fibers (Timson et al., 1985), which is similar to the composition of fiber types in humans. Furthermore, because all fibers pass through the belly of mouse soleus, a single cross-section can provide an accurate estimate of the abundance of muscle cells (Timson et al., 1985).
The LG/J and SM/J strains were divergently selected for large (Goodale, 1938) and small (MacArthur, 1944) body size, respectively. These strains provide a model for the elucidation of the genetic mechanisms underlying differences in body size. As muscle tissue constitutes a substantial portion of body weight, this selection resulted in approximately twofold difference in muscle mass (Lionikas et al., 2010). A set of tools were developed by Cheverud et al. (2004), including recombinant inbred strains and advanced intercross lines (Ehrich et al., 2005), for examination of the genetic architecture underlying phenotypic differences between the two strains. An F2 intercross between phenotypically diverging strains provides a first step of a classical quantitative trait locus (QTL) mapping strategy. The aim of this study was to initiate the search for genes affecting variation in the number of fibers, their size, and proportion of type I fibers in soleus muscle between the LG/J and SM/J strains of mice.
Materials and Methods
Muscle Samples
This study was carried out on soleus muscles dissected from males and females of the LG/J and SM/J inbred strains and the F2 intercross (see Table 1). Animals were maintained as previously described (Cheng et al., 2010) and sacrificed at 94 ± 4 days. All procedures were approved by the Institutional Animal Care and Use Committee of the University of Chicago. The methods for harvesting muscle tissue have been described previously (Lionikas et al., 2010). Because the extremes of the population are the main contributors of the linkage information in QTL mapping (Lander and Botstein, 1989), the top and bottom quartiles of 497 F2 mice stratified for soleus muscle weight within males and females were selected for histological analyses. The final sample size used in this study, after discarding cases with poor tissue quality, was 122 F2 mice, approximately equally divided between the upper and lower quartiles.
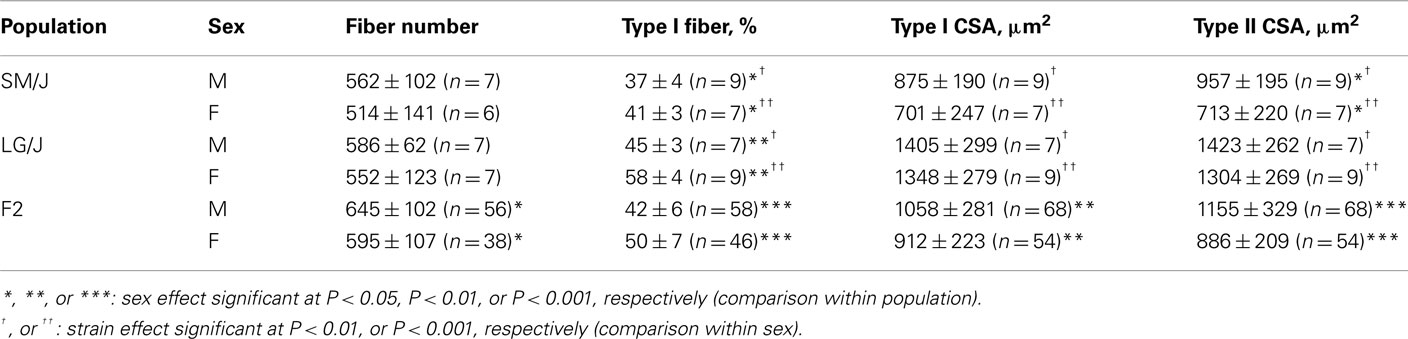
Table 1. Muscle fiber phenotypes of the LG/J and SM/J strains and their intercross population (mean ± SD).
Phenotypes
The soleus muscles were frozen in isopentane cooled in liquid nitrogen. Transverse sections from the belly of the muscle were cut at a thickness of 10 μm with a cryotome (Leica CM1850UV) at −20°C. The muscle samples were then subjected to ATPase staining (acid preincubation, pH 4.47) to distinguish between fiber types (Brooke and Kaiser, 1970).
Microscopic images of stained sections were taken at ×5 and ×20 magnification (Figure 1). Muscle fiber traits were manually analyzed using ImageJ software (NIH – version 1.43). The following phenotypes were assessed; muscle fiber number (type I and IIA) and percent of type I muscle fibers, cross-sectional area (CSA) of type I and type IIA fibers.
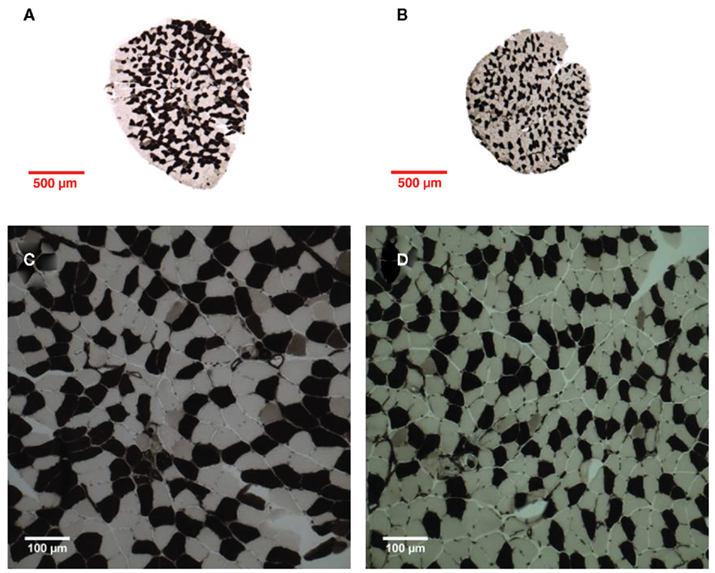
Figure 1. Representative images of LG/J (left) and SM/J (right) male soleus cross-sections following myosin ATPase staining (acid preincubation). (A,B) ×5 Magnification, (C,D) ×20 magnification. Dark fibers type I, pale fibers type IIA.
Fiber CSA’s were measured on ×20 images. For each fiber type, 25 measurements were taken to obtain a value representing the mean CSA of type I or type IIA fibers for that muscle. This was deemed as a representative sample by empirical testing (the mean of 25 randomly selected fibers, ∼10% of the same type of fibers per muscle, deviated only 1 out of 100 times from that of all fibers of the muscle at P < 0.05). Muscle fiber numbers were assessed on ×5 images. As all fibers in mouse soleus pass through the belly of the muscle (Timson et al., 1985), this method provides an accurate estimate of the number of fibers constituting the muscle. Total number of type I fibers and total number of type IIA fibers were counted, permitting derivation of percentage of type I fibers.
Statistical Analyses
The SPSS statistical package was used (SPSS Statistics 17.0). Data are presented as mean ± SD, unless otherwise stated.
A two-way ANOVA was used to examine the effects of strain and sex on total number of fibers and percentage of type I fibers in the parental strains. The CSA of type I and type IIA fibers was analyzed using a two-way paired-measures ANOVA. In the F2 intercross, Pearson or Spearman correlation analyses were carried out depending on Kolmogorov–Smirnoff tests of normality.
QTL Mapping
The F2 mice genotyped at 160 SNP markers approximately evenly distributed across the genome were used (Cheng et al., 2010). Interval mapping analysis was performed using the R/qtl package (R 2.10.1; Broman et al., 2003). Due to the sex differences in muscle mass in these mice (Lionikas et al., 2010), and the discovery of sex-specific QTL in other studies (Lionikas et al., 2003, 2005), we included sex as an additive and interacting covariate. Although solei from top and bottom quartiles of muscle weight were selectively phenotyped, the distribution of muscle fiber traits did not significantly deviate from the normal distribution. Significance thresholds were derived using 1000 permutations for each phenotype using R/qtl. The confidence intervals for each of the QTL were defined as the 1.5-LOD drop off on either side of the peak of the QTL (note that 1.5-LOD intervals may not be 95% confidence intervals; Manichaikul et al., 2006). This interval was expressed in physical map units (megabase) by using the nearest genotyped SNP that flanked the support interval. Limited sample sizes precluded a meaningful search for epistatic interactions.
Terms for all significant QTL and for sex were included in a multiple regression model using the fitqtl function of the R/qtl package (Broman et al., 2003). Because of the limited sample size only the most robust QTL were subjected to this analysis. Terms not significantly (P ≥ 0.05) contributing to the regression model were dropped one at a time until only significant terms remained.
Comparative Genomics
The search for the regions of conserved synteny between mouse (Build 37.2), pig (Sscrofa9.2), and cattle (Build 5.2) implicated in QTL influencing muscle fiber traits in each species was carried out using comparative genomic methods. First, in the Animal QTL database1, we identified QTL affecting muscle fiber properties in pig and cattle. Then these QTL were projected to the regions of mouse genome using Synteny function in Ensembl genome browser2. Only significant QTL from each species were subjected to this analysis.
Results
Phenotypic Analyses of Parental Strains
Number of fibers
The soleus muscle consisted of an average of 555 ± 106 fibers. There were no statistically significant effects of strain (P = 0.107) or sex (P = 0.155) on this variable, however, the strain-by-sex interaction approached statistical significance (P = 0.053).
Percentage of type I fibers
There was a significant strain-by-sex interaction (P < 0.001) characterized by a greater proportion of type I fibers in the LG/J strain which was particularly apparent in females (Table 1).
CSA of muscle fibers
The CSA was similar between type I and type IIA fibers (P = 0.516), and larger in the LG/J compared to the SM/J strain (P < 0.0001). Fibers in males tended to have larger CSA compared to females although the difference did not reach statistical significance (P = 0.088; Table 1). The strain-by-sex interaction term was not statistically significant either.
Muscle Fiber Traits in the F2 Intercross
The total number of soleus fibers in the F2 mice was comparable to that of the parental strains (Table 1) and slightly higher in males than females (P < 0.03). The percentage of type I fibers was higher in females than males (P < 0.0001). There was a significant sex-by-fiber type interaction (P < 0.0001) for CSA, type I fibers were smaller than type IIA fibers in males (P < 0.0001) but not in females (P = 0.11).
The CSA of type I and type IIA fibers were the only two traits that were significantly correlated (correlation corrected for sex, r = 0.879, P < 0001). The total number of fibers and CSA of type I and type IIA fibers was positively correlated with soleus weight in both males and females (Table A1 in Appendix), whereas the inverse association of soleus weight with the percentage of type I fibers in males or females was not statistically significant.
QTL Analyses
We identified significant and suggestive QTL for CSA of type I and type IIA fibers, and suggestive QTL for the percentage of type I fibers, however, no QTL was detected for the total number of fibers (Figure 2).
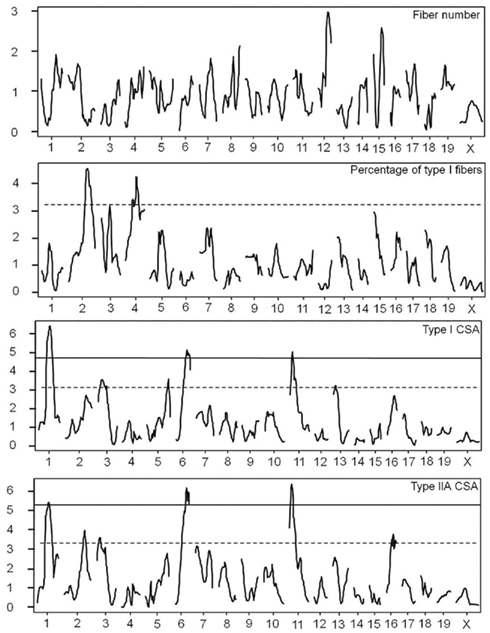
Figure 2. Genome wide LOD plots of QTL analyses of fiber number, percentage of type I fibers, and CSA of type I and type IIA muscle fibers in the F2 intercross. The X-axis indicates the relative position in the linkage map and the Y-axis represents the LOD score. Solid line marks 5% genome wide threshold, dotted line marks 37% genome wide threshold.
Significant QTL for CSA on chromosomes 1, 6, and 11 overlapped between type I and type IIA fiber types. We named these muscle fiber QTL Mfq1, Mfq2, and Mfq3, respectively. The LG/J allele conferred a greater CSA at all significant QTLs. Similarly, for all but one of the suggestive QTL the LG/J allele also conferred a greater CSA of the fibers (chromosomes 2, 5, 13, and 16, but not 3; see Table 2). Significant QTL individually explained between 6.1 and 11.2% of phenotypic variation, in aggregate accounting for ∼30 and ∼28% of variance of type I CSA and type IIA CSA, respectively. The effect of the Mfq3 locus appeared to be male-specific (Figure 3).
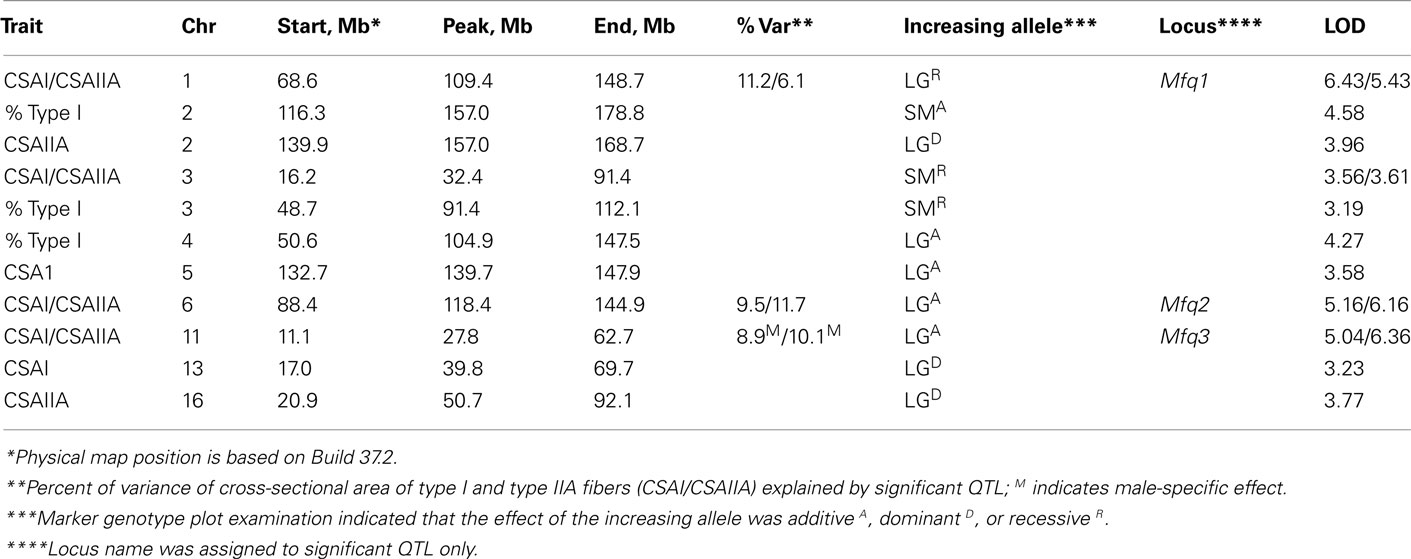
Table 2. Characteristics of muscle fiber QTL in F2 intercross of LG/J and SM/J strains.
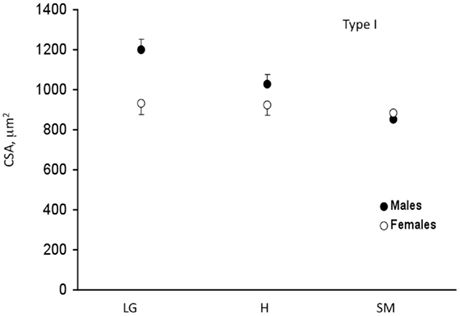
Figure 3. Sex specificity of Mfq3 locus on cross-sectional area (CSA) of soleus type I fibers in F2 intercross. Mean and SEM. LG, homozygous for LG/J allele; H, heterozygous; SM, homozygous for SM/J allele. Type IIA fiber data showed similar pattern (not shown).
Suggestive QTL for the percentage of type I fibers were detected on chromosomes 2, 3, and 4 with the SM/J increasing allele increasing type I fiber percentage on chromosomes 2 and 3 and the LG/J allele increasing on chromosome 4. The position of the QTL affecting CSA of type IIA fibers and percentage of type I fibers overlapped on chromosome 2, however, different alleles conferred an increasing effect (LG/J and SM/J, respectively). There was also some positional overlap between QTL for CSA of the fibers and percentage of type I fibers on chromosome 3. In both instances an increase was associated with SM/J allele.
Analyses of Conserved Synteny
Using comparative genomics methods, we identified several concordant QTL mapping to conserved syntenic regions of mouse and pig genomes. Four regions within the Mfq1 locus and one in Mfq2 and Mfq3 loci were implicated in variation of muscle fiber diameter in pig (Figure 4). No concordant QTL mapping to conserved syntenic regions between mouse and cattle were found.
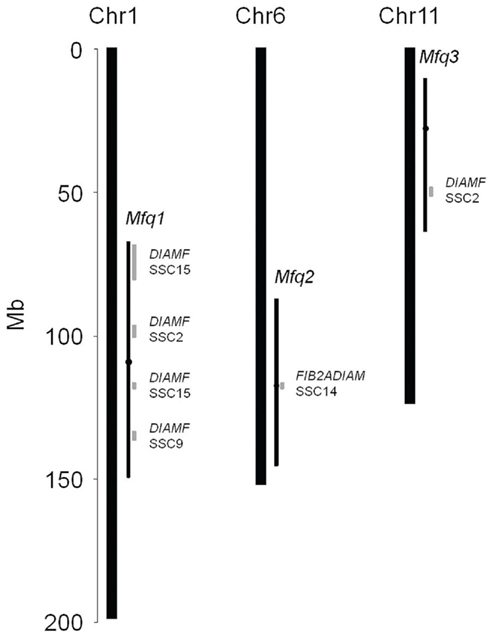
Figure 4. Comparative genomics of concordant mouse and pig QTL of muscle fiber area. Thick bars depict mouse chromosomes. Thin black bars with black circle depict the 1.5-LOD drop off interval and peak position, respectively, of muscle fiber QTL identified in the present study. Thin gray bars represent regions of conserved synteny of pig chromosomes (SSC) involved in variation of diameter of fibers (DIAMF, Wimmers et al., 2006) or diameter of IIA fibers (FIB2ADIAM, Estellé et al., 2008).
Discussion
A recent study on muscle weight in LG/J and SM/J strains identified a twofold difference in soleus muscle size between them (Lionikas et al., 2010). The present report provides some insight into the mechanisms underlying this difference. It appeared that there is no difference in the number of muscle fibers between the LG/J and SM/J strains, however, the percentage of type I fibers was higher and CSA, of both type I and type IIA fibers, was greater in LG/J strain. This difference in the percentage of type I fibers could not noticeably contribute to the muscle mass difference between the strains because the CSA of both types of fibers was similar. The between-strain comparison revealed that the CSA of LG/J strain fibers were 1.5–1.9-fold larger compared to that of SM/J strain fibers, and could explain a substantial fraction of the difference in muscle weight.
Based on the findings on the muscle fiber traits, we hypothesize that the between-strain differences have arisen at different developmental and growth stages and that distinct mechanisms are responsible for the differences in the percentage of type I fibers and CSA of the fibers. Specifically, the number of soleus fibers is set prenatally (Wirtz et al., 1983; Ontell et al., 1988) while the CSA increases with postnatal growth (Wirtz et al., 1983). At birth, all mouse soleus fibers histologically appear as type I, then the composition of fibers undergoes a rapid transformation and the proportion of type I and type IIA fibers acquired by the third week of age remains constant throughout most of their lifespan (Wirtz et al., 1983). The hypothesis of an independent control of the two traits is consistent with the fact that the CSA of type I and type IIA fibers in the F2 population correlated positively and strongly but neither correlated with the total number of fibers. Similarly, the percentage of type I fibers did not correlate with the total fiber number either.
To the best of our knowledge, this is the first QTL study on muscle fiber properties in the mouse. The QTL analysis identified three muscle fiber QTL affecting the CSA of type I and IIA fibers, Mfq1, Mfq2, and Mfq3, together explaining more than a quarter of the phenotypic variance. However, quantification of the effect sizes has to be treated cautiously for two reasons; the bias due to selection of a subset of samples makes the effect size estimate uncertain (Saunak Sen, personal communication), furthermore, the R2 values tend to be inflated particularly in small samples (McClendon, 1994). The overlapping effect of these loci on both types of fibers is not unexpected considering the strong phenotypic correlation between these two variables. The Mfq2 and Mfq3 loci also encompassed the confidence intervals of several QTL affecting muscle weight in crosses between LG/J and SM/J (Lionikas et al., 2010). Some overlap between soleus weight and the CSA of its fibers was anticipated based on a significant correlation between these variables (Table A1 in the Appendix). Interestingly the Mfq1 locus on chromosome 1 appears to be fiber-specific as it has not been implicated in muscle weight analyses. This finding indicates that tissue analyses at the cellular level (e.g., size of the fibers and proportion of different fiber types) can lead to novel QTL not captured in the analyses of composite phenotypes such as weight.
The effect of the Mfq3 locus appeared more pronounced in males than in females. Sex-specific QTL of muscle traits in mouse are not uncommon (Brockmann et al., 2000; Lionikas et al., 2003, 2005) and suggest involvement of sex-specific hormones, however, the precise underlying mechanisms remain unknown.
The percentage of type I fibers was higher in the soleus of the LG/J strain compared to SM/J by 8 and 17 percentage points in males and females, respectively (Table 1). Strain differences in this trait have been reported before (Van der Laarse et al., 1984; Nimmo et al., 1985; Totsuka et al., 2003) but the underlying genetic mechanisms remain poorly understood. We mapped three suggestive QTL affecting the percentage of type I fibers. The SM/J allele conferred increasing percentage of type I fibers in two of those QTL. Observation of an increasing allele from the strain with lower overall phenotypic value is not unusual in polygenic traits particularly when the strains were not selected for divergence in the phenotype in question (Lionikas et al., 2003, 2005).
Previous fiber typing studies on the soleus in various genetic backgrounds of mice found that soleus fiber numbers ranged from anywhere between 450 and 984 muscle fibers (Rowe and Goldspink, 1969; Luff and Goldspink, 1970; Timson, 1982; Wirtz et al., 1983; Ontell et al., 1988; Summers and Medrano, 1994; Rehfeldt et al., 1999). The total number of soleus fibers identified in the present study was within this range. Interestingly, however, it did not differ between the two strains suggesting that there might be not any alleles segregating that affect fiber formation. However, it is also possible that both increasing and decreasing alleles in each strain can result in similar phenotypic values between strains (Darvasi and Soller, 1992; Jin et al., 2004; Sen et al., 2009).
Several studies have reported genetic effects on muscle fiber properties in the mouse model. The “mini muscle” locus which is known to affect muscle fiber area has been mapped to 67.4–70.1 Mb on chromosome 11 (Guderley et al., 2006; Hartmann et al., 2008) in close proximity of the Mfq3 locus, however the underlying gene(s) remain unknown. Effects of single genes on muscle fiber area were observed in several knockout or mutant models. Those genes code for proteins involved in regulation of transcription, Stat5a and Stat5b (Klover et al., 2009), Ppargc1a (Leick et al., 2009); growth, Ky (Blanco et al., 2001); growth and metabolism-related signaling, myostatin (McPherron et al., 1997), leptin (Sáinz et al., 2009), calcineurin (Parsons et al., 2003); defense against oxidative stress, Sod1 (Bordet et al., 1999); structural integrity, alpha-actinin-3 (Macarthur et al., 2008), dystrophin (Briguet et al., 2004); and contractile function, IIB myosin heavy chains (Allen et al., 2001). Disruption of those genes often led to pathological phenotypes not observed in the present study. However, it is conceivable that our population contains different alleles that result in milder phenotypes. None of these genes, however, reside within support intervals of significant QTL identified in the present study. Thus the cross of LG/J and SM/J strains has the potential to uncover genes which have not been previously implicated in muscle fiber properties. Processing of solei samples from an advanced intercross (Lionikas et al., 2010) will permit us to improve the resolution of QTL mapping facilitating nomination of the candidate genes.
Because the variation in the number of muscle fibers and their size can contribute to the variation in body weight, some overlap between the genetic architecture of these variables is plausible in the crosses involving the LG/J and SM/J strains. In support of this assumption, the Mfq1 locus was found to coincide with the body weight locus Bwtn2 indentified in a cross between the two strains (Kenney-Hunt et al., 2006). In addition, the Mfq1 and Mfq2 loci overlapped with the Obesity and body weight QTL in a cross between the SM/J and NZB/BINJ inbred strains, Obwq1 and Obwq3, respectively (Stylianou et al., 2006).
Comparative Genomics
It is reasonable to assume that the same genes are involved in variation of concordant traits in different species. The myostatin gene affecting mouse (Rehfeldt et al., 2005), cattle (McPherron and Lee, 1997), dog (Mosher et al., 2007), and human (Schuelke et al., 2004) muscle is an important illustration of such across-species effects on this tissue. While this study presents the first QTL scan for muscle fiber traits in mouse, similar analyses in pig and cattle. The order of genes across chromosomal segments is often preserved across different species. Such regions are called syntenic or regions of conserved synteny (Nadeau and Taylor, 1984). Synteny can be used to obtain supportive evidence for the identified QTL and it can also help narrow down the area of search for the underlying genes (Burgess-Herbert et al., 2008). Four regions (between 69–96, 97–100, 115–118, and 133–149 Mb) within the Mfq1 locus overlapped with syntenic regions in pig that contain QTL affecting the diameter of fibers, DIAMF, on SSC2, 4, 9, and 15 (Wimmers et al., 2006). We found only one syntenic region in the Mfq2 locus (116–118 Mb), which was also implicated in diameter of pig IIA fibers QTL, FIB2ADIAM, on SSC14 (Estellé et al., 2008). The Msf3 locus contained a syntenic region (48–51 Mb) implicated in DIAMF QTL on SSC2 (Wimmers et al., 2006). Thus, comparative genomics findings supported the role of all Mfq loci in determining the size of muscle fibers. Furthermore, this analysis suggested that homologous genes within the regions of conserved synteny could be underlying the effects of the QTL.
In conclusion, we identified three significant QTL contributing to the difference in CSA of muscle fibers between the LG/J and SM/J strains. Regions of conserved synteny from the identified loci were also implicated in fiber phenotypes in pig supporting the importance of these genomic regions in determining muscle fiber properties.
The authors are grateful for the help received from the University of Aberdeen histology and microscopy facilities, Dr. Jenny Gregory and Mrs. Gillian Milne. The authors are also thankful to Dr. David Blizard and Dr. Stuart Gray for the comments on the manuscript and to the two anonymous reviewers for constructive criticism and suggestions. Grants: Marie Curie International Re-integration Grant 249156 and AR056280 to Arimantas Lionikas; DA021336, MH079103, DA024845 to Abraham A. Palmer.
Conflict of Interest Statement
The authors declare that the research was conducted in the absence of any commercial or financial relationships that could be construed as a potential conflict of interest.
Footnotes
References
Allen, D. L., Harrison, B. C., Sartorius, C., Byrnes, W. C., and Leinwand, L. A. (2001). Mutation of the IIb myosin heavy chain gene results in muscle fiber loss and compensatory hypertrophy. Am. J. Physiol. Cell Physiol. 280, C637–C645.
Blanco, G., Coulton, G. R., Biggin, A., Grainge, C., Moss, J., Barrett, M., Berquin, A., Maréchal, G., Skynner, M., Van Mier, P., Nikitopoulou, A., Kraus, M., Ponting, C. P., Mason, R. M., and Brown, S. D. M. (2001). The kyphoscoliosis (ky) mouse is deficient in hypertrophic responses and is caused by a mutation in a novel-specific protein. Hum. Mol. Genet. 10, 9–16.
Bordet, T., Schmalbruch, H., Pettmann, B., Hagege, A., Castelnau-Ptakhine, L., Kahn, A., and Haase, G. (1999). Adenoviral cardiotrophin-1 gene transfer protects pmn mice from progressive motor neuronopathy. J. Clin. Invest. 104, 1077–1085.
Bottinelli, R., and Reggiani, C. (2000). Human skeletal muscle fibres: molecular and functional diversity. Prog. Biophys. Mol. Biol. 73, 195–262.
Briguet, A., Courdier-Fruh, I., Foster, M., Meier, T., and Magyar, J. P. (2004). Histological parameters for the quantitative assessment of muscular dystrophy in the mdx-mouse. Neuromuscul. Disord. 14, 675–682.
Brockmann, G. A., Kratzsch, J., Haley, C. S., Renne, U., Schwerin, M., and Karle, S. (2000). Single QTL effects, epistasis, and pleiotropy account for two-thirds of the phenotypic F2 variance of growth and obesity in DU6i x DBA/2 mice. Genome Res. 10, 1941–1957.
Broman, K. W., Wu, H., Sen, S., and Churchill, G. A. (2003). R/qtl: QTL mapping in experimental crosses. Bioinformatics 19, 889–890.
Brooke, M. H., and Kaiser, K. K. (1970). Muscle fiber types: how many and what kind? Arch. Neurol. 23, 369–379.
Burgess-Herbert, S. L., Cox, A., Tsaih, S.-W., and Paigen, B. (2008). Practical applications of the bioinformatics toolbox for narrowing quantitative trait loci. Genetics 180, 2227–2235.
Carpenter, C. E., Rice, O. D., Cockett, N. E., and Snowder, G. D. (1996). Histology and composition of muscles from normal and callipyge lambs. J. Anim. Sci. 74, 388–393.
Cheng, R., Lim, J. E., Samocha, K. E., Sokoloff, G., Abney, M., Skol, A. D., and Palmer, A. A. (2010). Genome-wide association studies and the problem of relatedness among advanced intercross lines and other highly recombinant populations. Genetics 185, 1033–1044.
Cheverud, J. M., Ehrich, T. H., Kenney, J. P., Pletscher, L. S., and Semenkovich, C. F. (2004). Genetic evidence for discordance between obesity- and diabetes-related traits in the LGXSM recombinant inbred mouse strains. Diabetes 53, 2700–2708.
Costill, D. L., Fink, W. J., and Pollock, M. L. (1976). Muscle fiber composition and enzyme activities of elite distance runners. Med. Sci. Sports Exerc. 8, 96–100.
Darvasi, A., and Soller, M. (1992). Selective genotyping for determination of linkage between a marker locus and a quantitative trait locus. Theor. Appl. Genet. 85, 353–359.
Ehrich, T. H., Hrbek, T., Kenney-Hunt, J. P., Pletscher, L. S., Wang, B., Semenkovich, C. F., and Cheverud, J. M. (2005). Fine-mapping gene-by-diet interactions on chromosome 13 in a LG/J × SM/J murine model of obesity. Diabetes 54, 1863–1872.
Estellé, J., Gil, F., Vázquez, J. M., Latorre, R., Ramírez, G., Barragán, M. C., Folch, J. M., Noguera, J. L., Toro, M. A., and Pérez-Enciso, M. (2008). A quantitative trait locus genome scan for porcine muscle fiber traits reveals overdominance and epistasis. J. Anim. Sci. 86, 3290–3299.
Girgenrath, S., Song, K., and Whittemore, L. A. (2005). Loss of myostatin expression alters fiber-type distribution and expression of myosin heavy chain isoforms in slow- and fast-type skeletal muscle. Muscle Nerve 31, 34–40.
Goodale, H. D. (1938). A study of the inheritance of body weight in the albino mouse by selection. J. Hered. 29, 101–112.
Guderley, H., Houle-Leroy, P., Diffee, G. M., Camp, D. M., and Garland, T. Jr. (2006). Morphometry, ultrastructure, myosin isoforms, and metabolic capacities of the “mini muscles” favoured by selection for high activity in house mice. Comp. Biochem. Physiol. B Biochem. Mol. Biol. 144, 271–282.
Guderley, H., Joanisse, D. R., Mokas, S., Bilodeau, G. M., and Garland, T. Jr. (2008). Altered fibre types in gastrocnemius muscle of high wheel-running selected mice with mini-muscle phenotypes. Comp. Biochem. Physiol. B Biochem. Mol. Biol. 149, 490–500.
Hartmann, J., Garland, T., Hannon, R. M., Kelly, S. A., Muñoz, G., and Pomp, D. (2008). Fine mapping of “mini-muscle,” a recessive mutation causing reduced hindlimb muscle mass in mice. J. Hered. 99, 679–687.
Hernelahti, M., Tikkanen, H. O., Karjalainen, J., and Kujala, U. M. (2005). Muscle fiber-type distribution as a predictor of blood pressure: a 19-year follow-up study. Hypertension 45, 1019–1023.
Jin, C., Lan, H., Attie, A. D., Churchill, G. A., Bulutuglo, D., and Yandell, B. S. (2004). Selective phenotyping for increased efficiency in genetic mapping studies. Genetics 168, 2285–2293.
Johnson, M. A., Polgar, J., Weightman, D., and Appleton, D. (1973). Data on the distribution of fibre types in thirty-six human muscles. An autopsy study. J. Neurol. Sci. 18, 111–129.
Kenney-Hunt, J. P., Vaughn, T. T., Pletscher, L. S., Peripato, A., Routman, E., Cothran, K., Durand, D., Norgard, E., Perel, C., and Cheverud, J. M. (2006). Quantitative trait loci for body size components in mice. Mamm. Genome 17, 526–537.
Klover, P., Chen, W., Zhu, B.-M., and Hennighausen, L. (2009). Skeletal muscle growth and fiber composition in mice are regulated through the transcription factors STAT5a/b: linking growth hormone to the androgen receptor. FASEB J. 23, 3140–3148.
Komi, P. V., Viitasalo, J. H. T., and Havu, M. (1977). Skeletal muscle fibres and muscle enzyme activities in monozygous and dizygous twins of both sexes. Acta Physiol. Scand. 100, 385–392.
Koohmaraie, M., Shackelford, S. D., Wheeler, T. L., Lonergan, S. M., and Doumit, M. E. (1995). A muscle hypertrophy condition in lamb (callipyge): characterization of effects on muscle growth and meat quality traits. J. Anim. Sci. 73, 3596–3607.
Lander, E. S., and Botstein, S. (1989). Mapping Mendelian factors underlying quantitative traits using RFLP linkage maps. Genetics 121, 185.
Leick, L., Hellsten, Y., Fentz, J., Lyngby, S. S., Wojtaszewski, J. F. P., Hidalgo, J., and Pilegaard, H. (2009). PGC-1α mediates exercise-induced skeletal muscle VEGF expression in mice. Am. J. Physiol. Endocrinol. Metabol. 297, E92–E103.
Lillioja, S., Young, A. A., Culter, C. L., Ivy, J. L., Abbott, W. G., Zawadzki, J. K., Yki-Järvinen, H., Christin, L., Secomb, T. W., and Bogardus, C. (1987). Skeletal muscle capillary density and fiber type are possible determinants of in vivo insulin resistance in man. J. Clin. Invest. 80, 415–424.
Lionikas, A., Blizard, D. A., Gerhard, G. S., Vandenbergh, D. J., Stout, J. T., Vogler, G. P., McClearn, G. E., and Larsson, L. (2005). Genetic determinants of weight of fast- and slow-twitch skeletal muscle in 500-day-old mice of the C57BL/6J and DBA/2J lineage. Physiol. Genomics 21, 184–192.
Lionikas, A., Blizard, D. A., Vandenbergh, D. J., Glover, M. G., Stout, J. T., Vogler, G. P., McClearn, G. E., and Larsson, L. (2003). Genetic architecture of fast- and slow-twitch skeletal muscle weight in 200-day-old mice of the C57BL/6J and DBA/2J lineage. Physiol. Genomics 16, 141–152.
Lionikas, A., Cheng, R., Lim, J. E., Palmer, A. A., and Blizard, D. A. (2010). Fine-mapping of muscle weight QTL in LG/J and SM/J intercrosses. Physiol. Genomics 42A, 33–38.
Luff, A. R., and Goldspink, G. (1970). Total number of fibers in muscles of several strains of mice. J. Anim. Sci. 30, 891–893.
Macarthur, D. G., Seto, J. T., Chan, S., Quinlan, K. G. R., Raftery, J. M., Turner, N., Nicholson, M. D., Kee, A. J., Hardeman, E. C., Gunning, P. W., Cooney, G. J., Head, S. I., Yang, N., and North, K. N. (2008). An Actn3 knockout mouse provides mechanistic insights into the association between α-actinin-3 deficiency and human athletic performance. Hum. Mol. Genet. 17, 1076–1086.
MacArthur, J. (1944). Genetics of body size and related characters. I. Selection of small and large races of the laboratory mouse. Am. Nat. 78, 142–157.
Manichaikul, A., Dupuis, J., Sen, S., and Broman, K. W. (2006). Poor performance of bootstrap confidence intervals for the location of a quantitative trait locus. Genetics 174, 481–489.
McClendon, M. J. (1994). Multiple Regression and Causal Analysis. Prospect Heights, Illinois: Waveland Press Inc., 81–82.
McPherron, A. C., Lawler, A. M., and Lee, S.-J. (1997). Regulation of skeletal muscle mass in mice by a new TGF-β superfamily member. Nature 387, 83–90.
McPherron, A. C., and Lee, S.-J. (1997). Double muscling in cattle due to mutations in the myostatin gene. Proc. Natl. Acad. Sci. U.S.A. 94, 12457–12461.
Mosher, D. S., Quignon, P., Bustamante, C. D., Sutter, N. B., Mellersh, C. S., Parker, H. G., and Ostrander, E. A. (2007). A mutation in the myostatin gene increases muscle mass and enhances racing performance in heterozygote dogs. PLoS Genet. 3, 779–786. doi: 10.1371/journal.pgen.0030079
Nadeau, J. H., and Taylor, B. A. (1984). Lengths of chromosomal segments conserved since divergence of man and mouse. Proc. Natl. Acad. Sci. U.S.A. 81, 814–818.
Nimmo, M. A., Wilson, R. H., and Snow, D. H. (1985). The inheritance of skeletal muscle fibre composition in mice. Comp. Biochem. Physiol. A Comp. Physiol. 81, 109–115.
Ontell, M., Hughes, D., and Bourke, D. (1988). Morphometric analysis of the developing mouse soleus muscle. Am. J. Anat. 181, 279–288.
Parsons, S. A., Wilkins, B. J., Bueno, O. F., and Molkentin, J. D. (2003). Altered skeletal muscle phenotypes in calcineurin Aα and Aβ gene-targeted mice. Mol. Cell. Biol. 23, 4331–4343.
Rehfeldt, C., Ott, G., Gerrard, D. E., Varga, L., Schlote, W., Williams, J. L., Renne, U., and Bünger, L. (2005). Effects of the compact mutant myostatin allele MstnCmpt-dl1Abc introgressed into a high growth mouse line on skeletal muscle cellularity. J. Muscle Res. Cell Motil. 26, 103–112.
Rehfeldt, C., Stickland, N. C., Fiedler, I., and Wegner, J. (1999). Environmental and genetic factors as sources of variation in skeletal muscle fibre number. Basic Appl. Myol. 9, 235–253.
Rowe, R. W., and Goldspink, G. (1969). Muscle fibre growth in five different muscles in both sexes of mice. J. Anat. 104, 519–530.
Sáinz, N., Rodríguez, A., Catalán, V., Becerril, S., Ramírez, B., Gómez-Ambrosi, J., and Frühbeck, G. (2009). Leptin administration favors muscle mass accretion by decreasing FoxO3a and increasing PGC-1α in ob/ob mice. PLoS ONE 4, e6808. doi: 10.1371/journal.pone.0006808
Schiaffino, S. (2010). Fibre types in skeletal muscle: a personal account. Acta Physiol. (Oxf.) 199, 451–463.
Schuelke, M., Wagner, K. R., Stolz, L. E., Hübner, C., Riebel, T., Kömen, W., Braun, T., Tobin, J. F., and Lee, S.-J. (2004). Myostatin mutation associated with gross muscle hypertrophy in a child. N. Engl. J. Med. 350, 2682–2688.
Sen, S., Johannes, F., and Broman, K. W. (2009). Selective genotyping and phenotyping strategies in a complex trait context. Genetics 181, 1613–1626.
Simoneau, J. A., and Bouchard, C. (1995). Skeletal muscle metabolism and body fat content in men and women. Obes. Res. 3, 23–29.
Sosnicki, A. (1987). Histopathological observation of stress myopathy in M. longissimus in the pig and relationships with meat quality, fattening and slaughter traits. J. Anim. Sci. 65, 584–596.
Stavaux, D., Art, T., McEntee, K., Reznick, M., and Lekeux, P. (1994). Muscle fibre type and size, and muscle capillary density in young double-muscled blue Belgian cattle. Zentralbl. Veterinarmed. A 41, 229–236.
Stylianou, I. M., Korstanje, R., Li, R., Sheehan, S., Paigen, B., and Churchill, G. A. (2006). Quantitative trait locus analysis for obesity reveals multiple networks of interacting loci. Mamm. Genome 17, 22–36.
Summers, P. J., and Medrano, J. F. (1994). Morphometric analysis of skeletal muscle growth in the high growth mouse. Growth Dev. Aging 58, 135–148.
Thorstensson, A., Grimby, G., and Karlsson, J. (1976). Force velocity relations and fiber composition in human knee extensor muscles. J. Appl. Physiol. 40, 12–16.
Timson, B. F. (1982). The effect of varying postnatal growth rate on skeletal muscle fiber number in the mouse. Growth 46, 36–45.
Timson, B. F., Bowlin, B. K., Dudenhoeffer, G. A., and George, J. B. (1985). Fiber number, area, and composition of mouse soleus muscle following enlargement. J. Appl. Physiol. 58, 619–624.
Totsuka, Y., Nagao, Y., Horii, T., Yonekawa, H., Imai, H., Hatta, H., Izaike, Y., Tokunaga, T., and Atomi, Y. (2003). Physical performance and soleus muscle fiber composition in wild-derived and laboratory inbred mouse strains. J. Appl. Physiol. 95, 720–727.
Van den Maagdenberg, K., Stinckens, A., Lefaucheur, L., Buys, N., and De Smet, S. (2008). The effect of mutations in the insulin-like growth factor-II and ryanodine receptor-1 genes on biochemical and histochemical muscle fibre characteristics in pigs. Meat Sci. 79, 757–766.
Van der Laarse, W. J., Crusio, W. E., Suharti, M., and Van Abeelen, J. H. F. (1984). Genetic architecture of numbers of fast and slow muscle fibers in the mouse soleus. Heredity 53, 643–647.
Wade, A. J., Marbut, M. M., and Round, J. M. (1990). Muscle fibre type and aetiology of obesity. Lancet 335, 805–808.
Wimmers, K., Fiedler, I., Hardge, T., Murani, E., Schellander, K., and Ponsuksili, S. (2006). QTL for microstructural and biophysical muscle properties and body composition in pigs. BMC Genet. 7, 15. doi: 10.1186/1471-2156-7-15
Wirtz, P., Loermans, H. M., Peer, P. G. M., and Reintjes, A. G. M. (1983). Postnatal growth and differentiation of muscle fibres in the mouse. I. A histochemical and morphometrical investigation of normal muscle. J. Anat. 137, 109–126.
Appendix
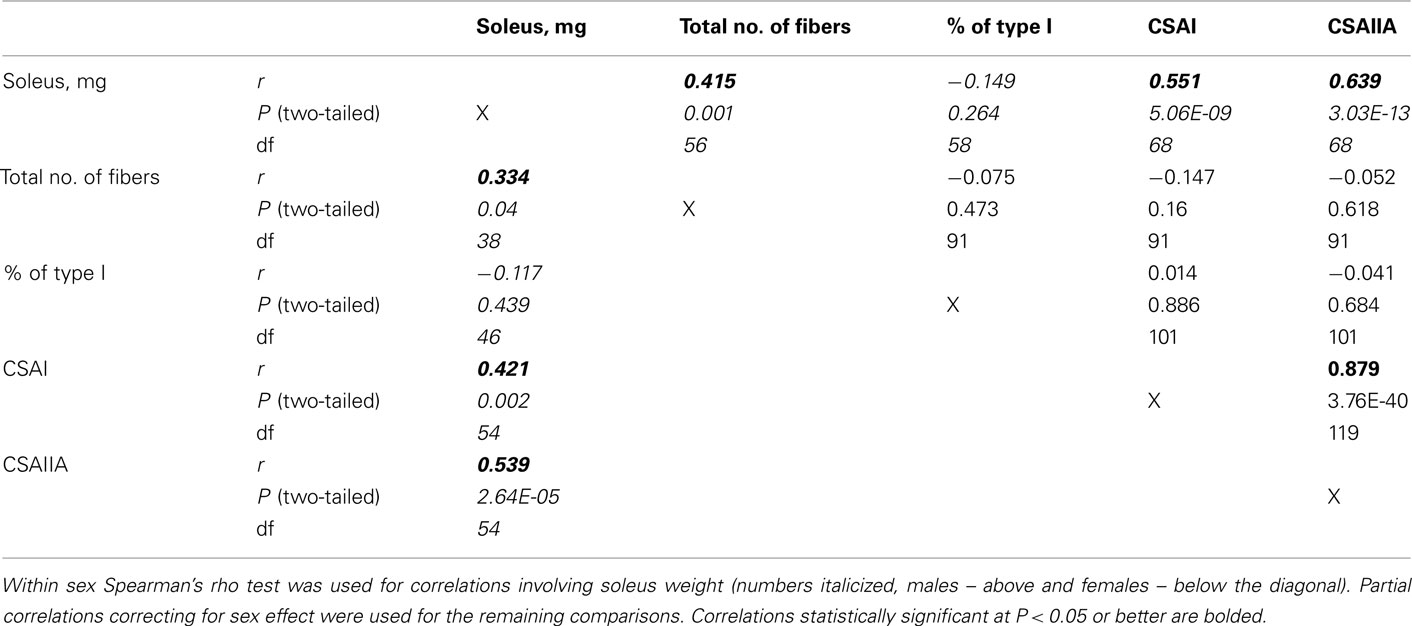
Table A1. Phenotypic correlations in F2 intercross between LG/J and SM/J strains.
Keywords: skeletal muscle, muscle fiber types, genetic variation
Citation: Carroll AM, Palmer AA and Lionikas A (2012) QTL analysis of type I and Type IIA fibers in soleus muscle in a cross between LG/J and SM/J mouse strains. Front. Gene. 2:99. doi: 10.3389/fgene.2011.00099
Received: 01 October 2011; Paper pending published: 01 November 2011;
Accepted: 08 December 2011; Published online: 06 January 2012.
Edited by:
Rongling Wu, Pennsylvania State University, USAReviewed by:
David C. Airey, Vanderbilt University, USAHadi Al-Hasani, German Institute for Human Nutrition Potsdam, Germany
Copyright: © 2012 Carroll, Palmer and Lionikas. This is an open-access article distributed under the terms of the Creative Commons Attribution Non Commercial License, which permits non-commercial use, distribution, and reproduction in other forums, provided the original authors and source are credited.
*Correspondence: Arimantas Lionikas, School of Medical Sciences, University of Aberdeen, Health Sciences Building, Room 106, Foresterhill, Aberdeen AB25 2ZD, UK. e-mail:YS5saW9uaWthc0BhYmRuLmFjLnVr