 Alex J. Newbury
 Glenn D. Rosen*
- Department of Neurology, Beth Israel Deaconess Medical Center, Boston, MA, USA
The corpus callosum is the main commissure connecting left and right cerebral hemispheres, and varies widely in size. Differences in the midsagittal area of the corpus callosum (MSACC) have been associated with a number of cognitive and behavioral phenotypes, including obsessive-compulsive disorders, psychopathy, suicidal tendencies, bipolar disorder, schizophrenia, autism, and attention deficit hyperactivity disorder. Although there is evidence to suggest that MSACC is heritable in normal human populations, there is surprisingly little evidence concerning the genetic modulation of this variation. Mice provide a potentially ideal tool to dissect the genetic modulation of MSACC. Here, we use a large genetic reference panel – the BXD recombinant inbred line – to dissect the natural variation of the MSACC. We estimated the MSACC in over 300 individuals from nearly 80 strains. We found a 4-fold difference in MSACC between individual mice, and a 2.5-fold difference among strains. MSACC is a highly heritable trait (h2 = 0.60), and we mapped a suggestive QTL to the distal portion of Chr 14. Using sequence data and neocortical expression databases, we were able to identify eight positional and plausible biological candidate genes within this interval. Finally, we found that MSACC correlated with behavioral traits associated with anxiety and attention.
Introduction
The size of the corpus callosum – the main commissure connecting the cerebral hemispheres – is highly variable in human populations. There is at least a 2-fold range of variation in midsagittal area of the corpus callosum (MSACC) among healthy children and adolescents (Scamvougeras et al., 2003; Ganjavi et al., 2011). The MSACC is a rough linear function of the number of callosal projections, and in general an increase in area is associated with an increase in the number of fibers (Aboitiz et al., 1992). Variation of the number of callosal fibers in healthy brains is dependent, therefore, on a number of factors that occur during callosal development including axon outgrowth, synaptogenesis, and axon pruning. Thus, any genes or gene networks that modulate any of these factors are likely to affect the MSACC.
The process of development of the corpus callosum is relatively well understood. In humans, it has been proposed that all interhemispheric commissures initially cross the midline during embryogenesis at the commissural plate (Rakic and Yakovlev, 1968). In rodents, the commissural plate also serves as a source for morphogens that facilitate a realization of the neocortex as well as corpus callosum formation, primarily through the morphogen Fgf8 (Storm et al., 2006; O’Leary et al., 2007; Moldrich et al., 2010). In the mouse, “pioneer axons” cross the rostral midline at E15.5 and lay the foundation for later forming neocortical axons (Rash and Richards, 2001). The glial sling, which forms a bridge between the hemispheres, provides the foundation for these pioneer axons (Smith et al., 2006). The glial wedge, located just lateral to the midlines (Shu and Richards, 2001), provides additional guidance for callosal axons, primarily through secretion of Wnt, Netrin1, Slit2 as well as various ephrins and semaphorins (see Fame et al., 2011, for review). Once callosal axons have crossed the midline, they need to establish connections to the opposite hemisphere. Initially, these projections are exuberant, innervating both homotopic and heterotopic cortex (Innocenti and Berbel, 1991; Innocenti, 1995). Eventually, heterotopic projects are pruned by activity-dependent mechanisms (Mizuno et al., 2007), and the adult-like pattern of mostly homotopic connectivity is established at the end of the third week of life in rodents (Innocenti and Price, 2005). At present, there is not much known about the specific genetic mechanisms underlying this phase of callosal development, but there is an increasingly large amount of information as to the molecular signals that specify different neocortical projection neuron cell types (e.g., Molyneaux et al., 2007; Fame et al., 2011). Variation in any of the signaling molecules could affect the number and density of callosal fibers passing through the corpus callosum.
Individual differences in the volume of the corpus callosum (or MSACC) have been associated with a number of cognitive and behavioral phenotypes. The MSACC is larger in individuals with obsessive-compulsive disorders (Park et al., 2011) and in those with psychopathy (Raine et al., 2003). Conversely, a smaller MSACC has been linked to suicidal tendencies (Cyprien et al., 2011), bipolar disorder (Arnone et al., 2008a), schizophrenia (Arnone et al., 2008b), autism (Frazier and Hardan, 2009), and attention deficit hyperactivity disorder (Cao et al., 2010). Interestingly, reductions in sociability – a behavioral component of autistic spectrum disorder – are correlated in mice with a small MSACC (Fairless et al., 2008), suggesting that the relationship between corpus callosum size and behavioral phenotypes can be modeled in non-human species.
Although there is evidence to suggest that MSACC is heritable in normal human populations (Scamvougeras et al., 2003), there is surprisingly little evidence concerning the genetic modulation of this key neuroanatomical and functionally critical part of the brain. Mice provide a potentially ideal tool to dissect the genetic modulation of MSACC. There are a number of strains with either complete (BTBR T + tf/J) or partial (BALB/cWah1, and 129P1/ReJ) callosal agenesis, and researchers have identified quantitative trait loci (QTLs) that modulate this difference (Livy and Wahlsten, 1991; Wahlsten et al., 2003). Investigators have mapped QTLs that affect corpus callosum size by examining an intercross between BTBR T + tf/J and BALB/cByJ mouse strains to the X-chromosome (Kusek et al., 2007). Le Roy et al. (1998) measured the MSACC in F2s generated from a cross of NZB/BlNJ and C57BL/6J mice and found QTLs on chromosomes 1 and 4, which explained 25% of the observed variance.
In many of these cases, the QTLs identified loci underlying a pathological condition – agenesis (either complete or partial) of the corpus callosum – that may or may not explain normal variation in callosal size. Here, we use a large genetic reference panel (BXD recombinant inbred strains) to dissect genetic causes of natural variation of the MSACC. The BXD family of lines is an appropriate model system for a number of reasons. First, neither of the parent strains (C57BL/6J and DBA/2J) have either complete or partial agenesis of the corpus callosum, and only one spontaneously mutated BXD strain (BXD29-Tlr4lps-2J/J) has partial callosal agenesis (Rosen et al., 2012). Second, there are ∼80 BXD strains available, increasing both mapping power and precision. Third, there are hundreds of studies (representing thousands of traits) that have been conducted using the BXD panel, thereby permitting analysis of covariation of MSACC with a host of behavioral, anatomical, and physiological phenotypes. Critical for the neurogenetic analysis, we have studied genetic variation in gene expression in the neocortex of the BXD family at maturity (Gaglani et al., 2009) and as described in this paper, at two key stages of neocortical development.
Materials and Methods
All histologic data for this study were obtained from The Mouse Brain Library (MBL) – a physical and Internet resource that contains high–resolution images of histologically processed slides from over 3,200 adult mouse brains1 with roughly balanced numbers of male and female specimens (Rosen et al., 2003). The ages of the mice used in this experiment ranged from 31 to 432 days with an average of 114.3 ± 3.6 and a median of 100. Mice were obtained from either the Jackson Laboratory (Bar Harbor, ME, USA) or the University of Tennessee Health Science Center (UTHSC) as detailed previously (Rosen and Williams, 2001). All procedures were approved by animal care and use committees and conform to NIH guidelines for humane treatment of animals. Mice were deeply anesthetized with Avertin (0.8 ml i.p.) and transcardially perfused with saline, followed by fixative (either a glutaraldehyde/paraformaldehyde solution or 4% paraformaldehyde), and their brains removed and weighed. After variable post-fixation times, the brains were embedded in 12% celloidin and sliced in either a coronal or horizontal plane at a width of approximately 30 μm. Actual section thickness was determined by direct examination of 10 sections for each brain using an ×100 oil immersion objective and a z-axis micrometer.
Estimation of Midsagittal Area of the Corpus Callosum
The MSACC was estimated in 303 cases (148 male and 155 female) from 76 BXD strains (we excluded the aforementioned BXD29-Tlr4lps-2J/J strain), as well as from their parental strains (C57BL/6J and DBA/2J, abbreviated B6 and D2), by one of us (AJN) using a computer controlled microscope (Nikon E800, Nikon, Inc., Melville, NY, USA) and Stereo Investigator (MBF Biosciences, Williston, VT, USA). We measured the dorsal-ventral distance of the corpus callosum on the midline of coronal sections that were spaced approximately 150 μm apart (9–11 sections per brain). We computed the area by using Cavalieri’s rule (Gundersen and Jensen, 1987) to estimate the area underneath a curve described by dorsal-ventral distance on the Y-axis and rostro-caudal distance on the X-axis. In cases where there were missing or damaged sections, a piece-wise parabolic estimation was used (Rosen and Harry, 1990). Final MSACC estimates were individually corrected for histological shrinkage by determining the previously computed ratio between the brain volume at fixation (brain weight) and that after processing. MSACC was blindly re-measured on 10 slides to assess intra–observer reliability. The experimenter was blind with respect to strain, sex, and age.
Measurement Error
Intra-observer reliability was high for estimation of MSACC. The percentage difference between the original and repeated estimations ranged from 0 to 5% and the average difference was merely 0.42%. A correlation coefficient between the two measurements was highly significant (r = 0.99), indicating that technical error at this level of the analysis contributes little to case variation or strain variation. A paired t-test confirmed that the difference between the first and second estimations was not significant (t < 1, NS).
Data Analysis, Heritability, and Genetic Mapping
Data were analyzed using standard ANOVA and multiple regression techniques (JMP, SAS Institute, Cary, NC, USA). We estimated heritability (h2) by dividing the between strain variance by the total variance of the trait. QTL analysis was performed using the WebQTL module of GeneNetwork (GN2). This on-line resource includes all known morphometric data for the BXD strains, adult, and developmental neocortical transcriptome data sets, high density marker maps based on approximately 3795 informative markers distributed on all chromosomes except Chr Y (Shifman et al., 2006), and a database containing ∼8.3 million single nucleotide polymorphisms (SNPs) taken from dbSNP (Frazer et al., 2007), Sanger/UCLA, and from a high quality subset of about 2.8 million SNPs generated by sequencing DBA/2J (∼25 × shotgun) performed at UTHSC by R.W.Williams and colleagues. WebQTL incorporates three common mapping methods: (1) simple interval mapping, (2) composite interval mapping, and (3) a scan for two-locus epistatic interactions (Wang et al., 2003). To evaluate candidate genes we used the QTLMiner module of GN (Alberts and Schughart, 2010), which evaluates all genes in an interval against neocortical gene expression databases within gene network (see below).
Neocortical Gene Expression
We exploited three freely accessible expression data sets available at GN that we generated. These data sets estimate steady-state mRNA levels in neocortex of up to 75 strains of mice at postnatal day (P) 3, P14, or P60, including the majority of the BXD strains that we have studied, all of which can be accessed in the main search page of GN by selecting Species = mouse, Group = BXD, Type = Neocortex mRNA. Data for the P60 database was generated using the Illumina Sentrix Mouse-6.1 microarray and the P3 and P14 databases used the Mouse-6.2 microarray. These arrays estimate expression for a great majority of mouse genes with confirmed protein products and consists of sets of ∼46,000 unique 50-nucleotide-long probe sequences. Like other array data in GeneNetwork (Chesler et al., 2005), the original Illumina bead array data (rank invariant transform) were logged and re-centered to a mean of 8 units and a standard deviation of 2 units – essentially a z transform of the data.
All genome coordinates in this paper are given using the mouse genome assembly of July 2007 (UCSC Genome Browser release mm9, NCBI Build 37).
Covariation Analysis
To study covariates of MSACC, we compared our data with the neocortical transcriptome data sets, as well BXD Published Phenotypes Database, a large database of over 3,000 previously published and unpublished BXD traits in GN. We adjusted the alpha levels for these correlations as described previously (Rosen et al., 2009). Briefly, alpha levels were adjusted after permuting MSACC 20 times, computing the top 500 correlations with the BXD Published Phenotypes Database for each permutation, and determining the computed alpha level of the top 5% of all correlations. From this analysis, it was determined that computed correlations by GN with P < 0.005 were significant at an adjusted alpha level of 0.05. Covariation networks were constructed using on-line tools in GN.
On-Line Resources
GeneNetwork: <www.genetwork.org>
The Mouse Brain Library: <www.mbl.org>
QTLMiner: <http://www.genenetwork.org/webqtl/main.py?FormID=qtlminer>
BXD Published Phenotypes Database: <http://www.genenetwork.org/dbdoc/BXDPublish.html>
BIDMC/UTHSC Dev Neocortex P3 ILMv6.2 (Nov11) RankInv (P3): <http://www.genenetwork.org/webqtl/main.py?FormID=sharinginfo&GN_AccessionId=374>
BIDMC/UTHSC Dev Neocortex P14 ILMv6.2 (Nov11) RankInv (P14): <http://www.genenetwork.org/webqtl/main.py?FormID=sharinginfo&GN_AccessionId=375>
HQF BXD Neocortex ILM6v1.1 (Dec10v2) RankInv (P60): <http://www.genenetwork.org/dbdoc/HQFNeoc_1210v2_RankInv.html>
Results
MSACC is Highly Variable and Heritable
We measured the MSACC in 303 cases representing 76 BXD lines and both parental strains, C57BL/6J and DBA/2J. Results were individually corrected for histological shrinkage and can be publicly accessed in the BXD Published Phenotype Database (Trait ID 14788). As can be seen in Figure 1, there is a high degree of variability of this measure. The mean MSACC for all mice was 1.1 ± 0.015 mm2, with a 4-fold range of 0.52–2.1 mm2, and a relatively normal distribution (Figure 1 inset). In comparison, the BXD strain means varied just over 2.5-fold – from 0.7 mm2 (BXD38) to 1.75 mm2 (BXD55) with a mean of 1.1 ± 0.023 mm2.
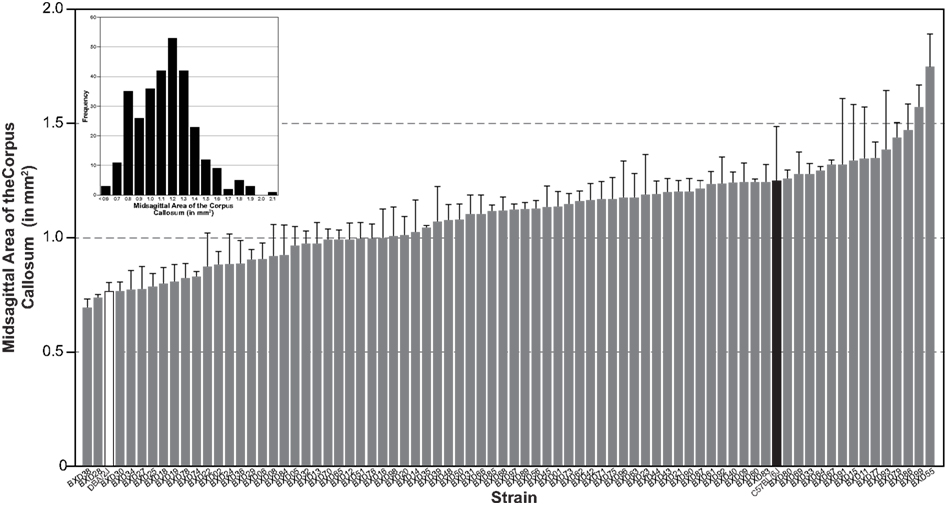
Figure 1. Histogram of mean (±SEM) MSACC in 76 BXD strains (gray bars) and in the two parentals: DBA/2J (white bar) and C57BL/6J (black bar). Inset is frequency distribution of MSACC in all 303 subjects, illustrating a mostly normal distribution. MSACC is corrected for histological shrinkage.
In order to determine the heritability of MSACC, we performed an ANOVA with the factor strain as the independent measure and MSACC as the dependent measure. We found a significant main effect of strain (R2 = 0.59, F75,220 = 4.2, P < 0.001). Heritability was found to be high (h2 = 0.60). Taken together, these results suggest that the MSACC is a highly heritable trait and as such, a strong candidate for QTL analysis.
Mapping MSACC
Initial QTL mapping of MSACC revealed a suggestive QTL on Chr 10 between 105 and 115 Mb (LRS = 13.8, Figure 2A). In order to map variation of MSACC rather than confounding variables, we performed a multiple regression with age, sex, strain epoch (the original Taylor BXD subset vs. the newer UTHSC BXD subset), and brain weight as independent variables. Overall, the multiple regression was significant (R2 = 0.38, F4,290 = 46.1, P < 0.001). There were significant effects of strain epoch, with the UTHSC subset (BXD43-BXD103) having larger MSACC than the original Taylor strains (mean ± SEM: 1.18 ± 0.019 vs. 0.98 ± 0.021 mm2, respectively; F1,290 = 34.6, P < 0.001). MSACC increased significantly with age (F1,290 = 16.6, P < 0.001) and brain weight (F1,290 = 73.4, P < 0.001; Figure 2B). There was no significant effect of sex (mean ± SEM: male = 1.09 ± 0.022 vs. 1.10 ± 0.021 mm2; F1, 290 < 1, NS). We computed the residuals for each individual and added them to the mean value of MSACC to derive a measure of MSACC that was adjusted for these variables (BXD Published Phenotypes Database, Trait ID 13385).
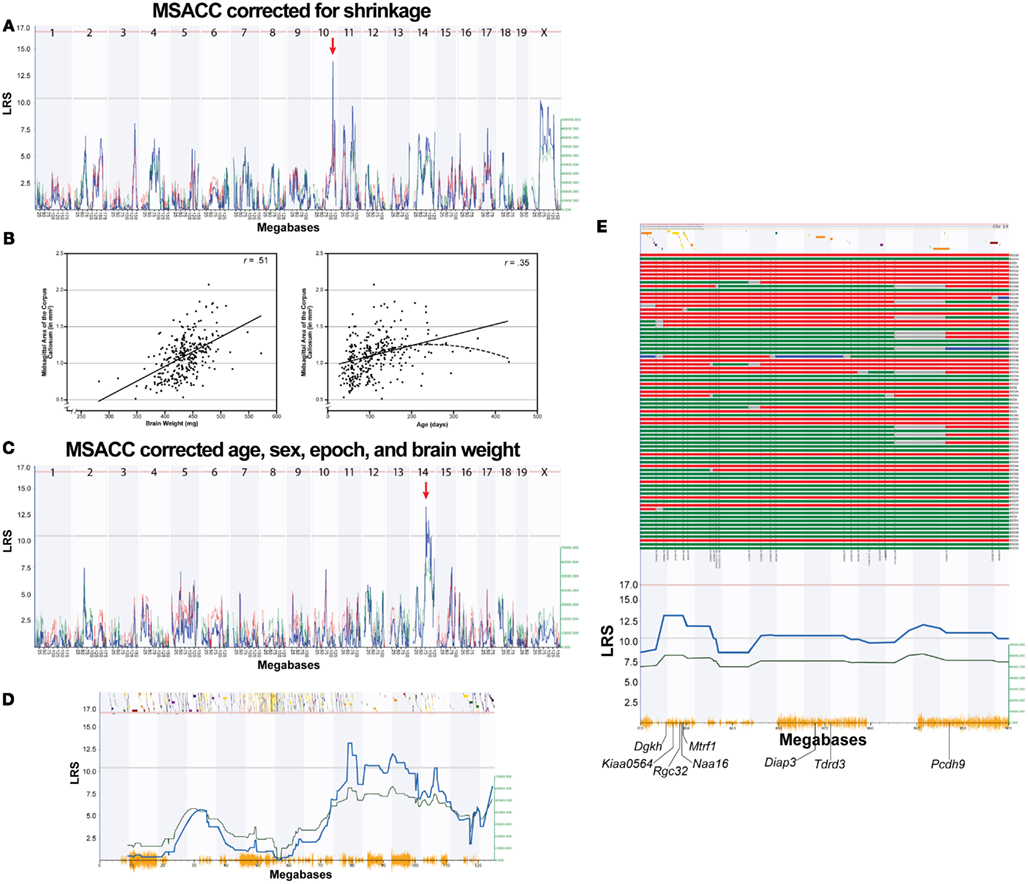
Figure 2. Mapping MSACC in BXD RI strains. (A). Interval map of MSACC corrected for histological shrinkage across the entire genome. The x-axis represents the physical map of the genome; the y-axis and thick blue line provide the LRS of the association between the trait and the genotypes of markers. The two horizontal lines are the suggestive (blue) and significance (red) thresholds computed using 2000 permutations. There is a suggestive QTL mapping to the distal portion of Chr. 10 (red arrow). (B) Correlations between MSACC and brain weight (left) and age (right) indicate that these two variables significantly contribute to MSACC. Solid lines indicate linear relationship of the variable. Dotted line indicates quadratic relationship of the variables. (C) Interval map of MSACC corrected for shrinkage with the effects of age, sex, epoch, and brain weight regressed out. There is a suggestive QTL on Chr 14 (red arrow). (D) Interval map of all of Chr 14. Green line indicates contribution of DBA/2J alleles. Orange lines on x-axis represent high density SNP map. Discontinuous track along the top are the genes on this chromosome. (E) Haplotype map of all 76 BXD strains on 20 Mb QTL interval on Chr14 (77.5–97.5 Mb). Red lines indicate C57BL/6J alleles (maternal), green lines indicate DBA/2J alleles (paternal), blue lines indicate heterozygous alleles, and gray lines are unknown. Strains are arranged from smallest to largest MSACC (top to bottom).
We then mapped the corrected MSACC estimates and detected a suggestive locus on Chr 14 between 77.5–97.5 Mb (LRS = 13.2; Figure 2C), which represents the area of suggestive LRS scores. Haplotype analysis revealed that the strains inheriting the B allele at this interval had smaller MSACC, whereas those inheriting the D allele had larger MSACC values (Figures 2D,E). Pair-scan analysis did not reveal any significant two-locus additive effects or epistatic interactions with this trait. Composite interval mapping controlling for the Chr 14 locus did not reveal any suggestive or significant QTLs.
Candidate Gene Analysis
We used GeneNetwork’s QTLMiner to rank potential candidates among the 48 genes in this interval based on the presence of non-synonymous SNPs, of expression levels in mRNA databases (in this case, three neocortical mRNA expression databases: P3, P14, and P60), and cis-eQTLs.
We first isolated those genes with non-synonymous SNPs or indels, reasoning that only genes with allelic differences between the two parent strains could account for the QTL. Of the 48 genes in the interval, 14 had SNPs between B6 and D2 (4921530L21Rik, AU017455, Dgkh, Diap3, EG629734, Kiaa0564, Klhl1, Mtrf1, Naa16, Pcdh8, Pcdh9, Pcdh20, Tdrd3, Tnfsf11). We next identified those genes that had moderate to high expression in forebrain at some stage of development – values above the average of 8 in at least one neocortical expression database (Dgkh, Diap3, Kiaa0564, Mtrf1, Naa16, Pcdh20, Pcd8, Pcdh9, Tdrd3). Of these, seven were identified as having cis-eQTLs in at least one of the expression databases: Dgkh, Kiaa0564, Naa16, Mtrf1, Diap3, Tdrd3, and Pcdh9. Finally, we examined the interval for genes without non-synonymous SNPs but with significant cis-eQTLs, and identified Rgc32 (1190002H23Rik) as another potential candidate (Table 1; Figure 3A). Gene expression of these candidates is highly intercorrelated and their expression correlates with MSACC (Figure 3B).
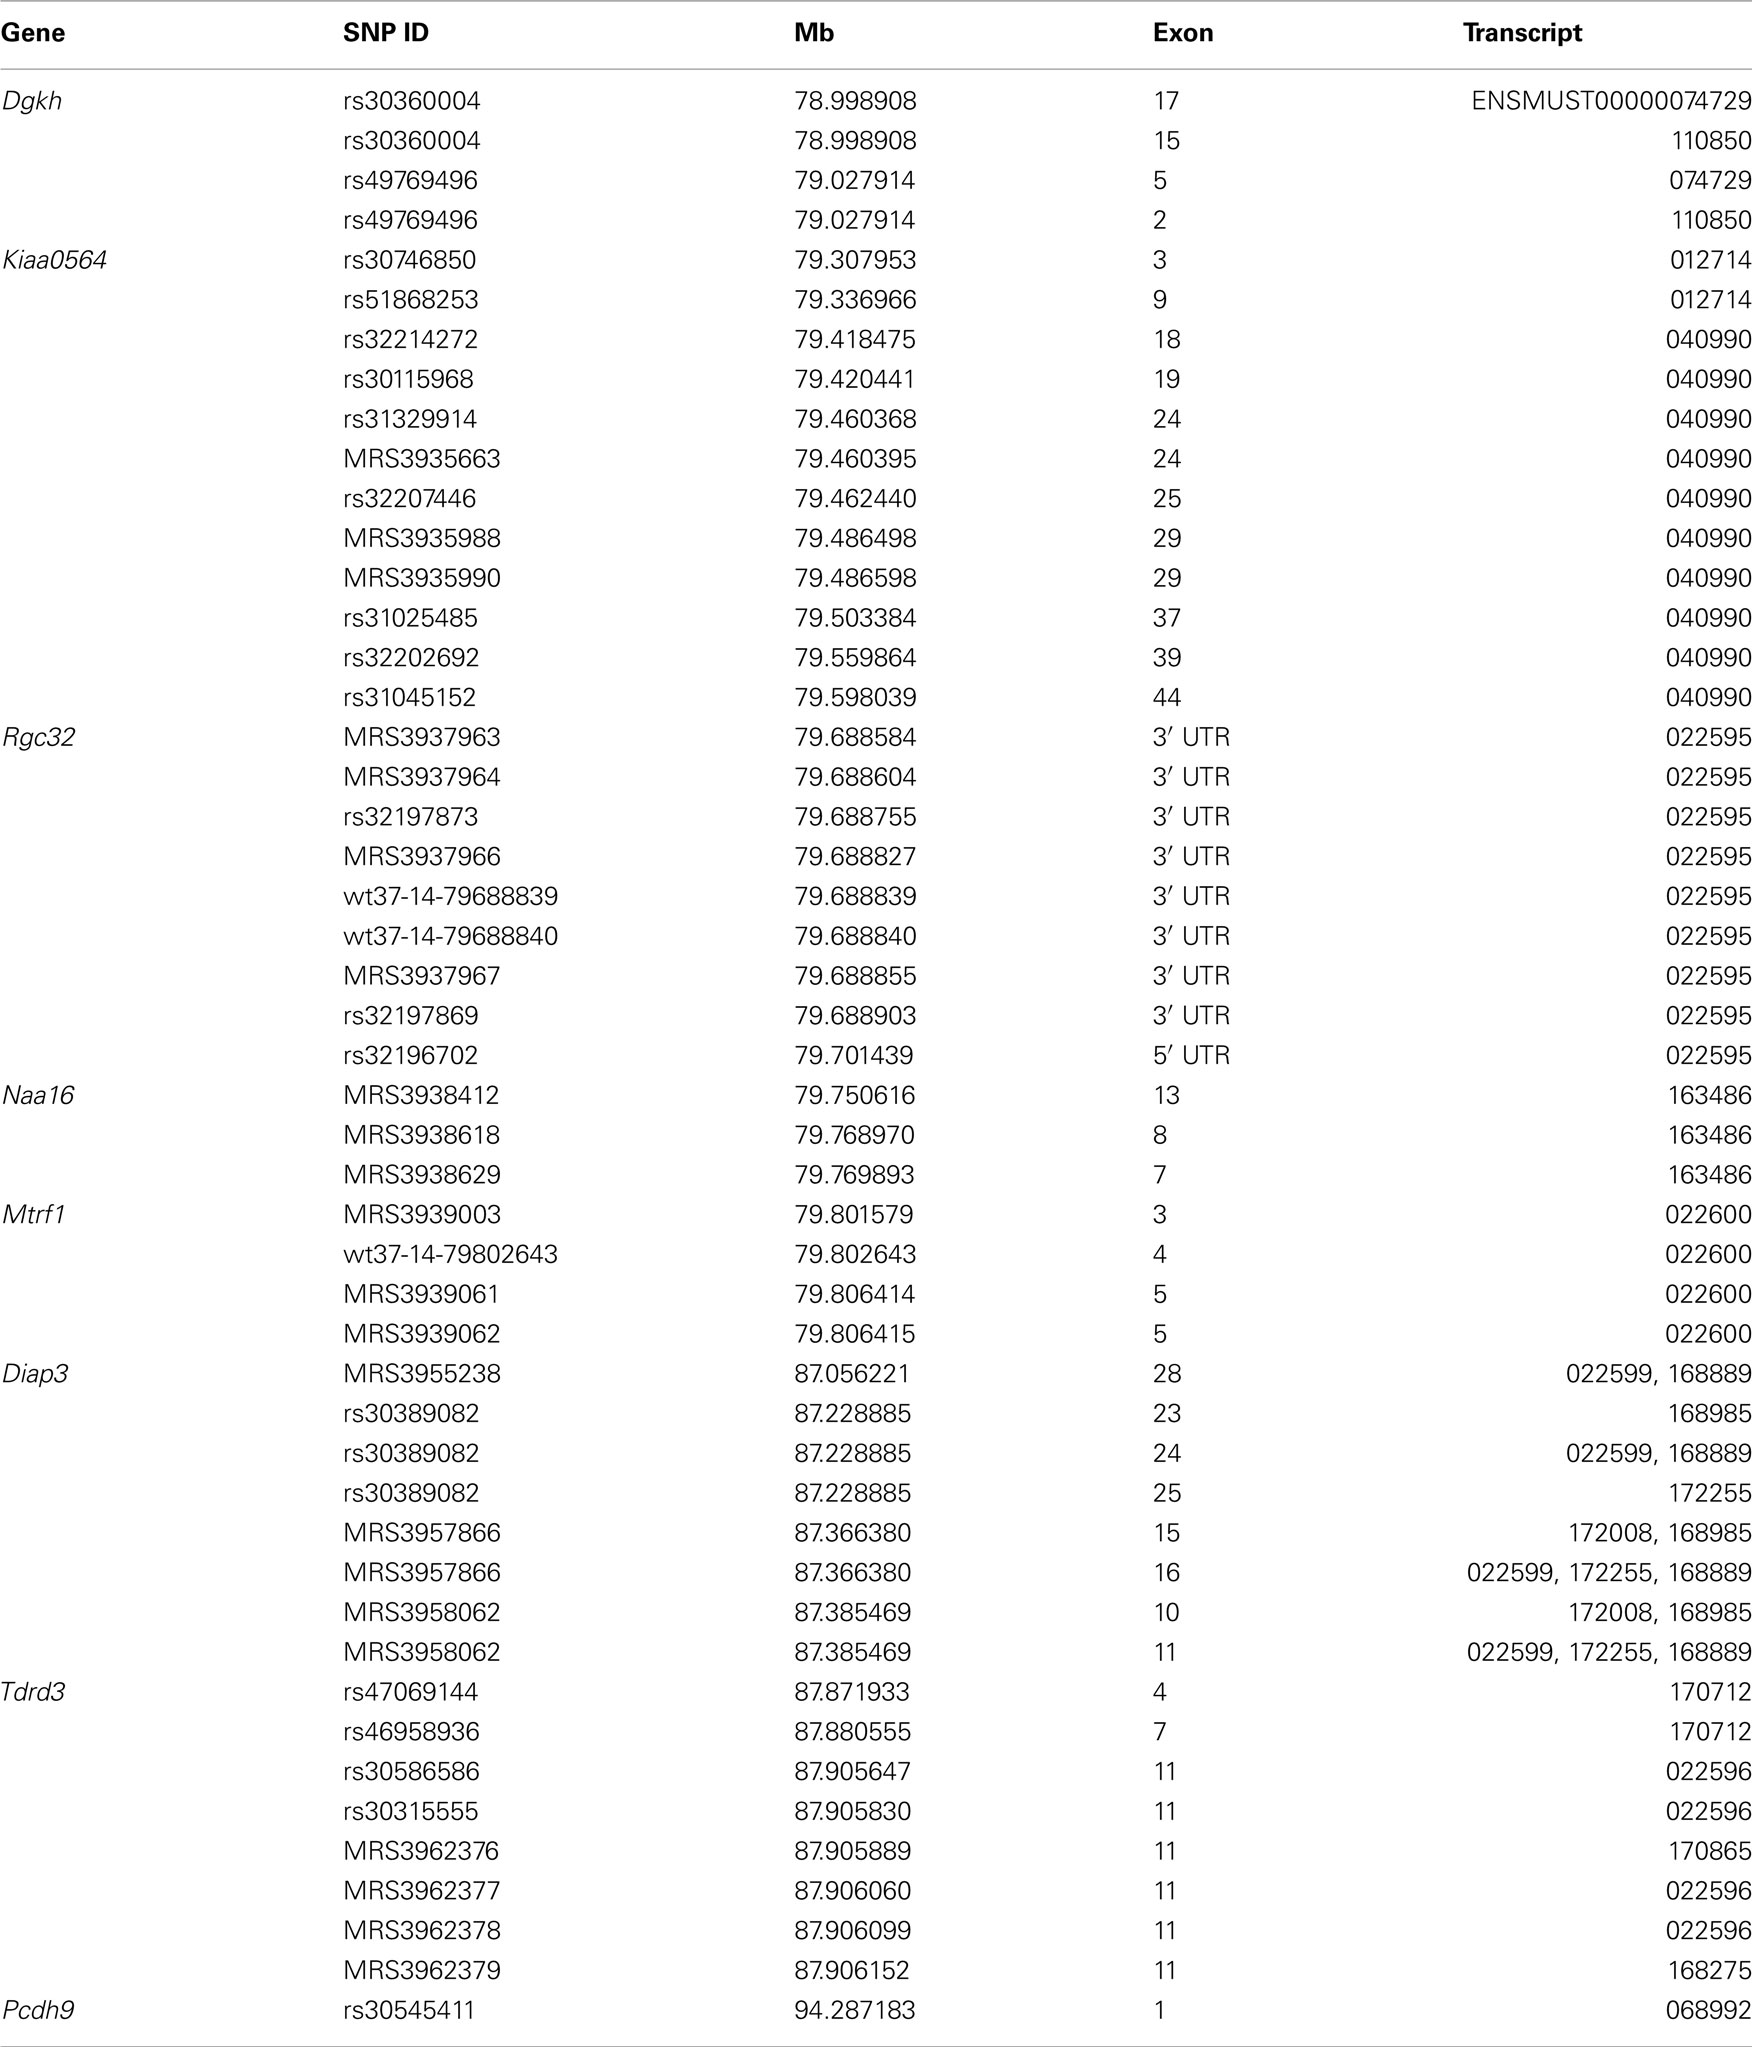
Table 1. Positional candidate genes on Chr 14.
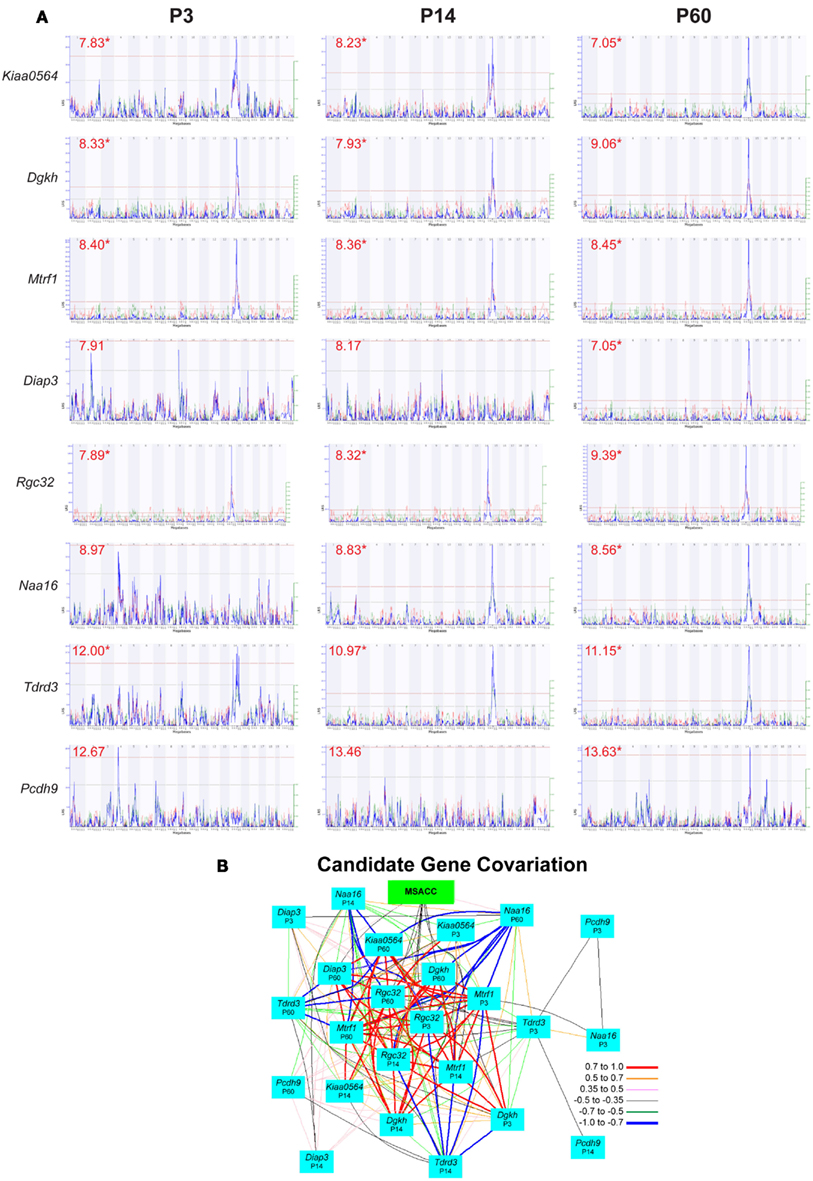
Figure 3. Candidate gene evaluation. (A) Interval maps of gene expression from three neocortical mRNA expression databases for each of the candidate genes on the Chr 14 QTL interval. These databases represent neocortical mRNA expression at three ages – P3, P14, and P60. Numbers in red indicate mean expression level of the gene, and asterisks indicate cis-eQTLs. (B) Network graph illustrating correlations among MSACC and positional candidate gene expression from the three databases.
Dgkh (diacylglycerol kinase, eta) is an integral protein in the lithium-sensitive phosphatidyl inositol pathway, and has been associated in a genome wide association study (GWAS) with bipolar disorder (Baum et al., 2008). Another GWAS linked Kiaa0564 (KIAA0564 putative ATP-binding protein) to bipolar disorder co-morbid with migraine (Oedegaard et al., 2010), and another GWAS identified KIAA0564 as a potential common allele related to autism (Anney et al., 2010). Rgc32 (response gene to complement 32 protein) has been associated with susceptibility to epithelial ovarian cancer (Notaridou et al., 2011). Naa16 (N(alpha)-acetyltransferase 16, NatA auxiliary subunit) codes for the production of an NMDA receptor-regulate protein, and has been implicated in cellular regulation (Arnesen et al., 2009). The Mtrf1 (mitochondrial translational release factor 1) gene codes for a protein that directs the termination of translation in response to peptide chain termination codons, acting as a bioregulator of intercellular machinery (Zhang and Spremulli, 1998). Diap3 (diaphanous homolog 3, drosophila) is a member of the diaphanous family of genes, and is thought to be required for cytokinesis among other functions (Peng et al., 2003; Wallar et al., 2006). Tdrd3 (tudor domain containing 3) codes for a novel stress granule-associated protein, which interacts with FMRP, the protein of the gene associated with Fragile X syndrome, thereby implicating it as a potential contributor to this disorder (Linder et al., 2008). Pcdh9 belongs to the δ1 non-clustering protocadherin family (Kim et al., 2011), and is part of a network of cadherins and protocadherins that have been linked to laminar specification in the neocortex (Hertel and Redies, 2011; Krishna et al., 2011). Pcdh9 is one of a network of genes that has recently been linked to schizophrenia and bipolar disorder though its association with GSK3β/β-catenin signaling (Pedrosa et al., 2010).
Correlations with BXD Phenotypes
An advantage of the BXD family of strains is that one can test for genetically driven correlation and covariation with thousands of other phenotypes that have already been quantified using the same set of genotypes. We correlated MSACC with the BXD Published Phenotypes Database of GN, which contains a large number of behavioral, anatomic, and physiologic phenotypes gathered from the BXD set. We adjusted the alpha levels to 0.005 using methods described above. A total of 39 published and unpublished traits were found to significantly correlate with MSACC. There were two groups of highly intercorrelated traits – both from the same original data source and paper (Philip et al., 2010). One set of 12 traits (Trait IDs: 11471, 11484, 11487, 11488, 11741, 11745, 11985, 11986, 11997, 11998, 12001, 12002) measured the locomotion response to cocaine administration, with correlations ranging from r = 0.35–0.41 (N = 63, P < 0.002). Another set of traits (Trait ID = 11542, 11543, 11546, 12057) measured the locomotion response following saline administration, with correlations in a similar range as above (r = 0.35–0.40, N = 63, P < 0.002). Using GN, we computed the principal components of each of these traits and correlated them with MSACC (Figure 4A), both of which are significant (P < 0.002). In addition, we found a significant correlation between MSACC and errors of omission on an unpublished task that measures attention (Trait ID 13371, S Spijker and AB Smit, Neuro-Bsik Mouse Phenomics Consortium, Figure 4B).
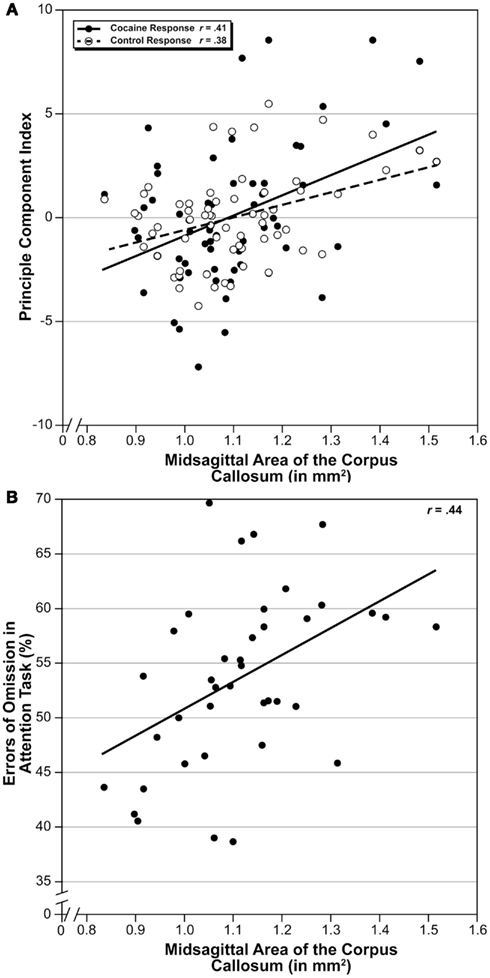
Figure 4. Covariation of MSACC with behavioral traits. (A) Scatterplot of MSACC correlated with principle component comprised of 12 traits measuring locomotor response to cocaine administration (Philip et al., 2010; black circles) and four traits measuring the same response following saline administration from the same study (white circles). Solid line is linear correlation of cocaine response, and dotted line is linear correlation of saline response. (B) Scatterplot of MSACC correlated with errors of omission on a test of attention.
Discussion
In this experiment, we estimated the MSACC in over 300 individuals representing 78 inbred lines of highly diverse but genetically fully characterized lines of mice. These data represent the largest sample of inbred strains ever assessed for this, or any other, neuroanatomical phenotype. We found a remarkably large variation in this measure, with a nearly 4-fold difference among individuals with the smallest and those with the largest areas. When strain means were taken into account, the range became smaller, but still represented a 2.5-fold difference. ANOVA and heritability estimates clearly demonstrated that MSACC is a highly heritable trait, and we found a suggestive QTL modulating this trait on an interval in the distal portion of Chr 14. Using sequence data and neocortical expression databases, we identified eight positional candidate genes. Finally, we were able to examine covariation of MSACC with a wide variety of behavioral, physiological, and anatomical traits, and identified significant correlations with locomotor activity and attentional tasks.
The large number of strains and individuals phenotyped in this experiment allows us to assess factors that influence and covary with MSACC. We found a significant effect of age on the size of the corpus callosum, with MSACC generally increasing during the first year of life, with only a modest decrease in size afterward (Figure 2B). In humans, it is generally accepted that the size of the callosum decreases with age, but this appears mostly to be due to cerebral atrophy – in healthy aging, there is not a demonstrable decrease in the callosum size (Pozzilli et al., 1994; Rauch and Jinkins, 1994). This is similar to what has been reported in other species, including capuchin monkeys, whose quadratic relationship between age and MSACC is similar to that seen in the current study (compare Figure 3 from Phillips and Sherwood, 2012 with Figure 2B in the current study).
The issue of sex difference in size and shape of the corpus callosum has been a controversial topic in the human literature, with some investigators reporting that regions of corpus callosum (the splenium, for example) are smaller in females (de Lacoste-Utamsing and Holloway, 1982; Holloway and de Lacoste, 1986; Elster et al., 1990; Holloway et al., 1993), with other researchers failing to confirm this finding (Bell and Variend, 1985; Weber and Weis, 1986; Oppenheim et al., 1987). Investigations of the size (rather than shape) of the corpus callosum are also controversial, with some finding smaller MSACC in females (de Lacoste-Utamsing and Holloway, 1982), others reporting no sex differences (Going and Dixson, 1990; Allen et al., 1991), and still other researchers finding that that the MSACC of females is larger than males when corrected for brain volume (Steinmetz et al., 1995). We found no sex differences in the MSACC in the current study, but we cannot address potential sex differences in shape of the corpus callosum because we did not assess these parameters.
We found a suggestive QTL modulating MSACC on a 20 Mb interval on the distal portion of Chr 14. Within this interval, we identified positional candidate genes based on whether (1) they contained non-synonymous SNPs between the parental genotypes, (2) they were expressed in the cerebral cortex during early and late postnatal periods, and (3) they modified their own expression (cis-eQTL). Using these criteria, we identified Dgkh, Kiaa0564, Rgc32, Naa16, Mtrf1, Diap3, Tdrd3, and Pcdh9 as positional candidate genes. Different GWA studies have identified Dgkh (Baum et al., 2008) and Kiaa0564 (Oedegaard et al., 2010) as potential modulators of bipolar disorder, a disorder that has also been associated with decreased size of the callosum (Arnone et al., 2008a; Kempton et al., 2011) and generally disordered interhemispheric communication (Bellani et al., 2009; Lu et al., 2011). Moreover, MSACC correlates significantly with the expression of both of these genes in each of the three databases used in this study (Figure 3B). Pcdh9 is a member of a network of cadherins and protocadherins that have been linked to laminar specification in the neocortex (Hertel and Redies, 2011; Krishna et al., 2011), as well as to disorders such as autism (Morrow et al., 2008). In addition, Pcdh9 is one of a network of genes that has recently been linked to schizophrenia and bipolar disorder though its association with GSK3β/β-catenin signaling (Pedrosa et al., 2010). Like bipolar disorder discussed above, schizophrenics appear to have smaller callosum than unaffected controls (Arnone et al., 2008b).
A previous study (Le Roy et al., 1998) reported QTLs on Chr 1 and 4 that together explained about 25% of the variance of MSACC. We were unable to replicate these findings in the current experiment. One possibility that might account for the discrepancy in these results is that Le Roy et al. mapped MSACC corrected for hemispheric area, rather than MSACC alone as we have done. Another possibility may relate to the different populations being studied in these two experiments. Le Roy et al. used F2s generated from a cross of NZB/BlNJ (N) and B6 mice, whereas the BXD reference panel is the result a cross between D2 and B6. If N and D2 haplotypes are identical by descent in the Chr 1 and Chr 4 intervals, then the polymorphic regions with B6 would also be identical, and one might expect high mapping concordance between the studies. In contrast, if significant regions of these QTL intervals are not identical by descent and areas of polymorphism differed between the crosses, then mapping concordance would be compromised. We used the SNP Browser of GeneNetwork to identify the missense SNPs among N, B6, and D2 strains in Chr 1 interval (166–193 Mb), and found that only 48% of the 818 N and D2 SNPs in the interval were identical by descent. Similarly, only 40% of the 993 SNPs in the Chr 4 interval (119–142 Mb) were identical by descent for these strains. It is therefore possible that the lack of replication in this study is due to different patterns of inheritance between the reference populations.
Caution is necessary when interpreting these mapping results. First, our estimation of MSACC was made on coronally cut sections, and so it could be argued that we only indirectly assessed the midsagittal area. We contend that our stereologic measure is in practice more precise than MSACC taken from histologically cut sagittal sections. In our case, we can accurately delineate the dorsal-ventral distance at the precise midsagittal point, whereas it is difficult to ascertain the precise midsagittal plane in histologic sections. That said, confirmation of our results with high-resolution MRI (e.g., Badea et al., 2009), which doesn’t suffer from the limitation of a fixed plane of section, would provide validation. Second, the QTL that we described did not reach significance at the genome-wide level. Thus, while this QTL is suggestive, replication with another genetic cross or even a human cohort would provide greater confidence. In addition, we found that larger MSACC in this BXD family was associated with the paternal (D) allele. This is despite the fact DBA2/J mice have smaller MSACC than the C57BL/6J (maternal) strain. We hypothesize that inheriting a B allele at this locus acts to decrease callosal area, perhaps through mechanisms known to affect the number of callosal fibers including axon outgrowth, synaptogenesis, and axon pruning.
Another potential issue is that of sample size. In this experiment we phenotyped ∼4 mice in each of 78 strains, and the question could be raised whether our ability to detect a QTL would have been improved had we increased number of biological replicates. When dealing with RI strains, the main question is whether effort should be geared toward increasing the number of strains or toward phenotyping more mice in fewer strains. To address this question, we performed a power analysis to estimate of the probability of detecting QTLs of different effect sizes using data from a previously published study on striatal volume (Rosen et al., 2009). The results, summarized in Figure 5, were generated using qtlDesign by Sen et al. (2005a,b).
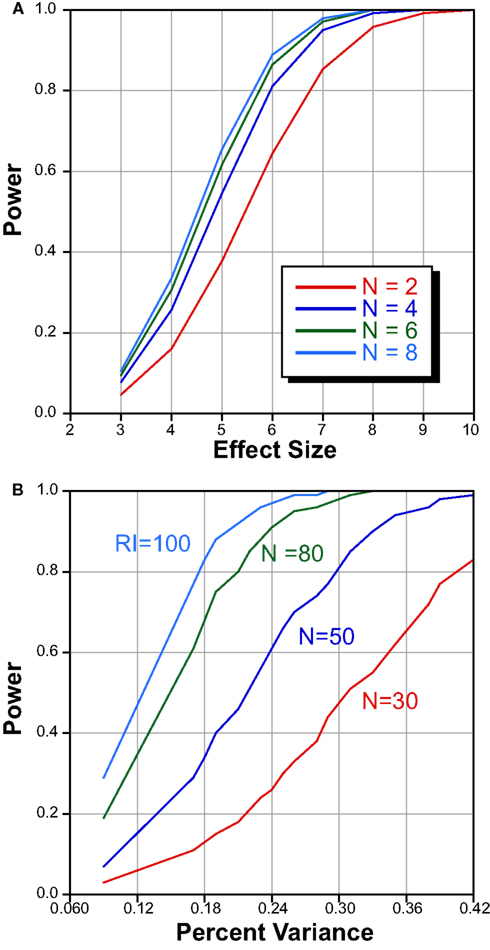
Figure 5. Power analysis to determine optimal number of strains and mice/strain. (A) Power statistics for number of mice within strain as a function of effect size. Increasing the number of mice beyond 4 offers little benefit. (B) Power analysis of different numbers of RI strains as a function of percent variance. Increasing the number of RI strains increases the likelihood of detecting small effect QTLs.
The issue of within-strain sample size (biological replicates) on the detection of QTLs has been discussed in detail (Belknap, 1998; Crusio, 2004). They point out that QTL detection in RI sets improves with greater number of strains, and that increasing the number of subjects within a strain has only marginal effects when h2 is high. We have confirmed this by holding the number of strains constant at 80, and plotting the number of subjects in each strain against the effect size. These data are summarized in Figure 5A. Increasing the number of subjects from 2 to 4 offers substantial improvement in QTL detection. Increasing the number from 4 to 6 or even 8, does not appreciably improve power. In order to determine the effect of an increase strain number, we held the total biological variance at 145 arbitrary units, the genetic variance at 100, the number of biological replicates at 4, and varied the QTL effect size (Figure 5B). With 30 strains one can identify a QTL that explains approximately ∼40% of the variance with a power of 0.8. In contrast, phenotyping 80 strains permits detection of a QTL that explains ∼20% of the variance. We are therefore confident that counting ∼4 mice in each of nearly 80 strains is sufficient to detect QTLs. In previous publications, we have empirically confirmed that this number is sufficient to reliably map QTLs for traits with moderate heritability (Gaglani et al., 2009).
Phenotyping the large BXD family of strains enables us and other investigators to study patterns of covariation with other phenotypes (Rosen et al., 2007). In this experiment, we report a significant correlation between MSACC and two measures of locomotor activity in an open field apparatus. Locomotor activity in this context has been commonly used as a measure for exploration, novelty seeking, anxiety and predisposition to addiction to drugs of abuse, with decreased activity associated with increased anxiety (Philip et al., 2010). The positive correlation indicates that those strains with larger corpus callosum are less anxious than those strains with smaller MSACC. These data are in agreement with studies in the human literature that suggest that individuals with a variety of disorders where anxiety plays an important role are more likely to have a decreased MSACC compared to controls, such as bipolar disorder (Arnone et al., 2008a). We also found a positive correlation between MSACC and percentage of errors of omission in an attention task, suggesting that strains with larger MSACC perform relatively poorly on this task compared to those with small MSACC. In humans, however, patients with ADHD have smaller corpus callosum size than controls (Cao et al., 2010). One potential explanation for the discrepancy is that this particular measure taps into but one of many behavioral factors (such as accuracy, motivation, and impulsivity) that affect attention (Guillem et al., 2011).
To identify positional candidates, we relied on a number of publicly available databases, some of which are reported here for the first time. Specifically, we used neocortical mRNA expression databases that were derived from two ages – P3 and P14 – during early development. These databases were constructed by dissection of neocortex from 43 BXD strains, and complement similar databases of striatal mRNA expression. We aim in the future to create expression databases at other prenatal and postnatal ages, and to provide on-line tools for time series analysis of these datasets.
In conclusion, we estimated MSACC in the largest population of genetically diverse mice ever previously reported. There are a number of similarities between morphometric studies in humans and the current study. As with humans, MSACC positively correlates with brain weight. Age is also a significant contributor to MSACC, with callosal size increasing during the first year of life. In humans, callosal size tends to decrease in during aging, but we were unable to assess this degenerative change as we lacked sufficiently old mice. Interestingly, we found no differences between the sexes in our measure of callosal area, which may inform the controversy in the human literature. There is a remarkable degree of variation in MSACC, and a high degree of heritability. We mapped our phenotype to an interval on the distal end of Chr 14, and identified eight positional candidates that may modulate this trait. Future experiments with knockout mice could help to confirm these candidates.
Conflict of Interest Statement
The authors declare that the research was conducted in the absence of any commercial or financial relationships that could be construed as a potential conflict of interest.
Acknowledgments
This work was supported, in part, by NS052397 from NINDS and by DA021131 from NIDA, NIAAA, and NIMH. GeneNetwork is supported by U01AA014425, U01AA13499, U01CA105417, and U24 RR021760. We thank the CHDI Foundation for making it possible to generate P60 mRNA expression data. We thank Robert W. Williams for his comments on an earlier version of the manuscript.
Footnotes
References
Aboitiz, F., Scheibel, A. B., Fisher, R. S., and Zaidel, E. (1992). Fiber composition of the human corpus callosum. Brain Res. 598, 143–153.
Alberts, R., and Schughart, K. (2010). QTLminer: identifying genes regulating quantitative traits. BMC Bioinformatics 11, 516. doi:10.1186/1471-2105-11-516
Allen, L. S., Richey, M. F., Chai, Y. M., and Gorski, R. A. (1991). Sex differences in the corpus callosum of the living human being. J. Neurosci. 11, 933–942.
Anney, R., Klei, L., Pinto, D., Regan, R., Conroy, J., Magalhaes, T. R., Correia, C., Abrahams, B. S., Sykes, N., Pagnamenta, A. T., Almeida, J., Bacchelli, E., Bailey, A. J., Baird, G., Battaglia, A., Berney, T., Bolshakova, N., Bolte, S., Bolton, P. F., Bourgeron, T., Brennan, S., Brian, J., Carson, A. R., Casallo, G., Casey, J., Chu, S. H., Cochrane, L., Corsello, C., Crawford, E. L., Crossett, A., Dawson, G., De Jonge, M., Delorme, R., Drmic, I., Duketis, E., Duque, F., Estes, A., Farrar, P., Fernandez, B. A., Folstein, S. E., Fombonne, E., Freitag, C. M., Gilbert, J., Gillberg, C., Glessner, J. T., Goldberg, J., Green, J., Guter, S. J., Hakonarson, H., Heron, E. A., Hill, M., Holt, R., Howe, J. L., Hughes, G., Hus, V., Igliozzi, R., Kim, C., Klauck, S. M., Kolevzon, A., Korvatska, O., Kustanovich, V., Lajonchere, C. M., Lamb, J. A., Laskawiec, M., Leboyer, M., Le Couteur, A., Leventhal, B. L., Lionel, A. C., Liu, X. Q., Lord, C., Lotspeich, L., Lund, S. C., Maestrini, E., Mahoney, W., Mantoulan, C., Marshall, C. R., Mcconachie, H., Mcdougle, C. J., Mcgrath, J., Mcmahon, W. M., Melhem, N. M., Merikangas, A., Migita, O., Minshew, N. J., Mirza, G. K., Munson, J., Nelson, S. F., Noakes, C., Noor, A., Nygren, G., Oliveira, G., Papanikolaou, K., Parr, J. R., Parrini, B., Paton, T., Pickles, A., Piven, J., Posey, D. J., Poustka, A., Poustka, F., Prasad, A., Ragoussis, J., Renshaw, K., Rickaby, J., Roberts, W., Roeder, K., Roge, B., Rutter, M. L., Bierut, L. J., Rice, J. P., Salt, J., Sansom, K., Sato, D., Segurado, R., Senman, L., Shah, N., Sheffield, V. C., Soorya, L., Sousa, I., Stoppioni, V., Strawbridge, C., Tancredi, R., Tansey, K., Thiruvahindrapduram, B., Thompson, A. P., Thomson, S., Tryfon, A., Tsiantis, J., Van Engeland, H., Vincent, J. B., Volkmar, F., Wallace, S., Wang, K., Wang, Z., Wassink, T. H., Wing, K., Wittemeyer, K., Wood, S., Yaspan, B. L., Zurawiecki, D., Zwaigenbaum, L., Betancur, C., Buxbaum, J. D., Cantor, R. M., Cook, E. H., Coon, H., Cuccaro, M. L., Gallagher, L., Geschwind, D. H., Gill, M., Haines, J. L., Miller, J., Monaco, A. P., Nurnberger, J. I. Jr., Paterson, A. D., Pericak-Vance, M. A., Schellenberg, G. D., Scherer, S. W., Sutcliffe, J. S., Szatmari, P., Vicente, A. M., Vieland, V. J., Wijsman, E. M., Devlin, B., Ennis, S., and Hallmayer, J. (2010). A genome-wide scan for common alleles affecting risk for autism. Hum. Mol. Genet. 19, 4072–4082.
Arnesen, T., Gromyko, D., Kagabo, D., Betts, M. J., Starheim, K. K., Varhaug, J. E., Anderson, D., and Lillehaug, J. R. (2009). A novel human NatA Nalpha-terminal acetyltransferase complex: hNaa16p-hNaa10p (hNat2-hArd1). BMC Biochem. 10, 15. doi:10.1186/1471-2091-10-15
Arnone, D., Mcintosh, A. M., Chandra, P., and Ebmeier, K. P. (2008a). Meta-analysis of magnetic resonance imaging studies of the corpus callosum in bipolar disorder. Acta Psychiatr. Scand. 118, 357–362.
Arnone, D., Mcintosh, A. M., Tan, G. M., and Ebmeier, K. P. (2008b). Meta-analysis of magnetic resonance imaging studies of the corpus callosum in schizophrenia. Schizophr. Res. 101, 124–132.
Badea, A., Johnson, G. A., and Williams, R. W. (2009). Genetic dissection of the mouse brain using high-field magnetic resonance microscopy. Neuroimage 45, 1067–1079.
Baum, A. E., Akula, N., Cabanero, M., Cardona, I., Corona, W., Klemens, B., Schulze, T. G., Cichon, S., Rietschel, M., Nothen, M. M., Georgi, A., Schumacher, J., Schwarz, M., Abou Jamra, R., Hofels, S., Propping, P., Satagopan, J., Detera-Wadleigh, S. D., Hardy, J., and Mcmahon, F. J. (2008). A genome-wide association study implicates diacylglycerol kinase eta (DGKH) and several other genes in the etiology of bipolar disorder. Mol. Psychiatry 13, 197–207.
Belknap, J. K. (1998). Effect of within-strain sample size on QTL detection and mapping using recombinant inbred mouse strains. Behav. Genet. 28, 29–38.
Bell, A. D., and Variend, S. (1985). Failure to demonstrate sexual dimorphism of the corpus callosum in childhood. J. Anat. 143, 143–147.
Bellani, M., Yeh, P. H., Tansella, M., Balestrieri, M., Soares, J. C., and Brambilla, P. (2009). DTI studies of corpus callosum in bipolar disorder. Biochem. Soc. Trans. 37, 1096–1098.
Cao, Q., Sun, L., Gong, G., Lv, Y., Cao, X., Shuai, L., Zhu, C., Zang, Y., and Wang, Y. (2010). The macrostructural and microstructural abnormalities of corpus callosum in children with attention deficit/hyperactivity disorder: a combined morphometric and diffusion tensor MRI study. Brain Res. 1310, 172–180.
Chesler, E. J., Lu, L., Shou, S., Qu, Y., Gu, J., Wang, J., Hsu, H. C., Mountz, J. D., Baldwin, N. E., Langston, M. A., Threadgill, D. W., Manly, K. F., and Williams, R. W. (2005). Complex trait analysis of gene expression uncovers polygenic and pleiotropic networks that modulate nervous system function. Nat. Genet. 37, 233–242.
Crusio, W. E. (2004). A note on the effect of within-strain sample sizes on QTL mapping in recombinant inbred strain studies. Genes Brain Behav. 3, 249–251.
Cyprien, F., Courtet, P., Malafosse, A., Maller, J., Meslin, C., Bonafe, A., Le Bars, E., De Champfleur, N. M., Ritchie, K., and Artero, S. (2011). Suicidal behavior is associated with reduced corpus callosum area. Biol. Psychiatry 70, 320–326.
de Lacoste-Utamsing, M. C., and Holloway, R. L. (1982). Sexual dimorphism in the human corpus callosum. Science 216, 1431–1432.
Elster, A. D., Dipersio, D. A., and Moody, D. M. (1990). Sexual dimorphism of the human corpus callosum studied by magnetic resonance imaging: fact, fallacy and statistical confidence. Brain Dev. 12, 321–325.
Fairless, A. H., Dow, H. C., Toledo, M. M., Malkus, K. A., Edelmann, M., Li, H., Talbot, K., Arnold, S. E., Abel, T., and Brodkin, E. S. (2008). Low sociability is associated with reduced size of the corpus callosum in the BALB/cJ inbred mouse strain. Brain Res. 1230, 211–217.
Fame, R. M., Macdonald, J. L., and Macklis, J. D. (2011). Development, specification, and diversity of callosal projection neurons. Trends Neurosci. 34, 41–50.
Frazer, K. A., Eskin, E., Kang, H. M., Bogue, M. A., Hinds, D. A., Beilharz, E. J., Gupta, R. V., Montgomery, J., Morenzoni, M. M., Nilsen, G. B., Pethiyagoda, C. L., Stuve, L. L., Johnson, F. M., Daly, M. J., Wade, C. M., and Cox, D. R. (2007). A sequence-based variation map of 8.27 million SNPs in inbred mouse strains. Nature 448, 1050–1053.
Frazier, T. W., and Hardan, A. Y. (2009). A meta-analysis of the corpus callosum in autism. Biol. Psychiatry 66, 935–941.
Gaglani, S. G., Lu, L., Williams, R. W., and Rosen, G. D. (2009). The genetic control of neocortex volume and covariation with neocortical gene expression in mice. BMC Neurosci. 10, 44. doi:10.1186/1471-2202-10-44
Ganjavi, H., Lewis, J. D., Bellec, P., Macdonald, P. A., Waber, D. P., Evans, A. C., and Karama, S. (2011). Negative associations between corpus callosum midsagittal area and IQ in a representative sample of healthy children and adolescents. PLoS ONE 6, e19698. doi:10.1371/journal.pone.0019698
Going, J. J., and Dixson, A. (1990). Morphometry of the adult human corpus callosum: lack of sexual dimorphism. J. Anat. 171, 163–167.
Guillem, K., Bloem, B., Poorthuis, R. B., Loos, M., Smit, A. B., Maskos, U., Spijker, S., and Mansvelder, H. D. (2011). Nicotinic acetylcholine receptor beta2 subunits in the medial prefrontal cortex control attention. Science 333, 888–891.
Gundersen, H. J. G., and Jensen, E. B. (1987). The efficiency of systematic sampling in stereology and its prediction. J. Microsc. 147, 229–263.
Hertel, N., and Redies, C. (2011). Absence of layer-specific cadherin expression profiles in the neocortex of the reeler mutant mouse. Cereb. Cortex 21, 1105–1117.
Holloway, R. L., Anderson, P. J., Defendini, R., and Harper, C. (1993). Sexual dimorphism of the human corpus callosum from three independent samples: relative size of the corpus callosum. Am. J. Phys. Anthropol. 92, 481–498.
Holloway, R. L., and de Lacoste, M. (1986). Sexual dimorphism in the human corpus callosum: an extension and replication study. Hum. Neurobiol. 5, 87–91.
Innocenti, G. M. (1995). Exuberant development of connections, and its possible permissive role in cortical evolution. Trends Neurosci. 18, 397–402.
Innocenti, G. M., and Berbel, P. (1991). Analysis of an experimental cortical network: ii) Connections of visual areas 17 and 18 after neonatal injections of ibotenic acid. J. Neural Transplant. Plast. 2, 29–54.
Innocenti, G. M., and Price, D. J. (2005). Exuberance in the development of cortical networks. Nat. Rev. Neurosci. 6, 955–965.
Kempton, M. J., Salvador, Z., Munafo, M. R., Geddes, J. R., Simmons, A., Frangou, S., and Williams, S. C. (2011). Structural neuroimaging studies in major depressive disorder. Meta-analysis and comparison with bipolar disorder. Arch. Gen. Psychiatry 68, 675–690.
Kim, S. Y., Yasuda, S., Tanaka, H., Yamagata, K., and Kim, H. (2011). Non-clustered protocadherin. Cell Adh. Migr. 5, 97–105.
Krishna, K. K., Hertel, N., and Redies, C. (2011). Cadherin expression in the somatosensory cortex: evidence for a combinatorial molecular code at the single-cell level. Neuroscience 175, 37–48.
Kusek, G. K., Wahlsten, D., Herron, B. J., Bolivar, V. J., and Flaherty, L. (2007). Localization of two new X-linked quantitative trait loci controlling corpus callosum size in the mouse. Genes Brain Behav. 6, 359–363.
Le Roy, I., Perez-Diaz, F., and Roubertoux, P. (1998). Quantitative trait loci implicated in corpus callosum midsagittal area in mice. Brain Res. 811, 173–176.
Linder, B., Plottner, O., Kroiss, M., Hartmann, E., Laggerbauer, B., Meister, G., Keidel, E., and Fischer, U. (2008). Tdrd3 is a novel stress granule-associated protein interacting with the Fragile-X syndrome protein FMRP. Hum. Mol. Genet. 17, 3236–3246.
Livy, D., and Wahlsten, D. (1991). Test of genetic allelism between four inbred mouse strains with absent corpus callosum. J. Hered. 82, 459–464.
Lu, L. H., Zhou, X. J., Keedy, S. K., Reilly, J. L., and Sweeney, J. A. (2011). White matter microstructure in untreated first episode bipolar disorder with psychosis: comparison with schizophrenia. Bipolar. Disord. 13, 604–613.
Mizuno, H., Hirano, T., and Tagawa, Y. (2007). Evidence for activity-dependent cortical wiring: formation of interhemispheric connections in neonatal mouse visual cortex requires projection neuron activity. J. Neurosci. 27, 6760–6770.
Moldrich, R. X., Gobius, I., Pollak, T., Zhang, J., Ren, T., Brown, L., Mori, S., De Juan Romero, C., Britanova, O., Tarabykin, V., and Richards, L. J. (2010). Molecular regulation of the developing commissural plate. J. Comp. Neurol. 518, 3645–3661.
Molyneaux, B. J., Arlotta, P., Menezes, J. R., and Macklis, J. D. (2007). Neuronal subtype specification in the cerebral cortex. Nat. Rev. Neurosci. 8, 427–437.
Morrow, E. M., Yoo, S. Y., Flavell, S. W., Kim, T. K., Lin, Y., Hill, R. S., Mukaddes, N. M., Balkhy, S., Gascon, G., Hashmi, A., Al-Saad, S., Ware, J., Joseph, R. M., Greenblatt, R., Gleason, D., Ertelt, J. A., Apse, K. A., Bodell, A., Partlow, J. N., Barry, B., Yao, H., Markianos, K., Ferland, R. J., Greenberg, M. E., and Walsh, C. A. (2008). Identifying autism loci and genes by tracing recent shared ancestry. Science 321, 218–223.
Notaridou, M., Quaye, L., Dafou, D., Jones, C., Song, H., Hogdall, E., Kjaer, S. K., Christensen, L., Hogdall, C., Blaakaer, J., Mcguire, V., Wu, A. H., Van Den Berg, D. J., Pike, M. C., Gentry-Maharaj, A., Wozniak, E., Sher, T., Jacobs, I. J., Tyrer, J., Schildkraut, J. M., Moorman, P. G., Iversen, E. S., Jakubowska, A., Medrek, K., Lubinski, J., Ness, R. B., Moysich, K. B., Lurie, G., Wilkens, L. R., Carney, M. E., Wang-Gohrke, S., Doherty, J. A., Rossing, M. A., Beckmann, M. W., Thiel, F. C., Ekici, A. B., Chen, X., Beesley, J., Gronwald, J., Fasching, P. A., Chang-Claude, J., Goodman, M. T., Chenevix-Trench, G., Berchuck, A., Pearce, C. L., Whittemore, A. S., Menon, U., Pharoah, P. D., Gayther, S. A., and Ramus, S. J. (2011). Common alleles in candidate susceptibility genes associated with risk and development of epithelial ovarian cancer. Int. J. Cancer 128, 2063–2074.
Oedegaard, K. J., Greenwood, T. A., Johansson, S., Jacobsen, K. K., Halmoy, A., Fasmer, O. B., Akiskal, H. S., Haavik, J., and Kelsoe, J. R. (2010). A genome-wide association study of bipolar disorder and comorbid migraine. Genes Brain Behav. 9, 673–680.
O’Leary, D. D., Chou, S. J., and Sahara, S. (2007). Area patterning of the mammalian cortex. Neuron 56, 252–269.
Oppenheim, J. S., Lee, B. C., Nass, R., and Gazzinaga, M. S. (1987). No sex-related differences in human corpus callosum based on magnetic resonance imagery. Ann. Neurol. 21, 604–606.
Park, J. S., Yoon, U., Kwak, K. C., Seo, S. W., Kim, S. I., Na, D. L., and Lee, J. M. (2011). The relationships between extent and microstructural properties of the midsagittal corpus callosum in human brain. Neuroimage 56, 174–184.
Pedrosa, E., Shah, A., Tenore, C., Capogna, M., Villa, C., Guo, X., Zheng, D., and Lachman, H. M. (2010). beta-catenin promoter ChIP-chip reveals potential schizophrenia and bipolar disorder gene network. J. Neurogenet. 24, 182–193.
Peng, J., Wallar, B. J., Flanders, A., Swiatek, P. J., and Alberts, A. S. (2003). Disruption of the diaphanous-related formin Drf1 gene encoding mDia1 reveals a role for Drf3 as an effector for Cdc42. Curr. Biol. 13, 534–545.
Philip, V. M., Duvvuru, S., Gomero, B., Ansah, T. A., Blaha, D. C., Cook, M. N., Hamre, K. M., Lariviere, W. R., Matthews, D. B., Mittleman, G., Goldowitz, D. G., and Chesler, E. J. (2010). High-throughput behavioral phenotyping in the expanded panel of BXD recombinant inbred strains. Genes Brain Behav. 9, 129–159.
Phillips, K. A., and Sherwood, C. C. (2012). Age-related differences in corpus callosum area of capuchin monkeys. Neuroscience 202, 202–208.
Pozzilli, C., Bastianello, S., Bozzao, A., Pierallini, A., Giubilei, F., Argentino, C., and Bozzao, L. (1994). No differences in corpus callosum size by sex and aging. A quantitative study using magnetic resonance imaging. J. Neuroimaging 4, 218–221.
Raine, A., Lencz, T., Taylor, K., Hellige, J. B., Bihrle, S., Lacasse, L., Lee, M., Ishikawa, S., and Colletti, P. (2003). Corpus callosum abnormalities in psychopathic antisocial individuals. Arch. Gen. Psychiatry 60, 1134–1142.
Rakic, P., and Yakovlev, P. I. (1968). Development of the corpus callosum and cavum septi in man. J. Comp. Neurol. 132, 45–72.
Rash, B. G., and Richards, L. J. (2001). A role for cingulate pioneering axons in the development of the corpus callosum. J. Comp. Neurol. 434, 147–157.
Rauch, R. A., and Jinkins, J. R. (1994). Analysis of cross-sectional area measurements of the corpus callosum adjusted for brain size in male and female subjects from childhood to adulthood. Behav. Brain Res. 64, 65–78.
Rosen, G. D., Azoulay, N. G., Griffin, E. G., Newbury, A. J., Koganti, L., Fujisaki, N., Takahashi, E., Grant, P. E., Truong, D. T., Fitch, R. H., Lu, L., and Williams, R. W. (2012). Bilateral subcortical heterotopia with partial callosal agenesis in a mouse mutant. Cereb. Cortex. doi:10.1093/cercor/bhs080. [Epub ahead of print].
Rosen, G. D., Chesler, E. J., Manly, K. F., and Williams, R. W. (2007). An informatics approach to systems neurogenetics. Methods Mol. Biol. 401, 287–303.
Rosen, G. D., and Harry, J. D. (1990). Brain volume estimation from serial section measurements: a comparison of methodologies. J. Neurosci. Methods 35, 115–124.
Rosen, G. D., La Porte, N. T., Diechtiareff, B., Pung, C. J., Nissanov, J., Gustafson, C., Bertrand, L., Gefen, S., Fan, Y., Tretiak, O., Manly, K. F., Park, M. R., Williams, A. G., Connolly, M. T., Capra, J. A., and Williams, R. W. (2003). Informatics center for mouse genomics: the dissection of complex traits of the nervous system. Neuroinformatics 1, 327–342.
Rosen, G. D., Pung, C. J., Owens, C. B., Caplow, J., Kim, H., Mozhui, K., Lu, L., and Williams, R. W. (2009). Genetic modulation of striatal volume by loci on Chrs 6 and 17 in BXD recombinant inbred mice. Genes Brain Behav. 8, 296–308.
Rosen, G. D., and Williams, R. W. (2001). Complex trait analysis of the mouse striatum: independent QTLs modulate volume and neuron number. BMC Neurosci. 2, 5. doi:10.1186/1471-2202-2-5
Scamvougeras, A., Kigar, D. L., Jones, D., Weinberger, D. R., and Witelson, S. F. (2003). Size of the human corpus callosum is genetically determined: an MRI study in mono and dizygotic twins. Neurosci. Lett. 338, 91–94.
Sen, S., Broman, K. W., Satagopan, J., and Churchill, G. A. (2005a). R/qtlDesign: Inbred Line Cross Experiment Design. eScholarship Repository [Online]. Available at: http://repositories.cdlib.org/cbmb/qtl-powercalculations/
Sen, S., Satagopan, J. M., and Churchill, G. A. (2005b). Quantitative trait locus study design from an information perspective. Genetics 170, 447–464.
Shifman, S., Bell, J. T., Copley, R. R., Taylor, M. S., Williams, R. W., Mott, R., and Flint, J. (2006). A high-resolution single nucleotide polymorphism genetic map of the mouse genome. PLoS Biol. 4, e395. doi:10.1371/journal.pbio.0040395
Shu, T., and Richards, L. J. (2001). Cortical axon guidance by the glial wedge during the development of the corpus callosum. J. Neurosci. 21, 2749–2758.
Smith, K. M., Ohkubo, Y., Maragnoli, M. E., Rasin, M. R., Schwartz, M. L., Sestan, N., and Vaccarino, F. M. (2006). Midline radial glia translocation and corpus callosum formation require FGF signaling. Nat. Neurosci. 9, 787–797.
Steinmetz, H., Staiger, J. F., Schlaug, G., Huang, Y. X., and Jancke, L. (1995). Corpus callosum and brain volume in women and men. Neuroreport 6, 1002–1004.
Storm, E. E., Garel, S., Borello, U., Hebert, J. M., Martinez, S., Mcconnell, S. K., Martin, G. R., and Rubenstein, J. L. (2006). Dose-dependent functions of Fgf8 in regulating telencephalic patterning centers. Development 133, 1831–1844.
Wahlsten, D., Metten, P., and Crabbe, J. C. (2003). Survey of 21 inbred mouse strains in two laboratories reveals that BTBR T/+ tf/tf has severely reduced hippocampal commissure and absent corpus callosum. Brain Res. 971, 47–54.
Wallar, B. J., Stropich, B. N., Schoenherr, J. A., Holman, H. A., Kitchen, S. M., and Alberts, A. S. (2006). The basic region of the diaphanous-autoregulatory domain (DAD) is required for autoregulatory interactions with the diaphanous-related formin inhibitory domain. J. Biol. Chem. 281, 4300–4307.
Wang, J., Williams, R. W., and Manly, K. F. (2003). WebQTL: Web-based complex trait analysis. Neuroinformatics 1, 299–308.
Weber, G., and Weis, S. (1986). Morphometric analysis of the human corpus callosum fails to reveal sex-related differences. J. Hirnforsch. 27, 237–240.
Keywords: corpus callosum, QTL, midsagittal area, neocortex, mouse, BXD
Citation: Newbury AJ and Rosen GD (2012) Genetic, morphometric, and behavioral factors linked to the midsagittal area of the corpus callosum. Front. Gene. 3:91. doi: 10.3389/fgene.2012.00091
Received: 06 April 2012; Accepted: 07 May 2012;
Published online: 31 May 2012.
Edited by:
Mark Reimers, Virginia Commonwealth University, USAReviewed by:
Rita M. Cantor, University of California Los Angeles, USACamron D. Bryant, The University of Chicago, USA
Copyright: © 2012 Newbury and Rosen. This is an open-access article distributed under the terms of the Creative Commons Attribution Non Commercial License, which permits non-commercial use, distribution, and reproduction in other forums, provided the original authors and source are credited.
*Correspondence: Glenn D. Rosen, Department of Neurology, Beth Israel Deaconess Medical Center, E/CLS-643, 330 Brookline Avenue, Boston, MA 02215, USA. e-mail:Z3Jvc2VuQGJpZG1jLmhhcnZhcmQuZWR1