 L. Basten Snoek1†‡ Inez R. Terpstra2†‡ René Dekter2
 Guido Van den Ackerveken2,3
 Anton J. M. Peeters1*†
- 1Laboratory of Plant Ecophysiology, Department of Biology, Institute of Environmental Biology, Utrecht University, Utrecht, Netherlands
- 2Laboratory of Plant-Microbe Interactions, Department of Biology, Institute of Environmental Biology, Utrecht University, Utrecht, Netherlands
- 3Centre for BioSystems Genomics, Wageningen University and Research Center, Wageningen, Netherlands
One of the major goals of quantitative genetics is to unravel the complex interactions between molecular genetic factors and the environment. The effects of these genotype-by-environment interactions also affect and cause variation in gene expression. The regulatory loci responsible for this variation can be found by genetical genomics that involves the mapping of quantitative trait loci (QTLs) for gene expression traits also called expression-QTL (eQTLs). Most genetical genomics experiments published so far, are performed in a single environment and hence do not allow investigation of the role of genotype-by-environment interactions. Furthermore, most studies have been done in a steady state environment leading to acclimated expression patterns. However a response to the environment or change therein can be highly plastic and possibly lead to more and larger differences between genotypes. Here we present a genetical genomics study on 120 Arabidopsis thaliana, Landsberg erecta × Cape Verde Islands, recombinant inbred lines (RILs) in active response to the environment by treating them with 3 h of shade. The results of this experiment are compared to a previous study on seedlings of the same RILs from a steady state environment. The combination of two highly different conditions but exactly the same RILs with a fixed genetic variation showed the large role of genotype-by-environment interactions on gene expression levels. We found environment-dependent hotspots of transcript regulation. The major hotspot was confirmed by the expression profile of a near isogenic line. Our combined analysis leads us to propose CSN5A, a COP9 signalosome component, as a candidate regulator for the gene expression response to shade.
Introduction
Developmental processes and the responses of organisms to their environment are largely genetically determined. However, phenotypic variation is also strongly influenced by the environment and by genotype-by-environment interactions. Complex interactions between polymorphic gene products specific for an environment or changing conditions are at the basis of the variation in responses between individuals within a species. Besides phenotypic responses, transcript levels of many genes are similarly influenced by the environment in addition to genetic differences.
Variation in genotype leading to heritable differences in transcript levels has been used to find expression Quantitative Trait Loci (eQTLs) in genetical genomics studies (Jansen and Nap, 2001) on a number of model organisms (Brem et al., 2002; Bing and Hoeschele, 2005; Brem and Kruglyak, 2005; Bystrykh et al., 2005; Li et al., 2006, 2010; Keurentjes et al., 2007; West et al., 2007; Viñuela et al., 2010, 2012; Zhang et al., 2011). The identified eQTLs were instrumental in unraveling transcript regulatory networks (Bing and Hoeschele, 2005; Keurentjes et al., 2007; Terpstra et al., 2010). DNA polymorphisms in or near a gene can affect the gene’s own expression (local or cis regulation) and/or the expression of target genes at other locations in the genome (distant or trans-regulation). Candidate regulatory genes, responsible for distant regulation, can be selected based on co-expression with their target genes. Regulatory loci that affect the expression of many genes are called Hotspots for transcript regulation (HTRs). These genomic regions, enriched in eQTLs, are identified in most genetical genomics experiments (Brem et al., 2002; Schadt et al., 2003; Bystrykh et al., 2005; Li et al., 2006; Keurentjes et al., 2007; West et al., 2007; Zhang et al., 2011; Snoek et al., 2012) and point to, so called, master regulators. Regulatory genes do not always exert their effect on target gene expression by changing their own expression levels, but instead by differential activity at the protein level. In our previous genetical genomics study in Arabidopsis thaliana (Keurentjes et al., 2007) the receptor-like kinase (RLK) gene ERECTA was identified as an HTR, although it was not cis-regulated. The combination of single mutant gene expression profiles with eQTL data and transcription factor binding site analysis, allowed the verification of HTR targets and identification of downstream signaling cascades (Terpstra et al., 2010).
Genetical genomics studies on Arabidopsis performed so far have revealed variation in gene expression under one experimental condition (Keurentjes et al., 2007; West et al., 2007; Zhang et al., 2011). Steady state transcript levels were measured and the effect of genotype within these environmental settings on variation in gene expression was studied. The genotype of an organism can in fact express different phenotypes as a function of the environment, which is called phenotypic plasticity (Nicotra et al., 2010). Many of these plastic responses to a change in the environment are relatively fast and the result of transient changes in transcript abundance. Plasticity in gene expression is much exploited in numerous gene expression analyses studying the effect of specific treatments. When different genotypes respond differently to changes in the environment, there is genotype-by-environment interaction. In any case though, this interaction will only manifest itself after induction, for instance after an environmental change.
The influence of the environment on gene expression is reflected in the highly plastic nature of gene expression regulation, as shown in a genetical genomics studies on a Caenorhabditis elegans recombinant inbred line (RIL) population grown in two different temperatures (Li et al., 2006) or at three different ages (Viñuela et al., 2010). The majority of genes that showed plasticity in regulation due to genotype-by-temperature interaction were mainly regulated in trans, with a large group of genes affected by the same regulatory locus. Also in yeast, grown on two different carbon sources, trans-regulation was more plastic (Smith and Kruglyak, 2008). In another study, where yeast strains were grown under distinct growth conditions, the genes that showed plastic regulation were biased to non-essential genes (Landry et al., 2006). In contrast, analysis of dynamic responses to heat-shock revealed that plasticity in regulation was more often observed for essential genes (Eng et al., 2010). The latter study clearly showed that, in addition to different environments, the transition between environments provided a new source of expression variation.
An important environmental change that plants experience everyday is shade or a change in light conditions. Low light treatment induces the shade avoidance syndrome (SAS), which includes enhanced elongation of stems and petioles, upward leaf movement (hyponastic growth) and increased apical dominance (Ballaré, 1999; Millenaar et al., 2005; Franklin, 2008; Keuskamp et al., 2011), concurrent with rapid changes in gene transcript levels (Devlin et al., 2003; Salter et al., 2003; Sessa et al., 2005; Millenaar et al., 2006). Low light is perceived by phytochromes, cryptochromes, phototropins, and members of the Zeitlupe (ZTL) family of photoreceptors (Takemiya et al., 2005; Franklin, 2008; Demarsy and Fankhauser, 2009; Pierik et al., 2009; Keller et al., 2011). Subsequent signaling involves phytochrome-interacting factors PIF4 and PIF5. Although the low light-induced hyponastic response is similar to ethylene-induced hyponasty, the low light response is independent of ethylene signaling. Instead, auxin signaling and polar transport in combination with brassinosteroids (BR) are required for low light-induced hyponastic growth (Millenaar et al., 2009; Kozuka et al., 2010; Keller et al., 2011; Keuskamp et al., 2011).
Here we analyze the effect of genotype and the genotype-by-environment interaction on genome wide transcript levels of Arabidopsis RILs exposed to low light conditions. Transcript levels of 120 Landsberg erecta (Ler) and Cape Verde Islands (Cvi) RILs (Alonso-Blanco et al., 1998) were measured on DNA microarrays and compared to our previous genetical genomics experiment (GG1) on the same population that was grown under normal light conditions (Keurentjes et al., 2007). Comparison of the two experiments identified genotype-specific eQTLs as well as experiment-specific, so called plasticity eQTLs. In response to low light a major effect on transcript regulation was exerted by an HTR on chromosome 1, which was confirmed in the analysis of a near isogenic line (NIL). Genes that are regulated by the HTR were associated with the circadian clock and processes related to auxin, sterols and reactive oxygen species (ROS). We propose a candidate master regulator to interactively affect these processes in the complex low light-induced SAS.
Results
Natural Variation in Transcript Abundance Under Low Light Conditions
The RILs generated from the parental Arabidopsis accessions Ler and Cvi show a high level of phenotypic variation in response to low light, indicating there is a strong influence of genotype on the SAS-related responses (Van Zanten et al., 2010). To assess the effect of genotype on the transcriptional response to low light, genome wide transcript levels were measured in 120 Ler/Cvi RILs and their parental lines (referred to as Genetical Genomics experiment 2, or GG2). For this, 3-week-old plants grown under short-day conditions were shifted to low light conditions, a ∼90% reduction in light intensity, and leaf tissue was collected 3 h later. We assessed the contribution of plant genotype to variation in transcript levels by calculating the broad sense heritabilities for all genes in the parental lines and RILs. The median broad sense heritability of gene expression in the parents was 0.26 and in the RILs 0.46, indicating that the genetic background has a greater influence on the variation in transcript levels in the RILs than in the parents. We determined linkage to variation in transcript abundance and mapped 7868 eQTLs for 6676 genes (at false discovery rate (fdr) < 0.05) for ∼32% of total measured transcripts.
This linkage was visualized by plotting the position of the genes of which expression levels are regulated to the position of the regulatory eQTLs (Figure 1). The gray diagonal line depicts local regulation. Distant regulation is visible as vertical “bands.” Many distant effects are found near the top of chromosome 1, where transcript levels of a large number of genes are affected by one locus. We found a similar number of eQTLs for distant as for local regulation (Table 1).
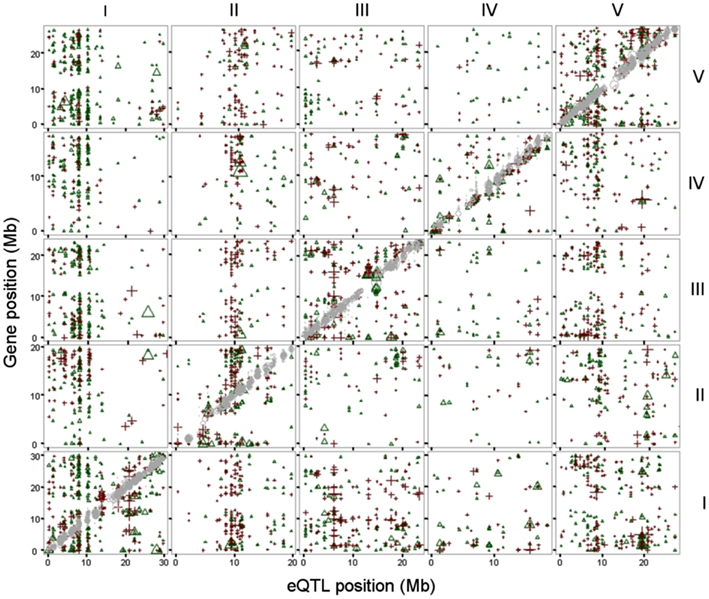
Figure 1. eQTLs, physical position of the top of the eQTL (x-axis) plotted against the physical position of the gene (y axis). Both physical positions are in mega basepairs (Mb) and plotted per chromosome (I-V, indicated at the top and right side). eQTLs for local (cis) regulation are in gray (diagonal). eQTLs with a Ler positive effect are depicted as green triangles, eQTLs with a Cvi positive (=Ler negative) effect as red plus signs. Chromosomes are indicated on the right for rows and on top for columns of graphs.
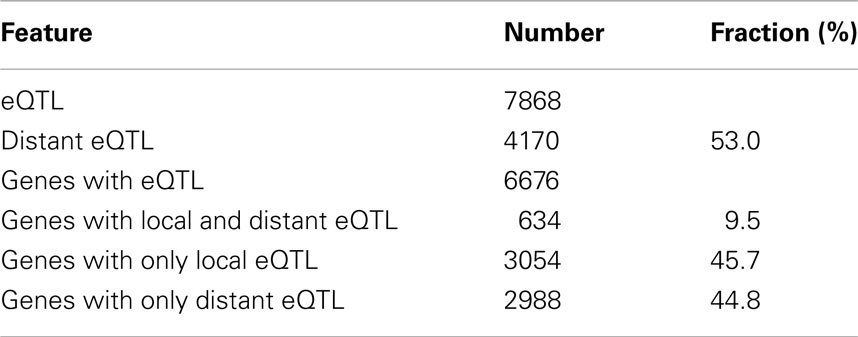
Table 1. eQTLs mapped in 120 RILs exposed to low light conditions.
The transcript profiles of Ler and Cvi, similarly treated for 3 h with a ∼90% reduction in light intensity, showed 3228 genes (fdr < 0.05) with differentially abundant transcripts between the parental lines (Table 2). Of these genes, 2379 (74%) had an eQTL, which is 36%of all genes with an eQTL. The eQTLs for the Ler/Cvi differentially abundant transcripts show more local regulation than the overall fraction of locally regulated genes (707 distant, 1374 local, and 298 both). These local eQTLs are probably caused by polymorphisms between Ler and Cvi within the promoters or other regulatory sequences of the genes that show differential expression. To assess this relation, the eQTL distribution was correlated to the distribution of genes containing Single Nucleotide Polymorphisms (SNPs). Indeed, the local eQTL distribution shows a higher correlation to the SNP distribution (0.64; t-test p < 10−14) than that of the distant eQTLs (0.26; t-test p < 0.01).
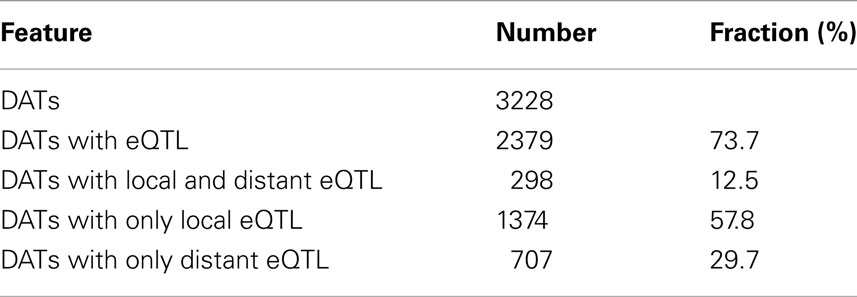
Table 2. eQTLs of Ler/Cvi differentially abundant transcripts (DATs) in response to low light treatment.
Variation in Gene Expression Increased by Transgression and Low Light Treatment
The number of genes with an eQTL, as determined in the RIL population, is much larger than the number of transcripts that are differential between Ler and Cvi. For 64% of the genes with an eQTL (∼20% of all genes) no differential transcript abundance between the parental lines is observed. The influence of recombination of parental alleles in the RILs on the larger variation in transcript levels is reflected in the higher heritabilities for the transcript levels in the RILs than in the parents. Combinations of parental alleles with different effects can enhance variation and lead to more extreme transcript levels than in the parental lines. This transgression was observed for 3495 genes (17% of the genes). The genes with eQTLs but without differential transcript levels between the parents show more transgression (21%; 913 of 4297) than the overall fraction of transgressive genes with eQTLs (18%; 1230 of 6676 genes; hypergeometric test p < 1.3* 10−16). Transgression can therefore explain, for a considerable part, the larger variation in gene transcript levels caused by genotype in the RILs than in the parents.
A major part of the environmental effect in GG2 may well be attributed to the change in light conditions, the exposure to low light, which induces the SAS. To estimate the effect of natural variation within the RILs on the response induced by low light, we compared our data to transcript profiles of Columbia (Col-0) petioles treated with low light under similar experimental conditions (Millenaar et al., 2006). A reduction in light intensity of ∼90% for 3 h resulted in differential transcript levels of 2579 genes, compared to Col-0 plants that remained under full light conditions. Of these, 2278 low light responsive genes could be analyzed on the microarray in GG2, and are referred to as low light-regulated genes from here on. The number of low light-regulated genes that is differentially regulated between Ler and Cvi is 506 (22%). This is significantly higher (hypergeometric test p < 1.8*10−17) than the overall percentage of 16% genes with differentially abundant transcripts (2794 genes of the 17498 genes that could be measured in both experiments). We also observe significantly more (hypergeometric test p < 1.3*10−29) eQTLs in GG2 for the low light-affected transcripts (43%) than for all transcripts (33%). Taken together this shows that the low light treatment of the RILs in GG2 revealed natural variation in the induced response to low light.
Comparison of Two Genetical Genomics Experiments
Our genetical genomics experiment under low light (GG2) gave us the opportunity to compare the observed natural variation in gene expression to our first genetical genomics experiment (GG1), under normal light conditions. In the two experiments the same population of RILs and parental lines were profiled in a similar microarray distant-pair design (Fu and Jansen, 2006). There were, however, marked differences. In GG1 the aerial parts of 7-day-old seedlings were profiled, opposed to leaves of 3-week-old plants in GG2. So not only developmental stage, but also the collected tissue types were different. Furthermore, seedlings in GG1 were grown in vitro on synthetic medium under long-day conditions. In GG2 the plants were grown under short-day conditions in soil. Most importantly, plants from GG2 were placed, 3 h before being harvested, to low light conditions, which mimics neutral shade that is known to lead to large transcriptional changes. In contrast, seedlings in GG1 were not subjected to low light but harvested for expression profiling when plants were 7 h into the light period. From here on we refer to these developmental and environmental differences as the experimental effect. In the two genetical genomics experiments the distributions of eQTLs over the five Arabidopsis chromosomes are clearly distinct, reflecting the strong experimental effect on the regulation of gene expression (Figure 2).
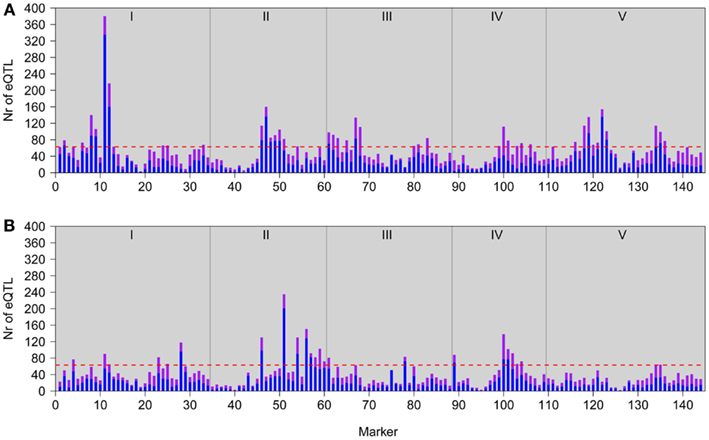
Figure 2. Genomic distributions of eQTLs in GG2 (A; this study) and GG1 (B; Keurentjes et al., 2007). Bars represent the number of local (in cis; purple) and distant (in trans; blue) eQTL peaks detected at each marker position. The horizontal red lines represent the significance threshold values for defining a hotspot. Gray vertical lines depict chromosomal borders, chromosomes (I–V) are indicated at the top.
In GG2, the main HTR is located at the top of chromosome 1, where the Ler locus mainly has a positive effect on gene expression (Figures 1 and 2A). This locus co-locates with a QTL for petiole angle, a phenotype that is part of the SAS (Snoek and Peeters, personal communication) and suggests a functional link between the expression changes caused by the chromosome 1 HTR and low light-induced phenotypic variation. In GG1, the gene underlying the main HTR (Figure 2B) was ERECTA on chromosome 2 that also has a large influence on many phenotypic growth-related traits (Van Zanten et al., 2009). Comparison of the eQTL distributions in both experiments shows a stronger correlation between GG1 and GG2 for local (∼0.64) than for distant eQTLs (∼0.21). This suggests that the eQTLs for local regulation are predominantly genotype-specific and independent of the experimental conditions, whereas those for distant regulation are more experimentally controlled.
In the two experiments together a total of 12287 eQTLs were mapped, for 7259 genes of the 19205 genes profiled in both experiments. Despite the completely different environmental conditions, for 1095 genes1129 overlapping eQTLs were found, that is 9% of the total number of eQTLs. As we expected, there was a strong effect of the genotype on the 1095 genes having overlapping eQTLs as 974 of these (89%) were found to be locally regulated, suggesting they are affected by cis-regulatory polymorphisms. The 11540 eQTLs that were specific for each experiment reflect the large plasticity in gene expression regulation. The fraction of distantly regulated eQTLs is considerably higher in the experiment-specific eQTLs (62%; 7158 eQTLs) than in the overlapping eQTLs (11%).
Plastic Regulation of Transcript Abundance
To determine the similarity in genetic regulation of each gene between the two experiments we compared – log(P) eQTL profiles. These profiles depict the significance of linkage of variation in transcript levels at every marker position along the genome, multiplied by the sign of the additive effect at each marker position. For the genes without significant eQTLs in either experiment (10693 genes) we observed that the correlation coefficients between the profiles were normally distributed around zero (Figure 3A). This was also seen for the genes with an eQTL in one experiment only (2307 genes in GG1 and4293 genes in GG2), although the distribution was slightly positively skewed (Figures 3B,C). Genes with an eQTL just below the threshold in one experiment and a significant eQTL in the other might have caused the positive skewing.
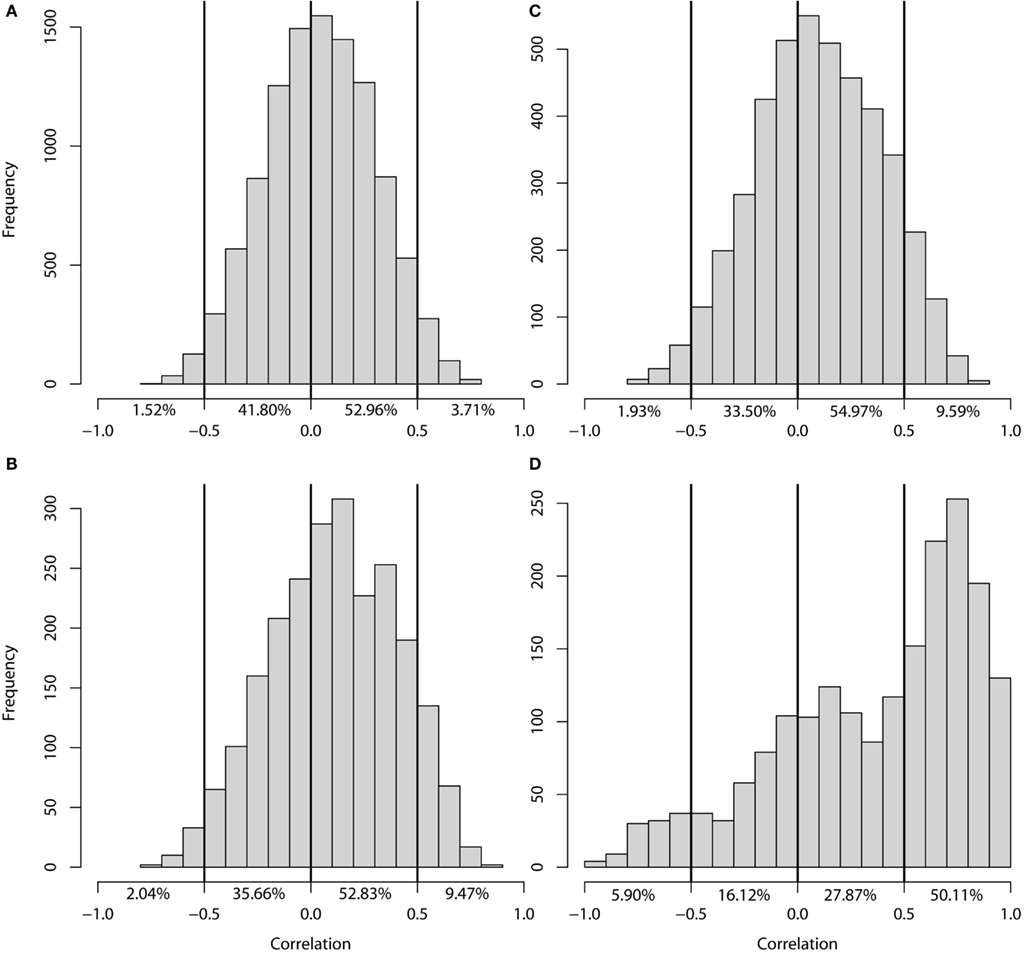
Figure 3. Histogram of the correlation of −log(P) profiles per gene. Correlation between the −log(P) profiles of genes (A) without eQTLs in either experiment, (B) with an eQTL in GG1 only, (C) with an eQTL in GG2 only, (D) with an eQTL in both experiments.
Of the genes with an eQTL in both experiments (1912), half showed a strong positive correlation (higher than 0.5; 954 genes) between their eQTL profiles (Figure 3D). The transcript levels of these genes are regulated by similar loci in the two experiments. Surprisingly, almost 6% of the genes with an eQTL in both experiments (112 genes) show a strong negative correlation (less than −0.5) between their eQTL profiles. The transcript levels of these genes are affected by the same loci in both experiments but in an opposite manner. A possible explanation is that the expression level of a gene with negatively correlated eQTL profiles could be constant in one parental line, but plastically regulated in the other (Figure 4A). Alternatively, the gene is plastically regulated in both parents, but each showing the strongest activation under different conditions, e.g., in the Ler parent in GG1 and in the Cvi parent in GG2 (Figure 4B).
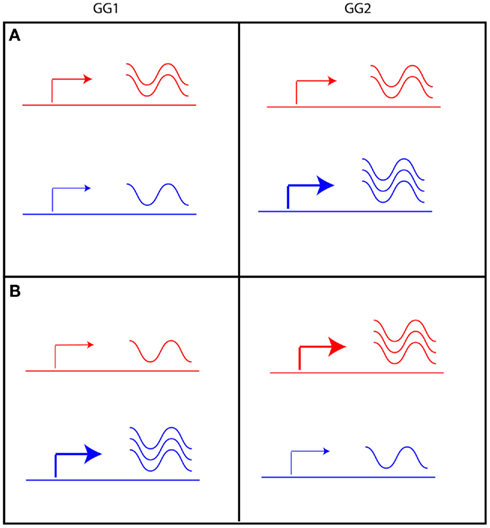
Figure 4. Two scenarios can explain eQTLs with opposite effect in GG1 and GG2. The level of expression of a given gene in Ler (red) and Cvi (blue) is indicated by the arrow, indicating low (thin arrow) or high (thick arrow) promoter activity resulting in a low or high level of transcript (indicated by the waving lines). (A) gene expression in Ler is unchanged, but in Cvi it is plastically regulated. (B) gene expression is plastically regulated in both Ler and Cvi, but activation of expression is stronger in GG1 of the Cvi allele and in GG2 of the Ler allele.
When looking at the individual eQTLs, we can identify 135 eQTLs with opposing additive effects between the two experiments (from the total of 1129 eQTLs corresponding to 1095 genes). Gene Ontology (GO) analysis showed that these genes are enriched for the molecular function categories “glutathione transferase activity” and “lyase activity” and the biological process categories “alcohol metabolic process” and “negative regulation of cell cycle process” (Table 3).
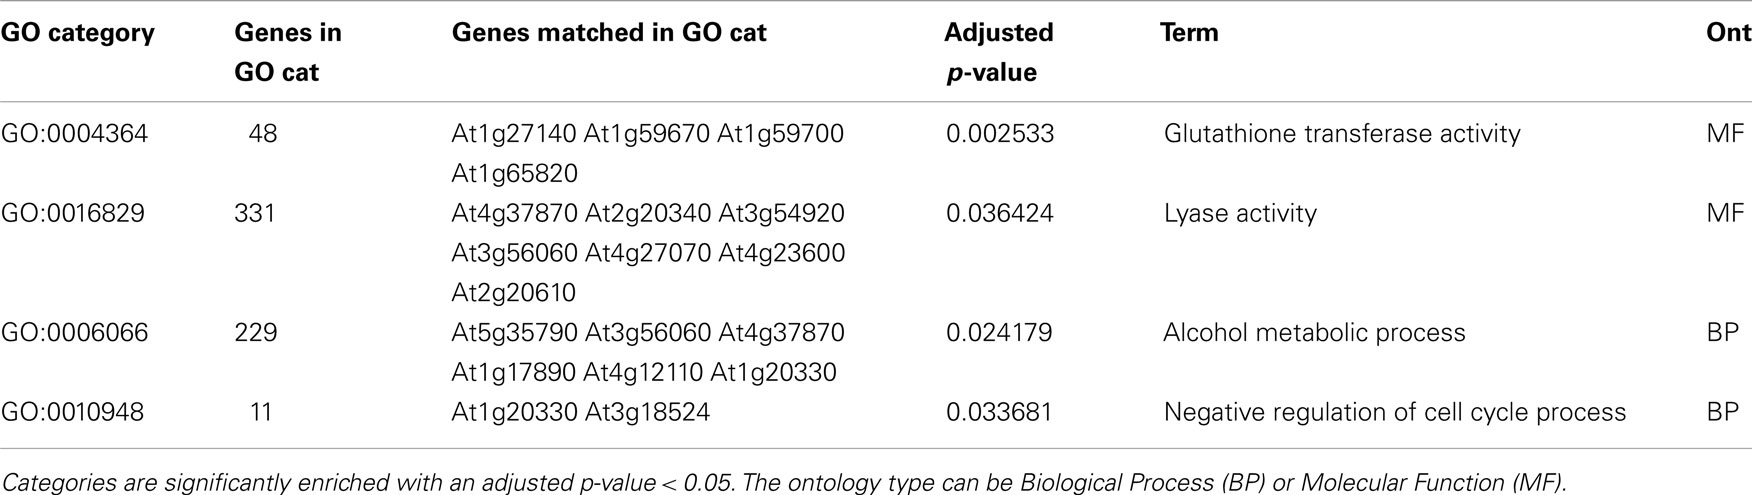
Table 3. Overrepresented GO categories in lists of genes with overlapping eQTLs in both GG2 and GG1 with opposite additive effect.
Among the 16 genes annotated to these enriched groups are notable examples that can be linked to the low light response. TRYPTOPHAN SYNTHASE BETA-SUBUNIT 2 (TSB2At4g27070) and SUPERROOT 1 (SUR1 At2g20610) are involved in tryptophan metabolism and glucosinolate biosynthesis, that both impact auxin homeostasis (Bender and Celenza, 2009). Also the plastically regulated gene STEROL METHYLTRANSFERASE 2 (SMT2 At1g20330) that is annotated to the enriched GO categories is also located under the chromosome 1 HTR and is locally regulated. smt2 mutants are affected in sterol composition of the membrane and in the biosynthesis of brassinosteroid hormones (BR; Chung et al., 2010). Together with auxin, this hormone is required for the SAS in response to low light (Kozuka et al., 2010; Keuskamp et al., 2011). The regulation of expression of these genes is clearly dependent on the interaction of genotype with the environment and constitutes therefore a striking example of plastic regulation.
Promoter Elements Enriched in the HTR-Regulated Genes
The variation in transcript levels in low light treated leaves between Ler and Cvi (GG2) is strongly determined by the HTR on the top of chromosome 1 that affects the expression of 380 genes. The promoters of these genes are enriched for the Evening Element promoter motif (hypergeometric test p < 10–7 found in 53 genes) that is found in the promoter regions of circadian-regulated genes (Harmer et al., 2000). In 31 of these 53 promoters, also the Ibox promoter motif is enriched (hypergeometric test p < 10−4) that is a conserved protein binding motif upstream of light-regulated genes (Giuliano et al., 1988). Of the 53 clock-regulated genes, 23 are responsive to low light (present in our low light-responsive gene list), including TIMING OF CAB EXPRESSION 1 (TOC1, At5g61380), and LUX ARRHYTHMO (LUX, At3g46640) that are both part of the central oscillator of the clock and active in the evening loop (Nakamichi, 2011). The expression of these genes is repressed by the MYB transcription factors CIRCADIAN CLOCK ASSOCIATED 1 (CCA1, At2g46830) and LATE ELONGATED HYPOCOTYL (LHY At1g01060) that bind to the evening element promoter motif (Wang and Tobin, 1998; Alabadi et al., 2001), but neither gene is located under the HTR. From the 3975 circadian-regulated genes published by Covington et al. (2008), 153 have an eQTL on the HTR, of which 49 are responsive to low light. This is a significant enrichment (hypergeometric tests p < 3*10−15 and p < 2*10−10 respectively) and suggests that a locus under the HTR is regulating part of the low light response by affecting the circadian clock. GIGANTEA (GI, At1g22770), a well known and important light-sensitive regulator of the circadian clock that is regulated at the post-translational level (Martin-Tryon et al., 2007), underlies the HTR and is differentially regulated. GI would therefore make a likely candidate regulator for the HTR-mediated low light responses associated with the circadian clock.
HTR-Regulated Genes Identified by Expression Profiling of a NIL
In order to further dissect the effect of the major regulatory locus on the low light transcriptional response, we determined the effect of the Cvi alleles in the HTR region on genome wide expression. To this end we used a NIL, LCN1-10 (Keurentjes et al., 2006), that has two small Cvi introgressions on chromosome 1 in the otherwise Ler background. The first introgression ranges from position ∼5–∼8.2 Mbp (∼950 genes) and the second introgression ranges from ∼26.5–∼30.4 Mbp (∼1150 genes). The major HTR maps to the first introgression, as well as a phenotypic QTL for the SAS. In addition, line LCN1-10 confirmed this phenotypic QTL, as it is slightly larger with a less compact rosette and more upright (hyponastic) leaves than Ler (Snoek and Peeters, personal communication). The effect of the Cvi introgressions in Ler on gene expression was determined by comparing transcript levels of LCN1-10 to Ler after a 3 h low light treatment. We identified 2282 differentially expressed genes (fdr < 0.05), of which 166 are physically located in the first introgression and 155 in the second. This means that the majority of differentially expressed genes (1961, ∼85%) is not physically located in the introgressions and thus must result from trans-regulation. eQTLs were found for 1072 (∼45%) of the 2282 LCN1-10/Ler differential genes, of which 21% mapped to one of the introgressions, 157 on the first and 120 genes on the second introgression (Figure 5).
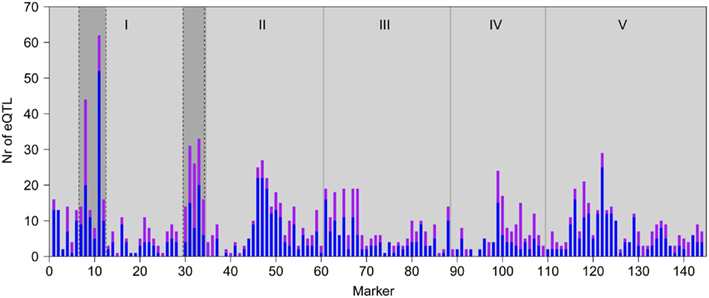
Figure 5. Genomic distributions of eQTLs of the genes with differentially abundant transcripts between LCN1-10 and Ler. Bars represent the number of local (in cis; purple) and distant (in trans; blue) eQTLs detected at each marker position. Gray vertical lines depict chromosomal borders, chromosomes (I-V) are indicated at the top. Cvi introgressions of LCN1-10 are indicated by the darker gray areas on chromosome I.
This is an enrichment compared to the 15% of eQTLs that map to the introgressions in the complete dataset (hypergeometric test p < 1*10−9). The eQTLs on the first introgression were mainly distant (90 eQTLs of 157; 57%), as would be expected from an HTR. In contrast, relatively more local eQTLs mapped to the second introgression (189 eQTLs of 272; 69%). The remainder of the differentially abundant transcripts with eQTLs did not map to one of the introgressions, which could be due to indirect regulatory effects.
Of the 2282 differentially abundant transcripts between LCN1-10 and Ler, a limited number of 660 genes (20%) have differentially abundant transcripts between Cvi and Ler as well. In this subset two genes only are regulated by the HTR and responsive to low light. At1g55960 encodes for a polyketide cyclase/dehydrase and lipid transport superfamily protein and is strongly co-expressed, in public microarray data, with the core circadian genes CIRCADIAN CLOCK ASSOCIATED 1 (CCA1, At2g46830) and LATE ELONGATED HYPOCOTYL (LHY, At1g01060), implying the involvement of this gene in regulation of the clock by the HTR. The second gene, PTO-INTERACTING 1-4 (PTI1-4, At2g47060), is a member of the PTI1-like serine/threonine protein kinases that interacts with MITOGEN-ACTIVATED PROTEIN KINASE 3 (MPK3, At3g45640) and MPK6 (At2g43790) and the ACG kinase OXIDATIVE SIGNAL-INDUCIBLE1 (OXI1/AGC2-1, At3g25250; Forzani et al., 2011). This OXI1-MAPK cascade is activated by lipids and ROS and necessary for oxidative burst-mediated signaling (Rentel et al., 2004; Anthony et al., 2006; Forzani et al., 2011). Analysis of the differential expression between Ler and NIL LCN1-10 allowed the extraction of candidate genes for the low light response that are robustly regulated by the HTR.
Joint Action or Common Regulation?
Several biological processes, revealed by the genetical genomics experiments described above, are affected by the identified plastically regulated genes and that are possibly linked to the SAS. These processes are auxin- and sterol homeostasis, the circadian clock and ROS signaling. Several HTR-located genes on chromosome 1 could each contribute to one of these processes and act in parallel (Figure 6A).
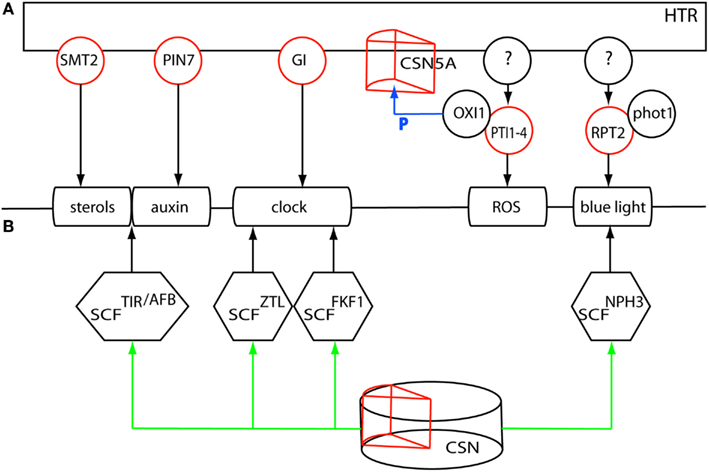
Figure 6. (A) Multiple regulatory loci underlying the HTR could affect the plastically regulated processes sterol- and auxin homeostasis, the clock, ROS and blue light perception. (B) A single master regulatory locus, the COP9 signalosome subunit 5A underlying the HTR could affect all processes through differential deneddylation of the corresponding CRL complexes. Red circles denote expression regulation of the gene by the HTR. P denotes phosphorylation of CSN5A by OXI1.
Auxin homeostasis could be differentially regulated by the locally regulated auxin efflux carrier PIN-FORMED 7 (PIN7, At1g23080). Polar auxin transport and -localization might, in addition, be affected by SMT2, a gene that is also involved in sterol homeostasis (Pan et al., 2009). The large impact on the circadian clock could be mediated by the post-translational effects of GI. These genes, however, do not account for the effect of the HTR on ROS signaling, nor on the differential regulation of ROOT PHOTOTROPISM 2 (RPT2, At2g30520), an interacting partner of the blue light photoreceptor phototropin 1 (phot1 At3g45780), which might be instrumental in the observed variation in low light perception between Ler and Cvi. The proposed regulatory genes could act in parallel with other factors underlying the HTR that affect ROS signaling and blue light sensing and that jointly compose the HTR-mediated transcriptional response to low light.
It is tempting to speculate on an alternative scenario in which a single master regulatory gene on chromosome 1 affects all these processes (Figure 6B). A candidate integrating factor in this scenario could be the differential action of the ubiquitin/26S proteasome pathway. Protein stability and endocytosis are instrumental in the regulation of the clock, auxin-, and light signaling (Maraschin et al., 2009; Pan et al., 2009; Nakamichi, 2011; Roberts et al., 2011). All Cullin-RING type E3 ubiquitin ligase (CRL) complexes are deneddylated by the COP9 signalosome (CSN) affecting the activity of these CRL complexes (Schwechheimer and Isono, 2010). Subunit 5, required for CSN function, is encoded by two genes CSN5A (AJH1 At1g22920) and CSN5B (AJH2 At1g71230), of which CSN5A is underlying the HTR, shows local regulation of gene expression and might therefore differentially affect the CRL activities in the regulation of the different processes involved in the SAS. Overall, the integration of gene expression and eQTL data has allowed the selection of candidate genes and working models that now need to be functionally analyzed.
Discussion
Plastic Regulation of Transcript Abundance in Arabidopsis Revealed Under Low Light
We analyzed the transcription levels in the RILs of the Ler/Cvi population following low light treatment, and mapped eQTLs for 32% of all measured transcripts. For a large fraction of the genes (17%) recombination of the parental genotypes resulted in transgressive expression patterns. Furthermore, exposure of the lines to low light conditions revealed additional variation in gene expression. The genes that are known to be regulated by low light (Millenaar et al., 2006) were enriched in differentially expressed genes between the parents, and in the eQTLs in GG2. The induced transcriptional responses associated with the SAS revealed the corresponding underlying natural variation in gene regulation. Also in yeast it was observed that the induction of gene expression by heat-shock treatment revealed new sources of genetic variation specifically for the regulation of essential genes (Eng et al., 2010). Our study is the first genetical genomics analysis in Arabidopsis that compares two very different experimental conditions. The dynamic response to low light treatment at the transcriptional level was compared to the “steady state” expression analysis in the same population in a previous study (Keurentjes et al., 2007). The majority of eQTLs identified in both experiments (91%) were specific to each of the experiments. Distant regulation was most affected in the different experiments, as was found in genetical genomics experiments on C. elegans and yeast (Li et al., 2006; Smith and Kruglyak, 2008). Only a moderate number of eQTLs (9%) that are predominantly locally regulated were mapped in both our Arabidopsis experiments, suggesting genotype-specific regulation. Local regulation was correlated to the distribution of SNP containing genes, which is also found in a genome wide association study in Arabidopsis (Zhang et al., 2011), where local regulation is enriched in cis-acting polymorphisms. Surprisingly, several eQTLs that mapped in both experiments show opposite additive effects, a striking example of plastic regulation. The opposite effect of eQTLs in different environments has also been observed in other organisms. In yeast grown on different nutrients this phenomenon affected mainly trans-eQTLs (Smith and Kruglyak, 2008). In a study where cis-eQTLs were analyzed in human samples obtained from different tissues eQTLs were identified with “opposing allelic direction,” prompting the authors to highlight the importance of using disease-related tissues to correctly characterize the effects of disease-associated variants (Fu et al., 2012). The plastic regulation of this type in the Ler/Cvi RIL population concerns genes that are known to be related to auxin- and sterol homeostasis, both involved in the response to low light (Keller et al., 2011; Keuskamp et al., 2011).
Dissecting the HTR-Mediated SAS
The dynamic nature of the distant eQTLs is best reflected in the presence of HTRs, which are quite distinct for each experiment. ERECTA on chromosome 2 regulated the expression of 176 genes in GG1. The main HTR in GG2, at the top of chromosome 1, regulated the expression of 380 genes, enriched in circadian and light-regulated genes. Involvement of the circadian clock in the SAS was previously shown by the identification of the evening-expressed gene EARLY FLOWERING 3 (ELF3 At2g25930) as the causal gene for a shade avoidance QTL in the Bay × Sha RIL population linking light input into the clock (Jimenez-Gomez et al., 2010). ELF3 was found to modulate the biological activity of GIGANTEA (GI, At1g22770) by direct binding to GI affecting its protein stability (Yu et al., 2008). Developmental growth is gated by the clock through the action of the growth promoting transcription factors PIF4 and PIF5. Where light negatively affects their protein abundance, the clock regulates their expression, reducing expression in the early night (Salter et al., 2003; Nozue et al., 2007). This balancing of transcription and protein levels by the combined action of light and the clock restricts growth to the late stages of the night. It is possible that the hyponastic growth response in the SAS is gated in a similar fashion by the clock.
We used the transcriptional response of the NIL LCN1-10 to study the effects of the Cvi alleles in the HTR in an otherwise isogenic genetic background. The differentially expressed genes between Ler and LCN1-10 are mainly regulated in trans, with an enrichment for genes with an eQTL on the Cvi introgressions. This confirms the eQTLs mapped for those genes. An important result from the expression analysis of LCN1-10 is the confirmation of the direct differential regulation by the HTR of two low light-responsive genes; At1g55960, encoding a polyketide cyclase/dehydrase that might be involved in regulation of the clock, as deduced from co-expression data, and PTI1-4involved in ROS signaling through the OXI1-MAPK cascade. Growth, as in tip-growing root hairs, is accompanied by ROS production and signaling (Sauer et al., 2001; Foreman et al., 2003; Carol and Dolan, 2006). Also in expanding cells and growth in response to changing light conditions ROS signaling may be expected (Carol and Dolan, 2006). The ACG kinase OXI1 was found to target not only CSN5A for phosphorylation (Howden et al., 2010), but also 3′phosphoinositide-dependent kinase-1 (PDK1) a conserved lipid-activated master kinase (Anthony et al., 2004; Zalejski and Bögre, 2010). OXI1 in turn is activated by PDK1 that in addition regulates a number of other AGC kinases. Among these kinases is PINOID (PIDAt2g34650) affecting PIN localization and polar auxin transport. ROS were shown to be generated by auxin (Joo et al., 2005) and interact with auxin in adaptation to environmental stress (Tognetti et al., 2012). Genes in the pathways of tryptophan-, auxin-, and glucosinolate biosynthesis and components in auxin signaling are differentially expressed between Ler and LCN1-10 and/or Cvi, although not many components are directly regulated by the HTR, only PIN7 and the auxin biosynthesis genes NIT1(At3g44310) and ATAMI1(At1g08980). This might be due to the indirect effects of the differential regulation of the OXI1-MAPK cascade on PID via PDK1. PID acts at the protein level on the PINs to target them to the membrane, whereas the resulting auxin gradient affects auxin signaling and tropic growth responses (Esmon et al., 2006). When auxin also affects ROS signaling, feeding back into the ROS-activated OXI1-MAPK cascade, this would constitute transcriptional means to dampen or enhance the response to environmental stress, in this case low light.
A Candidate Pleiotropic Master Regulator
Several processes have emerged from our analyses that suggest they are plastically regulated in response to low light. The HTR as master regulatory locus could affect these processes, through the effect of multiple polymorphic genes acting in parallel. Local regulation of gene expression points to candidate regulators for the effect of the HTR on the plastically regulated auxin- and sterol homeostasis (PIN7 andSMT2) and for the differential regulation of the biological clock (GI). It is very well possible that a suite of nearby positioned cis-regulatory eQTLs act in concert in response to the low light treatment. In mouse, Fraser et al. (2011) have shown that adaptation of gene expression is widespread and that this adaptation can involve selection on multiple functionally related cis-regulated genes.
A common feature of the different processes is the ubiquitin/26S proteasome pathway linked to protein endocytosis or degradation. Ubiquitination is however executed by different types of E3 ubiquitin ligase complexes, composed of different RING-finger Cullins (CUL1, CUL2, CUL3a/b, or CUL4) bound to a wide range of substrate specifying components like the F-box proteins in the SCF complexes or the BTB/POZ proteins bound to the CUL3 scaffold proteins. All these complexes themselves, however, are also prone to degradation. Addition of RUB (RELATED TO UBIQUITIN or NEDD8), an ubiquitin homolog, activates the complex (Schwechheimer and Isono, 2010), whereas removal of RUB (deneddylation) could stabilize the complex (Stuttmann et al., 2009). Deneddylation is executed by the CSN5 subunit of the COP9 signalosome (CSN) and is required for a number of pathways, including light and phytohormone signaling (Moon et al., 2007; Schwechheimer and Isono, 2010). CSN5A, part of the COP9 subunit 5 and underlying the HTR, was not analyzed in GG2, but in GG1 the gene shows local regulation of expression. Mutant phenotypes of this gene have the constitutively photomorphogenic/de-etiolated/fusca (cop/det/fus) mutant phenotype (Dohmann et al., 2005) of light-grown seedlings when grown in the dark. In an analysis of targets of OXI1 CSN5A was found to be phosphorylated (Howden et al., 2010). It could very well be that the differential expression and activity of this gene between Ler and Cvi could account for the diverse processes differentially affected by the HTR in response to low light.
Examples in the literature of COP9-regulated proteins that emerged in our study include photoreceptors and auxin-related proteins. The blue light photoreceptor PHOT1 is endocytosed or degraded dependent on ubiquitination status (Roberts et al., 2011). PHOT1 is the primary receptor under low light intensities and interacts with NON-PHOTOTROPHIC HYPOCOTYL 3 (NPH3 At5g64330) and RPT2 both containing BTB/POZ protein-protein interaction domains (Sakai et al., 2000). RPT2 expression is light induced (Sakai et al., 2000) and regulated by the HTR. In both LCN1-10 and Cvi the differential expression of RPT2 could reflect a differential effect in low light perception compared to Ler.
GI affects protein stability by light-mediated interaction with members of the ZTL family of photoreceptors comprising ZTL (At5g57360), FLAVIN-BINDING, KELCH REPEAT, F-BOX 1 (FKF1 At1g68050), and LOV KELCH PROTEIN 2 (LKP2 At2g18915; Demarsy and Fankhauser, 2009). This interaction stabilizes ZTL and prevents the Skp-Cullin-F-box (SCF) SCFZTL mediated degradation of TOC1. The binding of GI to FKF1 however, enables the degradation of CYCLING DOF FACTOR 1 (CDF1 At5g62430), releasing CONSTANS (CO At5g15840) from its repression. CDF1 and FKF1 are both differentially regulated by the HTR, just like CONSTANS-LIKE 1 (COL1 At5g15850) and COL2 (At3g02380).
SMT2 could affect correct sterol composition, required for the auxin-regulated endocytocis and membrane localization of the PIN auxin transporters (Pan et al., 2009), which might also involve PIN7. Especially as the pin7 mutant shows an impaired low light response (Keuskamp et al., 2011). Also the regulation of the transcriptional response to auxin requires SCFTIR-mediated degradation of the AUX/IAAs in relieving the ARF transcription factors from their repression.
Further analysis should shed more light on the proposed candidate regulator in the HTR- mediated response to low light. At the moment it is not known if ROS signaling is also influenced by for instance differential degradation or endocytosis of PTI1-4. The differential expression of PTI1-4 does suggest regulation at the level of protein stability, like the transcript levels of RPT2, GI, FKF1, and CDF1 are affected. Also the role of sterol homeostasis mediated by SMT2 could be working in parallel to the effects of the signalosome on protein trafficking, or be an integral, downstream component. A single pleiotropic regulator does fit nicely the observed phenotypic buffering described by Fu et al. (2009). They observed that not all QTLs responsible for variation in transcript levels affect phenotypic traits. Instead they identified six major HTRs in their analysis of more than 40000 molecular traits (transcript-, metabolite-, and protein levels) and 139 phenotypes in the same Ler/Cvi population, whose effect is not only observed at the molecular but also at the phenotypic level, as opposed to many eQTLs that do not affect phenotypes in a robust system (Bergman and Siegal, 2003). They do show, however, eQTLs and protein level QTLs co-locating at the position of the HTR identified in GG2.
In conclusion, we find that natural variation in gene expression regulation is not only strongly influenced by new combinations of Ler and Cvi alleles (giving transgression) but also to a large extent by the experimental conditions (environment and developmental stage). In particular the distantly or trans-regulated genes show most interaction with the environment. Although the small numbers of constitutive eQTLs are predominantly locally regulated, their effect does not solely depend on genotype, but can be plastically regulated as well. Based on the plastic regulation in response to low light we were able to dissect the major effect of the HTR on transcription and we propose CSN5A as a candidate regulatory factor to underlie this locus and to differentially affect transcript- and possibly also protein levels in response to low light.
Materials and Methods
Plant Growth
To identify natural variation in transcript abundance, 120 RILs of the LerxCvi population (Alonso-Blanco et al., 1998) were grown in one batch, divided over 10 trays containing three plants of 14 individual genotypes, parents included. In this way we obtained three plants per RIL and nine per parent. Plants were grown under short days (9 h light, 15 dark), a light intensity of 200 μmol m−2 s−1 and watered three times per week.
Shade Treatment and Harvest of Material
All RILs and parents were treated with 3 h of neutral shade (ca 10% of growth conditions) 21 days after transfer to soil (24 days after germination). The three most responsive leaves (petiole and lamina) per plant were harvested and pooled per genotype for RNA isolation and transcription profiling.
Microarray Analysis
All procedures were described in de Jong et al. (2006). In short, RNA was extracted and purified using the RNeasy kit (Qiagen, Valencia, USA). Amplification and labeling was performed with the Message Amp aRNA kit (Ambion, Austin, USA). Amplified RNA was used to generate labeled cDNA with incorporation of 5-(3-aminoallyl)-dUTP and labeled with either Cy3 or Cy5 mono-reactive dye (Amersham, Piscataway, USA). All cDNA products were purified using the QIAquick PCR purification Kit (Qiagen, Valencia, USA). The CATMA (Allemeersch et al., 2005) Arabidopsis DNA microarrays were provided by Utrecht University (the Netherlands) and were produced from a set of 150-450-mers representing 20833 unique genes. Arrays were scanned using ScanArray Express HT (PerkinElmer, Wellesley, USA) and quantified with Imagene 6.0 (BioDiscovery, El Segundo, USA).
The Limma package (Smyth and Speed, 2003) for the statistical work environment R was used for normalization. All array data are submitted to Array Express accession number E-MTAB-1357.
Statistical Analysis
To determine differential abundance of transcripts between the two parents, we applied a linear model using the Limma package for the statistical work environment R (Smyth, 2004, 2005). For each gene the p-value and the corresponding q values (Storey and Tibshirani, 2003) were computed.
The procedures developed in GG1 were used to calculate the broad sense heritability (H2) in the parents and RILs. Transgressive segregation was determined in terms of the standard deviation of the individual parents (Brem and Kruglyak, 2005). We calculated the number of RILs (n = 20), whose expression level lay above μmax + 2*SDmax or below μmin − 2*SDmin; where μ and SD are the mean and the standard deviation of the parental phenotypic values, respectively, and max indicates the parent with the highest value and min indicates the parent with the lowest value.
Multiple QTL Analysis
eQTLs were mapped using the procedures based on MQM mapping, as developed in GG1. A genome wide p-value threshold of 2.23 × 10⁻³ at α = 0.05 for a single trait was estimated by a 10,000 permutation test (Churchill and Doerge, 1994). But for a study with 24,065 gene transcripts, we controlled the false discovery rate (FDR) based on the pool of p-values for all markers and all transcripts. Because the p-values are correlated when markers are linked, the FDR increases depending on the number of markers on a chromosome (Benjamini and Yekutieli, 2005). In our experiment the maximum number of markers reached 35 (chromosome 5) and a simulation analysis (not shown) using Storey’s algorithm to control the FDR (Storey, 2002) at a desired level indeed showed a 4.4-fold increase of the actual FDR. To account for this we corrected the FDR by a factor 5 and calculated the genome wide p-value threshold at Storey’s FDR of 0.01 for all gene-marker p-values to make sure that the real FDR rate is below 0.05 (corrected FDR = 0.05). The estimated p-value threshold then corresponded to 5.29 × 10⁻⁵. As neighboring markers stand for partially/largely similar tests, we decided to leave them out, resulting in significance thresholds of −log(P) = 3.83 in GG1 and 3.62 in GG2. These threshold levels were used as significance thresholds for the detection of eQTLs.
Correlation of SNP Frequency, Gene Density, and eQTL Distribution
The SNP set published in (Nordborg et al., 2005) was used. The SNP frequency and gene density were determined for each marker by counting the number of SNPs or genes between the flanking markers of the marker under study (marker locus). Indels were treated as a single polymorphism and the number of SNPs was corrected for the number of sampled sequences per marker locus. The number of eQTL at the marker locus, were determined by the number of eQTL above the established genome wide threshold. The Pearson correlation between numbers of SNPs and eQTLs was calculated and significance of correlation was determined using a t-test.
Additional Databases and Tools Used
We used the Athena tool (O’Connor et al., 2005) to extract enriched transcription factor binding sites in the genes regulated by the HTR.
Overrepresentation of Gene Ontology categories was analyzed with the R package GOstats (Falcon and Gentleman, 2007).
Hypergeometric tests were applied to assess significance of overrepresentation either incorporated in the Athena tool or from the GOstats or Hypergeometric R package.
Co-expression data, based on publicly available microarray data, was obtained from the Arabidopsis thaliana trans-factor and cis-element prediction database ATTED-II (Obayashi et al., 2007).
Conflict of Interest Statement
The authors declare that the research was conducted in the absence of any commercial or financial relationships that could be construed as a potential conflict of interest.
Acknowledgments
This work was supported by The Netherlands Organization for Scientific Research (Program Genomics grant no. 050–10–029) and the Centre for Biosystems Genomics (Netherlands Genomics Initiative, to Guido Van den Ackerveken).
References
Alabadi, D., Oyama, T., Yanovsky, M. J., Harmon, F. G., Mas, P., and Kay, S. A. (2001). Reciprocal regulation between TOC1 and LHY/CCA1 within the Arabidopsis circadian clock. Science 293, 880–883.
Allemeersch, J., Durinck, S., Vanderhaeghen, R., Alard, P., Maes, R., Seeuws, K., et al. (2005). Benchmarking the CATMA microarray. A novel tool for Arabidopsis transcriptome analysis. Plant Physiol. 137, 588–601.
Alonso-Blanco, C., Peeters, A. J. M., Koornneef, M., Lister, C., Dean, C., van den Bosch, N., et al. (1998). Development of an AFLP based linkage map of Ler, Col and Cvi Arabidopsis thaliana ecotypes and construction of a Ler/Cvi recombinant inbred line population. Plant J. 14, 259–271.
Anthony, R. G., Henriques, R., Helfer, A., Meszaros, T., Rios, G., Testerink, C., et al. (2004). A protein kinase target of a PDK1 signalling pathway is involved in root hair growth in Arabidopsis. EMBO J. 23, 572–581.
Anthony, R. G., Khan, S., Costa, J., Pais, M. S., and Bögre, L. (2006). The Arabidopsis protein kinase PTI1-2 is activated by convergent phosphatidic acid and oxidative stress signaling pathways downstream of PDK1 and OXI1. J. Biol. Chem. 281, 37536–37546.
Ballaré, C. L. (1999). Keeping up with the neighbours: phytochrome sensing and other signalling mechanisms. Trends Plant Sci. 4, 97–102.
Bender, J., and Celenza, J. (2009). Indolic glucosinolates at the crossroads of tryptophan metabolism. Phytochem. Rev. 8, 25–37.
Benjamini, Y., and Yekutieli, D. (2005). Quantitative trait loci analysis using the false discovery rate. Genetics 171, 783–790.
Bergman, A., and Siegal, M. L. (2003). Evolutionary capacitance as a general feature of complex gene networks. Nature 424, 549–552.
Bing, N., and Hoeschele, I. (2005). Genetical genomics analysis of a yeast segregant population for transcription network inference. Genetics 170, 533–542.
Brem, R. B., and Kruglyak, L. (2005). The landscape of genetic complexity across 5,700 gene expression traits in yeast. Proc. Natl. Acad. Sci. U.S.A. 102, 1572–1577.
Brem, R. B., Yvert, G., Clinton, R., and Kruglyak, L. (2002). Genetic dissection of transcriptional regulation in budding yeast. Science 296, 752–755.
Bystrykh, L., Weersing, E., Dontje, B., Sutton, S., Pletcher, M. T., Wiltshire, T., et al. (2005). Uncovering regulatory pathways that affect hematopoietic stem cell function using “genetical genomics.” Nat. Genet. 37, 225–232.
Carol, R. J., and Dolan, L. (2006). The role of reactive oxygen species in cell growth: lessons from root hairs. J. Exp. Bot. 57, 1829–1834.
Chung, H. Y., Fujioka, S., Choe, S., Lee, S., Lee, Y. H., Baek, N. I., et al. (2010). Simultaneous suppression of three genes related to brassinosteroid (BR) biosynthesis altered campesterol and BR contents, and led to a dwarf phenotype in Arabidopsis thaliana. Plant Cell Rep. 29, 397–402.
Churchill, G. A., and Doerge, R. W. (1994). Empirical threshold values for quantitative trait mapping. Genetics 138, 963–971.
Covington, M. F., Maloof, J. N., Straume, M., Kay, S. A., and Harmer, S. L. (2008). Global transcriptome analysis reveals circadian regulation of key pathways in plant growth and development. Genome Biol. 9, R130.
de Jong, M., van Breukelen, B., Wittink, F. R., Menke, F. L., Weisbeek, P. J., and Van den Ackerveken, G. (2006). Membrane-associated transcripts in Arabidopsis; their isolation and characterization by DNA microarray analysis and bioinformatics. Plant J. 46, 708–721.
Demarsy, E., and Fankhauser, C. (2009). Higher plants use LOV to perceive blue light. Curr. Opin. Plant Biol. 12, 69–74.
Devlin, P. F., Yanovsky, M. J., and Kay, S. A. (2003). A genomic analysis of the shade avoidance response in Arabidopsis. Plant Physiol. 133, 1617–1629.
Dohmann, E. M., Kuhnle, C., and Schwechheimer, C. (2005). Loss of the CONSTITUTIVE PHOTOMORPHOGENIC9 signalosome subunit 5 is sufficient to cause the cop/det/fus mutant phenotype in Arabidopsis. Plant Cell 17, 1967–1978.
Eng, K. H., Kvitek, D. J., Keles, S., and Gasch, A. P. (2010). Transient genotype-by-environment interactions following environmental shock provide a source of expression variation for essential genes. Genetics 184, 587–593.
Esmon, C. A., Tinsley, A. G., Ljung, K., Sandberg, G., Hearne, L. B., and Liscum, E. (2006). A gradient of auxin and auxin-dependent transcription precedes tropic growth responses. Proc. Natl. Acad. Sci. U.S.A. 103, 236–241.
Falcon, S., and Gentleman, R. (2007). Using GOstats to test gene lists for GO term association. Bioinformatics 23, 257–258.
Foreman, J., Demidchik, V., Bothwell, J. H., Mylona, P., Miedema, H., Torres, M. A., et al. (2003). Reactive oxygen species produced by NADPH oxidase regulate plant cell growth. Nature 422, 442–446.
Forzani, C., Carreri, A., de la Fuente van Bentem, S., Lecourieux, D., Lecourieux, F., and Hirt, H. (2011). The Arabidopsis protein kinase Pto-interacting 1-4 is a common target of the oxidative signal-inducible 1 and mitogen-activated protein kinases. FEBS J. 278, 1126–1136.
Fraser, H. B., Babak, T., Tsang, J., Zhou, Y., Zhang, B., Mehrabian, M., et al. (2011). Systematic detection of polygenic cis-regulatory evolution. PLoS Genet. 7:e1002023. doi:10.1371/journal.pgen.1002023
Fu, J., and Jansen, R. C. (2006). Optimal design and analysis of genetic studies on gene expression. Genetics 172, 1993–1999.
Fu, J., Keurentjes, J. J. B., Bouwmeester, H., America, T., Verstappen, F. W. A., Ward, J. L., et al. (2009). System-wide molecular evidence for phenotypic buffering in Arabidopsis. Nat. Genet. 41, 166–167.
Fu, J., Wolfs, M. G., Deelen, P., Westra, H. J., Fehrmann, R. S., Te Meerman, G. J., et al. (2012). Unraveling the regulatory mechanisms underlying tissue-dependent genetic variation of gene expression. PLoS Genet. 8:e1002431. doi:10.1371/journal.pgen.1002431
Giuliano, G., Pichersky, E., Malik, V. S., Timko, M. P., Scolnik, P. A., and Cashmore, A. R. (1988). An evolutionarily conserved protein binding sequence upstream of a plant light-regulated gene. Proc. Natl. Acad. Sci. U.S.A. 85, 7089–7093.
Harmer, S. L., Hogenesch, J. B., Straume, M., Chang, H. S., Han, B., Zhu, T., et al. (2000). Orchestrated transcription of key pathways in Arabidopsis by the circadian clock. Science 290, 2110–2113.
Howden, A. J., Salek, M., Miguet, L., Pullen, M., Thomas, B., Knight, M. R., et al. (2010). The phosphoproteome of Arabidopsis plants lacking the oxidative signal-inducible1 (OXI1) protein kinase. New Phytol. 190, 49–56.
Jansen, R. C., and Nap, J. P. (2001). Genetical genomics: the added value from segregation. Trends Genet. 17, 388–391.
Jimenez-Gomez, J. M., Wallace, A. D., and Maloof, J. N. (2010). Network analysis identifies ELF3 as a QTL for the shade avoidance response in Arabidopsis. PLoS Genet. 6:e1001100. doi:10.1371/journal.pgen.1001100
Joo, J. H., Yoo, H. J., Hwang, I., Lee, J. S., Nam, K. H., and Bae, Y. S. (2005). Auxin-induced reactive oxygen species production requires the activation of phosphatidylinositol 3-kinase. FEBS Lett. 579, 1243–1248.
Keller, M. M., Jaillais, Y., Pedmale, U. V., Moreno, J. E., Chory, J., and Ballaré, C. L. (2011). Cryptochrome 1 and phytochrome B control shade-avoidance responses in Arabidopsis via partially independent hormonal cascades. Plant J. 67, 195–207.
Keurentjes, J. J., Bentsink, L., Alonso-Blanco, C., Hanhart, C. J., Blankestijn-De, V. H., Effgen, S., et al. (2006). Development of a near isogenic line population of Arabidopsis thaliana and comparison of mapping power with a recombinant inbred line population. Genetics 175, 891–905.
Keurentjes, J. J., Fu, J., Terpstra, I. R., Garcia, J. M., Van den Ackerveken, G., Snoek, L. B., et al. (2007). Regulatory network construction in Arabidopsis by using genome-wide gene expression quantitative trait loci. Proc. Natl. Acad. Sci. U.S.A. 104, 1708–1713.
Keuskamp, D. H., Sasidharan, R., Vos, I., Peeters, A. J. M., Voesenek, L. A. C. J., and Pierik, R. (2011). Blue-light-mediated shade avoidance requires combined auxin and brassinosteroid action in Arabidopsis seedlings. Plant J. 67, 208–217.
Kozuka, T., Kobayashi, J., Horiguchi, G., Demura, T., Sakakibara, H., Tsukaya, H., et al. (2010). Involvement of auxin and brassinosteroid in the regulation of petiole elongation under the shade. Plant Physiol. 153, 1608–1618.
Landry, C. R., Oh, J., Hartl, D. L., and Cavalieri, D. (2006). Genome-wide scan reveals that genetic variation for transcriptional plasticity in yeast is biased towards multi-copy and dispensable genes. Gene 366, 343–351.
Li, Y., Alvarez, O. A., Gutteling, E. W., Tijsterman, M., Fu, J., Riksen, J. A., et al. (2006). Mapping determinants of gene expression plasticity by genetical genomics in C. elegans. PLoS. Genet. 2:e222. doi:10.1371/journal.pgen.0020222
Li, Y., Breitling, R., Snoek, L. B., van der Velde, K. J., Swertz, M. A., Riksen, J. A., et al. (2010). Global genetic robustness of the alternative splicing machinery in Caenorhabditis elegans. Genetics 186, 405–410.
Maraschin, F. S., Memelink, J., and Offringa, R. (2009). Auxin-induced, SCF(TIR1)-mediated poly-ubiquitination marks AUX/IAA proteins for degradation. Plant J. 59, 100–109.
Martin-Tryon, E. L., Kreps, J. A., and Harmer, S. L. (2007). GIGANTEA acts in blue light signaling and has biochemically separable roles in circadian clock and flowering time regulation. Plant Physiol. 143, 473–486.
Millenaar, F. F., Cox, M. C., van Berkel, Y. E., Welschen, R. A., Pierik, R., Voesenek, L. A. C. J., et al. (2005). Ethylene-induced differential growth of petioles in Arabidopsis. Analyzing natural variation, response kinetics, and regulation. Plant Physiol. 137, 998–1008.
Millenaar, F. F., Okyere, J., May, S. T., Van Zanten, M., Voesenek, L. A. C. J., and Peeters, A. J. M. (2006). How to decide? Different methods of calculating gene expression from short oligonucleotide array data will give different results. BMC Bioinformatics 7:137. doi:10.1186/1471-2105-7-137
Millenaar, F. F., Van Zanten, M., Cox, M. C., Pierik, R., Voesenek, L. A. C. J., and Peeters, A. J. M. (2009). Differential petiole growth in Arabidopsis thaliana: photocontrol and hormonal regulation. New Phytol. 184, 141–152.
Moon, J., Zhao, Y., Dai, X., Zhang, W., Gray, W. M., Huq, E., et al. (2007). A new CULLIN 1 mutant has altered responses to hormones and light in Arabidopsis. Plant Physiol. 143, 684–696.
Nakamichi, N. (2011). Molecular mechanisms underlying the Arabidopsis circadian clock. Plant Cell Physiol. 52, 1709–1718.
Nicotra, A. B., Atkin, O. K., Bonser, S. P., Davidson, A. M., Finnegan, E. J., Mathesius, U., et al. (2010). Plant phenotypic plasticity in a changing climate. Trends Plant Sci. 15, 684–692.
Nordborg, M., Hu, T. T., Ishino, Y., Jhaveri, J., Toomajian, C., Zheng, H., et al. (2005). The pattern of polymorphism in Arabidopsis thaliana. PLoS Biol. 3:e196. doi:10.1371/journal.pbio.0030196
Nozue, K., Covington, M. F., Duek, P. D., Lorrain, S., Fankhauser, C., Harmer, S. L., et al. (2007). Rhythmic growth explained by coincidence between internal and external cues. Nature 448, 358–361.
Obayashi, T., Kinoshita, K., Nakai, K., Shibaoka, M., Hayashi, S., Saeki, M., et al. (2007). ATTED-II: a database of co-expressed genes and cis elements for identifying co-regulated gene groups in Arabidopsis. Nucleic Acids Res. 35, D863–D869.
O’Connor, T. R., Dyreson, C., and Wyrick, J. J. (2005). Athena: a resource for rapid visualization and systematic analysis of Arabidopsis promoter sequences. Bioinformatics 21, 4411–4413.
Pan, J., Fujioka, S., Peng, J., Chen, J., Li, G., and Chen, R. (2009). The E3 ubiquitin ligase SCFTIR1/AFB and membrane sterols play key roles in auxin regulation of endocytosis, recycling, and plasma membrane accumulation of the auxin efflux transporter PIN2 in Arabidopsis thaliana. Plant Cell 21, 568–580.
Pierik, R., Djakovic-Petrovic, T., Keuskamp, D. H., de Wit, M., and Voesenek, L. A. C. J. (2009). Auxin and ethylene regulate elongation responses to neighbor proximity signals independent of gibberellin and della proteins in Arabidopsis. Plant Physiol. 149, 1701–1712.
Rentel, M. C., Lecourieux, D., Ouaked, F., Usher, S. L., Petersen, L., Okamoto, H., et al. (2004). OXI1 kinase is necessary for oxidative burst-mediated signalling in Arabidopsis. Nature 427, 858–861.
Roberts, D., Pedmale, U. V., Morrow, J., Sachdev, S., Lechner, E., Tang, X., et al. (2011). Modulation of phototropic responsiveness in Arabidopsis through ubiquitination of phototropin 1 by the CUL3-Ring E3 ubiquitin ligase CRL3(NPH3). Plant Cell 23, 3627–3640.
Sakai, T., Wada, T., Ishiguro, S., and Okada, K. (2000). RPT2. A signal transducer of the phototropic response in Arabidopsis. Plant Cell 12, 225–236.
Salter, M. G., Franklin, K. A., and Whitelam, G. C. (2003). Gating of the rapid shade-avoidance response by the circadian clock in plants. Nature 426, 680–683.
Sauer, H., Wartenberg, M., and Hescheler, J. (2001). Reactive oxygen species as intracellular messengers during cell growth and differentiation. Cell. Physiol. Biochem. 11, 173–186.
Schadt, E. E., Monks, S. A., Drake, T. A., Lusis, A. J., Che, N., Colinayo, V., et al. (2003). Genetics of gene expression surveyed in maize, mouse and man. Nature 422, 297–302.
Schwechheimer, C., and Isono, E. (2010). The COP9 signalosome and its role in plant development. Eur. J. Cell Biol. 89, 157–162.
Sessa, G., Carabelli, M., Sassi, M., Ciolfi, A., Possenti, M., Mittempergher, F., et al. (2005). A dynamic balance between gene activation and repression regulates the shade avoidance response in Arabidopsis. Genes Dev. 19, 2811–2815.
Smith, E. N., and Kruglyak, L. (2008). Gene-environment interaction in yeast gene expression. PLoS Biol. 6:e83. doi:10.1371/journal.pbio.0060083
Smyth, G. K. (2004). Linear models and empirical bayes methods for assessing differential expression in microarray experiments. Stat. Appl. Genet. Mol. Biol. 3, Article3.
Smyth, G. K. (2005). “Limma: linear models for microarray data,” in Bioinformatics and Computational Biology Solutions Using R and Bioconductor, eds R. Gentleman, V. Carey, S. Dudoit, R. Irizarry, and W. Huber, (New York: Springer), 397–420.
Snoek, L. B., Van der Velde, K. J., Arends, D., Li, Y., Beyer, A., Elvin, M., et al. (2012). WormQTL – public archive and analysis web portal for natural variation data in Caenorhabditis spp. Nucleic Acids Res. doi:10.1093/nar/gks1124
Storey, J. D. (2002). A direct approach to false discovery rates. J. R. Stat. Soc. Series B Stat. Methodol. 64, 479–498.
Storey, J. D., and Tibshirani, R. (2003). Statistical significance for genomewide studies. Proc. Natl. Acad. Sci. U.S.A. 100, 9440–9445.
Stuttmann, J., Lechner, E., Guerois, R., Parker, J. E., Nussaume, L., Genschik, P., et al. (2009). COP9 signalosome- and 26S proteasome-dependent regulation of SCFTIR1 accumulation in Arabidopsis. J. Biol. Chem. 284, 7920–7930.
Takemiya, A., Inoue, S., Doi, M., Kinoshita, T., and Shimazaki, K. (2005). Phototropins promote plant growth in response to blue light in low light environments. Plant Cell 17, 1120–1127.
Terpstra, I. R., Snoek, L. B., Keurentjes, J. J., Peeters, A. J. M., and Van den Ackerveken, G. (2010). Regulatory network identification by genetical genomics: signaling downstream of the Arabidopsis receptor-like kinase ERECTA. Plant Physiol. 154, 1067–1078.
Tognetti, V. B., Mühlenbock, P., and Van Breusegem, F. (2012). Stress homeostasis – the redox and auxin perspective. Plant Cell Environ. 35, 321–333.
Van Zanten, M., Pons, T., Janssen, J. A. M., Voesenek, L. A. C. J., and Peeters, A. J. M. (2010). On the relevance and control of leaf angle. Crit. Rev. Plant Sci. 29, 300–316.
Van Zanten, M., Snoek, L. B., Proveniers, M. C. G., and Peeters, A. J. M. (2009). The many functions of ERECTA. Trends Plant Sci. 14, 214–218.
Viñuela, A., Snoek, L. B., Riksen, J. A., and Kammenga, J. E. (2010). Genome-wide gene expression regulation as a function of genotype and age in C. elegans. Genome Res. 20, 929–937.
Viñuela, A., Snoek, L. B., Riksen, J. A., and Kammenga, J. E. (2012). Aging uncouples heritability and expression-QTL in Caenorhabditis elegans. G3. 2, 597–605.
Wang, Z. Y., and Tobin, E. M. (1998). Constitutive expression of the CIRCADIAN CLOCK ASSOCIATED 1 (CCA1) gene disrupts circadian rhythms and suppresses its own expression. Cell 93, 1207–1217.
West, M. A., Kim, K., Kliebenstein, D. J., van Leeuwen, H., Michelmore, R. W., Doerge, R. W., et al. (2007). Global eQTL Mapping reveals the complex genetic architecture of transcript level variation in Arabidopsis. Genetics 175, 1441–1450.
Yu, J. W., Rubio, V., Lee, N. Y., Bai, S., Lee, S. Y., Kim, S. S., et al. (2008). COP1 and ELF3 control circadian function and photoperiodic flowering by regulating GI stability. Mol. Cell 32, 617–630.
Zalejski, C., and Bögre, L. (2010). “3-Phosphoinositide-dependent protein kinase is a switchboard from signaling lipids to protein phosphorylation pascades,” in Lipid Signaling in Plants, Plant Cell Monographs 16, ed. T. Munnik (Heidelberg: Springer-Verlag), 243–259.
Keywords: genetical genomics, genotype-by-environment interaction, Arabidopsis thaliana, shade avoidance, expression-QTLs, recombinant inbred lines
Citation: Snoek LB, Terpstra IR, Dekter R, Van den Ackerveken G and Peeters AJM (2013) Genetical genomics reveals large scale genotype-by-environment interactions in Arabidopsis thaliana. Front. Gene. 3:317. doi: 10.3389/fgene.2012.00317
Received: 30 August 2012; Accepted: 20 December 2012;
Published online: 10 January 2013.
Edited by:
Kenneth S. Kompass, University of California, San Francisco, USACopyright: © 2013 Snoek, Terpstra, Dekter, Van den Ackerveken and Peeters. This is an open-access article distributed under the terms of the Creative Commons Attribution License, which permits use, distribution and reproduction in other forums, provided the original authors and source are credited and subject to any copyright notices concerning any third-party graphics etc.
*Correspondence: Anton J. M. Peeters, Department of Biology, Institute of Education, Utrecht University, Padualaan 8, Utrecht 3584CH, Netherlands. e-mail:YS5qLm0ucGVldGVyc0B1dS5ubA==
†Current address: L. Basten Snoek, Laboratory of Nematology, Wageningen University and Research Center, Wageningen, Netherlands; Inez R. Terpstra, Laboratory of Molecular Plant Physiology, Department of Biology, Institute of Environmental Biology, Utrecht University, Utrecht, Netherlands; Anton J. M. Peeters, Department of Biology, Institute of Education, Utrecht University, Utrecht, Netherlands.
‡L. Basten Snoek and Inez R. Terpstra have contributed equally to this work.