 Travis R. Porter1
 Xuelin Li2Charles B. Stephensen3
 Kathleen Mulligan4
 Brandy Rutledge5
 Patricia M. Flynn6
 Jorge Lujan-Zilbermann7Rohan Hazra8Craig M. Wilson1
 Peter L. Havens9,10
 Jianming Tang1,2* and for the Adolescent Medicine Trials Network for HIV/AIDS Interventions (ATN) 063 study team
- 1Department of Epidemiology, University of Alabama at Birmingham, Birmingham, AL, USA
- 2Department of Medicine, University of Alabama at Birmingham, Birmingham, AL, USA
- 3Western Human Nutrition Research Center, U.S. Department of Agriculture-Agricultural Research Service, Davis, CA, USA
- 4Division of Endocrinology, University of California at San Francisco, San Francisco, CA, USA
- 5Westat, Rockville, MD, USA
- 6Department of Infectious Diseases, St. Jude Children’s Research Hospital, Memphis, TN, USA
- 7Division of Pediatric Infectious Diseases, University of South Florida College of Medicine, Tampa, FL, USA
- 8Eunice Kennedy Shriver National Institute of Child Health and Human Development, Bethesda, MD, USA
- 9Children’s Research Institute, Medical College of Wisconsin, Milwaukee, WI, USA
- 10Children’s Hospital of Wisconsin, Medical College of Wisconsin, Milwaukee, WI, USA
Serum 25-hydroxyvitamin D [25(OH)D] is often deficient (<12 ng/ml) or insufficient (<20 ng/ml) in youth living with human immunodeficiency virus type 1 infection (YLH). Based on evidence from multiple genome-wide association studies, we hypothesized that genetic factors associated with 25(OH)D deficiency should be readily detectable in YLH even when controlling for other known factors, including use of the antiretroviral drug efavirenz (EFV). Genotyping by bi-directional sequencing targeted 15 single nucleotide polymorphisms (SNPs) at the GC/DBP locus, with a focus on coding and regulatory variants, as well as those repeatedly reported in the literature. Three intronic SNPs (rs222016, rs222020, and rs222029) in a conserved haplotype block had unequivocal association signals (false discovery rate ≤ 0.006). In particular, the minor allele G for rs222020 was highly unfavorable among 192 YLH (99 African–Americans and 93 others), as gauged by relatively low likelihood for 25(OH)D sufficiency at enrollment (odds ratio = 0.31, p = 9.0 × 10⁻⁴). In a reduced multivariable model, race, season, latitude, body mass index, exposure to EFV, and rs222020-G were independent factors that collectively accounted for 38% of variance in the log10-transformed 25(OH)D concentration (p < 0.0001). Interaction terms were evident for rs222020-G × season (p < 0.001), latitude × season (especially fall and winter; p < 0.01), and race × EFV use (p = 0.024). Overall, variance in serum 25(OH)D is substantially attributable to multiple factors, but the exact contribution of genetic and non-genetic factors can be obscured by partial overlaps and frequent interactions.
Introduction
The vitamin D pathway has a wide range of pathophysiological implications, with documented roles in bone metabolism, renal function, cardiovascular disease, and immune responses (Chocano-Bedoya and Ronnenberg, 2009; Ramagopalan et al., 2009; Razzaque, 2009). In the U.S. general population, suboptimal serum 25-hydroxyvitamin D [25(OH)D] concentration (<20 ng/ml)] is highly prevalent (Looker et al., 2008; Ginde et al., 2009). Factors associated with serum 25(OH)D status include race (skin color), seasonal (environmental) fluctuation, behavior, and genetic pre-disposition (Zwart et al., 2007; Bouillon, 2010; Bu et al., 2010; Karohl et al., 2010; Rosen, 2011; Schlingmann et al., 2011; Vimaleswaran et al., 2013).
Suboptimal serum 25(OH)D is seen in 54% of youth living with human immunodeficiency virus type 1 (HIV) infection (YLH; Havens et al., 2012a, b). The problem with 25(OH)D insufficiency (<20 ng/ml) or deficiency (<12 ng/ml) can be exacerbated by long-term use of antiretroviral drugs, especially efavirenz (EFV) that is known to interfere with 25(OH)D metabolism (Childs et al., 2012; Panayiotopoulos et al., 2013). Longitudinal data from YLH with and without vitamin D supplementation can provide an important platform for dissecting multifactorial influences on the vitamin D pathway, including pre-vitamin D transport mediated by the vitamin D-binding protein (VDBP; Schlingmann et al., 2011).
The GC/DBP gene1 encoding VDBP is mapped to chromosome 4q12-q13, with hundreds of known single nucleotide polymorphisms (SNPs). When 25(OH)D concentration is analyzed as a trait for vitamin D status, both genome-wide association studies (Wang et al., 2010) and candidate gene approaches (Bu et al., 2010) have consistently pointed to the potential importance of GC SNP variants. In an attempt to confirm the GC genotypes associated with 25(OH)D deficiency, our work here provides further evidence to justify fine-mapping for the GC locus in YLH populations.
Materials and Methods
Study Population
YLH (18–25 years old) represented two self-identified racial groups (African–American (AAs) and others) participating in a randomized, double-blind, placebo-controlled, multicenter trial (NCT004904122) within the Adolescent Medicine Trials Network for HIV/AIDS Interventions (ATN; Havens et al., 2012a, b). The research protocols, including procedures for written informed consent, were approved by the Institutional Review Board (IRB) at 16 ATN clinics and 19 International Maternal Pediatric Adolescent AIDS Clinical Trials (IMPAACT) sites in the United States and Puerto Rico. Ancillary studies summarized here were further approved by the IRB at University of Alabama at Birmingham (UAB).
Intervention and Outcome Measures
All participants were treated with ≥3 antiretrovirals (ARVs) for ≥90 days and with plasma HIV-1 RNA (viral load) <5,000 copies/mL within 60 days. After screening, subjects free of renal disease, pregnancy, and medicines that may affect bone mineral density, interfere with vitamin D absorption, or cause renal toxicity were enrolled into two relatively equal groups based on their ARV regimens (with or without tenofovir disoproxil fumarate, TDF). Within each group, eligible participants were randomized to receive vitamin D supplementation or placebo every 4 weeks for three doses. Serum 25(OH)D concentration was measured at baseline (week 0) and at study week 12 as the primary outcomes for analyses here.
Candidate Loci and Genotyping
Earlier reports on phenotypes related to vitamin D (Bu et al., 2010; Wang et al., 2010; Levin et al., 2012), including bone mineral density and fracture (Cho et al., 2009; Richards et al., 2009; Rivadeneira et al., 2009), have revealed various loci with modest associations (as judged by effect sizes instead of p values). For this study, SNP selection focused on the most promising GC/DBP locus that encodes vitamin D-binding protein. SNPs reported repeatedly in the literature were considered first, followed by flanking SNPs (to facilitate analysis of linkage disequilibrium, LD) and SNPs found in coding and regulatory sequences. Using DNA extracted from Isohelix buccal swabs (Cell Projects Ltd., Kent, UK), all SNP genotypes were resolved by bi-directional DNA sequencing using the gold-standard Sanger chemistry (Polymorphic DNA Technologies, Inc., Alameda, CA, USA). For SNPs with minor allele frequencies (MAF) exceeding 0.05, the pairwise LD patterns were tested using the HaploView program (Barrett et al., 2005).
Statistical Analyses
The study population was first grouped by race (AAs vs. others) for comparison of baseline (week 0) characteristics, with Wilcoxon test, Student t-test, and Chi-squared test applied to appropriate measurements. Subsequent analyses focused on three specific aims. Aim 1 was to demonstrate that serum 25(OH)D concentration is a relatively stable phenotype in YLH. Measurements at baseline and at week 12 were compared in participants in the placebo group (who did not receive vitamin D supplementation), using Spearman method (rho) and Pearson’s correlation coefficient (r; before and after log10-transformation/“normalization,” respectively). Aim 2 was to identify individual SNP genotypes associated with three clinically relevant 25(OH)D categories at baseline: <12 ng/ml (deficiency), ≥12–<20 ng/ml (insufficiency) and >20 ng/ml (sufficiency), using the ordinal logistic regression models adjusted for non-genetic factors (age, sex, and race). All relationships with statistical significance (p < 0.05) and low false discovery rate (FDR; q < 0.05) were included in multivariable models. Aim 3 was to quantify multifactorial influences on serum 25(OH)D, when log10-transformed serum 25(OH)D was analyzed as a continuous outcome in generalized linear models (GLMs). The summary statistics focused on relative effect sizes (regression beta and R2 values) attributable to genetic factors (SNP genotypes), demographic features (age, sex, and race), body mass index (BMI), environmental factors (season and latitude), and exposure to EFV. Similar approaches have been applied earlier to analyses of quantitative traits related to HIV infection (Yue et al., 2013). Whenever possible, secondary (exploratory) models were evaluated for AAs and other races separately.
Results
Characteristics of Study Population by Race
A total of 192 YLH subjects had sufficient data for analyses, with relative equal representation of AAs (n = 99) and others (n = 93; Table 1). At baseline (week 0), these groups were similar (p > 0.20) in terms of age, female to male sex ratio (0.62 vs. 0.58), latitude of residency, enrollment seasons, randomization to vitamin D supplementation (49.5 vs. 52.3%), exposure to EFV (45.5 vs. 37.6%), and CD4+ T-cell (CD4) count (505 ± 149 vs. 550 ± 224 cells/μl of blood). In addition, similar proportions of AAs (13.0%) and others (17.5%) had severe immunodeficiency at baseline (CD4 count < 350 cells/μl). On the other hand, AAs differed from others in serum 25(OH)D concentrations both at baseline (p < 0.0001) and at week 12 (p < 0.01).
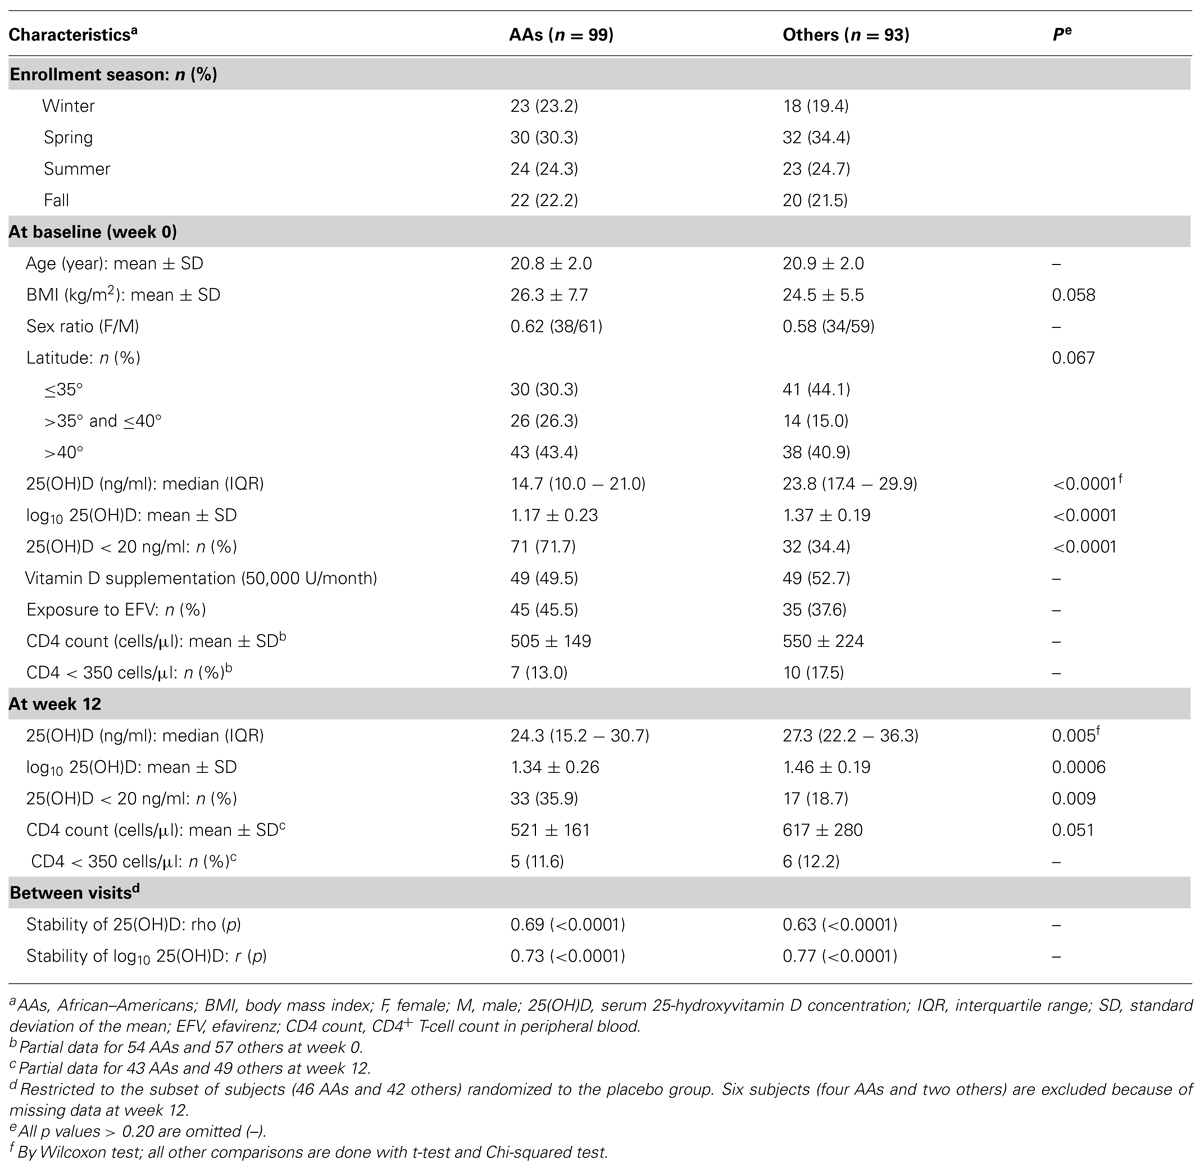
TABLE 1. Main characteristics of the study population, after stratification by race/ethnicity.
Stability of Serum 25(OH)D Concentration over a 12-Week Period
In a subset of subjects (46 AAs and 42 others) who were randomized to the placebo group, log10-transformed 25(OH)D concentrations were moderately stable between the two visits regardless of race (Figure 1), with Pearson r values ranging from 0.73 in AAs (p < 0.0001) to 0.77 in others (p < 0.0001; p > 0.50 between the two r values). Statistical adjustments for other factors slightly improved the r values. For example, when season was treated as a covariate, the adjusted r value became 0.74 in AAs (p < 0.0001) and 0.83 in others (p < 0.0001; p = 0.322 between the two adjusted r values). For 25(OH)D concentrations without log10-transformation, rank correlation between visits (Spearman rho values) ranged from 0.69 in AAs (p < 0.0001) to 0.63 in others (p < 0.0001; p > 0.50 between the two rho values).
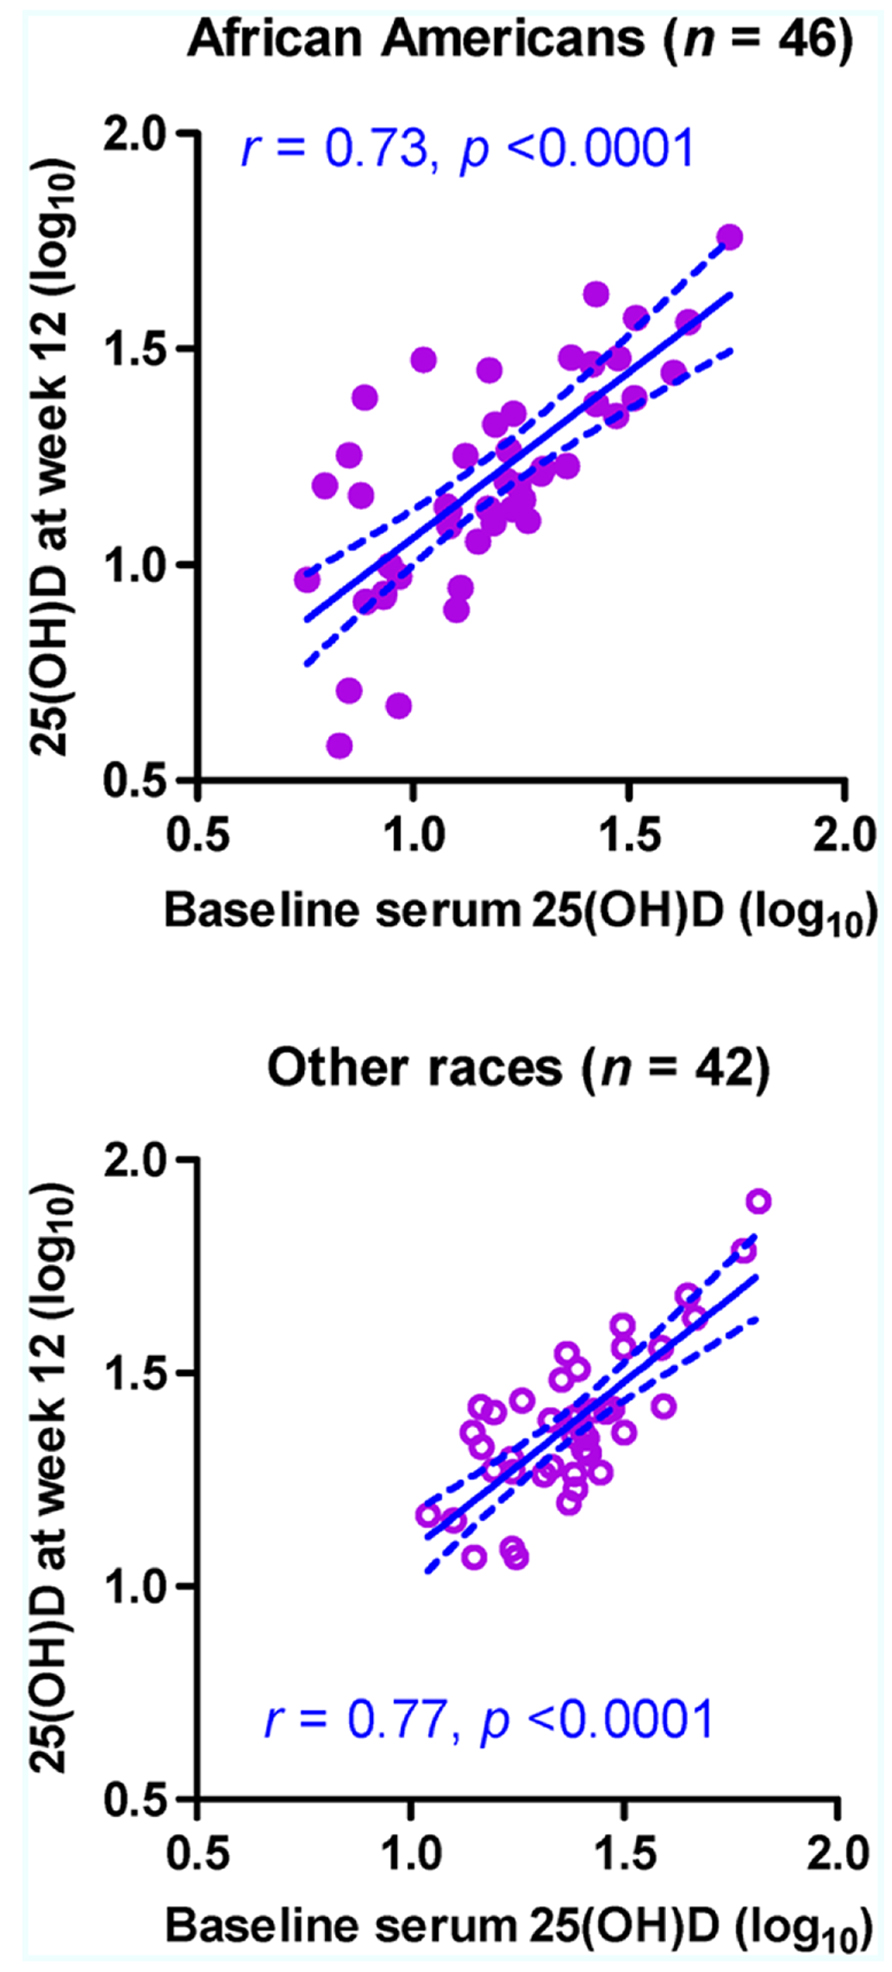
FIGURE 1. Stability of serum 25-hydroxyvitamin D [25(OH)D] concentration (ng/ml) in 88 HIV-1-infected youth who did not receive randomized vitamin D supplementation over a 12-week period. Measurements at baseline (week 0) and at study week 12 are shown for 46 African–Americans (AAs) and 42 non-AA subjects (others). The predicted slope and its 95% confidence intervals in each subgroup are represented by sold and dotted lines, respectively. Six subjects (four AAs and two others) with missing data at week 12 are excluded.
Screening for Informative GC SNPs
DNA sequencing based on 91 samples with most DNA (47 AAs and 44 others) identified 15 informative SNPs with MAF ≥ 0.05 in the overall study population (Table 2). All but one SNP (rs114282916) showed differential distribution between the two racial groups (AAs and others). Most SNPs had weak pairwise LD in both racial groups, but three intronic SNPs (rs222016, rs222020, and rs222029) were within a conserved haplotype block (Figure 2). Additional SNPs dismissed based on rarity of minor alleles (singleton to MAF < 0.05) included rs9016, rs3737553, rs80324156, rs114737000, rs6843222, and 10 polymorphisms not captured in the dbSNP database (last accessed in April 2013).
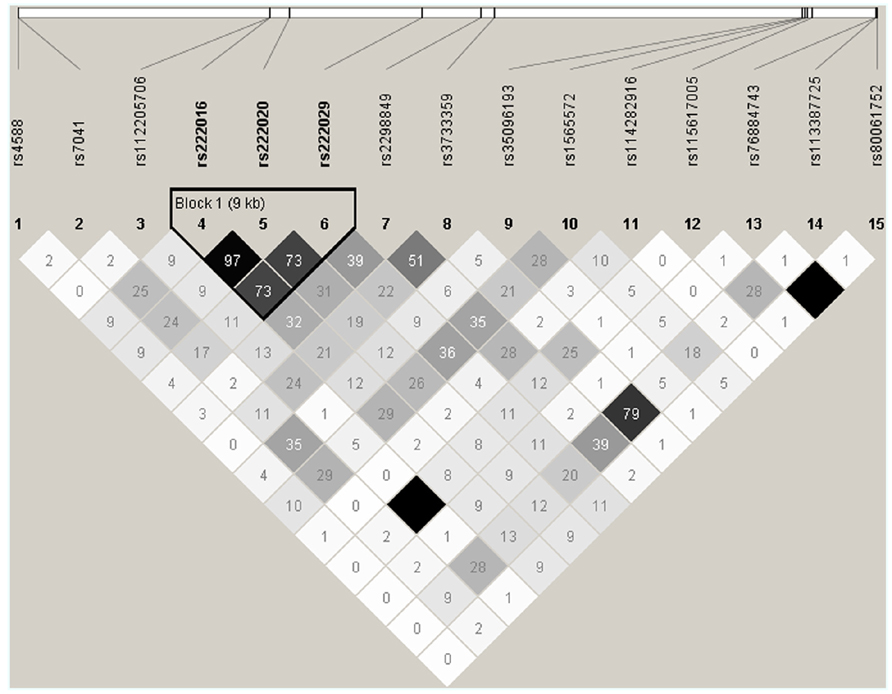
FIGURE 2. Patterns of pairwise linkage disequilibrium (LD) among 15 GC SNPs used for screening and estimating statistical power. Each pairwise comparison of SNP genotypes (defined by direct sequencing) is captured by an r2 value (×100). Similar results are obtained from analyses of SNP genotypes in AAs and other races (excluding SNPs rs112205706 and rs115617005). By default, absolute LD (r2 = 1.00) is indicated by a dark square.
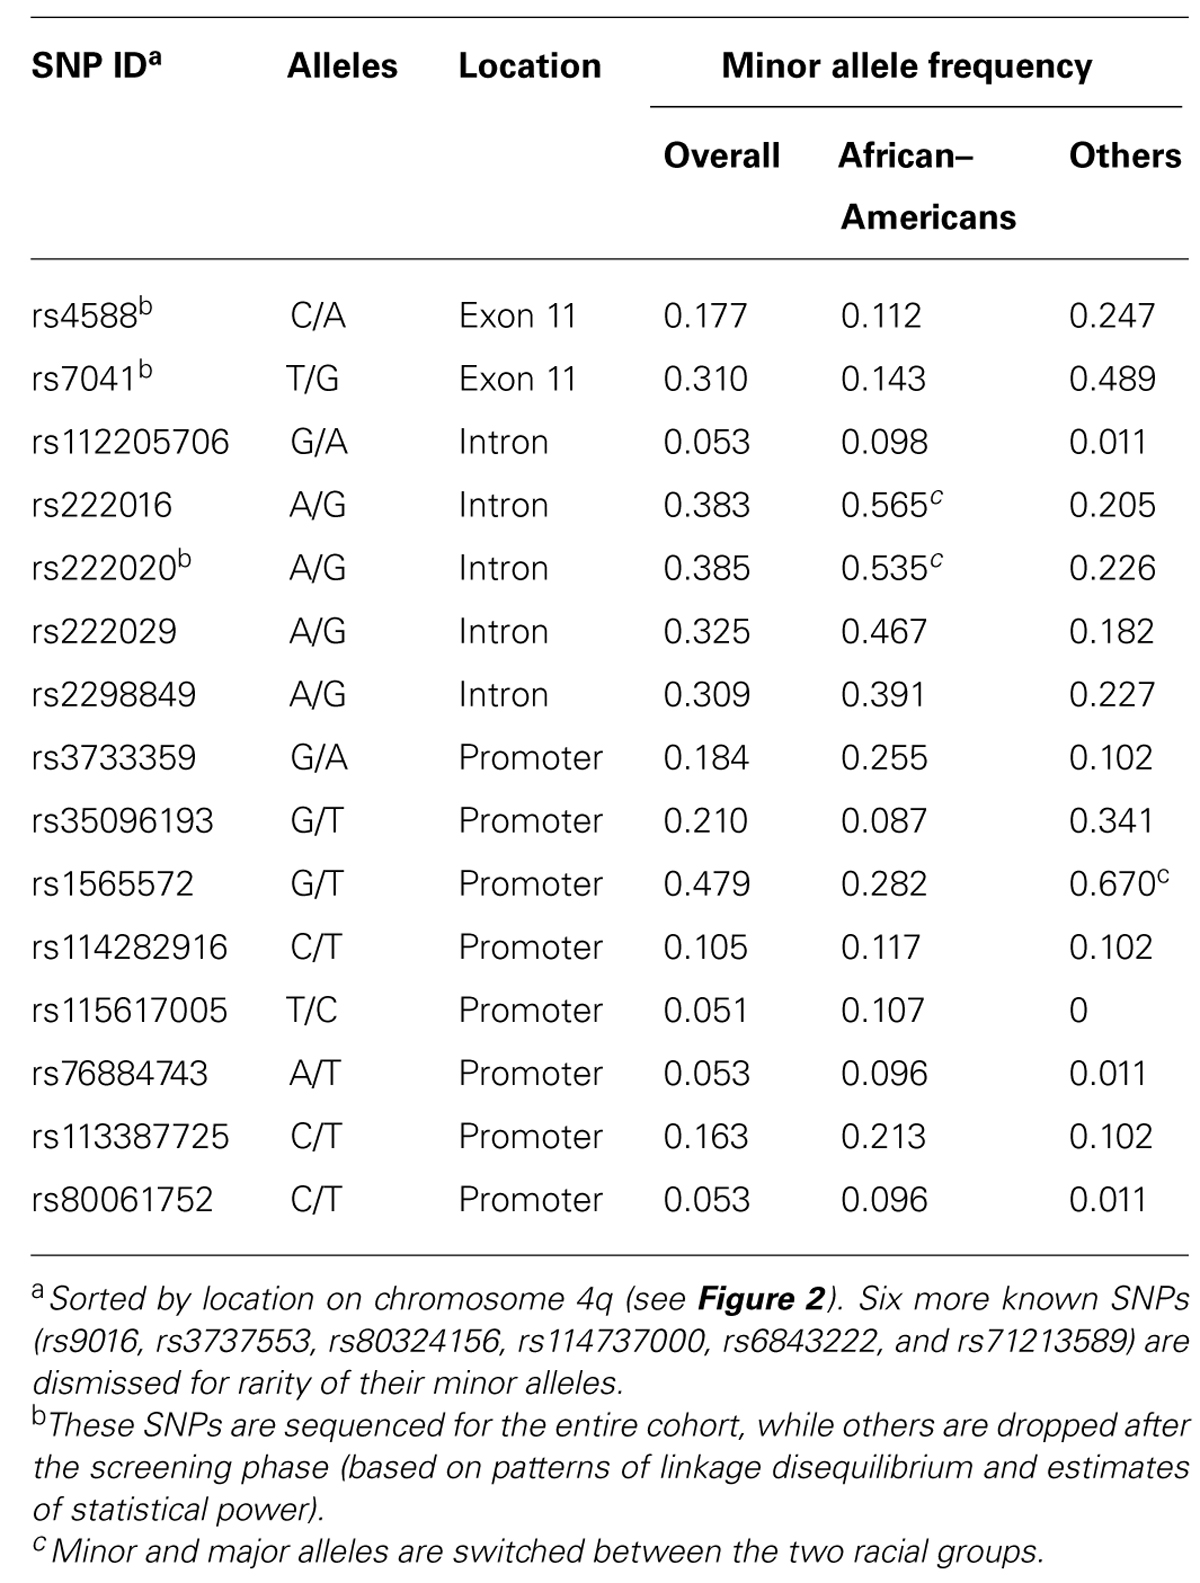
TABLE 2. Minor allele frequency for 15 GC SNPs resolved by DNA sequencing.
In univariable models testing three clinically relevant 25(OH)D levels at baseline: <12 ng/ml (deficiency), ≥12–<20 ng/ml (insufficiency), and >20 ng/ml (sufficiency), seven SNPs showed promising trend (p < 0.05 and q ≤ 0.10) for associations in dominant models, with proportional odds ratios (pOR) ranging from 0.17 (rs222016 and rs222020, unfavorable) to 3.41 (rs7041, favorable) and q values from 0.002 (rs222016 and rs222020) to 0.10 (rs35096193, favorable; Table 3). Among the top four SNPs with q < 0.05, rs7041 has known associations with vitamin D status and related outcomes (Fang et al., 2009; Wood et al., 2011). Three other SNPs in strong LD (Figure 2) could be represented by rs222020, which has been associated with vitamin D status and related outcomes as well (Bu et al., 2010; Xu et al., 2010; Jung et al., 2011; Zhang et al., 2012). Further genotyping in the rest of the study cohort focused on rs7041 (a coding SNP) and rs222020 (an intronic SNP).
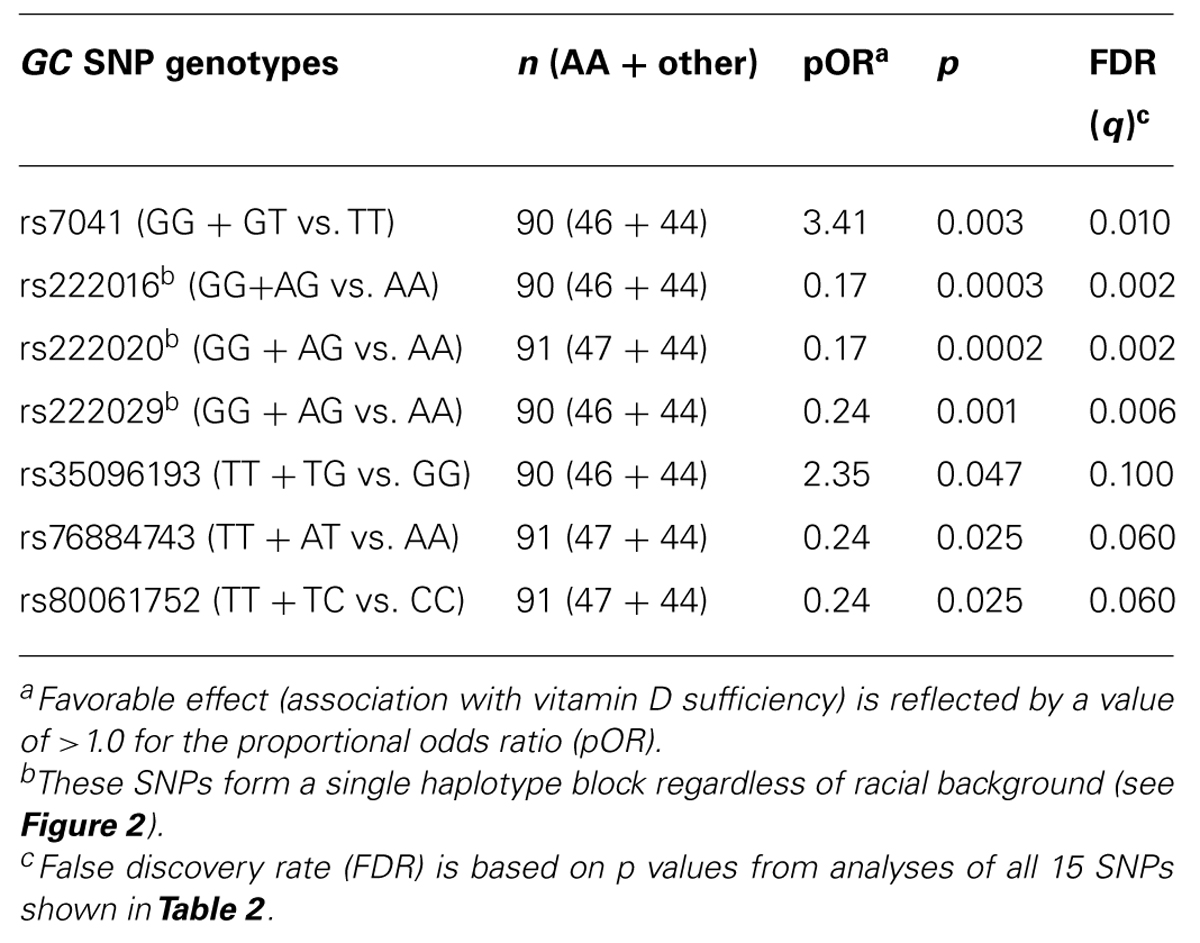
TABLE 3. Univariable analyses of seven GC SNPs using baseline (week 0) serum 25(OH)D concentration as three ordinal categories (deficiency, insufficiency, and sufficiency).
Univariable and Multivariable Models for Two GC SNPs (rs222020 and rs7041) in the Entire Cohort
Both rs7401-G and rs222020-G were associated with baseline serum 25(OH)D categories in univariable models (pOR = 2.32 and 0.31, p = 0.008 and 9.0 × 10⁻⁴, respectively). After statistical adjustment for demographic features (sex, age, and race) and exposure to EFV, rs7041 allele G was no longer a predictor (adjusted pOR = 1.08 and p = 0.827), while rs222020 allele G remained predictive of serum 25(OH)D categories (pOR = 0.45 and p = 0.014). However, further adjustments for BMI and environmental factors (latitude and enrollment season) diminished the association of rs222020-G (adjusted p = 0.069; Table 4). The strong independent predictors included race (p < 0.0001), enrollment season (p < 0.0001), latitude of residence (p < 0.001), BMI (p = 0.002), and use of EFV (p = 0.006). Summer had the most dramatic impact on seasonal fluctuation in serum 25(OH)D (pOR = 8.23, p < 0.0001), while fall and spring were also quite favorable against winter (pOR = 4.90 and 3.55, respectively).
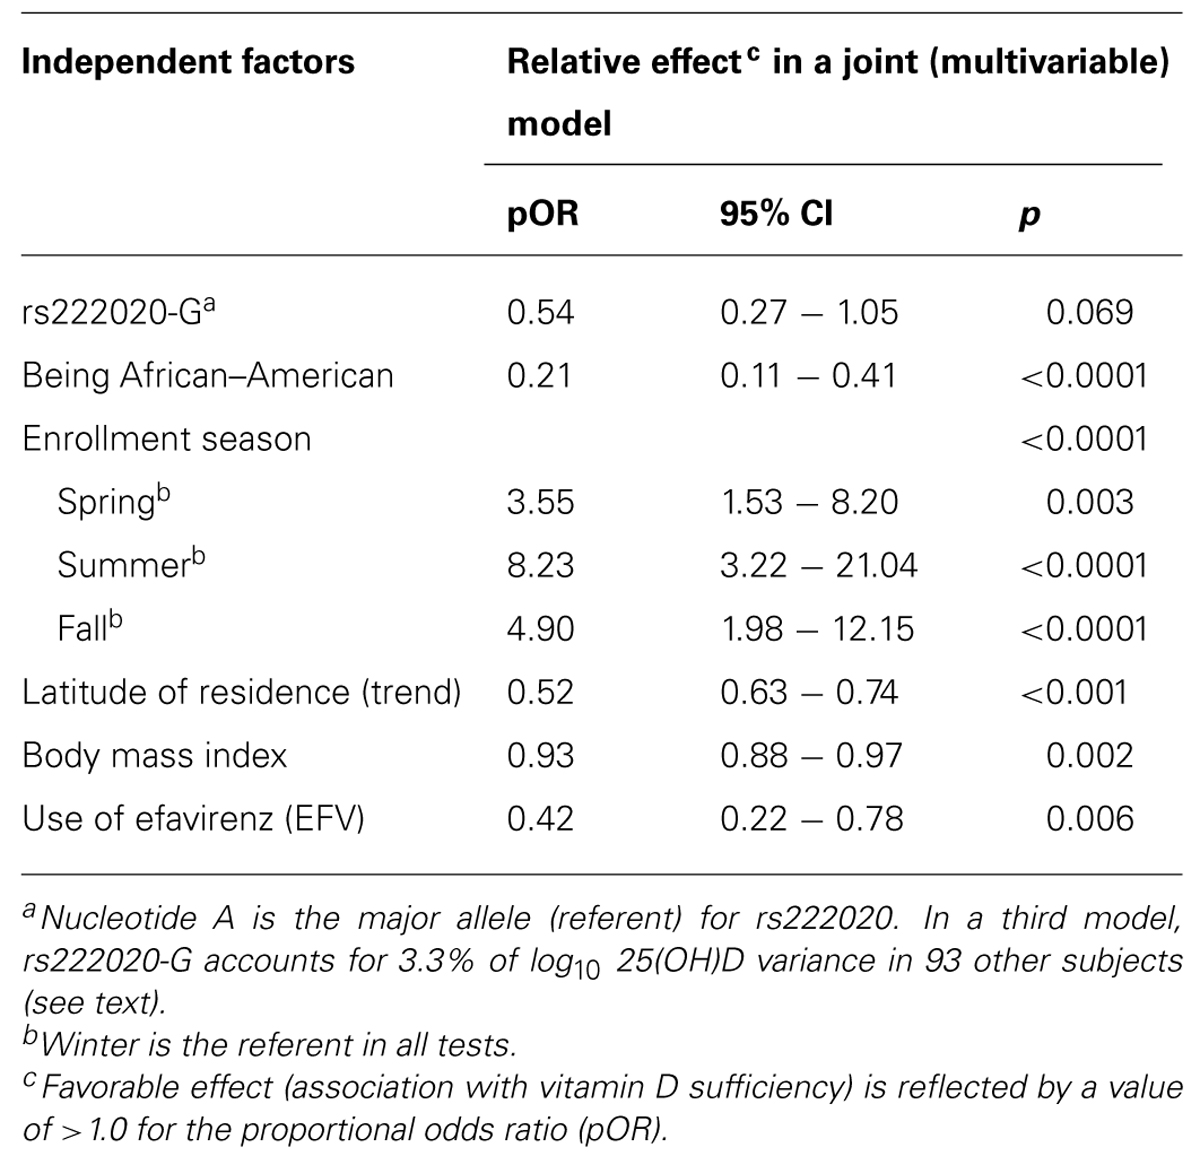
TABLE 4. Independent predictors of serum 25(OH)D concentration as three ordinal categories (deficiency, insufficiency, and sufficiency).
Variance in log10-Transformed Serum 25(OH)D Concentration Explained by GC Genotypes and Other Pertinent Factors
At least six factors independently contributed to the variability in log10-transformed serum 25(OH)D concentration (Table 5). When sorted by their relative impact (i.e., beta estimate and semi-partial R2 value), race (AAs vs. other), and season had the greatest effects (adjusted p < 0.0001 and p < 0.001, respectively), followed by latitude (in three major grids; p < 0.001), BMI (p = 0.008), use of EFV (p = 0.016), and rs222020-G (p = 0.023). Collectively, these factors accounted for 38.0% of variance in the log10-transformed 25(OH)D concentration at baseline (p < 0.0001). Other potential factors, including sex, age, and additional GC SNP variants were firmly dismissed (adjusted p > 0.25).
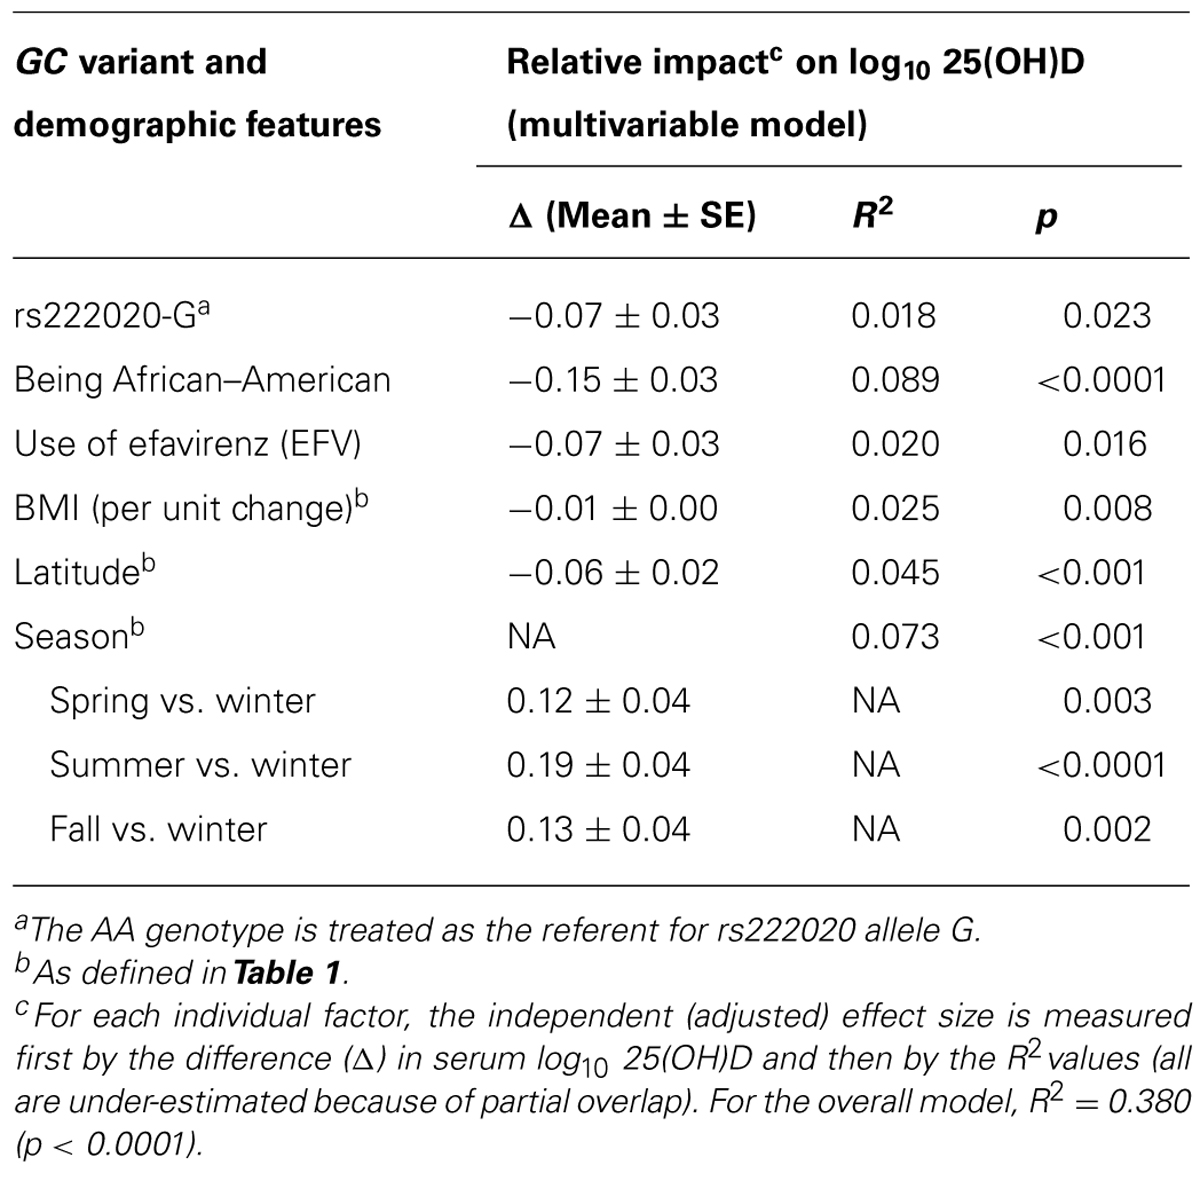
TABLE 5. Independent predictors of baseline (week 0) serum 25(OH)D concentration among 192 youth living with HIV-1 infection: alternative analyses after considering environmental factors.
Ranking of the six individual (independent) predictors of log10-transformed serum 25(OH)D concentration was often complicated by issues with partial overlap. For example, variance explained by the rs222020-G allele varied substantially (from 2.9 to 10.7%) according to the order in which three partially overlapping factors (race, use of EFV, and rs222020-G) were added to the model. In addition, the variance attributable to rs222020-G differed somewhat between AAs (4.5%, adjusted p = 0.029) and others (3.3%, adjusted p = 0.080) when conditioned on the effect of EFV (Table 7). In contrast, after accounting for the effect of rs222020-G, the impact of EFV use on 25(OH)D was only apparent in AAs (adjusted R2 = 8.8%, p = 0.003) and not in others (adjusted R2 = 0.1%, p = 0.812; Table 7).
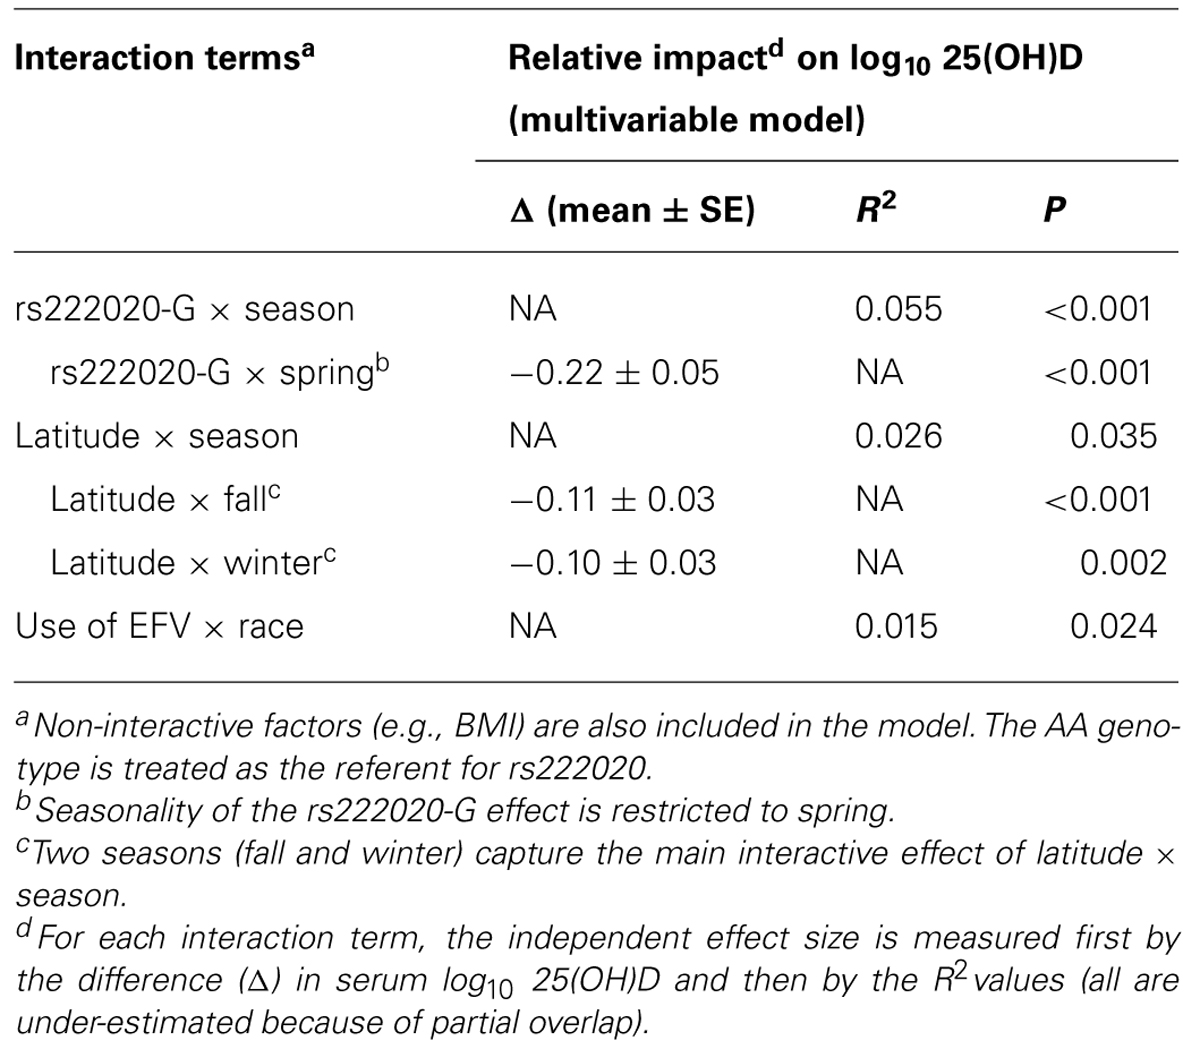
TABLE 6. Three independent interaction terms identified by multivariable analyses.
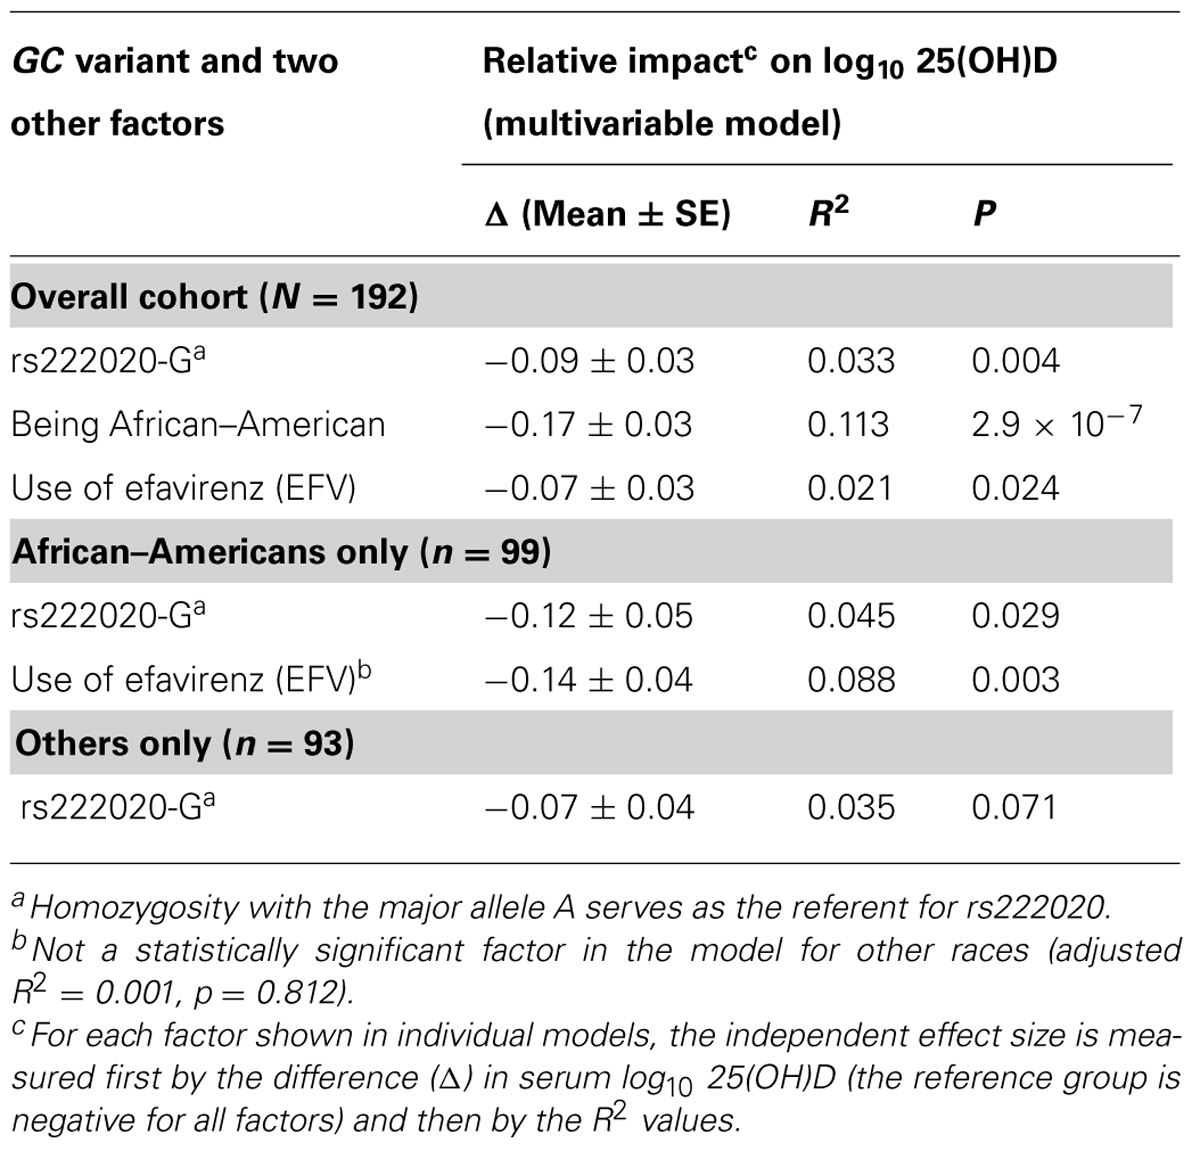
TABLE 7. Examples of racial differences in genetic association with serum 25(OH)D concentration.
Interaction Terms
Multivariable models further revealed several pairwise interactions, i.e., rs222020-G × season (p < 0.001), latitude × season (especially fall and winter; p < 0.01), and race × EFV use (p = 0.024). Seasonality of the rs222020-G effect on 25(OH)D was apparently restricted to spring, as genotype-specific differences were not detected in other seasons (Figure 3).
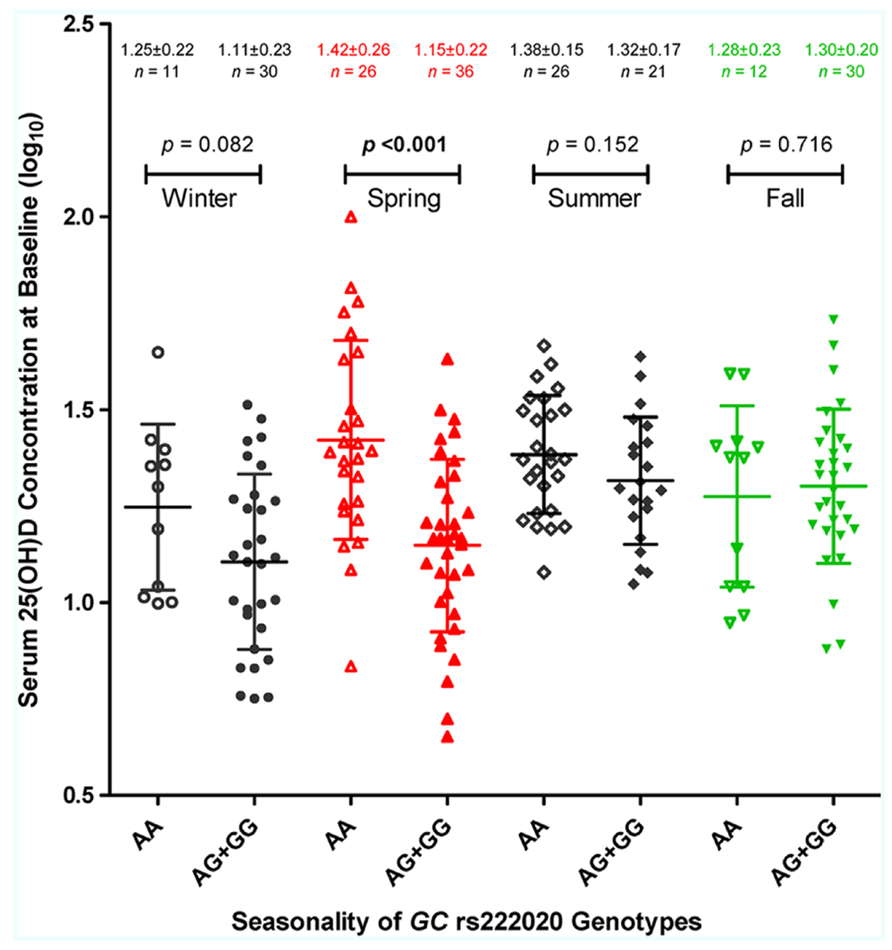
FIGURE 3. Season-dependent association of GC genotypes with serum 25-hydroxyvitamin D [25(OH)D] concentration. The log10-transformed 25(OH)D (ng/ml) values in 192 HIV-1-infected youth are plotted according to four enrollment seasons and three genotypes defined by the GC SNP, rs222020 (major allele A and minor allele G). For each stratum, the horizontal bars connected by a vertical line correspond to the mean ± standard deviation (SD). The nominal p values are based on Student’s t-test, assuming a dominant effect of allele G (see Table 6 for full analyses of interactions between rs222020-G and enrollment season).
Observation of Differences between Racial Groups
At least two racial differences were noted in separate analyses of AAs (n = 99) and other races (n = 93). First, negative association of rs222020-G with 25(OH)D was restricted to AAs (R2 = 4.5%, adjusted p = 0.029) and not other subjects (3.3%, adjusted p = 0.080) when conditioned on the effect of EFV (Table 7). Second, the deleterious impact of EFV use on 25(OH)D was seen in AAs (adjusted R2 = 8.8%, p = 0.003) and not in other subjects (adjusted R2 = 0.1%, p = 0.812) after accounting for the contribution of rs222020-G.
Discussion
Despite a modest sample size, our analyses here reveal five major findings concerning vitamin D metabolism in youth living with HIV-1 infection. First, serum 25(OH)D concentration is relatively stable over a 12-week period regardless of race. Second, at least one GC SNP variant, the rs222020-G allele, is independently predictive of suboptimal serum 25(OH)D, especially during the spring season. Third, use of EFV is associated with low serum 25(OH)D in the combined cohort based on univariable models, but the EFV effect is restricted to AAs when the rs222020-G allele is added to multivariable models. Fourth, the exact contribution of genetic and non-genetic factors (latitude, season, BMI, and race) can be obscured by partial overlaps and frequent interactions. Fifth, statistical models are not uniformly applicable to racial groups. Most of these observations are novel and highly relevant to public health.
As a main focus of this study, the GC gene3 consists of 13 exons and has hundreds of known SNPs, but neither genome-wide association studies nor candidate gene approaches reported in the literature have covered this locus sufficiently enough to allow fine-mapping. To avoid heavy penalty for multiple testing of randomly selected GC SNPs, we chose to examine coding and regulatory (promoter) sequences at both ends of several SNPs with relatively consistent associations. For example, the minor allele G (or C in the complementary strand) for rs222020 has been highlighted recently in the context of compression strength index of the femoral neck (Xu et al., 2010), peripheral arthritis in ankylosing spondylitis (Jung et al., 2011), and plasma 25(OH)D concentration (Zhang et al., 2012). By analyzing rs222020 and multiple neighboring SNPs, it was evident that rs222020-G is able to tag several intronic variants within a single haplotype block. However, rs222020-G did not seem to tag other functionally relevant variants. Mechanisms underlying its independent association with suboptimal 25(OH)D concentration remain elusive, and search for further clues may need to consider less obvious pathways (DNA–DNA and DNA–protein interactions) being actively pursued by the ENCODE project (Dunham et al., 2012; Harrow et al., 2012; Rosenbloom et al., 2012; Wang et al., 2013).
Two other prominent GC SNPs, rs7041, and rs4588, do cause amino acid substitutions at codon 416 (D/E) and codon 420 (T/K), respectively, in exon 11. Three haplotypes involving these non-synonymous SNPs correspond to different protein isoforms known as GC1F, GC1S, and GC2. Earlier studies have demonstrated the potential importance of rs7041 variants alone (Wood et al., 2011) or in conjunction with rs4588 variants (Fang et al., 2009). Although rs7041-G appeared to be highly favorable in our initial screening (univariable models only), it was subsequently dismissed by multivariable models in which race and other prominent factors were treated as covariates. The distribution of rs7041-G differs between AAs (low) and other races (high; Table 2), so definitive analyses may require a third population with intermediate allele frequency. Nonetheless, rs7041-G may serve as a useful biomarker for disparity in serum 25(OH)D concentration, especially since its biological relevance is so obvious. Additional GC SNPs of interest, including rs2070741 (Wood et al., 2011) and rs2282679 (Vimaleswaran et al., 2013), are not part of our study design. Judging by their reported effect sizes, it is unlikely that inclusion of these SNPs will alter our main conclusions.
Our finding on GC SNP rs222020 here is highly consistent with earlier observations based on two independent Caucasian populations (Bu et al., 2010). The effect size (R2) reported for rs222020 ranges from 1% to 4% in Caucasians, which is quite similar to what we can demonstrate for YLH (Table 5). However, by our assessment, the association of rs222020 genotypes with 25(OH)D concentration is heavily dependent on seasonal fluctuation. Studies that evaluate subjects in the spring season alone can lead to over-estimates, while analyses biased for other seasons can easily miss the genetic effect (Table 6; Figure 3). Future studies will clearly need to consider the strong impact of season and latitude on vitamin D metabolism.
Recognition of EFV as another factor that influences vitamin D metabolism is also well expected (Childs et al., 2012; Havens et al., 2012a). Of note, the unfavorable impact of EFV was mostly restricted to AAs. Such racial disparities may reflect the sensitivity or vulnerability of AAs to therapeutic complications when they are already prone to having suboptimal 25(OH)D concentration. Fortunately, response to vitamin D supplementation is not compromised by use of EFV (Havens et al., 2012a). Further elucidation of race-specific effects of EFV will need to rely on large cohorts with prospective data.
In summary, our study identified at least six partially overlapping but independent factors that collectively account for 38% of variance in serum 25(OH)D concentration. The complex picture can attest to the need for cautionary interpretation of results from univariable models, as exemplified by analysis of GC SNPs rs7401 and rs222020. Fine-mapping of the GC locus for causal variants is more difficult than expected because (i) rs222020-G and related GC variants are not in clear LD with coding and promoter sequence polymorphisms; (ii) the effect of rs7041-G is clearly confounded by racial background, and (iii) serum 25(OH)D concentration as a quantitative or semi-quantitative trait can fluctuate over time (seasonality). These observations should benefit follow-up studies on GC genotypes and vitamin D metabolism, probably beyond the setting of chronic HIV infection and long-term therapeutic complications.
Author Contributions
Charles B. Stephensen, Kathleen Mulligan, Brandy Rutledge, Patricia M. Flynn, Jorge Lujan-Zilbermann, Rohan Hazra, Craig M. Wilson, Peter L. Havens, and Jianming Tang designed the study. Jorge Lujan-Zilbermann helped with patient recruitment and enrollment at one of the sites for Adolescent Medicine Trials Network for HIV/AIDS Interventions. Travis R. Porter, Peter L. Havens, and Jianming Tang procured samples and reagents. Travis R. Porter, Xuelin Li, and Jianming Tang managed and analyzed the data. All authors contributed to the writing and proof reading of this manuscript.
Conflict of Interest Statement
The authors declare that the research was conducted in the absence of any commercial or financial relationships that could be construed as a potential conflict of interest.
Acknowledgments
This work was the result of collective efforts by the ATN 063 protocol team (Havens et al., 2012a, b). We thank principal investigators, their staff, as well as participants at all clinical sites for their valuable contribution to various aspects of this study. We also thank Wei Song for interim data analyses. Funding for this study came from the Eunice Kennedy Shriver National Institute of Child Health and Human Development (NICHD), through grant U01-HD040533 to CMW. The contents in this manuscript are the responsibility of the study authors and do not necessarily reflect the views of NICHD or the United States government.
Footnotes
- ^ http://www.ncbi.nlm.nih.gov/gene/2638
- ^ http://clinicaltrials.gov/ct2/show/NCT00490412
- ^ http://www.ncbi.nlm.nih.gov/gene/2638
References
Barrett, J. C., Fry, B., Maller, J., and Daly, M. J. (2005). Haploview: analysis and visualization of LD and haplotype maps. Bioinformatics 21, 263–265. doi: 10.1093/bioinformatics/bth457
Bouillon, R. (2010). Genetic and environmental determinants of vitamin D status. Lancet 376, 148–149. doi: 10.1016/S0140-6736(10)60635-6
Bu, F. X., Armas, L., Lappe, J., Zhou, Y., Gao, G., Wang, H. W., et al. (2010). Comprehensive association analysis of nine candidate genes with serum 25-hydroxy vitamin D levels among healthy Caucasian subjects. Hum. Genet. 128, 549–556. doi: 10.1007/s00439-010-0881-9
Childs, K., Welz, T., Samarawickrama, A., and Post, F. A. (2012). Effects of vitamin D deficiency and combination antiretroviral therapy on bone in HIV-positive patients. AIDS 26, 253–262. doi: 10.1097/QAD.0b013e32834f324b
Cho, Y. S., Go, M. J., Kim, Y. J., Heo, J. Y., Oh, J. H., Ban, H. J., et al. (2009). A large-scale genome-wide association study of Asian populations uncovers genetic factors influencing eight quantitative traits. Nat. Genet. 41, 527–534. doi: 10.1038/ng.357
Chocano-Bedoya, P., and Ronnenberg, A. G. (2009). Vitamin D and tuberculosis. Nutr. Rev. 67, 289–293. doi: 10.1111/j.1753-4887.2009.00195.x
Dunham, I., Kundaje, A., Aldred, S. F., Collins, P. J., Davis, C. A., Doyle, F., et al. (2012). An integrated encyclopedia of DNA elements in the human genome. Nature 489, 57–74. doi: 10.1038/nature11247
Fang, Y., Van Meurs, J. B., Arp, P., Van Leeuwen, J. P., Hofman, A., Pols, H. A., et al. (2009). Vitamin D binding protein genotype and osteoporosis. Calcif. Tissue Int. 85, 85–93. doi: 10.1007/s00223-009-9251-9
Ginde, A. A., Liu, M. C., and Camargo, C. A. Jr. (2009). Demographic differences and trends of vitamin D insufficiency in the US population, 1988-2004. Arch. Intern. Med. 169, 626–632. doi: 10.1001/archinternmed.2008.604
Harrow, J., Frankish, A., Gonzalez, J. M., Tapanari, E., Diekhans, M., Kokocinski, F., et al. (2012). GENCODE: the reference human genome annotation for The ENCODE Project. Genome Res. 22, 1760–1774. doi: 10.1101/gr.135350.111
Havens, P. L., Mulligan, K., Hazra, R., Flynn, P., Rutledge, B., Van Loan, M. D., et al. (2012a). Serum 25-hydroxyvitamin D response to vitamin D3 supplementation 50,000 IU monthly in youth with HIV-1 infection. J. Clin. Endocrinol. Metab. 97, 4004–4013. doi: 10.1210/jc.2012-2600
Havens, P. L., Stephensen, C. B., Hazra, R., Flynn, P. M., Wilson, C. M., Rutledge, B., et al. (2012b). Vitamin D3 decreases parathyroid hormone in HIV-infected youth being treated with tenofovir: a randomized, placebo-controlled trial. Clin. Infect. Dis 54, 1013–1025. doi: 10.1093/cid/cir968
Jung, K. H., Kim, T. H., Sheen, D. H., Lim, M. K., Lee, S. K., Kim, J. Y., et al. (2011). Associations of vitamin D binding protein gene polymorphisms with the development of peripheral arthritis and uveitis in ankylosing spondylitis. J. Rheumatol. 38, 2224–2229. doi: 10.3899/jrheum.101244
Karohl, C., Su, S., Kumari, M., Tangpricha, V., Veledar, E., Vaccarino, V., et al. (2010). Heritability and seasonal variability of vitamin D concentrations in male twins. Am. J. Clin. Nutr. 92, 1393–1398. doi: 10.3945/ajcn.2010.30176
Levin, G. P., Robinson-Cohen, C., De Boer, I. H., Houston, D. K., Lohman, K., Liu, Y., et al. (2012). Genetic variants and associations of 25-hydroxyvitamin D concentrations with major clinical outcomes. JAMA 308, 1898–1905. doi: 10.1001/jama.2012.17304
Looker, A. C., Pfeiffer, C. M., Lacher, D. A., Schleicher, R. L., Picciano, M. F., and Yetley, E. A. (2008). Serum 25-hydroxyvitamin D status of the US population: 1988-1994 compared with 2000-2004. Am. J. Clin. Nutr. 88, 1519–1527. doi: 10.3945/ajcn.2008.26182
Panayiotopoulos, A., Bhat, N., and Bhangoo, A. (2013). Bone and vitamin D metabolism in HIV. Rev. Endocr. Metab. Disord. 14, 119–125. doi: 10.1007/s11154-013-9246-8
Ramagopalan, S. V., Maugeri, N. J., Handunnetthi, L., Lincoln, M. R., Orton, S. M., Dyment, D. A., et al. (2009). Expression of the multiple sclerosis-associated MHC class II Allele HLA-DRB1*1501 is regulated by vitamin D. PLoS Genet. 5:e1000369. doi: 10.1371/journal.pgen.1000369
Razzaque, M. S. (2009). The FGF23-Klotho axis: endocrine regulation of phosphate homeostasis. Nat. Rev. Endocrinol. 5, 611–619. doi: 10.1038/nrendo.2009.196
Richards, J. B., Kavvoura, F. K., Rivadeneira, F., Styrkarsdottir, U., Estrada, K., Halldorsson, B. V., et al. (2009). Collaborative meta-analysis: associations of 150 candidate genes with osteoporosis and osteoporotic fracture. Ann. Intern. Med. 151, 528–537. doi: 10.7326/0003-4819-151-8-200910200-00006
Rivadeneira, F., Styrkarsdottir, U., Estrada, K., Halldorsson, B. V., Hsu, Y. H., Richards, J. B., et al. (2009). Twenty bone-mineral-density loci identified by large-scale meta-analysis of genome-wide association studies. Nat. Genet. 41, 1199–1206. doi: 10.1038/ng.446
Rosen, C. J. (2011). Clinical practice. Vitamin D insufficiency. N. Engl. J. Med. 364, 248–254. doi: 10.1056/NEJMcp1009570
Rosenbloom, K. R., Dreszer, T. R., Long, J. C., Malladi, V. S., Sloan, C. A., Raney, B. J., et al. (2012). ENCODE whole-genome data in the UCSC genome browser: update 2012. Nucleic Acids Res. 40, D912–D917. doi: 10.1093/nar/gkr1012
Schlingmann, K. P., Kaufmann, M., Weber, S., Irwin, A., Goos, C., John, U., et al. (2011). Mutations in CYP24A1 and idiopathic infantile hypercalcemia. N. Engl. J. Med. 365, 410–421. doi: 10.1056/NEJMoa1103864
Vimaleswaran, K. S., Berry, D. J., Lu, C., Tikkanen, E., Pilz, S., Hiraki, L. T., et al. (2013). Causal relationship between obesity and vitamin D status: Bi-directional mendelian randomization analysis of multiple cohorts. PLoS Med. 10:e1001383. doi: 10.1371/journal.pmed.1001383
Wang, J., Zhuang, J., Iyer, S., Lin, X. Y., Greven, M. C., Kim, B. H., et al. (2013). Factorbook.org: a Wiki-based database for transcription factor-binding data generated by the ENCODE consortium. Nucleic Acids Res. 41, D171–D176. doi: 10.1093/nar/gks1221
Wang, T. J., Zhang, F., Richards, J. B., Kestenbaum, B., Van Meurs, J. B., Berry, D., et al. (2010). Common genetic determinants of vitamin D insufficiency: a genome-wide association study. Lancet 376, 180–188. doi: 10.1016/S0140-6736(10)60588-0
Wood, A. M., Bassford, C., Webster, D., Newby, P., Rajesh, P., Stockley, R. A., et al. (2011). Vitamin D-binding protein contributes to COPD by activation of alveolar macrophages. Thorax 66, 205–210. doi: 10.1136/thx.2010.140921
Xu, X. H., Xiong, D. H., Liu, X. G., Guo, Y., Chen, Y., Zhao, J., et al. (2010). Association analyses of vitamin D-binding protein gene with compression strength index variation in Caucasian nuclear families. Osteoporos. Int. 21, 99–107. doi: 10.1007/s00198-009-0929-7
Yue, L., Prentice, H. A., Farmer, P., Song, W., He, D., Lakhi, S., et al. (2013). Cumulative impact of host and viral factors on HIV-1 viral load control during early infection. J. Virol. 87, 708–715. doi: 10.1128/JVI.02118-12
Zhang, Y., Wang, X., Liu, Y., Qu, H., Qu, S., Wang, W., et al. (2012). The GC, CYP2R1 and DHCR7 genes are associated with vitamin D levels in northeastern Han Chinese children. Swiss Med. Wkly. 142, w13636. doi: 10.4414/smw.2012.13636
Keywords: antiretroviral, genetics, HIV-1, race, youth, vitamin D
Citation: Porter TR, Li X, Stephensen CB, Mulligan K, Rutledge B, Flynn PM, Lujan-Zilbermann J, Hazra R, Wilson CM, Havens PL, Tang J and for the Adolescent Medicine Trials Network for HIV/AIDS Interventions (ATN) 063 study team(2013) Genetic associations with 25-hydroxyvitamin D deficiency in HIV-1-infected youth: fine-mapping for the GC/DBP gene that encodes the vitamin D-binding protein. Front. Genet. 4:234. doi: 10.3389/fgene.2013.00234
Received: 03 September 2013; Accepted: 22 October 2013;
Published online: 14 November 2013.
Edited by:
José A. G. Agúndez, University of Extremadura, SpainReviewed by:
Diego Maria Michele Fornasari, University of Milan, ItalyMehmet Tevfik Dorak, Florida International University, USA
Copyright © Porter, Li, Stephensen, Mulligan, Rutledge, Flynn, Lujan-Zilbermann, Hazra, Wilson, Havens, Tang and for the Adolescent Medicine Trials Network for HIV/AIDS Interventions (ATN) 063 study team. This is an open-access article distributed under the terms of the Creative Commons Attribution License (CC BY). The use, distribution or reproduction in other forums is permitted, provided the original author(s) or licensor are credited and that the original publication in this journal is cited, in accordance with accepted academic practice. No use, distribution or reproduction is permitted which does not comply with these terms.
*Correspondence: Jianming Tang, Department of Medicine, University of Alabama at Birmingham, 1665 University Boulevard, Birmingham, AL 35294, USA e-mail:anRhbmdAdWFiLmVkdQ==