 Tayaza Fadason
 Cameron Ekblad1†
 John R. Ingram
 William S. Schierding
 Justin M. O'Sullivan
- 1Liggins Institute, University of Auckland, Auckland, New Zealand
- 2Plant & Food Research, Auckland, New Zealand
The mechanisms that underlie the association between obesity and type 2 diabetes are not fully understood. Here, we investigated the role of the 3D genome organization in the pathogeneses of obesity and type-2 diabetes. We interpreted the combined and differential impacts of 196 diabetes and 390 obesity associated single nucleotide polymorphisms (SNPs) by integrating data on the genes with which they physically interact (as captured by Hi-C) and the functional [i.e., expression quantitative trait loci (eQTL)] outcomes associated with these interactions. We identified 861 spatially regulated genes (e.g., AP3S2, ELP5, SVIP, IRS1, FADS2, WFS1, RBM6, HORMAD1, PYROXD2), which are enriched in tissues (e.g., adipose, skeletal muscle, pancreas) and biological processes and canonical pathways (e.g., lipid metabolism, leptin, and glucose-insulin signaling pathways) that are important for the pathogenesis of type 2 diabetes and obesity. Our discovery-based approach also identifies enrichment for eQTL SNP-gene interactions in tissues that are not classically associated with diabetes or obesity. We propose that the combinatorial action of active obesity and diabetes spatial eQTL SNPs on their gene pairs within different tissues reduces the ability of these tissues to contribute to the maintenance of a healthy energy metabolism.
Introduction
Genome-wide association studies (GWAS) have been instrumental in identifying numerous genetic risk loci for type 2 diabetes and obesity (reviewed in Pigeyre et al., 2016). Despite this, the identified risk loci for obesity and type 2 diabetes only explain 3 and 10% of the heritability of these disorders, respectively (Sanghera and Blackett, 2012; Pigeyre et al., 2016). Moreover, as most of these variants fall outside of coding regions, they do not have clear biological functions that link them to either obesity or diabetes (Speliotes et al., 2010). Alongside other studies into the pathogenesis of polygenic disorders, this has led to the hypothesis that some of the information within the genome that is responsible for the heritability of diabetes and obesity is not encoded in the linear sequence but instead lies within the spatial organization of the chromatin (Franzen et al., 2016; Schierding et al., 2016). This hypothesis is increasingly supported by empirical evidence that genetic variants fall within regulatory regions (e.g., enhancers, insulators, etc.) that impact on distal, but spatially associated, loci rather than on the genes that are closest to them in the linear DNA sequence (Franzen et al., 2016; Jo et al., 2016; Schierding et al., 2016). Pullinger et al. (2014) for example, have reported an association between a type 2 diabetes variant in HMGA1 on chromosome 6 and the transcription of the INSR gene on chromosome 19.
Proximity-ligation methodologies coupled to high throughput sequencing have enabled a step change in the deconvolution of the spatial organization of genomes. These methods (e.g., genome conformation capture and Hi-C) capture regions of the genome that are physically associated and able to be covalently connected by a cross-linking agent (Grand et al., 2011). Collectively, studies using proximity-ligation methods have begun to untangle how the organization of the genome into non-membrane bound compartments is related to the realization of the information encoded in the DNA sequence itself. This increase in our understanding extends to complex looping patterns that contribute to gene regulation (e.g., reviewed in Pombo and Dillon, 2015).
Spatial chromosomal organization is probabilistic (Bolzer et al., 2005), tissue or cell-type-specific (Parada et al., 2004), developmental stage specific (Krijger et al., 2016; Doynova et al., 2017) and can change to adapt to an evolutionary selective pressure e.g., the inverted genomic structure of rod cells in nocturnal mammals (Solovei et al., 2009). Despite the presence of cell type dependent features, there is remarkable retention of some aspects of chromosomal organization within metazoan nuclei. For example, topologically associating domains (TADs) are remarkably stable across cell types and species (Dixon et al., 2012) and preferential intra-TAD and inter-TAD contacts have been identified (Fraser et al., 2015). Thus, nuclear structure contains both cell type dependent and independent features.
The potential for integrating information on spatial organization and functional data to improve our understanding of the genetic basis of complex phenotypes has been illustrated in several recent studies (e.g., autoimmune Farh et al., 2015, cardiometabolic Franzen et al., 2016, and schizophrenia Won et al., 2016). It is increasingly clear that genetic variants identified by GWAS: (a) can have greater regulatory effects on distant but spatially proximal genes than on the genes closest to them; and (b) can act on more than one gene in a tissue- and developmental-stage specific manner. However, these studies concentrate on cis-regulatory connections and ignore the trans-connections, which were shown to contribute to heritability in human growth (Schierding et al., 2016).
Current approaches to the mapping of genes affected by single nucleotide polymorphisms (SNPs) identified in GWAS typically use the nearest gene model. However, clinical risk for polygenic disorders is the sum result of the gene-environment interactions. These interactions occur within the context of a regulatory network that is “tuned” by the combined action of regulatory sites that spatially cluster. These sites are subject to genetic variation, which may alter these spatial clusters and thereby disrupt the functioning of target genes. As such, it is imperative that previously identified intergenic GWAS variants are tested for spatial interactions. Crucially, this approach has the potential to elucidate the regulatory network that describes the disease-associated SNPs which enhance or reduce the expected co-occurrence and severity of both obesity and type 2 diabetes.
Here we integrate information on spatial organization and functional (i.e., expression) data to identify the overlap between regulatory pathways that contribute to type 2 diabetes, obesity, and comorbid obesity plus type 2 diabetes phenotypes. We demonstrate that loci marked by diabetes—and obesity-related SNPs are involved in regulatory interactions in a tissue—and disease-specific manner.
Research Design and Methods
Identification of Regulatory SNP-Gene Interactions
Our aim was to identify SNPs where the genetic variant correlates with the expression level of the spatially associated partner gene [i.e., the SNP is an expression quantitative trait locus (eQTL); Figure 1]. To do this, we developed the “Contextualize Developmental SNPs using 3D Information” (CoDeS3D) algorithm (Figure 1) for the integrated analysis of GWAS SNPs and their phenotypes (GitHub, https://github.com/alcamerone/codes3d).
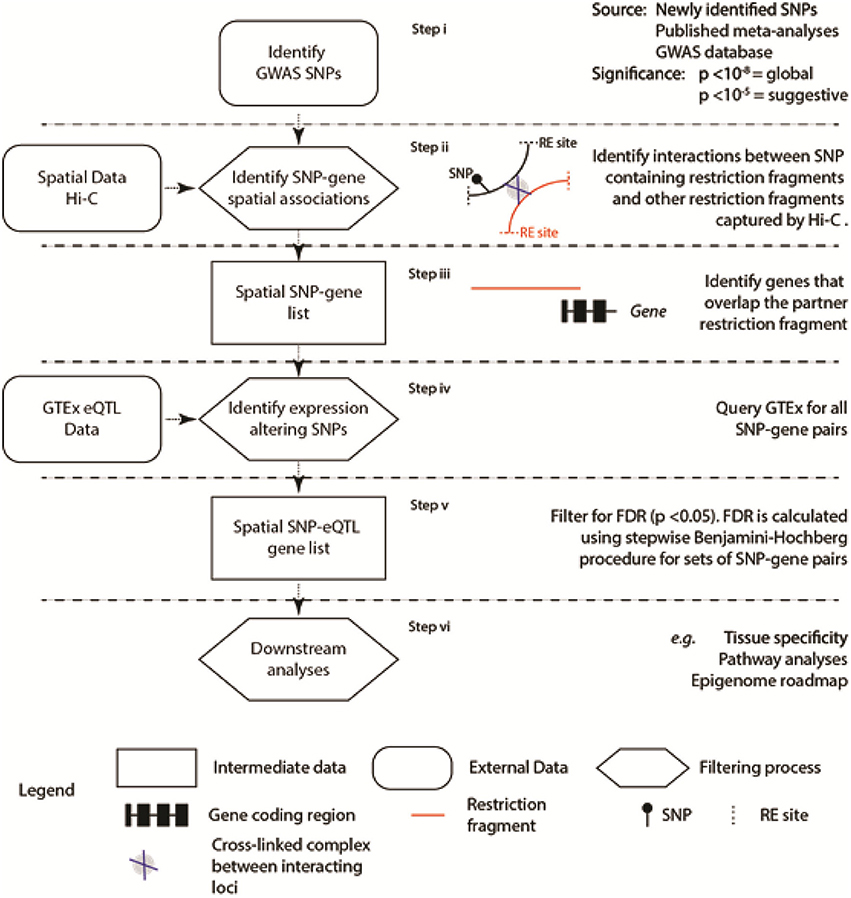
Figure 1. Regulatory SNP-gene interactions that correlate with spatial connections were identified from existing spatial (e.g., Hi-C Rao et al., 2014) and eQTL data (i.e., GTEx Ardlie et al., 2015). Spatial co-localization of the SNP and gene encoding loci is identified from the Hi-C data (Rao et al., 2014) and requires capture of the interaction by proximity-ligation (Step ii). Only genes, determined by the hg19/GRCh37 human genome reference, that overlap the interacting partner locus are included in the analysis. The six stages of the analysis are separated by horizontal dashed lines.
Creation of a single comprehensive database to interrogate the physical and regulatory interactions between loci, located in cis (<1 Mb apart) and trans (>1Mb apart or on different chromosomes), is prohibited by the complexity and continuing evolution of the relevant datasets (Supplementary Table 1). To overcome this, CoDeS3D is a series of modular Python scripts that uses information on the 3-dimensional organization of the genome (i.e., Hi-C data Rao et al., 2014) to identify spatial connections between regulatory regions, which are marked by SNPs, and the gene(s) that they regulate (Figure 1).
The 3-dimensional structure of genomes can be captured by proximity ligation methodologies (Grand et al., 2011) of which Hi-C is one. High resolution Hi-C data (Rao et al., 2014) was used to identify loci that were captured interacting with restriction fragments containing the SNPs of interest (Figure 1 Step ii). These interactions were identified on a presence/absence basis at the restriction fragment level. This approach identifies interacting loci (as defined by the flanking MboI restriction sites Rao et al., 2014) that are spatially co-localized (Figure 1 Step iii). In some instances this spatial co-localization equates to linear co-localization within the genome sequence. The spatial clustering, however, is not limited to loci that map to adjacent regions within the linear sequence, as trans-spatial interactions are readily identified. Finally, genes (as determined by the hg19/GRCh37 human genome reference) had to overlap the partner locus of interest in order to be included in the list of SNP-gene pairs that were identified (Figure 1 Step iii).
These SNP-gene pairs were then tested against the Genotype-Tissue Expression (GTEx) database (Version 4.1, 09/30/16) to identify those where the identity of the base at the SNP position correlated with a change in the mRNA level of the partner gene (i.e., the SNP was an eQTL). The identification of spatial SNP-gene connections is a tool to filter the test set of eQTL regulatory interactions between the physically connected SNP-gene pairs. This approach reduces the number of tests that need to be performed, compared to a systematic approach to identify both cis- and trans-acting eQTLs. The false-discovery rate (FDR, or q-value) is computed for each eQTL SNP-gene-tissue combination, using the p-value list, the number of tests performed, and a stepwise Benjamini-Hochberg correction procedure (Benjamini and Hochberg, 1995). Trans-acting eQTL SNPs are selected as significant if the q-value is <0.05. Cis-acting eQTL SNPs are selected as being significant according to the calculated threshold for each gene. While our FDR thresholds are less stringent than GTEx (cis p-value < 2.5 × 10⁻⁷; trans p-value < 5.0 × 10⁻¹³), the application of a filtering step to remove large numbers of false positives justifies this, as previous work has identified such thresholds as identifying biologically significant associations(Schierding et al., 2016) and SNPs with p values ≤ 0.05 have clear effects on height (Boyle et al., 2017).
Ingenuity® Pathway Analysis
Lists of the genes regulated by loci marked by the eQTL SNPs were analyzed in Ingenuity® Pathway Analysis (IPA®; version 28820210, 2016-09-25) to identify enriched pathways and biological functions.
Results
Diabetes and Obesity Associated SNPs Form Part of a Regulatory Network
We reasoned that GWAS SNPs that are associated with type 2 diabetes and obesity mark regulatory loci that modulate spatially proximal genes and function to control energy balance. Using the CoDeS3D pipeline (Figure 1), we were able to identify 45,517 and 27,778 unique pairs of spatial SNP-gene interactions for 1326 and 483 obesity and diabetes SNPs, respectively (Table 1).
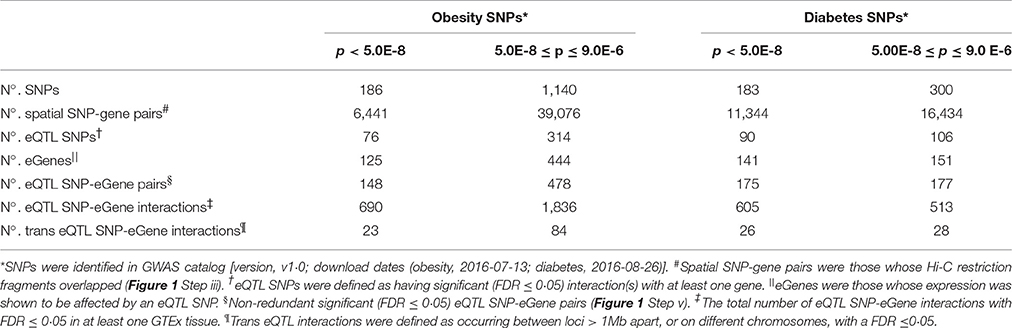
Table 1. Summary of the regulatory network for the obesity and diabetes SNPs analyzed using CoDeS3D.
The identification of SNP-gene interactions reduces the number of tests required to detect eQTL SNPs, the sample sizes, and p-values required for significance. Therefore, we implemented a stepwise Benjamini-Hochberg correction to select significant eQTLs with a q < 0.05. This approach resulted in the identification of 462 cis-acting and 107 trans-acting eQTL SNP-gene pairs for the obesity SNPs, and 238 cis-acting and 54 trans-acting eQTL SNP-gene pairs from the diabetes SNPs (Table 1; Supplementary Figure 1). Obesity eQTL SNP-gene pairs were identified with high significance (p < 7.0 × 10⁻⁵ and p < 7.5 × 10⁻⁵ for the cis- and trans-acting eQTL-SNPs, respectively; Supplementary Spreadsheet 1 doi: 10.17608/k6.auckland.5285038). Similarly, highly significant diabetes cis- and trans-acting eQTL-SNPs were identified (p < 6.0 × 10⁻⁵ and p < 6.0 × 10⁻⁵, respectively; Supplementary Spreadsheet 2 doi: 10.17608/k6.auckland.5285041). Comparisons with the SNP associations in the GWAS catalog indicated that >60% of the eQTL SNP associations have not been previously mapped (Supplementary Figure 2), consistent with previous observations of the accuracy of the “nearest gene” mapping approach for GWAS SNPs (Ardlie et al., 2015).
We used a Monte Carlo method to test for an enrichment for eQTL connections within the diabetes and obesity associated SNPs. eQTLs were identified in 1,000 sets of 483 SNPs that were randomly chosen (with replacement) from a set of 1264: (a) SNPs randomly selected from the Single Nucleotide Polymorphism database (dbSNP build 147, 14/04/2016); and (b) GWAS catalog SNPs that were associated with non-diabetes related traits (Supplementary Table 2). The dbSNP tests resulted in the identification of between 0 and 14 eQTL SNP regions acting on between 0 and 22 genes per set of 483 randomly selected SNPs (Table 2). Notably, the diabetes and non-diabetes associated SNPs identified significantly (t-test p-value < 0.00001) more connections than the dbSNP tests – consistent with a functional role for the regions labeled with these SNPs in phenotype development. Therefore, we conclude that the number of eQTL SNP-gene pairs we observed is significant (p < 0.00001) and unlikely to be due to false positives created from random spatial eQTL connections.
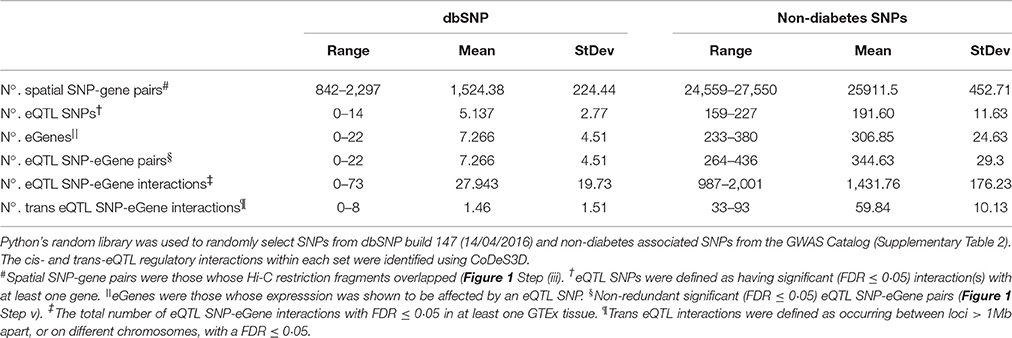
Table 2. A Monte Carlo method was used to analyse the eQTL relationships for 1000 sets of 483 SNPs randomly selected from: (a) dbSNP; and (b) non-diabetes associated SNPs.
Due to the restrictions on Hi-C data resolution, SNPs that were in strong linkage and located on the same restriction enzyme fragment were not separable using CoDeS3D. For example, IRS1 expression is associated with rs1515110, rs2943640 (r2 = 0.85), rs2943641 (r2 = 0.86), rs925735 (r2 = 0.93), and rs2176040 (r2 = 0.87; Table 3). All five of these eQTL SNPs mark an IRS1 regulatory element that is located on a single MboI restriction fragment. Similar effects were observed for the genetic variants that regulate the FADS1 [i.e., rs174541 and rs174550 (r2 = 0.89)], JAZF1 [i.e., rs849134, rs849135 (r2 = 0.95), rs864745 [r2 = 0.97]) and NPC1 [i.e., rs1805081 and rs1808579 (r2 = 0.7) Table 3]. These examples highlight the inappropriateness of annotating one SNP as being causal, with respect to the eQTL, in the absence of additional information that separates the effects of the combinations of linked variants that are within the restriction fragment.
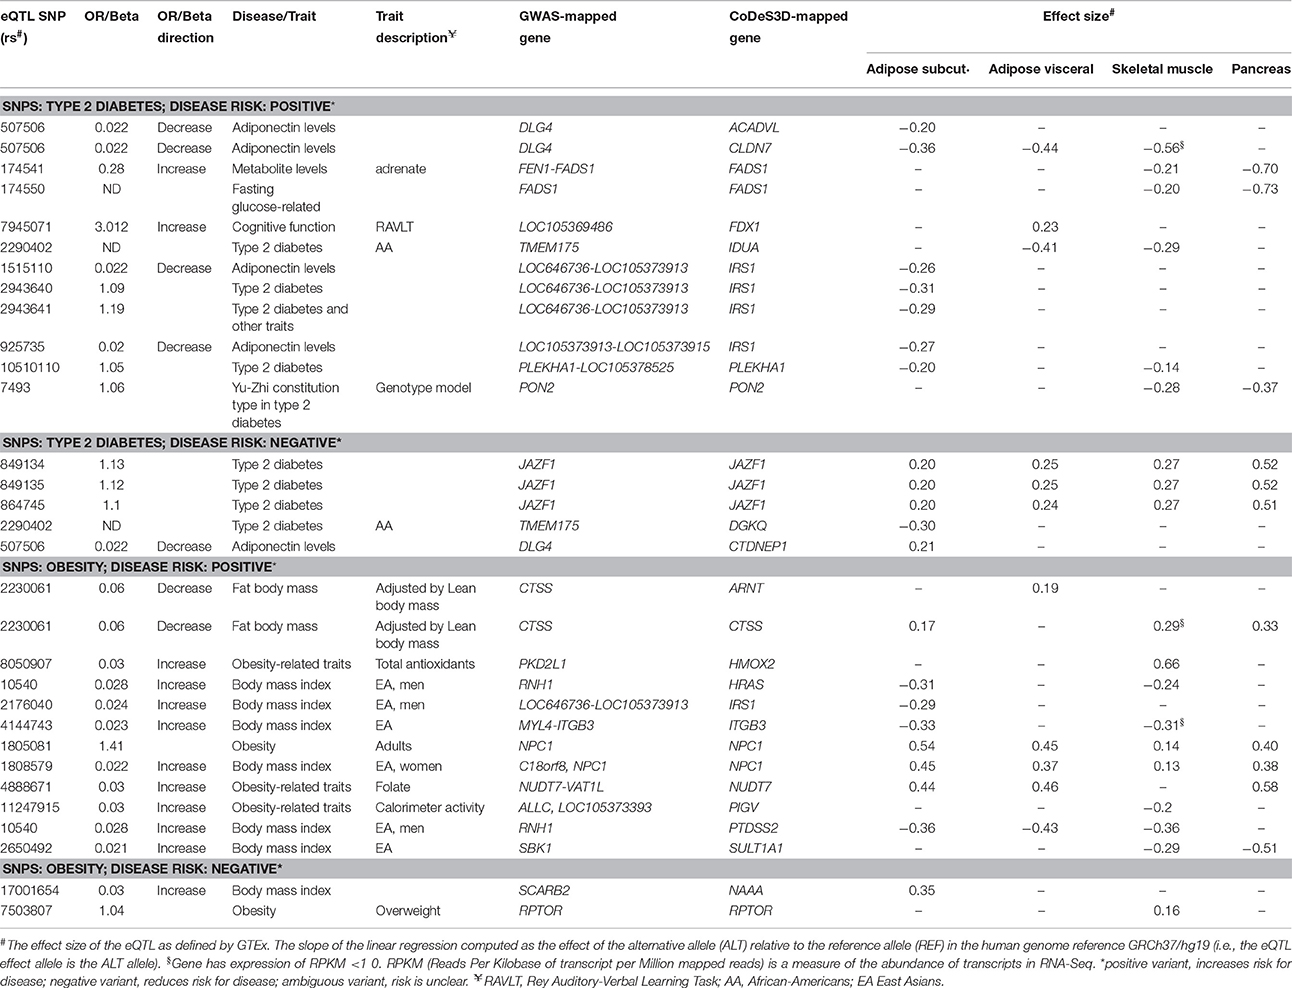
Table 3. Effects of spatial eQTL SNPs on genes involved in lipid metabolism (IPA knowledgebase) that are expressed (RPKM > 1.0) in subcutaneous and visceral adipose, skeletal muscles, and pancreas.
Co-regulation Occurs for Localized Genes
Obesity and diabetes spatial eQTL SNPs mark loci that co-regulate the genes they are in physical proximity with. The obesity SNP rs2710323, together with two diabetes SNPs, rs2590838 (r2, 0.78) and rs1108842 (r2, 0.8), are located in loci that regulate genes (TMEM110, MUSTN1, ITIH4, NEK4, GNL3, PBRM1, and NT5DC2) within a 300 kb genomic region on chromosome 3 (Supplementary Figure 3). SNPs rs2710323, rs2590838, and rs1108842 are located in a region that upregulates TMEM110 and down-regulates NEK4. Although these three SNPs are in high LD and the genes are close together, the effect of the SNPs is gene-specific. For example, the region marked by rs2590838 is associated with down-regulation of the NT5DC2, PBRM1, and NEK4 genes, and upregulation of TMEM110. By contrast, the locus marked by rs1108842 down-regulates the GNL3 and NEK4 genes while upregulating PBRM1 and TMEM110. Finally, the locus marked by rs2710323 down-regulates NEK4 but upregulates the other genes.
Common Variant Association Signals from Different Ethnicities Show Extensive Connectivity
SNPs within the IGF2BP2 gene that were previously identified, by a transancestral GWAS metaanalysis (Horikoshi et al., 2016), as being common in East Asian, European, South Asian, African American, and Mexican American populations were analyzed to determine the pattern of connectedness for these SNPs. The transancestral SNPs were located within a 52,598 bp region spanning the terminal 5′ intron of IGF2BP2 and were involved in cis-eQTLs with IG2FBP2 itself (Supplementary Figure 4). Notably, the trans-acting SNPs (rs13100823, rs11705729, and rs11927381) are in strong LD (>0.97 r2). However, they are located on different MboI restriction fragments (Supplementary Figure 4) and act as eQTLs in a gene and tissue specific manner (Table 4). Trans-acting eQTL SNPs associated with the IGF2BP2 locus were also observed between rs4402960—GRM1 (Chr 6), rs1470579—CCDC14 (Chr 3), and rs1470579—SND1 (Chr 7).

Table 4. Three significant (FDR ≤ 0·05) tissue-specific trans-interactions were identified between eQTL SNPs within the fine-mapped IGF2BP2 region on chromosome and three genes on different chromosomes.
Comorbidity: Pathway Interactions or Shared Genes?
Comorbidity can be explained by direct effects on the same genes or epistatic effects acting through pathways. Notably, only sixteen common genes (Supplementary Table 3) were affected by eQTL SNPs that were linked to obesity and type 2 diabetes (Supplementary Table 4). Of these, only ARAP1 and BRD7 were affected by globally significant SNPs (i.e., rs8050136 and rs11603334) that had previously been associated with both obesity and type 2 diabetes.
eQTL SNP-gene pairs for obesity and type 2 diabetes showed evidence for significant epistatic interactions within the glucose-insulin and leptin signaling pathways (Figure 2). However, the number and distribution of significant eQTL effects (FDR < 0.05) associated with the SNP-gene pairs occurred in a disease and tissue specific manner (Figure 3 and Supplementary Figure 5). The observed tissue specific distribution of the eQTL SNP-gene pairs for the non-diabetes associated SNPs was significantly different to that obtained for the diabetes associated SNPs for all tissues (t-test p-value = 0·001347; Supplementary Figure 6). Restricting the effect to eQTL SNP-gene pairs in which the gene was expressed at >1.0 Read(s) Per Kilobase of transcript per Million mapped reads (RPKM), to reduce the impact of very lowly expressed genes, identified some small differences in the disease and tissue specific distributions of the effects (compare Figure 3 and Supplementary Figure 5).
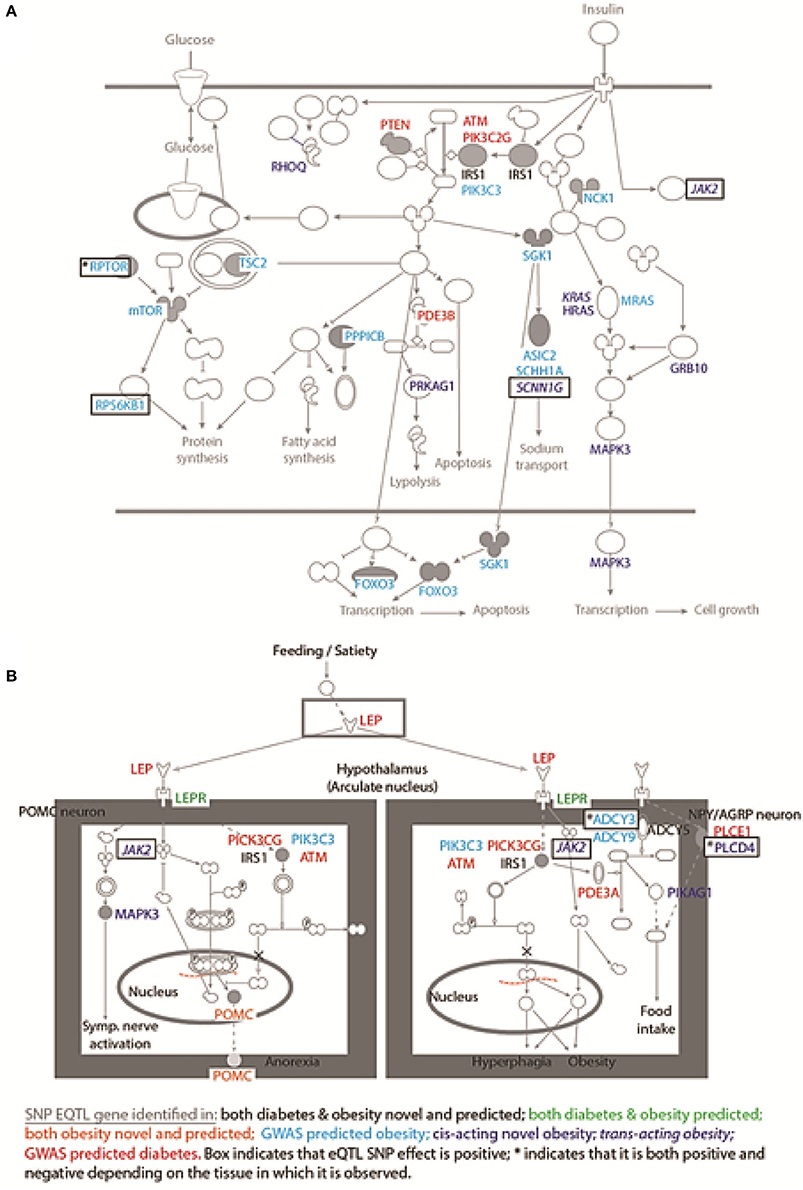
Figure 2. SNPs mark regulatory regions that act to regulate genes within the glucose-insulin and leptin signaling pathways. Novel and predicted eQTL SNP-gene interactions fall within: (A) the glucose-insulin; and (B) the leptin signaling pathways. The dominant effect for the eQTL SNPs is to down-regulate the gene transcript level, consistent with the SNP falling within an enhancer region. Novel eQTL SNP-gene pairs contribute numerous regulatory interactions to both pathways including: trans-regulatory connections (e.g., JAK2); and combined action on single genes (i.e., IRS1 and POMC).
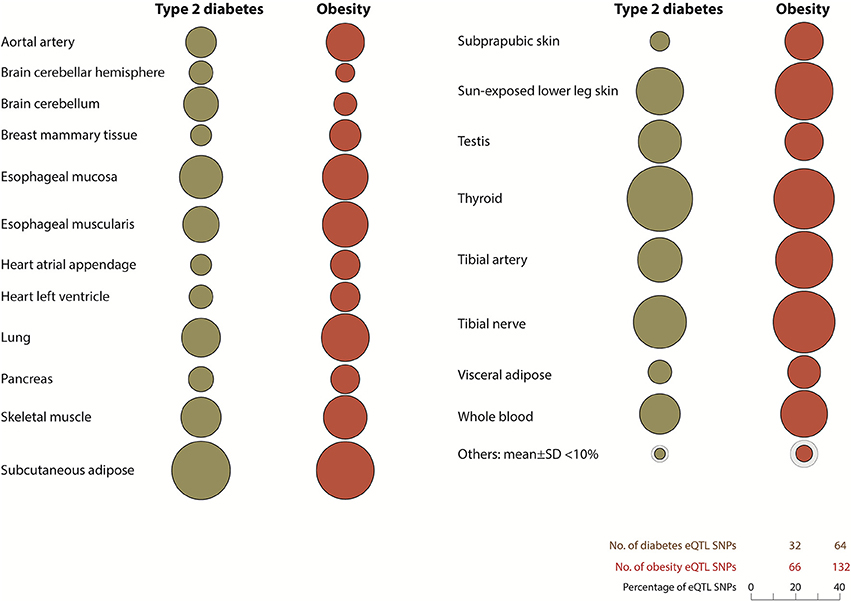
Figure 3. Diabetes and obesity disease-associated spatial SNPs with significant eQTL effects (FDR > 0.05) are unevenly distributed throughout human tissues. Tissues with <10% total number of spatial eQTL SNPs in type 2 diabetes and obesity include the liver (1.3, 3.9%), stomach (7.5, 9.7%), and pituitary gland (8.1, 8.2%) respectively. Other tissues: adrenal gland, atrial aorta, coronary artery, brain - anterior cingulate cortex (BA24), brain - caudate basal ganglia, brain - cortex, brain - frontal cortex (BA9), brain - hippocampus, brain - hypothalamus, brain - nucleus accumbens basal ganglia, brain - putamen basal ganglia, breast - mammary tissue, sigmoid colon, transverse colon, gastroesophageal junction, liver, ovary, pituitary, prostrate, spleen, stomach, testis, uterus, and vagina. All eQTL SNP-genes included in this analysis were expressed with an RPKM of >1.0 (GTEx version 4.1, accessed on 09/30/16).
The disease and tissue specificity of the spatial eQTL SNP-gene pairs can be further classified according to the metabolic function(s) that the interacting gene is involved in (Supplementary Table 5). Analysis using the curated IPA knowledgebase identified enrichment for genes involved in lipid metabolism in the following tissues: adipose (p < 3.07 × 10⁻²), skeletal muscle (p < 1.57 × 10⁻²), and pancreas (p < 4.93 × 10⁻²; Supplementary Spreadsheet 3 doi: 10.17608/k6.auckland.5285044). Notably, there was no enrichment for eQTL SNP-gene pairs involving genes for lipid metabolism within the liver.
SNPs associated with fasting insulin-based measures of insulin resistance have previously been linked to a reduction in subcutaneous adipose tissue and adverse metabolic profiles (Yaghootkar et al., 2014). Re-analysis of these SNPs, using our approach, revealed that they mark loci that spatially regulate genes in tissues central to metabolism including subcutaneous adipose, visceral adipose, and thyroid (Supplementary Table 6). The strength of our integrative approach is again highlighted as 14 of the spatially regulated genes were not previously associated with the SNPs but may contribute to the mechanistic interpretation of metabolic dysfunction e.g., PPA2, a negative regulator of the insulin metabolic signaling pathway and CCTN2, a regulator of leptin (Ugi et al., 2004) and ADIPOQ (Broholm et al., 2016).
Discussion
Here we identify the functional effects of loci marked by SNPs associated with diabetes and/or obesity. Our results identify differential regulation of genes by loci marked by diabetes and obesity associated spatial eQTL SNPs. These regulatory interactions occur in a disease and tissue specific manner. We identify sets of eQTLs in tissues that are known to be involved in energy homeostasis and adiposity (e.g., thyroid Milionis and Milionis, 2013 and subcutaneous adipose Lee et al., 2013). We also identify sets of eQTLs in tissues that are not classically associated with diabetes or obesity. Our findings are consistent with the diabetes and obesity associated genetic variants acting in an individual, tissue, and developmental stage-specific manner.
The identification of SNP-gene pairs is central to our approach to integrate these orthogonal data sets. To do this we rely upon high-resolution (i.e., 1 kb) Hi-C data captured from eight non-synchronized immortalized human cell lines (Supplementary Table 1). It can be argued that the identification of these SNP-gene interactions should incorporate a measure of the significance of the Hi-C data. However, there is: (a) a high level of conservation of topologically associated domains between cell lines and lineages (Dixon et al., 2015); and (b) Hi-C contacts captured from a population of cells represent a stochastic structure in which permissible interactions occur at a detectable frequency even when they are not the dominant interactions (Nagano et al., 2013). Thus, we contend that the interactions that we used represent those that are capable of forming within the human genome. Despite this, it is clear that trans interactions show much greater cell-type specificity. Therefore, future work should incorporate tissue and developmental stage specific Hi-C maps into the analysis to ensure the complete identification of all possible SNP-gene pairs.
The eQTL SNP-gene connections we described were identified across and not within a single population. This complication arose because the Hi-C cell lines and GTEx data we used were not generated from the same samples. While this may be suboptimal, we contend that previous transferability studies have identified common genetic variants that have regular effects across populations (Waters et al., 2010; Saxena and Palmer, 2016). Consistent with this, we identified a series of regulatory connections that involved previously identified fine-mapped transancestral SNPs within intron 1 of the IGF2BP2 locus (Horikoshi et al., 2016). In addition to strong zones of cis-regulation of IGF2BP2 itself, three of the transancestral eQTL SNPs within intron 1 of IGF2BP2 regulate diabetes and obesity related genes in trans (i.e., RBM47 Benton et al., 2015, KIAA1430 Sandholm et al., 2017, and DIS3L2 Kim et al., 2010). Notably, the cis eQTLs affect the thyroid, while trans eQTLs affect the lung, hypothalamus and whole blood tissues. Despite the fact that there is no Hi-C data that identifies race specific changes in genome organization, the identification of effects associated with transancestral SNPs is consistent with allele frequencies impacting on elements responsible for the formation, maintenance, or regulatory outcomes of SNP-gene interactions. Therefore, allele frequency dependent changes to tissue specific eQTL distributions may contribute to race specific differences in the development and progression of diabetes and obesity. As such, it is important to match samples and integrate the Minor Allele Frequencies (MAFs) of the variants (Auton et al., 2015) into future investigations.
The etiological association of diabetes and obesity spatial eQTLs can follow any of the four described models for comorbidity pathways (Valderas et al., 2009): (1) the direct causation model where the genetic variants for one disease directly cause the second disease; (2) the association model, in which the genetic variants for the two diseases are correlated and thus increase the likelihood of the diseases occurring simultaneously; (3) the heterogeneity model, whereby the genetic variants are uncorrelated but each can cause the comorbid diseases; or (4) the independence model, in which the comorbid diseases arise as a result of a third distinct disease condition. We observed a low direct overlap between the eQTLs for type 2 diabetes and obesity. Yet, regions marked by obesity and type 2 diabetes SNPs were associated with numerous significant regulatory impacts on genes within the glucose-insulin and leptin signaling pathways. These observations are consistent with the rewiring of physical and genetic interaction networks across complex disease conditions (Muoio and Newgard, 2008; Hou et al., 2014; Hu et al., 2016; Boyle et al., 2017). Collectively our results indicate that the comorbidity pathway for diabetes and obesity is likely due to the combined effect of correlated changes within pathways and tissues.
The tissue specificity of the regulatory effects we identified is consistent with current observations of the dynamic changes that occur within the local and global landscapes of genome organization in different cell types (Dixon et al., 2015; Doynova et al., 2016). The partitioning we observed for the diabetes and obesity associated SNPs was significantly different to the tissue-specific profiles for non-diabetes associated SNPs (p < 0.001). This finding reinforces the high discovery potential of integrating diverse sets of partially orthogonal data. This is particularly pertinent for polygenic type 2 diabetes and obesity where the metabolic dysbiosis is associated with a fundamental breakdown in the ability of the body to maintain and regulate a stable equilibrium for energy metabolism. The increased numbers of obesity eQTLs may reflect the fact that obesity can result from perturbations to a greater number of pathways, or at more points within these pathways, than diabetes. However, the absolute number of eQTL SNP-gene pairs that are influencing gene regulation in a particular tissue is not necessarily a direct measure of the significance of the changes for either diabetes or obesity.
We undertook a discovery approach that makes no a priori assumption of tissue relevance. This was necessary because the GTEx database is a growing resource that does not currently include all the tissues that are classically considered “relevant” to the pathogenesis of Type 2 diabetes or obesity. The utility of our discovery-based approach is reinforced by studies on Huntington's disease that have identified pre-pathology changes in tissues, which were not previously associated with the pathogenesis or progression of Huntington's disease (Carroll et al., 2015). Treatment of these tissue specific changes are therapeutically possible, can delay onset and improve quality of life for Huntington's carriers. Therefore, the incorporation of tissues that are not classically associated with diabetes or obesity into our analysis potentially informs on system-wide changes that contribute to the development of the disorders. Future expansion to cell-type specific data that overcomes mRNA averaging effects is important. However, these approaches also suffer from limitations caused by the artificial nature of the environment, lack of appropriate cell-to-cell communication, and tissue manipulation etc. Future work aimed at understanding how SNPs contribute to these disorders through specific pathological pathways, for example impacts on the insulin secreting islets that constitute <1% of the pancreas, will require an approach that integrates cellular and tissue specific understandings.
Our results provide novel insights into the separate roles of different adipose repositories in the development of the metabolic syndrome (Lee et al., 2013; Neeland et al., 2013; Liesenfeld et al., 2015; Tahara et al., 2015). For example, the adipose expandability hypothesis attempts to explain the well-known differential effects of subcutaneous and visceral fat on diabetes and obesity. This hypothesis posits that the capacity of subcutaneous adipose to store fat and modulate circulating adipokines can be exceeded, after which adipokine derangements and ectopic fat deposition occur (Tan and Vidal-Puig, 2008; Lagathu et al., 2010; Cuthbertson et al., 2017). Thus, our observation that subsets of population level diabetes and obesity associated SNPs impact on gene expression within the subcutaneous fat, potentially altering its capacity to store fat and moderate levels of circulating adipokines, is notable. Specific individuals contain different combinations of SNPs. Thus, it is possible that genotype specific combinations of diabetes and obesity associated SNPs, which mark regulatory regions that have negative effects on lipid related gene expression within subcutaneous fat, can partially explain individual responses. Unlike single gene disorders, loss of regulatory responsiveness need not be catastrophic but may lead to a small but compounding increased risk over an individual's lifetime. eQTL SNP-gene interactions occurring in other tissues critical to metabolic control (e.g., pancreatic cells; Figure 4) can increase this risk further.
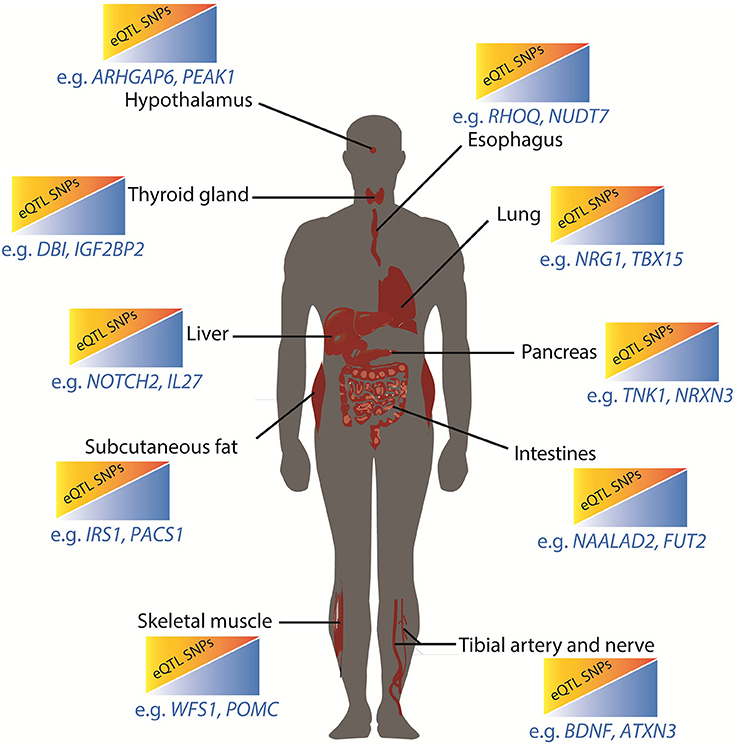
Figure 4. Metabolic restriction model for integrated effects of diabetes and obesity associated SNPs. In this model, increasing the number of obesity and type 2 diabetes associated eQTL SNP-gene interactions in critical tissues results in small but cumulative increases in risk due to reductions in capacity to respond to peak energy supply. Genes that are subject to tissue specific eQTL effects are annotated. The esophagus, lungs, and tibial artery and nerve do not have established roles in the regulation of metabolic functions although there are associations between these organs (or their dysfunction) and diabetes and obesity.
In conclusion, we propose that the identity and number of obesity and diabetes spatial eQTL SNP-gene pairs that are active within different tissues reduces the ability of these tissues to contribute to the maintenance of a healthy energy metabolism (Figure 4). Environmental conditions, including absolute levels of food and exercise, can moderate this genetic risk. Thus, the clinical risk for polygenic disorders is the sum result of the gene-environment interactions that occur within the context of a four-dimensional regulatory network that is “tuned” by the combinatorial action of regulatory sites that spatially cluster and are subject to genetic variation. Future personalized studies that integrate an individual's tissue specific eQTL profile with longitudinal measurements of clinical biomarkers of type 2 diabetes and obesity will clarify the different mechanisms that contribute to the development and apparent paradoxes that are associated with these disorders.
Author Contributions
CE wrote CoDeS3D. TF ran analyses, contributed to the software, interpreted data and co-wrote the manuscript. JI participated in discussions and commented on the manuscript, WS contributed to data interpretation and commented on the manuscript, JO directed the study, contributed to data interpretation and co-wrote the manuscript. JO is guarantor for this article.
Funding
This work was funded by High Value Nutrition National Science (MBIE/HVN grant #3710040) to JI, JO, and TF, HRC explorer (15/604) to JO and a University of Auckland Scholarship to WS.
Conflict of Interest Statement
The authors declare that the research was conducted in the absence of any commercial or financial relationships that could be construed as a potential conflict of interest.
Acknowledgments
The authors would like to thank Peter Shepherd, Rod McNab, Phil Smith, and Rinki Murphy for comments on this manuscript.
Supplementary Material
The Supplementary Material for this article can be found online at: https://www.frontiersin.org/articles/10.3389/fgene.2017.00150/full#supplementary-material
References
Ardlie, K. G., Deluca, D. S., Segre, A. V., Sullivan, T. J., Young, T. R., Gelfand, E. T., et al. (2015). The Genotype-Tissue Expression (GTEx) pilot analysis: Multitissue gene regulation in humans. Science 348, 648–660. doi: 10.1126/science.1262110
Auton, A., Abecasis, G. R., Altshuler, D. M., Durbin, R. M., Abecasis, G. R., Bentley, D. R., et al. (2015). A global reference for human genetic variation. Nature, 526, 68–74. doi: 10.1038/nature15393
Benjamini, Y., and Hochberg, Y. (1995). Controlling the false discovery rate : a practical and powerful approach to multiple testing author (s): Yoav Benjamini and Yosef Hochberg Source : J. R. Stat. Soc. B 57, 289–300.
Benton, M. C., Johnstone, A., Eccles, D., Harmon, B., Hayes, M. T., Lea, R. A., et al. (2015). An analysis of DNA methylation in human adipose tissue reveals differential modification of obesity genes before and after gastric bypass and weight loss. Genome Biol. 16:8. doi: 10.1186/s13059-014-0569-x
Bolzer, A., Kreth, G., Solovei, I., Koehler, D., Saracoglu, K., Fauth, C., et al. (2005). Three-dimensional maps of all chromosomes in human male fibroblast nuclei and prometaphase rosettes. PLoS Biol. 3:e157. doi: 10.1371/journal.pbio.0030157
Boyle, E. A., Li, Y. I., and Pritchard, J. K. (2017). An expanded view of complex traits: from polygenic to omnigenic. Cell 169, 1177–1186. doi: 10.1016/j.cell.2017.05.038
Broholm, C., Olsson, A. H., Perfilyev, A., Hansen, N. S., Schrölkamp, M., Strasko, K. S., et al. (2016). Epigenetic programming of adipose-derived stem cells in low birthweight individuals. Diabetologia 59, 2664–2673. doi: 10.1007/s00125-016-4099-9
Carroll, J. B., Bates, G. P., Steffan, J., Saft, C., and Tabrizi, S. J. (2015). Treating the whole body in Huntington's disease. Lancet Neurol. 14, 1135–1142. doi: 10.1016/S1474-4422(15)00177-5
Cuthbertson, D. J., Steele, T., Wilding, J. P., Halford, J. C. G., Harrold, J. A., Hamer, M., et al. (2017). What have human experimental overfeeding studies taught us about adipose tissue expansion and susceptibility to obesity and metabolic complications? Int. J. Obes. 41, 853–865. doi: 10.1038/ijo.2017.4
Dixon, J. R., Jung, I., Selvaraj, S., Shen, Y., Antosiewicz-Bourget, J. E., Lee, A. Y., et al. (2015). Chromatin architecture reorganization during stem cell differentiation. Nature 518, 331–336. doi: 10.1038/nature14222
Dixon, J. R., Selvaraj, S., Yue, F., Kim, A., Li, Y., Shen, Y., et al. (2012). Topological domains in mammalian genomes identified by analysis of chromatin interactions. Nature 485, 376–380. doi: 10.1038/nature11082
Doynova, M. D., Berretta, A., Jones, M. B., Jasoni, C. L., Vickers, M. H., and O'Sullivan, J. M. (2016). Interactions between mitochondrial and nuclear DNA in mammalian cells are non-random. Mitochondrion 30, 187–196. doi: 10.1016/j.mito.2016.08.003
Doynova, M. D., Markworth, J. F., Cameron-Smith, D., Vickers, M. H., and O'Sullivan, J. M. (2017). Linkages between changes in the 3D organization of the genome and transcription during myotube differentiation in vitro. Skeletal Muscle 7:5. doi: 10.1186/s13395-017-0122-1
Farh, K. K., Marson, A., Zhu, J., Kleinewietfeld, M., Housley, W. J., Beik, S., et al. (2015). Genetic and epigenetic fine mapping of causal autoimmune disease variants. Nature 518, 337–343. doi: 10.1038/nature13835
Franzen, O., Ermel, R., Cohain, A., Akers, N. K., Di Narzo, A., Talukdar, H. A., et al. (2016). Cardiometabolic risk loci share downstream cis- and trans-gene regulation across tissues and diseases. Science 353, 827–830. doi: 10.1126/science.aad6970
Fraser, J., Ferrai, C., Chiariello, A. M., Schueler, M., Rito, T., Laudanno, G., et al. (2015). Hierarchical folding and reorganization of chromosomes are linked to transcriptional changes in cellular differentiation. Mol. Sys. Biol. 11, 852–852. doi: 10.15252/msb.20156492
Grand, R. S., Gehlen, L. R., and O'Sullivan, J. M. (2011). “Methods for the investigation of chromosome organization,” in Advances in Genetics Research, Vol. 5, ed K. V. Urbano (New York, NY: NOVA), 111–129.
Horikoshi, M., Pasquali, L., Wiltshire, S., Huyghe, J. R., Mahajan, A., Asimit, J. L., et al. (2016). Transancestral fine-mapping of four type 2 diabetes susceptibility loci highlights potential causal regulatory mechanisms. Hum. Mol. Genet. 25, 2070–2081. doi: 10.1093/hmg/ddw048
Hou, L., Chen, M., Zhang, C. K., Cho, J., and Zhao, H. (2014). Guilt by rewiring: gene prioritization through network rewiring in genome wide association studies. Hum. Mol. Genet. 23, 2780–2790. doi: 10.1093/hmg/ddt668
Hu, J. X., Thomas, C. E., and Brunak, S. (2016). Network biology concepts in complex disease comorbidities. Nat. Rev. Genet. 17, 615–629. doi: 10.1038/nrg.2016.87
Jo, B., He, Y., Strober, B. J., Parsana, P., Aguet, F., Brown, A. A., and Battle, A. (2016). Distant regulatory effects of genetic variation in multiple human tissues. bioRxiv. doi: 10.1101/074419
Kim, J.-Y., Namkung, J.-H., Lee, S.-M., and Park, T.-S. (2010). Application of structural equation models to genome-wide association analysis. Genomics Informatics 8, 150–158. doi: 10.5808/GI.2010.8.3.150
Krijger, P. H. L., Di Stefano, B., de Wit, E., Limone, F., van Oevelen, C., de Laat, W., et al. (2016). Cell-of-origin-specific 3D genome structure acquired during somatic cell reprogramming. Cell Stem Cell 18, 597–610. doi: 10.1016/j.stem.2016.01.007
Lagathu, C., Christodoulides, C., Tan, C. Y., Virtue, S., Laudes, M., Campbell, M., et al. (2010). Secreted frizzled-related protein 1 regulates adipose tissue expansion and is dysregulated in severe obesity. Int. J. Obes. 34, 1695–1705. doi: 10.1038/ijo.2010.107
Lee, M.-J., Wu, Y., and Fried, S. K. (2013). Adipose tissue heterogeneity: Implication of depot differences in adipose tissue for obesity complications. Mol. Aspects Med. 34, 1–11. doi: 10.1016/j.mam.2012.10.001
Liesenfeld, D. B., Grapov, D., Fahrmann, J. F., Salou, M., Scherer, D., Toth, R., et al. (2015). Metabolomics and transcriptomics identify pathway differences between visceral and subcutaneous adipose tissue in colorectal cancer patients: the ColoCare study. Am. J. Clin. Nutr. 102, 433–443. doi: 10.3945/ajcn.114.103804
Milionis, A., and Milionis, C. (2013). Correlation between Body mass index and thyroid function in euthyroid individuals in greece. ISRN Biomark. 2013, 1–7. doi: 10.1155/2013/651494
Muoio, D. M., and Newgard, C. B. (2008). Mechanisms of disease: molecular and metabolic mechanisms of insulin resistance and β-cell failure in type 2 diabetes. Nat. Rev. Mol. Cell Biol. 9, 193–205. doi: 10.1038/nrm2327
Nagano, T., Lubling, Y., Stevens, T. J., Schoenfelder, S., Yaffe, E., Dean, W., and Fraser, P. (2013). Single-cell Hi-C reveals cell-to-cell variability in chromosome structure. Nature 502, 59–64. doi: 10.1038/nature12593
Neeland, I. J., Ayers, C. R., Rohatgi, A. K., Turer, A. T., Berry, J. D., Das, S. R., and de Lemos, J. A. (2013). Associations of visceral and abdominal subcutaneous adipose tissue with markers of cardiac and metabolic risk in obese adults. Obesity 21, E439–E47. doi: 10.1002/oby.20135
Parada, L. A., McQueen, P. G., and Misteli, T. (2004). Tissue-specific spatial organization of genomes. Genome Biol. 5:R44. doi: 10.1186/gb-2004-5-7-r44
Pigeyre, M., Yazdi, F. T., Kaur, Y., and Meyre, D. (2016). Recent progress in genetics, epigenetics and metagenomics unveils the pathophysiology of human obesity. Clin. Sci. 130, 943–986. doi: 10.1042/CS20160136
Pombo, A., and Dillon, N. (2015). Three-dimensional genome architecture: players and mechanisms. Nat. Rev. Mol. Cell Biol. 16, 245–257. doi: 10.1038/nrm3965
Pullinger, C. R., Goldfine, I. D., Tanyolaç, S., Movsesyan, I., Faynboym, M., Durlach, V., et al. (2014). Evidence that an HMGA1 gene variant associates with type 2 Diabetes, body mass index, and high-density lipoprotein cholesterol in a hispanic-american population. Metab. Syndr. Relat. Disord. 12, 25–30. doi: 10.1089/met.2013.0086
Rao, S. S. P., Huntley, M. H., Durand, N. C., Stamenova, E. K., Bochkov, I. D., Robinson, J. T., et al. (2014). A 3D map of the human genome at kilobase resolution reveals principles of chromatin looping. Cell 159, 1665–1680. doi: 10.1016/j.cell.2014.11.021
Sandholm, N., Van Zuydam, N., Ahlqvist, E., Juliusdottir, T., Deshmukh, H. A., Rayner, N. W., et al. (2017). The genetic landscape of renal complications in type 1 diabetes. J. Am. Soc. Nephrol. 28, 557–574. doi: 10.1681/ASN.2016020231
Sanghera, D. K., and Blackett, P. R. (2012). Type 2 diabetes genetics: beyond GWAS. J. Diabetes Metab. 3:198. doi: 10.4172/2155-6156.1000198
Saxena, R., and Palmer, N. D. (2016). “Transferability across ethnic groups,” in The Genetics of Type 2 Diabetes and Related Traits, ed J. C. Florez (Cham: Springer International Publishing), 183–206.
Schierding, W., Antony, J., Cutfield, W. S., Horsfield, J. A., and O'Sullivan, J. M. (2016). Intergenic GWAS SNPs are key components of the spatial and regulatory network for human growth. Hum. Mol. Genet. 25, 3372–3382. doi: 10.1093/hmg/ddw165
Solovei, I., Kreysing, M., Lanctôt, C., Kösem, S., Peichl, L., Cremer, T., et al. (2009). Nuclear architecture of rod photoreceptor cells adapts to vision in mammalian evolution. Cell 137, 356–368. doi: 10.1016/j.cell.2009.01.052
Speliotes, E. K., Willer, C. J., Berndt, S. I., Monda, K. L., Thorleifsson, G., Jackson, A. U., et al. (2010). Association analyses of 249,796 individuals reveal 18 new loci associated with body mass index. Nat. Genet. 42, 937–948. doi: 10.1038/ng.686
Tahara, N., Yamagishi, S., Kodama, N., Tahara, A., Honda, A., Nitta, Y., et al. (2015). Clinical and biochemical factors associated with area and metabolic activity in the visceral and subcutaneous adipose tissues by FDG-PET/CT. J. Clin. Endocrinol. Metab. 100, E739–E747. doi: 10.1210/jc.2014-3896
Tan, C. Y., and Vidal-Puig, A. (2008). Adipose tissue expandability: the metabolic problems of obesity may arise from the inability to become more obese. Biochem. Soc. Trans. 36, 935–940. doi: 10.1042/BST0360935
Ugi, S., Imamura, T., Maegawa, H., Egawa, K., Yoshizaki, T., Shi, K., et al. (2004). Protein Phosphatase 2A negatively regulates insulin's metabolic signaling pathway by inhibiting Akt (Protein Kinase B) activity in 3T3-L1 adipocytes. Mol. Cell. Biol. 24, 8778–8789. doi: 10.1128/MCB.24.19.8778-8789.2004
Valderas, J. M., Starfield, B., Sibbald, B., Salisbury, C., and Roland, M. (2009). Defining comorbidity: implications for understanding health and health services. Annals Family Med. 7, 357–363. doi: 10.1370/afm.983
Waters, K. M., Stram, D. O., Hassanein, M. T., Le Marchand, L., Wilkens, L. R., Maskarinec, G., et al. (2010). Consistent association of type 2 diabetes risk variants found in europeans in diverse racial and ethnic groups. PLoS Genet. 6:e1001078. doi: 10.1371/journal.pgen.1001078
Won, H., de la Torre-Ubieta, L., Stein, J. L., Parikshak, N. N., Huang, J., Opland, C. K., et al. (2016). Chromosome conformation elucidates regulatory relationships in developing human brain. Nature 538, 523–527. doi: 10.1038/nature19847
Yaghootkar, H., Scott, R. A., White, C. C., Zhang, W., Speliotes, E., Munroe, P. B., et al. (2014). Genetic evidence for a normal-weight “metabolically obese” phenotype linking insulin resistance, hypertension, coronary artery disease, and type 2 diabetes. Diabetes 63, 4369–4377. doi: 10.2337/db14-0318
Keywords: Obesity and type-2 diabetes co-morbidity, spatial gene regulation, eQTLs, GWAS risk variants, Hi-C
Citation: Fadason T, Ekblad C, Ingram JR, Schierding WS and O'Sullivan JM (2017) Physical Interactions and Expression Quantitative Traits Loci Identify Regulatory Connections for Obesity and Type 2 Diabetes Associated SNPs. Front. Genet. 8:150. doi: 10.3389/fgene.2017.00150
Received: 30 July 2017; Accepted: 28 September 2017;
Published: 13 October 2017.
Edited by:
Antonio Brunetti, Magna Græcia University, ItalyReviewed by:
Sinan Tanyolac, Istanbul University, TurkeyGuoqiang Gu, Vanderbilt University, United States
Copyright © 2017 Fadason, Ekblad, Ingram, Schierding and O'Sullivan. This is an open-access article distributed under the terms of the Creative Commons Attribution License (CC BY). The use, distribution or reproduction in other forums is permitted, provided the original author(s) or licensor are credited and that the original publication in this journal is cited, in accordance with accepted academic practice. No use, distribution or reproduction is permitted which does not comply with these terms.
*Correspondence: Justin M. O'Sullivan, anVzdGluLm9zdWxsaXZhbkBhdWNrbGFuZC5hYy5ueg==
†These authors have contributed equally to this work.