 Ermin Wang
 Hainan Zhao1
- 1Department of Nephrology, The First Affiliated Hospital, Jinzhou Medical University, Jinzhou, China
- 2Jinzhou Medical University, Jinzhou, China
The genetic predisposition to chronic kidney disease (CKD) has been widely evaluated especially using the genome-wide association studies, which highlighted some novel genetic susceptibility variants in many genes, and estimated glomerular filtration rate to diagnose and stage CKD. Of these variants, rs7805747 in PRKAG2 was identified to be significantly associated with both serum creatinine and CKD with genome wide significance level. Until now, the potential mechanism by which rs7805747 affects CKD risk is still unclear. Here, we performed a functional analysis of rs7805747 variant using multiple bioinformatics software and databases. Using RegulomeDB and HaploReg (version 4.1), rs7805747 was predicated to locate in enhancer histone marks (Liver, Duodenum Mucosa, Fetal Intestine Large, Fetal Intestine Small, and Right Ventricle tissues). Using GWAS analysis in PhenoScanner, we showed that rs7805747 is not only associated with CKD, but also is significantly associated with other diseases or phenotypes. Using metabolite analysis in PhenoScanner, rs7805747 is identified to be significantly associated with not only the serum creatinine, but also with other 16 metabolites. Using eQTL analysis in PhenoScanner, rs7805747 is identified to be significantly associated with gene expression in multiple human tissues and multiple genes including PRKAG2. The gene expression analysis of PRKAG2 using 53 tissues from GTEx RNA-Seq of 8555 samples (570 donors) in GTEx showed that PRKAG2 had the highest median expression in Heart-Atrial Appendage. Using the gene expression profiles in human CKD, we further identified different expression of PRKAG2 gene in CKD cases compared with control samples. In summary, our findings provide new insight into the underlying susceptibility of PRKAG2 gene to CKD.
Introduction
Chronic kidney disease (CKD) is a major global problem caused by the permanent loss of kidney function, and is also associated with an increased risk for cardiovascular disease (Cusumano and Gonzalez Bedat, 2008; Prodjosudjadi et al., 2009; Chambers et al., 2010; Shinohara, 2010; Sherwood and McCullough, 2016; James et al., 2017; Malhotra et al., 2017; Sinha and Bagga, 2018). The overall prevalence of CKD exceeds 10%, and is approximately 14% in the general population and its incidence is increasing (Almirall, 2016; Hursitoglu, 2016; Mills and He, 2016; Wuttke and Kottgen, 2016; Hedayati et al., 2017; James et al., 2017; Clark et al., 2018). It is reported that up to 20% of CKD cases are caused by genetic forms of renal disease (Almirall, 2016; Hursitoglu, 2016; Mills and He, 2016; Wuttke and Kottgen, 2016; Hedayati et al., 2017; James et al., 2017; Clark et al., 2018). Understanding genetic predisposition to CKD and uncovering underlying pathophysiological mechanisms may contribute to the development of targeted therapies. In recent years, the genetic predisposition to CKD has been widely evaluated especially using the genome-wide association studies (GWAS), which highlighted some novel genetic susceptibility variants in many genes, and estimated glomerular filtration rate to diagnose and stage CKD (Pattaro et al., 2016; Wuttke and Kottgen, 2016).
In these CKD risk genes, a genetic variant rs7805747 in PRKAG2 was identified to be significantly associated with both serum creatinine and CKD with genome wide significance level (Chambers et al., 2010). The rs7805747 (chr7:151407801 for hg19) variant is located in intronic of PRKAG2. PRKAG2 is a protein coding gene. Until now, the potential mechanism by which rs7805747 affects CKD risk is still unclear. It is difficult to identify the function of coding and non-coding genes in molecular wet laboratories. However, computational methods including kinds of bioinformatics software and databases may be useful tools to guide and predict function (Zou et al., 2016; Wan and Zou, 2017; Wan et al., 2017; Wei et al., 2017a,b; He et al., 2018a,b; Jia et al., 2018a,b; Jiang et al., 2018; Zeng et al., 2018). Here, we performed a functional analysis of rs7805747 variant using multiple bioinformatics databases including RegulomeDB (Boyle et al., 2012), HaploReg (version 4.1) (Ward and Kellis, 2016), PhenoScanner (version 1.1) (Staley et al., 2016), and UCSC Genome Browser (Rosenbloom et al., 2015; Tyner et al., 2017; Casper et al., 2018), as did in previous studies (Lu et al., 2011; Rhie et al., 2013; Hazelett et al., 2014; Liu et al., 2016, 2017a,b,c,d,e, 2018b; Guo et al., 2017; Hu et al., 2017a,b; Jiang et al., 2017; Zhang et al., 2018). Meanwhile, we analyzed a whole genome case-control expression profiles in human CKD to investigate whether the susceptibility gene PRKAG2 is differently expressed in CKD cases compared with control samples.
Materials and Methods
Regulatory Analysis of rs7805747 Using RegulomeDB
RegulomeDB database could annotate genetic variants with known and predicted regulatory elements in the intergenic regions of the human genome (Boyle et al., 2012). In brief, the known and predicted regulatory DNA elements include regions of DNAase hypersensitivity, binding sites of transcription factors, and promoter regions that have been biochemically characterized to regulation transcription (Boyle et al., 2012). These regulatory element datasets are from Gene Expression Omnibus (GEO), the Encyclopedia of DNA Elements (ENCODE) project, and published literature (Boyle et al., 2012).
Functional Analysis of rs7805747 Using HaploReg
HaploReg is a tool for exploring annotations of the non-coding variants (Ward and Kellis, 2012, 2016). HaploReg v4 included LD information from the 1000 Genomes Project, chromatin state and protein binding annotation from the Roadmap Epigenomics and ENCODE projects, sequence conservation across mammals, the effect of SNPs on regulatory motifs, and the effect of SNPs on expression from eQTL studies (Ward and Kellis, 2012, 2016). More detailed information is provided in the original studies (Ward and Kellis, 2012, 2016).
Functional Analysis of rs7805747 Using PhenoScanner
PhenoScanner included publicly available large-scale GWAS summary results, about 3 billion associations and over 10 million unique single nucleotide polymorphisms (SNPs) and a broad range of phenotypes (Staley et al., 2016). The results are aligned across traits to the same effect and non-effect alleles for each SNP (Staley et al., 2016). Here, we performed three kinds of functional analyses including the GWAS, Metabolites, and eQTL analysis options (Staley et al., 2016). To perform a GWAS analysis, the PhenoScanner included 88 GWAS datasets with 76 kinds of diseases or phenotypes (Staley et al., 2016). To perform a Metabolites analysis, PhenoScanner consisted of two metabolomics datasets (Shin et al., 2014; Kettunen et al., 2016). To perform an eQTL analysis, PhenoScanner included several eQTL datasets from eQTL Browser, Geuvadis, GTEx (version 6), MuTHER and bloodeqtlbrowser. More detailed information is provided on the original study (Staley et al., 2016).
Gene Expression Analysis of PRKAG2 in GTEx
We evaluated the expression of PRKAG2 using the RNA-Seq datasets from the NIH Genotype-Tissue Expression (GTEx) project, which was created to establish a sample and data resource for studies on the relationship between genetic variation and gene expression in multiple human tissues (GTEx Consortium, 2013; Mele et al., 2015). The GTEx project included median gene expression levels in 51 tissues and 2 cell lines (V6, October 2015) (GTEx Consortium, 2013; Mele et al., 2015). This release is based on data from 8555 tissue samples obtained from 570 adult post-mortem individuals (GTEx Consortium, 2013; Carithers et al., 2015; Mele et al., 2015). Here, we used the Genome Browser to evaluate the expression of PRKAG2 in GTEx 53 human tissues (V6, October 2015). The UCSC Genome Browser is a new method to visualize interactions between regions of the genome (Meyer et al., 2013; Karolchik et al., 2014; Rosenbloom et al., 2015; Speir et al., 2016; Tyner et al., 2017; Casper et al., 2018).
Case-Control Gene Expression Analysis of PRKAG2
We analyzed a whole genome case-control expression profiles in human CKD (Nakagawa et al., 2015). In the original study, a microarray analysis with renal biopsy specimens from CKD patients was conducted to identify the responsible genes associated with tubulointerstitial fibrosis and tubular cell injury in CKD (Nakagawa et al., 2015). This study showed microarray profiles in a total of 61 samples including 53 biopsy specimens of CKD patients, and 8 controls (Nakagawa et al., 2015). Here, we selected the web tool GEO2R to evaluate whether PRKAG2 gene is significantly dysregulated in CKD cases compared with control samples, as did in a recent study (Liu et al., 2018a). The significance level is defined to be P < 0.01.
Results
Regulatory Analysis of rs7805747 Using RegulomeDB
Using RegulomeDB, the predicted score is 5, which suggested that rs7805747 is likely to affect binding (TF binding) or DNase peak. The predicted binding protein is HNF4A (chr7:151407767-151408030 by ChIP-seq in Caco2 cell type) (Verzi et al., 2010). The histone modification analysis showed that rs7805747 was predicated to locate in enhancer histone marks (Liver, Fetal Intestine Large, Right Ventricle, Duodenum Mucosa, and Fetal Intestine Small). Here, we provided some key information about regulatory analysis in Table 1. More detailed results are described in Supplementary Table 1.
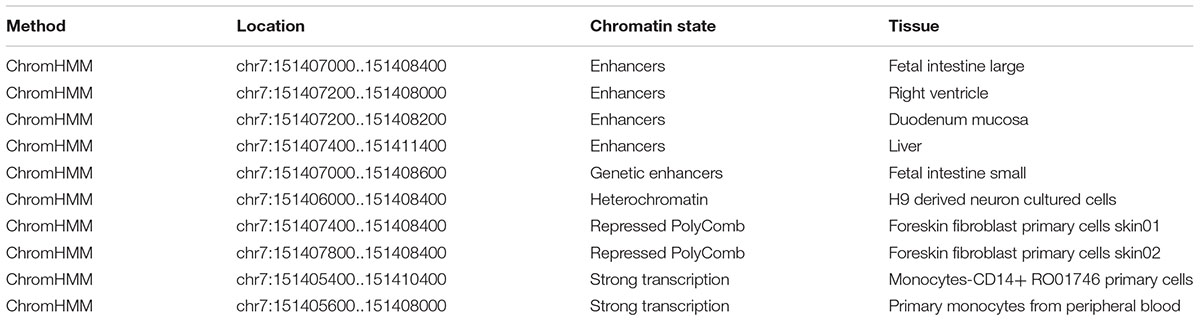
TABLE 1. Key histone modification analysis of rs7805747 using RegulomeDB.
Functional Analysis of rs7805747 Using HaploReg
Using HaploReg v4, rs7805747 is predicated to locate in enhancer histone marks (Liver, Duodenum Mucosa, Fetal Intestine Large, Fetal Intestine Small, and Right Ventricle tissues), DNase hypersensitivity (Foreskin Melanocyte Primary Cells skin01, Fetal Heart, Fetal Intestine Large, Fetal Intestine Small, Small Intestine), and motifs changed (GATA, HMGN3, Pax-6, and Tgif1) (Ward and Kellis, 2012, 2016).
Functional Analysis of rs7805747 Using PhenoScanner in GWAS
Using PhenoScanner in GWAS option, we identified 43 significant association results with P < 0.01. In addition to the CKD, we found that rs7805747 is also significantly associated with other diseases or phenotypes including Hemoglobin Hb, Hematocrit Hct, Red blood cell count RBC, systolic blood pressure (SBP), Breast cancer, Gout, Hypertension, and Extraversion, as described in Table 2.
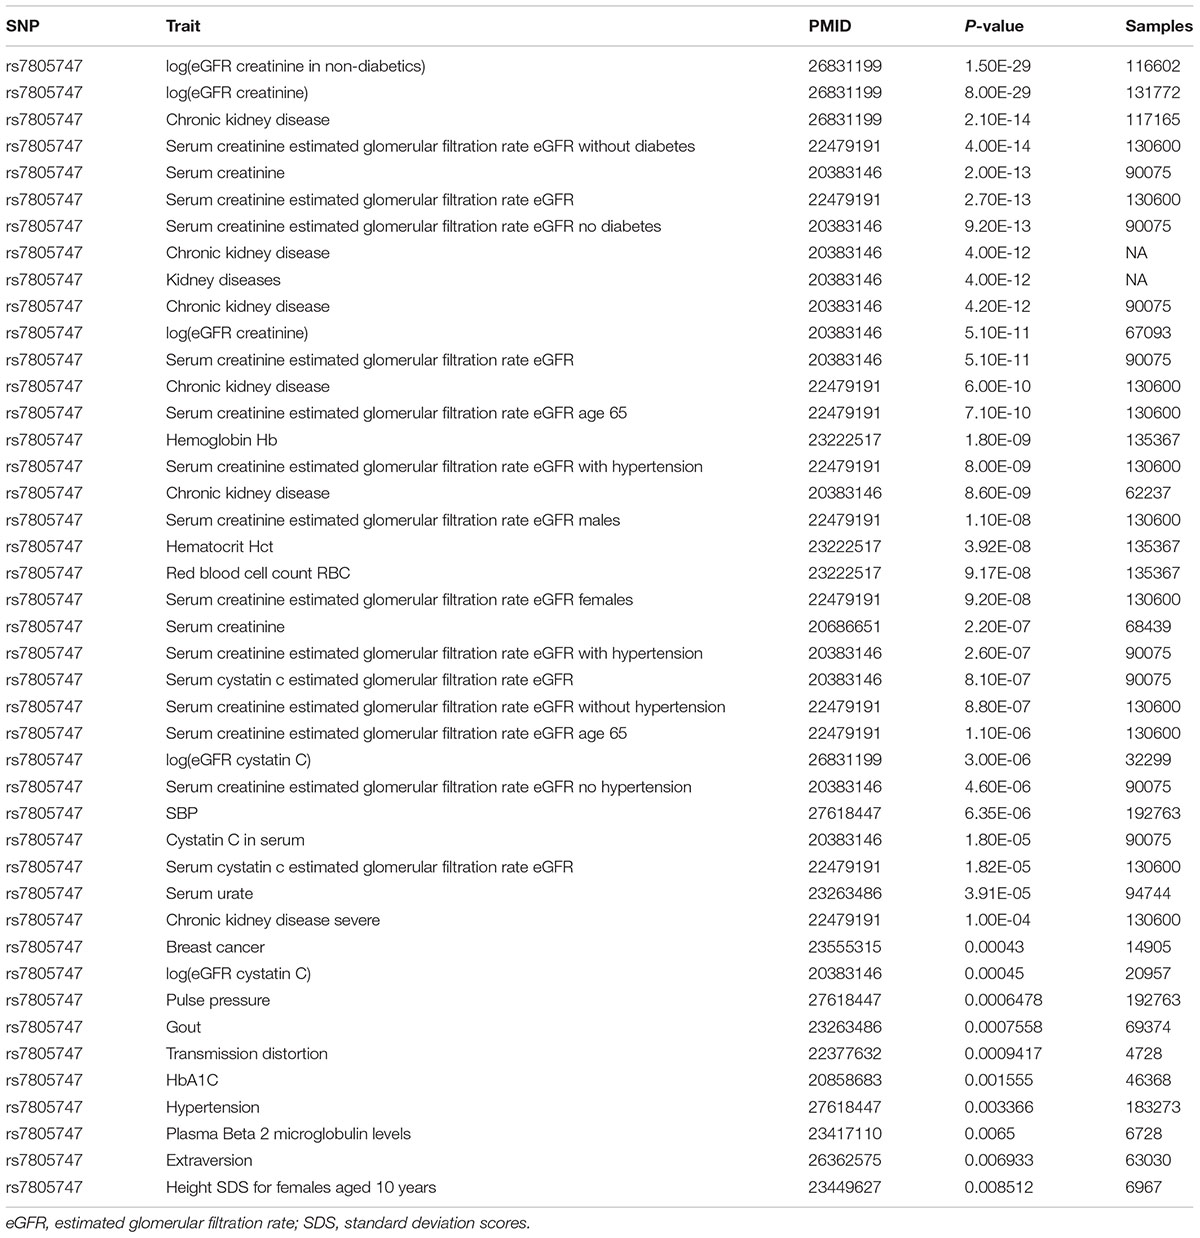
TABLE 2. Significant association between rs7805747 and kinds of diseases or phenotypes with P ≤ 0.01.
Functional Analysis of rs7805747 Using PhenoScanner in eQTL
Using PhenoScanner in eQTL option, we identified 23 significant associations between rs7805747 and gene expression with P < 0.01. These findings show that rs7805747 is significantly associated with gene expression in multiple human tissues including brain, cells transformed fibroblasts, colon sigmoid, colon transverse, heart left ventricle, liver, lung, skin, small intestine terminal ileum, stomach, and whole blood, as described in Table 3. These regulated genes include GIMAP1, GIMAP5, AGAP3, KCNH2, TMEM176B, TMEM176A, FASTK, WDR86, NOS3, WDR86-AS1, XRCC2, YBX1P4, SLC4A2, TMUB1, and PRKAG2. Importantly, rs7805747 could significantly regulate PRKAG2 expression in blood with P = 3.81E-03 and 8.15E-04.
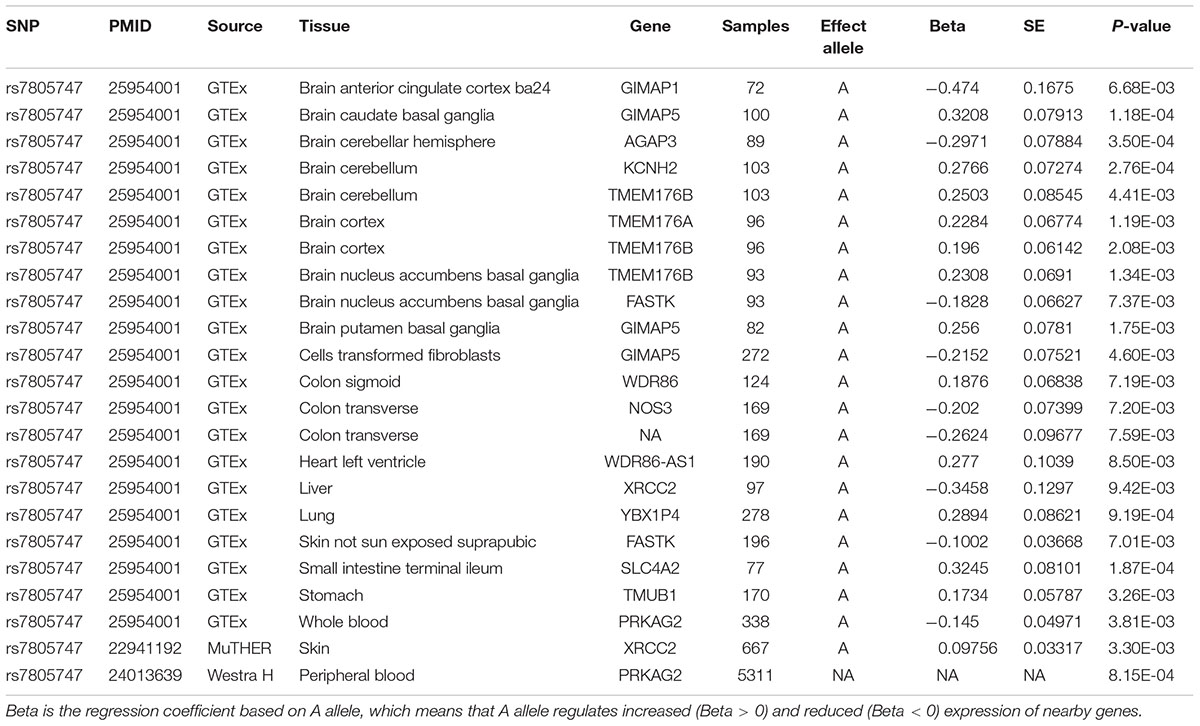
TABLE 3. Significant association between rs7805747 and the gene expression with P ≤ 0.01.
Functional Analysis of rs7805747 Using PhenoScanner in Metabolites
Using PhenoScanner in metabolites option, we identified significant association between rs7805747 and 17 metabolites with P < 0.01. These metabolites included Creatinine, Indolelactate, Phenol sulfate, Pseudouridine, Propionylcarnitine, C-glycosyltryptophan, Kynurenine, Myo-inositol, 3-carboxy-4-methyl-5-propyl-2-furanpropanoate (CMPF), 1-palmitoylglycerophosphoethanolamine, Phenyllactate (PLA), Erythronate, N-acetylthreonine, Citrulline, 3-methoxytyrosine, Urate, 2-methylbutyroylcarnitine, as described in Table 4.
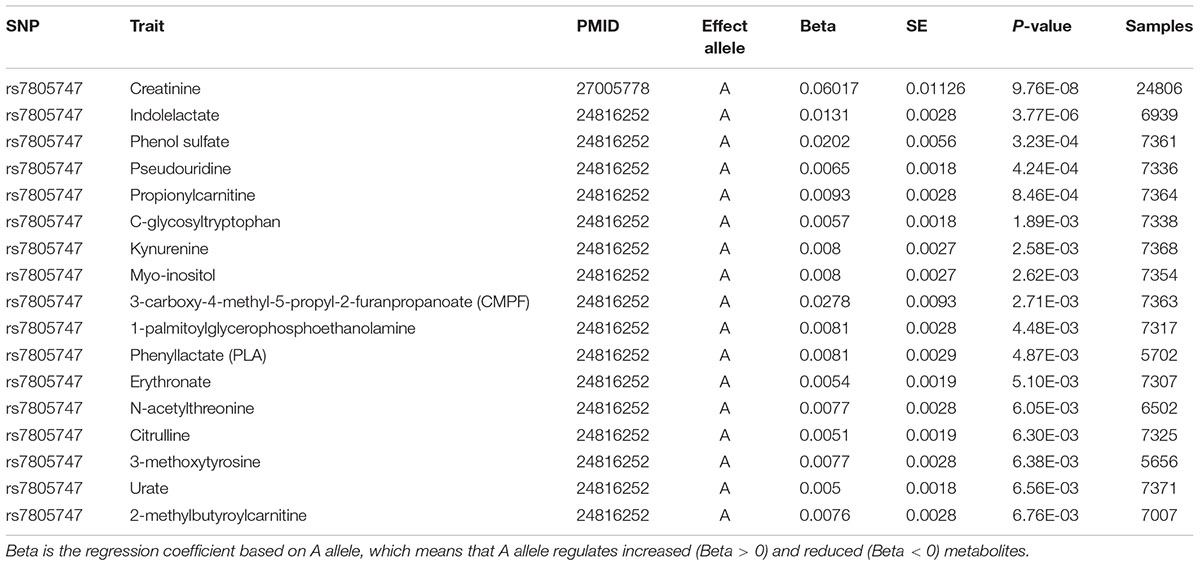
TABLE 4. Significant association between rs7805747 and metabolites with P ≤ 0.01.
Gene Expression Analysis of PRKAG2 in GTEx
Using the UCSC Genome Browser, the results showed that PRKAG2 had the highest median expression: 34.90 RPKM in Heart – Atrial Appendage (Ensembl gene ID: ENSG00000106617.9, Genomic position: hg38 chr7:151556111-151877125). PRKAG2 had the total median expression 412.37 RPKM in all these 53 tissues. Figure 1 provided more detailed information about the PRKAG2 gene expression in 53 tissues from GTEx RNA-Seq of 8555 samples (570 donors).
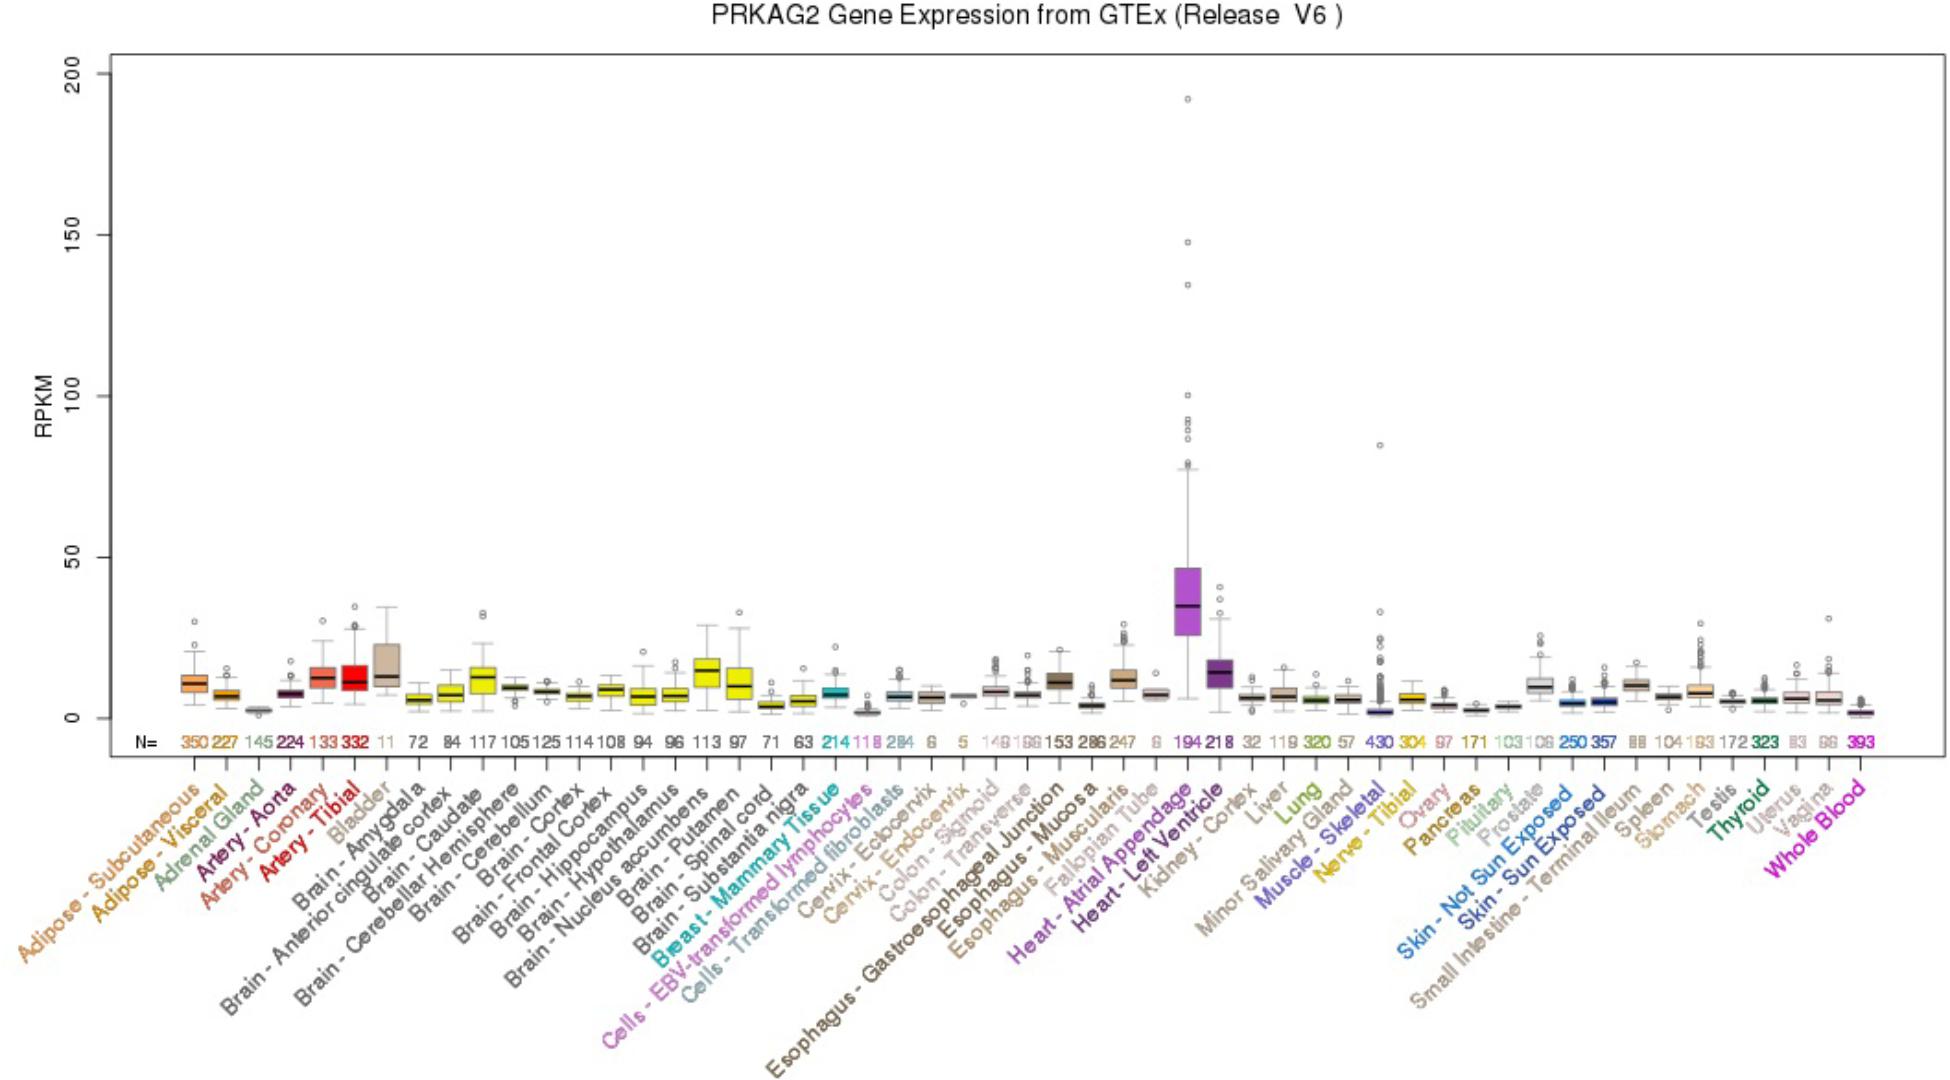
FIGURE 1. PRKAG2 gene expression in 53 tissues from GTEx RNA-Seq of 8555 samples (570 donors) using UCSC Genome Browser.
Case-Control Gene Expression Analysis of PRKAG2
There are three probes to evaluate the expression of PRKAG2 gene in the gene expression profiles in human CKD including A_24_P384779, A_23_P44366, and A_23_P314760. Each of these three probes represents different regions of PRKAG2 gene. These three probes may have the same or different transcript or isoforms, or extrons. The results showed that all these probes about the PRKAG2 gene is significantly dysregulated in CKD cases compared with control samples including A_24_P384779 [P = 1.23E-07 and log2(fold change) = -2.07], and A_23_P44366 [P = 4.39E-03 and log2(fold change) = 0.74], and A_23_P314760 [P = 1.54E-02 and log2(fold change) = 0.62]. In Table 3, there are 15 unique genes regulated by rs7805747. In addition to PRKAG2, we also evaluated the expression of other 14 genes, as provided in Table 3. The results showed that 4 of other 14 genes including TMUB1, AGAP3, XRCC2, and WDR86-AS1 also had different expression in CKD cases with P < 0.01. Table 5 provided the detailed information about 23 probes of 15 genes including PRKAG2. Importantly, the different expression of PRKAG2, TMUB1, AGAP3, and XRCC2 had passed the multiple testing correction threshold 0.01/23 = 0.000435.
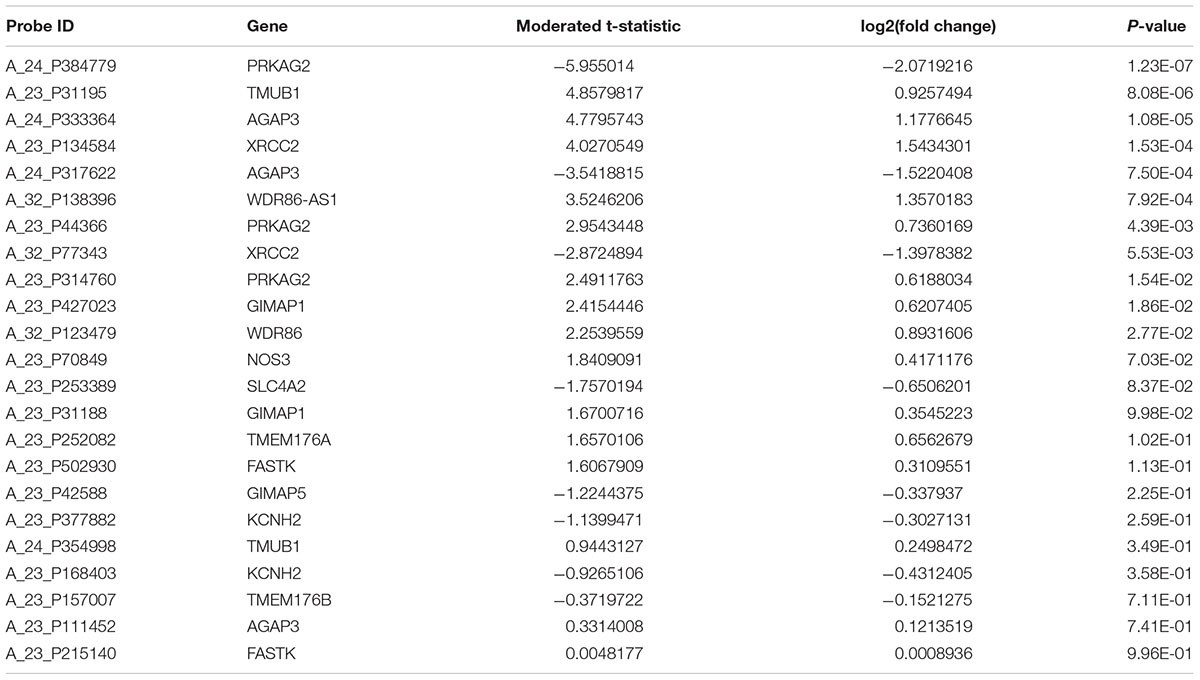
TABLE 5. Gene expression analysis of 15 genes regulated by rs7805747 using CKD gene expression dataset.
Discussion
It is reported that PRKAG2 could encode the gamma2-subunit isoform of 5′-AMP-activated protein kinase (AMPK) (Ahmad et al., 2005; Banerjee et al., 2007; Folmes et al., 2009; Kim et al., 2012; Thorn et al., 2013; Zhang et al., 2013; Hinson et al., 2016, 2017). AMPK is a metabolic enzyme, which plays important roles in regulating of energy metabolism in response to cellular stress. AMPK has been identified to be a regulator of metabolism, survival, and fibrosis, by a recent integrative analysis of PRKAG2 cardiomyopathy iPS and microtissue models (Hinson et al., 2016). In addition, mutations in PRKAG2 have been identified to be associated with hypertrophic cardiomyopathy (Xu et al., 2017).
Over the past decade, GWAS have considerably improved our understanding of the genetic basis of kidney function and disease (Wuttke and Kottgen, 2016). A SNP rs7805747 identified by CKD GWAS lies upstream of PRKAG2. Here, we performed a comprehensively functional analysis of this variant using multiple bioinformatics databases including RegulomeDB (Boyle et al., 2012), HaploReg (version 4.1) (Ward and Kellis, 2016), and PhenoScanner (version 1.1) (Staley et al., 2016). Using RegulomeDB, rs7805747 is predicted to affect HNF4A binding or DNase peak. Using RegulomeDB, the predicted score is 5, which suggested that rs7805747 is likely to affect binding (TF binding) or DNase peak. The predicted binding protein is HNF4A (chr7:151407767-151408030 by ChIP-seq in Caco2 cell type). In addition, rs7805747 was predicated to locate in enhancer histone marks (Liver, Fetal Intestine Large, Right Ventricle, Duodenum Mucosa, and Fetal Intestine Small). Using HaploReg (version 4.1), we identified rs7805747 to be associated with enhancer histone marks, DNase hypersensitivity, and motifs changed. In HaploReg (version 4.1), rs7805747 was also predicated to locate in enhancer histone marks (Liver, Duodenum Mucosa, Fetal Intestine Large, Fetal Intestine Small, and Right Ventricle tissues). Hence, the findings in HaploReg (version 4.1) were consistent with RegulomeDB.
Using PhenoScanner in GWAS option, we showed that rs7805747 is not only associated with CKD, but also is significantly associated with other diseases or phenotypes including Hemoglobin Hb, Hematocrit Hct, Red blood cell count RBC, SBP, Breast cancer, Gout, Hypertension, and Extraversion.
Using PhenoScanner in eQTL option, rs7805747 is identified to be significantly associated with gene expression in multiple human tissues and multiple genes including PRKAG2. Previous study has reported rs7805747 to be associated with serum creatinine and CKD (Chambers et al., 2010). Using PhenoScanner in metabolites option, rs7805747 is identified to be significantly associated with not only the serum creatinine, but also with other 16 metabolites, as described in Table 4.
The gene expression analysis of PRKAG2 using 53 tissues from GTEx RNA-Seq of 8555 samples (570 donors) in GTEx showed that PRKAG2 had the highest median expression in Heart – Atrial Appendage. Using the gene expression profiles in human CKD, we further identified different expression of PRKAG2 gene in CKD cases compared with control samples. All these findings indicate that rs7805747 is associated with CKD risk, PRKAG2 gene expression, and 17 metabolites. Meanwhile, gene expression analysis further showed that CKD cases had different expression of PRKAG2 gene. In summary, our findings provide new insight into the underlying susceptibility of PRKAG2 gene to CKD.
Author Contributions
EW conceived and initiated the project and performed the functional analysis. EW, HZ, DZ, LL, and LD wrote the manuscript. All authors reviewed the manuscript and contributed to the final manuscript.
Conflict of Interest Statement
The authors declare that the research was conducted in the absence of any commercial or financial relationships that could be construed as a potential conflict of interest.
Supplementary Material
The Supplementary Material for this article can be found online at: https://www.frontiersin.org/articles/10.3389/fgene.2018.00573/full#supplementary-material
References
Ahmad, F., Arad, M., Musi, N., He, H., Wolf, C., Branco, D., et al. (2005). Increased alpha2 subunit-associated AMPK activity and PRKAG2 cardiomyopathy. Circulation 112, 3140–3148.
Almirall, J. (2016). Sodium excretion, cardiovascular disease, and chronic kidney disease. JAMA 316:1112.
Banerjee, S. K., Ramani, R., Saba, S., Rager, J., Tian, R., Mathier, M. A., et al. (2007). A PRKAG2 mutation causes biphasic changes in myocardial AMPK activity and does not protect against ischemia. Biochem. Biophys. Res. Commun. 360, 381–387.
Boyle, A. P., Hong, E. L., Hariharan, M., Cheng, Y., Schaub, M. A., Kasowski, M., et al. (2012). Annotation of functional variation in personal genomes using RegulomeDB. Genome Res. 22, 1790–1797. doi: 10.1101/gr.137323.112
Carithers, L. J., Ardlie, K., Barcus, M., Branton, P. A., Britton, A., Buia, S. A., et al. (2015). A novel approach to high-quality postmortem tissue procurement: the GTEx project. Biopreserv. Biobank 13, 311–319. doi: 10.1089/bio.2015.0032
Casper, J., Zweig, A. S., Villarreal, C., Tyner, C., Speir, M. L., Rosenbloom, K. R., et al. (2018). The UCSC genome browser database: 2018 update. Nucleic Acids Res. 46, D762–D769. doi: 10.1093/nar/gkx1020
Chambers, J. C., Zhang, W., Lord, G. M., van der Harst, P., Lawlor, D. A., Sehmi, J. S., et al. (2010). Genetic loci influencing kidney function and chronic kidney disease. Nat. Genet. 42, 373–375. doi: 10.1038/ng.566
Clark, W. F., Sontrop, J. M., Huang, S. H., Gallo, K., Moist, L., House, A. A., et al. (2018). Effect of coaching to increase water intake on kidney function decline in adults with chronic kidney disease: the CKD WIT randomized clinical trial. JAMA 319, 1870–1879. doi: 10.1001/jama.2018.4930
Cusumano, A. M., and Gonzalez Bedat, M. C. (2008). Chronic kidney disease in Latin America: time to improve screening and detection. Clin. J. Am. Soc. Nephrol. 3, 594–600. doi: 10.2215/CJN.03420807
Folmes, K. D., Chan, A. Y., Koonen, D. P., Pulinilkunnil, T. C., Baczko, I., Hunter, B. E., et al. (2009). Distinct early signaling events resulting from the expression of the PRKAG2 R302Q mutant of AMPK contribute to increased myocardial glycogen. Circ. Cardiovasc. Genet. 2, 457–466. doi: 10.1161/CIRCGENETICS.108.834564
GTEx Consortium (2013). The genotype-tissue expression (GTEx) Project. Nat. Genet. 45, 580–585. doi: 10.1038/ng.2653
Guo, L., Peng, Y., Sun, L., Han, X., Xu, J., and Mao, D. (2017). Ovarian cancer variant rs2072590 is associated with HOXD1 and HOXD3 gene expression. Oncotarget 8, 103410–103414. doi: 10.18632/oncotarget.21902
Hazelett, D. J., Rhie, S. K., Gaddis, M., Yan, C., Lakeland, D. L., Coetzee, S. G., et al. (2014). Comprehensive functional annotation of 77 prostate cancer risk loci. PLoS Genet. 10:e1004102. doi: 10.1371/journal.pgen.1004102
He, W., Jia, C., Duan, Y., and Zou, Q. (2018a). 70ProPred: a predictor for discovering sigma70 promoters based on combining multiple features. BMC Syst. Biol. 12(Suppl. 4):44. doi: 10.1186/s12918-018-0570-1
He, W., Jia, C., and Zou, Q. (2018b). 4mCPred: machine learning methods for DNA N4-methylcytosine sites prediction. Bioinformatics doi: 10.1093/bioinformatics/bty668 [Epub ahead of print].
Hedayati, S. S., Gregg, L. P., Carmody, T., Jain, N., Toups, M., Rush, A. J., et al. (2017). Effect of sertraline on depressive symptoms in patients with chronic kidney disease without dialysis dependence: the CAST randomized clinical trial. JAMA 318, 1876–1890. doi: 10.1001/jama.2017.17131
Hinson, J. T., Chopra, A., Lowe, A., Sheng, C. C., Gupta, R. M., Kuppusamy, R., et al. (2016). Integrative analysis of PRKAG2 cardiomyopathy iPS and microtissue models identifies AMPK as a regulator of metabolism, survival, and fibrosis. Cell Rep. 17, 3292–3304.
Hinson, J. T., Chopra, A., Lowe, A., Sheng, C. C., Gupta, R. M., Kuppusamy, R., et al. (2017). Integrative analysis of PRKAG2 cardiomyopathy iPS and microtissue models identifies AMPK as a regulator of metabolism, survival, and fibrosis. Cell Rep. 19:2410.
Hu, Y., Cheng, L., Zhang, Y., Bai, W., Zhou, W., Wang, T., et al. (2017a). Rs4878104 contributes to Alzheimer’s disease risk and regulates DAPK1 gene expression. Neurol. Sci. 38, 1255–1262. doi: 10.1007/s10072-017-2959-9
Hu, Y., Jin, S., Cheng, L., Liu, G., and Jiang, Q. (2017b). Autoimmune disease variants regulate GSDMB gene expression in human immune cells and whole blood. Proc. Natl. Acad. Sci. U.S.A. 114, E7860–E7862.
Hursitoglu, M. (2016). Sodium excretion, cardiovascular disease, and chronic kidney disease. JAMA 316:1112.
James, M. T., Pannu, N., Hemmelgarn, B. R., Austin, P. C., Tan, Z., McArthur, E., et al. (2017). Derivation and external validation of prediction models for advanced chronic kidney disease following acute kidney injury. JAMA 318, 1787–1797. doi: 10.1001/jama.2017.16326
Jia, C., Yang, Q., and Zou, Q. (2018a). NucPosPred: predicting species-specific genomic nucleosome positioning via four different modes of general PseKNC. J. Theor. Biol. 450, 15–21. doi: 10.1016/j.jtbi.2018.04.025
Jia, C., Zuo, Y., and Zou, Q. (2018b). O-GlcNAcPRED-II: an integrated classification algorithm for identifying O-GlcNAcylation sites based on fuzzy undersampling and a K-means PCA oversampling technique. Bioinformatics 34, 2029–2036. doi: 10.1093/bioinformatics/bty039
Jiang, J., Xing, F., Zeng, X., and Zou, Q. (2018). RicyerDB: a database for collecting rice yield-related genes with biological analysis. Int. J. Biol. Sci. 14, 965–970. doi: 10.7150/ijbs.23328
Jiang, Q., Jin, S., Jiang, Y., Liao, M., Feng, R., Zhang, L., et al. (2017). Alzheimer’s disease variants with the genome-wide significance are significantly enriched in immune pathways and active in immune cells. Mol. Neurobiol. 54, 594–600. doi: 10.1007/s12035-015-9670-8
Karolchik, D., Barber, G. P., Casper, J., Clawson, H., Cline, M. S., Diekhans, M., et al. (2014). The UCSC genome browser database: 2014 update. Nucleic Acids Res. 42, D764–D770. doi: 10.1093/nar/gkt1168
Kettunen, J., Demirkan, A., Wurtz, P., Draisma, H. H., Haller, T., Rawal, R., et al. (2016). Genome-wide study for circulating metabolites identifies 62 loci and reveals novel systemic effects of LPA. Nat. Commun. 7:11122. doi: 10.1038/ncomms11122
Kim, E., Lee, S. H., Lee, K. S., Cheong, H. K., Namkoong, K., Hong, C. H., et al. (2012). AMPK gamma2 subunit gene PRKAG2 polymorphism associated with cognitive impairment as well as diabetes in old age. Psychoneuroendocrinology 37, 358–365. doi: 10.1016/j.psyneuen.2011.07.005
Liu, G., Hu, Y., Jin, S., and Jiang, Q. (2017a). Genetic variant rs763361 regulates multiple sclerosis CD226 gene expression. Proc. Natl. Acad. Sci. U.S.A. 114, E906–E907.
Liu, G., Sun, J. Y., Xu, M., Yang, X. Y., and Sun, B. L. (2017b). SORL1 variants show different association with early-onset and late-onset Alzheimer’s disease risk. J. Alzheimers Dis. 58, 1121–1128. doi: 10.3233/JAD-170005
Liu, G., Xu, Y., Jiang, Y., Zhang, L., Feng, R., and Jiang, Q. (2017c). PICALM rs3851179 variant confers susceptibility to Alzheimer’s disease in chinese population. Mol. Neurobiol. 54, 3131–3136. doi: 10.1007/s12035-016-9886-2
Liu, G., Zhang, F., Hu, Y., Jiang, Y., Gong, Z., Liu, S., et al. (2017d). Genetic variants and multiple sclerosis risk gene SLC9A9 expression in distinct human brain regions. Mol. Neurobiol. 54, 6820–6826. doi: 10.1007/s12035-016-0208-5
Liu, G., Zhang, F., Jiang, Y., Hu, Y., Gong, Z., Liu, S., et al. (2017e). Integrating genome-wide association studies and gene expression data highlights dysregulated multiple sclerosis risk pathways. Mult. Scler. 23, 205–212. doi: 10.1177/1352458516649038
Liu, G., Liu, Y., Jiang, Q., Jiang, Y., Feng, R., Zhang, L., et al. (2016). Convergent genetic and expression datasets highlight TREM2 in Parkinson’s disease susceptibility. Mol. Neurobiol. 53, 4931–4938. doi: 10.1007/s12035-015-9416-7
Liu, G., Wang, T., Tian, R., Hu, Y., Han, Z., Wang, P., et al. (2018a). Alzheimer’s disease risk variant rs2373115 regulates GAB2 and NARS2 expression in human brain tissues. J. Mol. Neurosci. 66, 37–43. doi: 10.1007/s12031-018-1144-9
Liu, G., Zhang, Y., Wang, L., Xu, J., Chen, X., Bao, Y., et al. (2018b). Alzheimer’s disease rs11767557 variant regulates EPHA1 gene expression specifically in human whole blood. J. Alzheimers Dis. 61, 1077–1088. doi: 10.3233/JAD-170468
Lu, Y., Zhang, Z., Yu, H., Zheng, S. L., Isaacs, W. B., Xu, J., et al. (2011). Functional annotation of risk loci identified through genome-wide association studies for prostate cancer. Prostate 71, 955–963. doi: 10.1002/pros.21311
Malhotra, R., Nguyen, H. A., Benavente, O., Mete, M., Howard, B. V., Mant, J., et al. (2017). Association between more intensive vs less intensive blood pressure lowering and risk of mortality in chronic kidney disease stages 3 to 5: a systematic review and meta-analysis. JAMA Intern. Med. 177, 1498–1505. doi: 10.1001/jamainternmed.2017.4377
Mele, M., Ferreira, P. G., Reverter, F., DeLuca, D. S., Monlong, J., Sammeth, M., et al. (2015). Human genomics. The human transcriptome across tissues and individuals. Science 348, 660–665. doi: 10.1126/science.aaa0355
Meyer, L. R., Zweig, A. S., Hinrichs, A. S., Karolchik, D., Kuhn, R. M., Wong, M., et al. (2013). The UCSC genome browser database: extensions and updates 2013. Nucleic Acids Res. 41, D64–D69. doi: 10.1093/nar/gks1048
Mills, K., and He, J. (2016). Sodium excretion, cardiovascular disease, and chronic kidney disease. JAMA 316, 1112–1113.
Nakagawa, S., Nishihara, K., Miyata, H., Shinke, H., Tomita, E., Kajiwara, M., et al. (2015). Molecular markers of tubulointerstitial fibrosis and tubular cell damage in patients with chronic kidney disease. PLoS One 10:e0136994. doi: 10.1371/journal.pone.0136994
Pattaro, C., Teumer, A., Gorski, M., Chu, A. Y., Li, M., Mijatovic, V., et al. (2016). Genetic associations at 53 loci highlight cell types and biological pathways relevant for kidney function. Nat. Commun. 7:10023. doi: 10.1038/ncomms10023
Prodjosudjadi, W., Suhardjono, Suwitra, K., Pranawa, Widiana, I. G., Loekman, J. S., et al. (2009). Detection and prevention of chronic kidney disease in Indonesia: initial community screening. Nephrology 14, 669–674. doi: 10.1111/j.1440-1797.2009.01137.x
Rhie, S. K., Coetzee, S. G., Noushmehr, H., Yan, C., Kim, J. M., Haiman, C. A., et al. (2013). Comprehensive functional annotation of seventy-one breast cancer risk Loci. PLoS One 8:e63925. doi: 10.1371/journal.pone.0063925
Rosenbloom, K. R., Armstrong, J., Barber, G. P., Casper, J., Clawson, H., Diekhans, M., et al. (2015). The UCSC genome browser database: 2015 update. Nucleic Acids Res. 43, D670–D681. doi: 10.1093/nar/gku1177
Sherwood, M., and McCullough, P. A. (2016). Chronic kidney disease from screening, detection, and awareness, to prevention. Lancet Glob. Health 4, e288–e289.
Shin, S. Y., Fauman, E. B., Petersen, A. K., Krumsiek, J., Santos, R., Huang, J., et al. (2014). An atlas of genetic influences on human blood metabolites. Nat. Genet. 46, 543–550. doi: 10.1038/ng.2982
Shinohara, Y. (2010). Significance of serum creatinine measurement in the specific screening test system for detection of chronic kidney disease. Nihon Hinyokika Gakkai Zasshi 101, 25–28.
Sinha, A., and Bagga, A. (2018). Screening urinalysis in detection of chronic kidney disease in children. Indian J. Pediatr. 85, 603–604.
Speir, M. L., Zweig, A. S., Rosenbloom, K. R., Raney, B. J., Paten, B., Nejad, P., et al. (2016). The UCSC genome browser database: 2016 update. Nucleic Acids Res. 44, D717–D725. doi: 10.1093/nar/gkv1275
Staley, J. R., Blackshaw, J., Kamat, M. A., Ellis, S., Surendran, P., Sun, B. B., et al. (2016). PhenoScanner: a database of human genotype-phenotype associations. Bioinformatics 32, 3207–3209.
Thorn, S. L., Gollob, M. H., Harper, M. E., Beanlands, R. S., Dekemp, R. A., and Dasilva, J. N. (2013). Chronic AMPK activity dysregulation produces myocardial insulin resistance in the human Arg302Gln-PRKAG2 glycogen storage disease mouse model. EJNMMI Res. 3:48. doi: 10.1186/2191-219X-3-48
Tyner, C., Barber, G. P., Casper, J., Clawson, H., Diekhans, M., Eisenhart, C., et al. (2017). The UCSC genome browser database: 2017 update. Nucleic Acids Res. 45, D626–D634. doi: 10.1093/nar/gkw1134
Verzi, M. P., Shin, H., He, H. H., Sulahian, R., Meyer, C. A., Montgomery, R. K., et al. (2010). Differentiation-specific histone modifications reveal dynamic chromatin interactions and partners for the intestinal transcription factor CDX2. Dev. Cell 19, 713–726. doi: 10.1016/j.devcel.2010.10.006
Wan, S., Duan, Y., and Zou, Q. (2017). HPSLPred: an ensemble multi-label classifier for human protein subcellular location prediction with imbalanced source. Proteomics 17:1700262. doi: 10.1002/pmic.201700262
Wan, S., and Zou, Q. (2017). HAlign-II: efficient ultra-large multiple sequence alignment and phylogenetic tree reconstruction with distributed and parallel computing. Algorithms Mol. Biol. 12:25. doi: 10.1186/s13015-017-0116-x
Ward, L. D., and Kellis, M. (2012). HaploReg: a resource for exploring chromatin states, conservation, and regulatory motif alterations within sets of genetically linked variants. Nucleic Acids Res. 40, D930–D934. doi: 10.1093/nar/gkr917
Ward, L. D., and Kellis, M. (2016). HaploReg v4: systematic mining of putative causal variants, cell types, regulators and target genes for human complex traits and disease. Nucleic Acids Res. 44, D877–D881. doi: 10.1093/nar/gkv1340
Wei, L., Tang, J., and Zou, Q. (2017a). SkipCPP-Pred: an improved and promising sequence-based predictor for predicting cell-penetrating peptides. BMC Genomics 18(Suppl. 7):742. doi: 10.1186/s12864-017-4128-1
Wei, L., Xing, P., Su, R., Shi, G., Ma, Z. S., and Zou, Q. (2017b). CPPred-RF: a sequence-based predictor for identifying cell-penetrating peptides and their uptake efficiency. J. Proteome Res. 16, 2044–2053. doi: 10.1021/acs.jproteome.7b00019
Wuttke, M., and Kottgen, A. (2016). Insights into kidney diseases from genome-wide association studies. Nat. Rev. Nephrol. 12, 549–562. doi: 10.1038/nrneph.2016.107
Xu, Y., Gray, A., Hardie, D. G., Uzun, A., Shaw, S., Padbury, J., et al. (2017). A novel, de novo mutation in the PRKAG2 gene: infantile-onset phenotype and the signaling pathway involved. Am. J. Physiol. Heart. Circ. Physiol. 313, H283–H292. doi: 10.1152/ajpheart.00813.2016
Zeng, X., Liu, L., Lu, L., and Zou, Q. (2018). Prediction of potential disease-associated microRNAs using structural perturbation method. Bioinformatics 34, 2425–2432. doi: 10.1093/bioinformatics/bty112
Zhang, B. L., Xu, R. L., Zhang, J., Zhao, X. X., Wu, H., Ma, L. P., et al. (2013). Identification and functional analysis of a novel PRKAG2 mutation responsible for Chinese PRKAG2 cardiac syndrome reveal an important role of non-CBS domains in regulating the AMPK pathway. J. Cardiol. 62, 241–248. doi: 10.1016/j.jjcc.2013.04.010
Zhang, Y., Wang, L., Jia, H., Liao, M., Chen, X., Xu, J., et al. (2018). Genetic variants regulate NR1H3 expression and contribute to multiple sclerosis risk. J. Neurol. Sci. 390, 162–165. doi: 10.1016/j.jns.2018.04.037
Keywords: chronic kidney disease, PRKAG2, genome-wide association study, eQTL, gene expression
Citation: Wang E, Zhao H, Zhao D, Li L and Du L (2018) Functional Prediction of Chronic Kidney Disease Susceptibility Gene PRKAG2 by Comprehensively Bioinformatics Analysis. Front. Genet. 9:573. doi: 10.3389/fgene.2018.00573
Received: 15 September 2018; Accepted: 08 November 2018;
Published: 03 December 2018.
Edited by:
Quan Zou, Tianjin University, ChinaReviewed by:
Chong Wang, Harvard Medical School, United StatesSicheng Hao, Northeastern University, United States
Copyright © 2018 Wang, Zhao, Zhao, Li and Du. This is an open-access article distributed under the terms of the Creative Commons Attribution License (CC BY). The use, distribution or reproduction in other forums is permitted, provided the original author(s) and the copyright owner(s) are credited and that the original publication in this journal is cited, in accordance with accepted academic practice. No use, distribution or reproduction is permitted which does not comply with these terms.
*Correspondence: Ermin Wang, anptdXNua0AxNjMuY29t