 Sicheng Hao
 Rui Wang
 Yu Zhang2*
- 1College of Computer and Information Science, Northeastern University, Boston, MA, United States
- 2Department of Neurosurgery, Heilongjiang Province Land Reclamation Headquarters General Hospital, Harbin, China
- 3College of Electronic Engineering, Heilongjiang University, Harbin, China
Alzheimer’s disease (AD) is the most common cause of dementia. It is the fifth leading cause of death among elderly people. With high genetic heritability (79%), finding the disease’s causal genes is a crucial step in finding a treatment for AD. Following the International Genomics of Alzheimer’s Project (IGAP), many disease-associated genes have been identified; however, we do not have enough knowledge about how those disease-associated genes affect gene expression and disease-related pathways. We integrated GWAS summary data from IGAP and five different expression-level data by using the transcriptome-wide association study method and identified 15 disease-causal genes under strict multiple testing (α < 0.05), and four genes are newly identified. We identified an additional 29 potential disease-causal genes under a false discovery rate (α < 0.05), and 21 of them are newly identified. Many genes we identified are also associated with an autoimmune disorder.
Introduction
Alzheimer’s disease (AD) is the most common cause of dementia which is characterized by a decline in cognitive skills that affects a person’s ability to perform everyday activities. Estimated 5.4 million people in the United States are living with AD. It is the fifth-leading cause of death among those age 65 and older (Alzheimer’s Association, 2016). Although some drugs showing effectiveness to mitigate the symptoms from getting worse for a limit time, no treatment can stop the disease. Heritability for the AD was estimated up to 79% (Gatz et al., 2006). However, the current finding of AD-associated genetic variants is not enough to fully explain the AD signal pathway in sufficient detail.
During recent years, with the rapid advance of next-generation DNA sequencing, identify disease-related mutation from large data set and develop treatment become possible (Cheng et al., 2016a, 2018a,b). Genome-wide comparison studies (GWASs) have identified a significant amount of common genetic variants associated with complex traits and diseases (Welter et al., 2014; Hu et al., 2017a,b). Many previous studies have identified genes such as APOE (Mahoney-Sanchez et al., 2016; Liao et al., 2017) on chromosome 19. However, the causal relation of those associated genes and variants remain unclear. For example, recent study and data showed that a female with the APOE gene under greater risk than a male with the APOE gene (Cacciottolo et al., 2016; Mazure and Swendsen, 2017). This strongly indicates that we have little knowledge about how this risk factor effect people.
With GWAS summary data provided by the International Genomics of Alzheimer’s Project (IGAP) (Lambert et al., 2013), we are able to study AD in great detail. For a complex disease such as AD, the top single nucleotide polymorphisms (SNPs) often located in the non-coding region, hard to know which gene is modified by that mutation and many significant SNPs are in high linkage disequilibrium (LD) with non-significant SNPs, plus many associated SNPs are more likely to locate in expression regulation region of the disease causal gene (Nicolae et al., 2010; Karch et al., 2016). To identify disease-associated genes, we used the transcriptome-wide association study (TWAS) (Gusev et al., 2016) method which integrates GWAS summarization level data, expression level data from human tissue. TWAS method can eliminate potential confounding and find disease causal gene by focusing only on expression trait linking related by genetic variation; it can also increase statistical power from the lower multiple-testing burden and the noise reduction of gene expression from environmental factors (Gusev et al., 2016).
Previous studies have pointed out at AD is closely related to autoimmune disorders (D’Andrea, 2005; Carter, 2010). After detecting possible disease causal gene for AD, we manually curated existing research about the autoimmune diseases that potentially related to AD.
Materials and Methods
Data we used for SNP-trait association is a large-scale GWAS summary data provided by IGAP with total 17,008 AD cases and 37,154 controls, include 7,055,881 SNPs, we selected 6,004,159 SNPs. Expression level data are from adipose tissue (RNA-seq), whole blood (RNA array), peripheral blood (RNA array), brain tissue (RNA-seq and RNA-seq splicing) (Raitakari et al., 2008; Nuotio et al., 2014; Wright et al., 2014; Fromer et al., 2016). Selection method can be find in Supplementary Materials.
Transcriptome-Wide Association Study
Transcriptome-wide association study can be viewed as a test for correlation between predicted gene expression and traits from GWAS summary association data. The predicted effect size of gene expression on traits can be viewed as a linear model of genotypes with weights based on the correlation between SNPs and gene expression in the training data while accounting for LD among SNPs.
There are eight modes of causality for the relationship between genetic variant, gene expression, and traits. Scenarios Figures 1E–H should be identified as significant by TWAS and its corresponding null hypothesis is gene expression completely independent of traits (Figures 1A–D). By only focusing on the genetic component of expression, the instances of expression-trait association that is not caused by genetic variation but variation in traits can be avoided. One aspect that needs to be noticed is, same as other methods, TWAS is also confounded by linkage and pleiotropy.
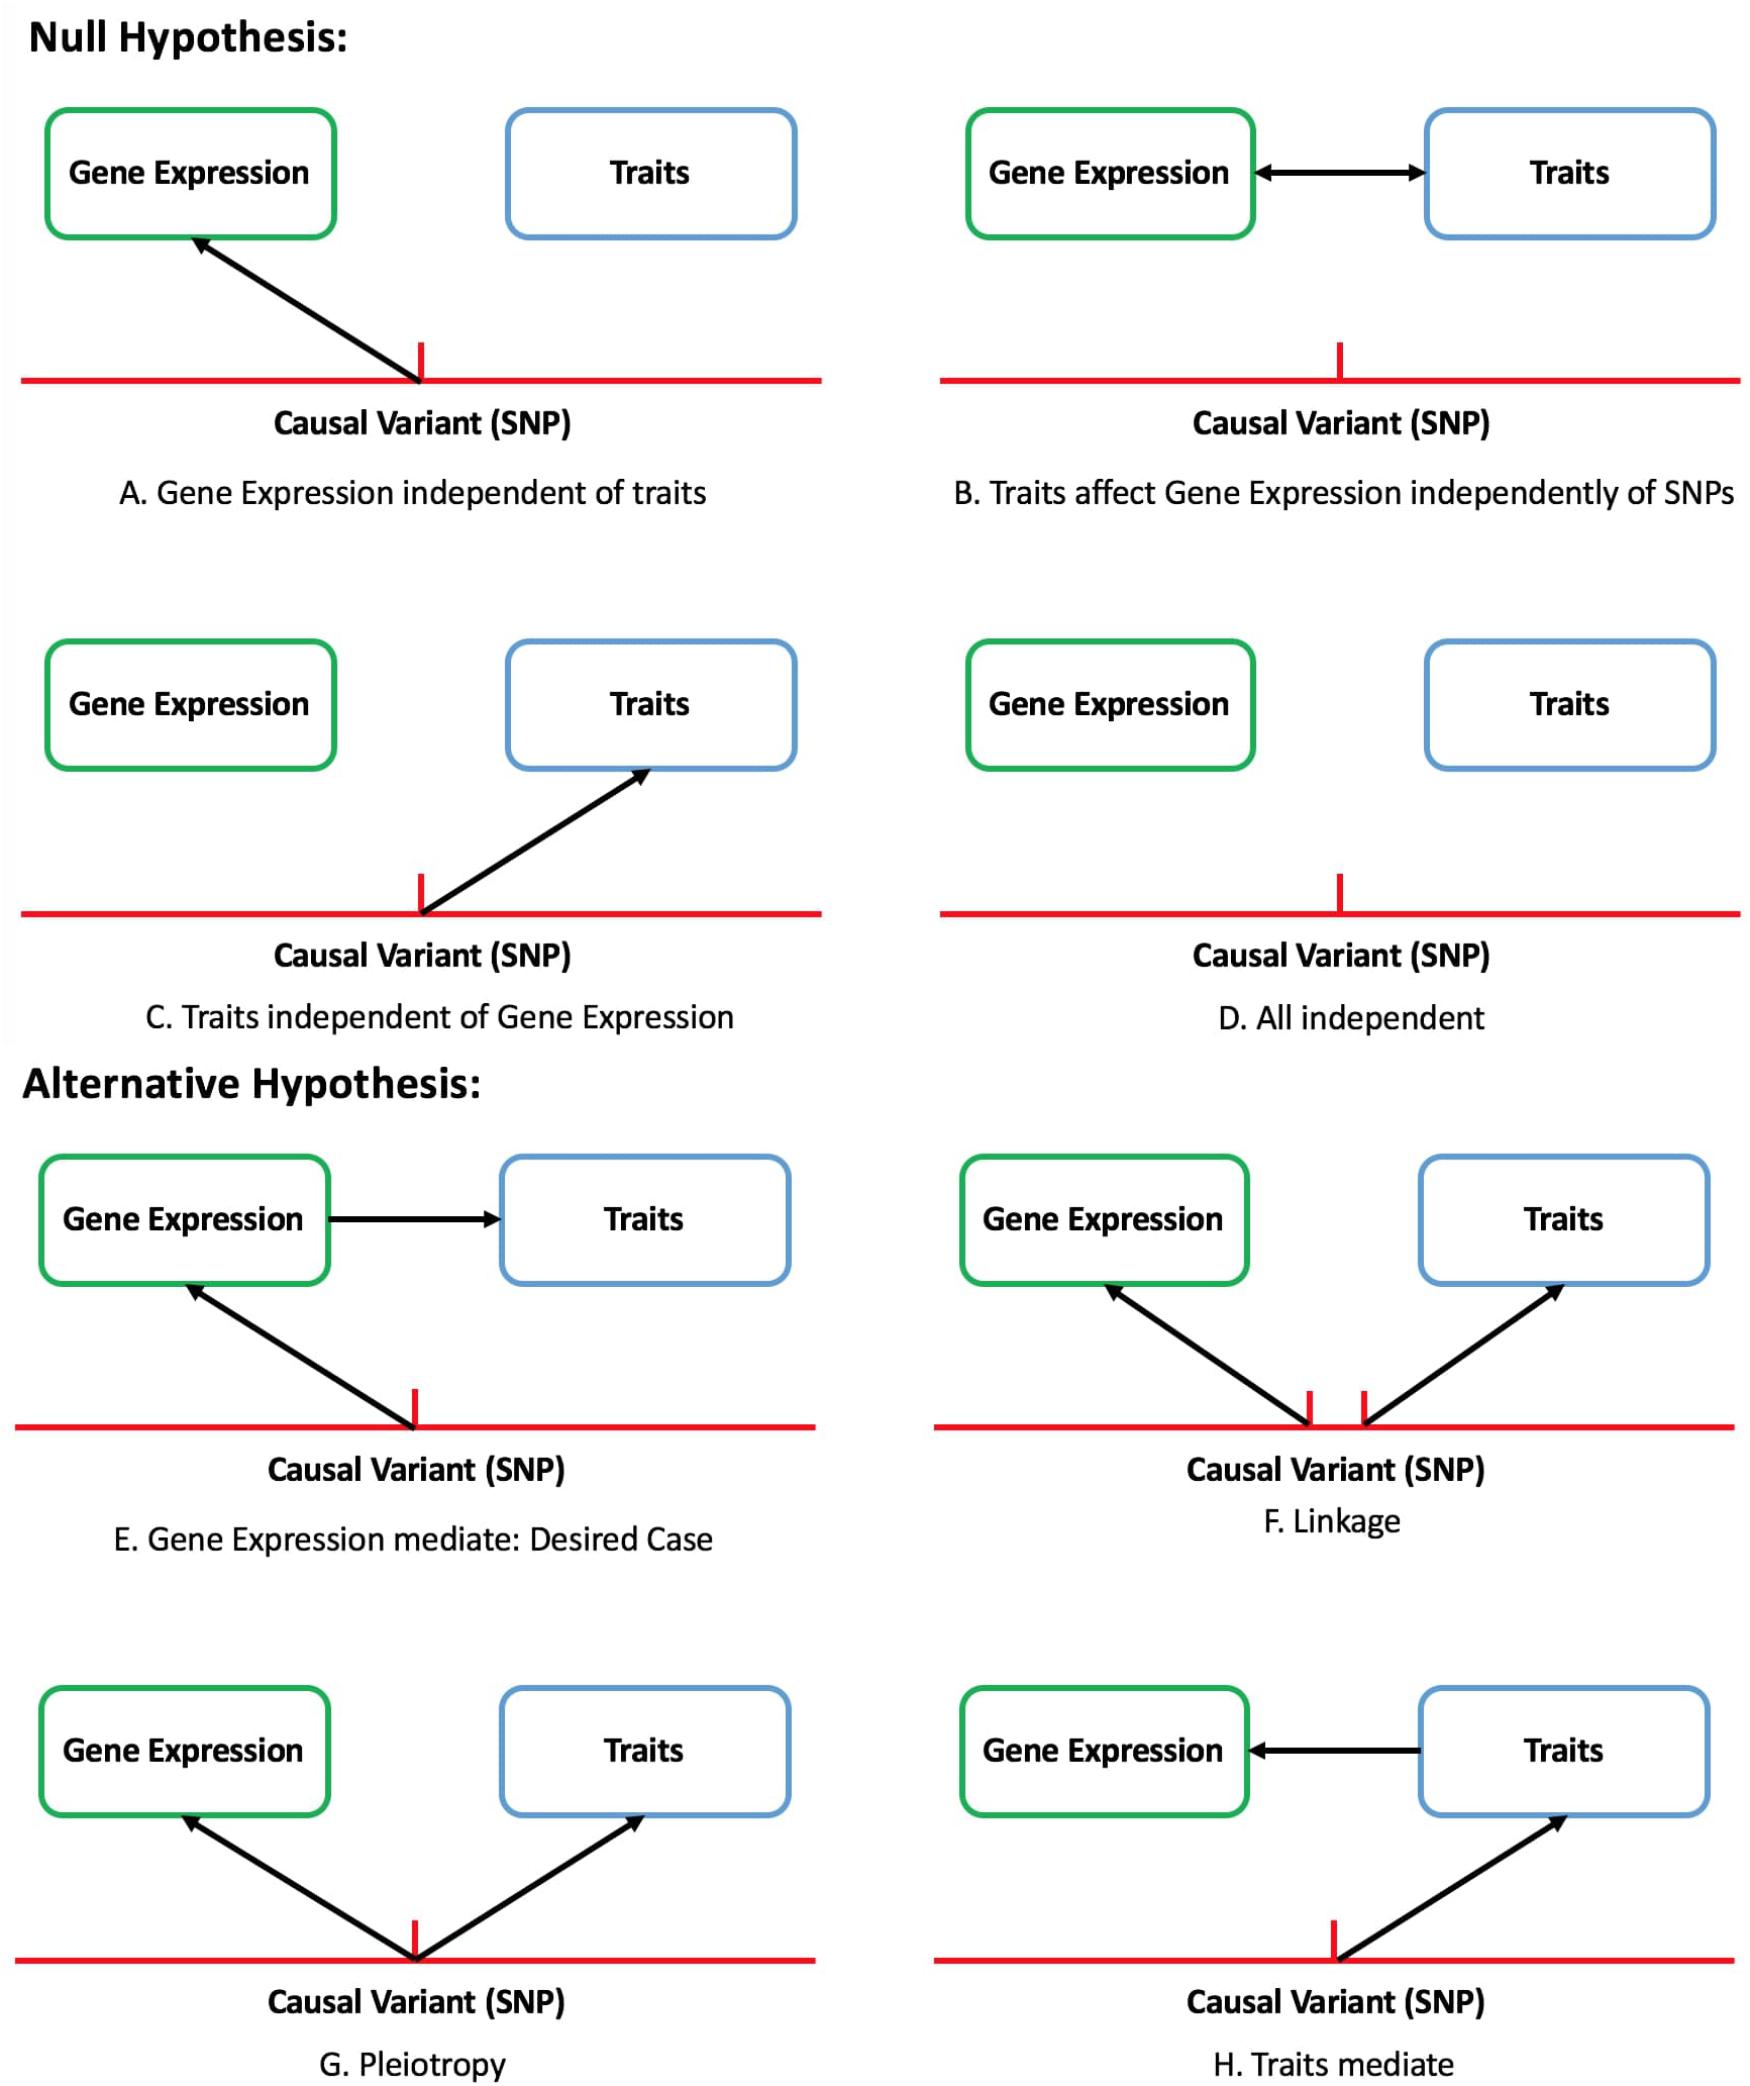
Figure 1. Eight of causal assumption between gene, expression and trait in TWAS study. Null hypothesis: gene expression is completely independent of traits (A–D). Alternative hypothesis: causal relation exists between SNPs and traits (E–H).
Performing TWAS With GWAS Summary Statistics
We integrated gene expression measurements from five tissues with summary GWAS to perform multi-tissue transcriptome-wide association. In each tissue, TWAS used cross-validation to compare predictions from the best cis-eQTL to those from all SNPs at the locus. Prediction models choosing from BLUP (Lofgren et al., 1989), BSLLM (Zhou et al., 2013), LASSO (Tibshirani, 1997), and elastic net (Gamazon et al., 2015).
Transcriptome-wide association study Imputes effect size (z-score) of the expression and trait are linear combination of elements of z-score of SNPs for traits with weights. The weights, W = ∑ e,s , are calculated using ImpG-Summary algorithm (Pasaniuc et al., 2014) and adjusted for LD. ∑ e,s is the estimated covariance matrix between all SNPs at the locus and gene expression and ∑ s,s is the estimated covariance among all SNPs which is used to account for LD.
Standardized effect sizes (Z-scores) of SNPs for a trait at a given cis locus can be denoted as a vector Z. Also, the imputed Z-score of expression and trait, WZ, has variance. W ∑s,sWt. Therefore, the imputation Z score of the cis genetic effect on the trait is,
Bonferroni correction is usually applied when identifying significant disease-associated gene. The standard multiple testing conducted in TWAS is 0.05/15000 (Gusev et al., 2016). But traditional p-value cutoffs adjusted by Bonferroni correction are made too strict in order to avoid an abundance of false positive results. The thresholds like 0.05/15000 for significant genes are usually chosen so that the probability of any single false positive among all loci tested is smaller than 0.05, which will lead to many missed findings. Instead, False Discovery Rate error measure is a more useful approach when a study involves a large number of tests, since it can identify as many significant genes as possible while incurring a relatively low proportion of false positives (Storey and Tibshirani, 2003). For each tissue, we used the Benjamini and Hochberg procedure (Benjamini and Hochberg, 1995) in addition to the Bonferroni correction for all gene tested. The Benjamini and Hochberg procedure is one of false discovery rate procedures that are designed to control the expected proportion of false positives. It is less stringent than the Bonferroni correction, thus has greater power. Since this is study is more exploratory, we can pay more risk of type I error for larger statistical power. It works as follows:
Put individual p-values in ascending order and assign ranks to the p-values.
(1) Calculate each individual Benjamini and Hochberg critical value with formula α, where k is individual p-value’s rank, m is total number of tests and α is the false discovery rate.
(2) Find the largest k such that Pk ≤α and reject the null hypothesis for all Hi for i = 1, ...k.
Results
To determine which gene is significantly associated with AD, we first performed strict multiple testing Bonferroni correction (p-value < 0.05/15000). We found 15 significant genes (Table 1), 11 of them has identified by previous studies of AD. In order to increase the search range, we performed false discovery rate under the same alpha (0.05). After the Benjamini and Hochberg procedure (Benjamini and Hochberg, 1995), we found 29 additional genes (Table 2). Nine of those genes has previously identified to be related to AD.
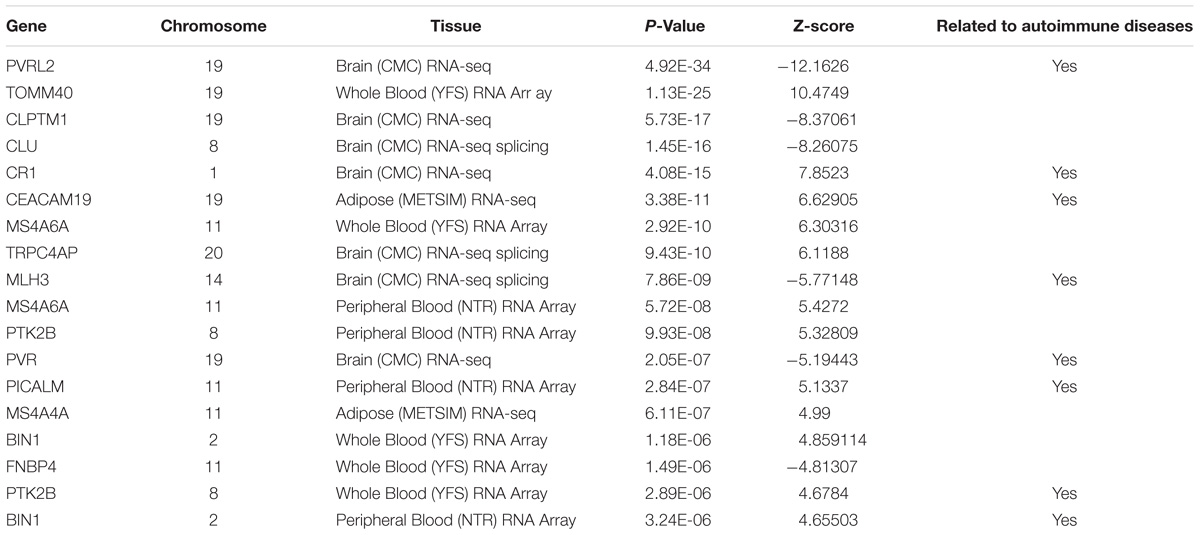
Table 1. Significant genes identified by TWAS under strict multiple testing.
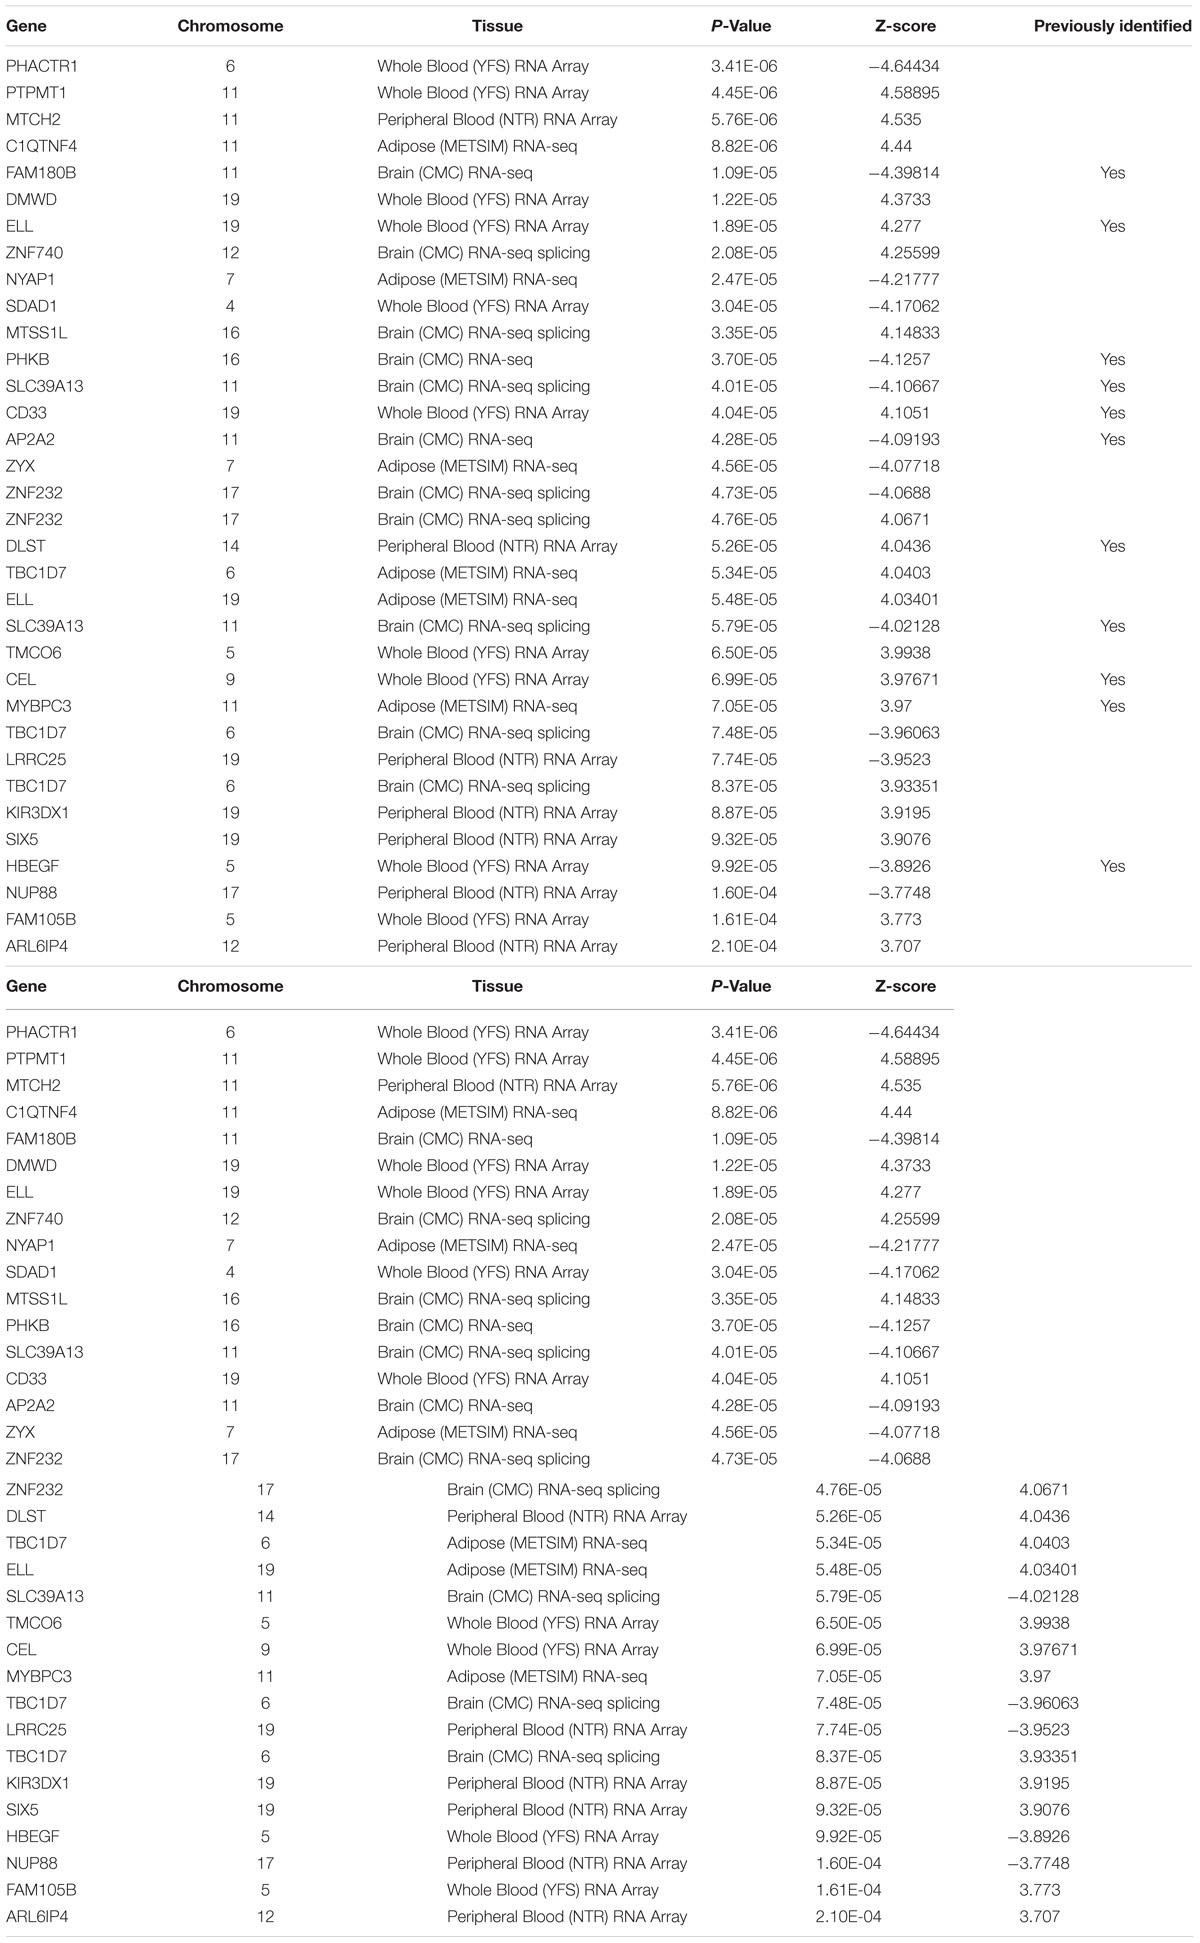
Table 2. Additional gene under Benjamini and Hochberg procedure.
PVRL2 (p-value 4.92∗10ˆ–34 in Brain (CMC) RNA-seq, also known as NECTIN2) is a well-known gene for AD. This gene encodes a single-pass type I membrane glycoprotein and interact with AOPE gene (Kulminski et al., 2018). TOMM40 [p-value 1.13∗10ˆ–25 in Whole Blood (YFS) RNA Array] is also located adjacent to APOE. It has been identified by previous studies worldwide as AD related gene (Lyall et al., 2014; Goh et al., 2015; Mise et al., 2017). It is the central and essential component of the translocase of the outer mitochondrial membrane (Humphries et al., 2005). This confirmed that mitochondrial dysfunction plays a significant role in AD-related pathology (Swerdlow and Khan, 2004; Roses et al., 2016).
Other highly connected genes function group identified are BIN1 [p-value 1.18 × 10⁻⁶in Whole Blood (YFS) RNA Array; 3.24 × 10⁻⁶ in Peripheral Blood (NTR) RNA Array], CLU (p-value 1.45 × 10⁻¹⁶), MS4A6A [p-value 5.72 × 10⁻⁸in Peripheral Blood (NTR) RNA Array; 2.92 × 10⁻¹⁰in Whole Blood (YFS) RNA Array] (Han et al., 2017).
New Identified Genes
MLH3 [p-value 7.86 × 10⁻⁹ in Brain (CMC) RNA-seq splicing] FNBP4 [p-value 1.49 × 10⁻⁶in Whole Blood (YFS) RNA Array], CEACAM19 [p-value 3.38 × 10⁻¹¹ in Adipose (METSIM) RNA-seq], and CLPTM1 [p-value 5.73 × 10⁻¹⁷ in Brain (CMC) RNA-seq] are newly identified AD-associated genes. MLH3 gene is known for its function in repair mismatched DNA and risk for thyroid cancer and lupus (Souliotis et al., 2016; Al-Sweel et al., 2017; Javid et al., 2018). CEACAM19 gene located in chromosome 19, a previous study showed high expression of CEACAM19 for patients with breast cancer (Estiar et al., 2017); CLPTM1 has been shown to increase the risk of lung cancer and melanoma (Llorca-Cardenosa et al., 2014; Lee et al., 2017). Both CEACAM19 and CLPTM1 gene are located in chromosome 19 and near APOE gene. More detailed studies are needed to investigate the relationship between those genes and whether CLPTM1 and CEACAM19 are disease causal gene.
Discussion
APOE Related Genes
Although APOE is not reported to be significant in any tissue, not enough evidence to conclude that APOE is not related to AD. Since each SNP has a weight assigned regarding the expression in TWAS study, even two genes are both significantly related to a disease, it is very likely only one of them will be showing significant in TWAS. TOMM40 (Figure 2, p-value 1.13 × 10⁻²⁵) gene located adjacent to APOE (Pomara et al., 2011), and has a strong LD with APOE gene (Yu et al., 2007), hence TWAS didn’t detect this APOE does not imply it is not disease causal gene. APOE and TOMM40 may interact to affect AD pathology such as mitochondrial dysfunction (David et al., 2005; Roses et al., 2013). Further study is needed to show causal relation in detail. PICALM [p-value 2084 × 10−7 in Peripheral Blood (NTR) RNA Array] and PTK2B [p-value 9.93 × 10⁻⁸ in Peripheral Blood (NTR) RNA Array; p-value 2.89 × 10⁻⁶ in Whole Blood (YFS) RNA Array] are also related to APOE and TOMM40 gene according to previous studies (Carter, 2011; Gharesouran et al., 2014; Morgen et al., 2014; Han et al., 2017).
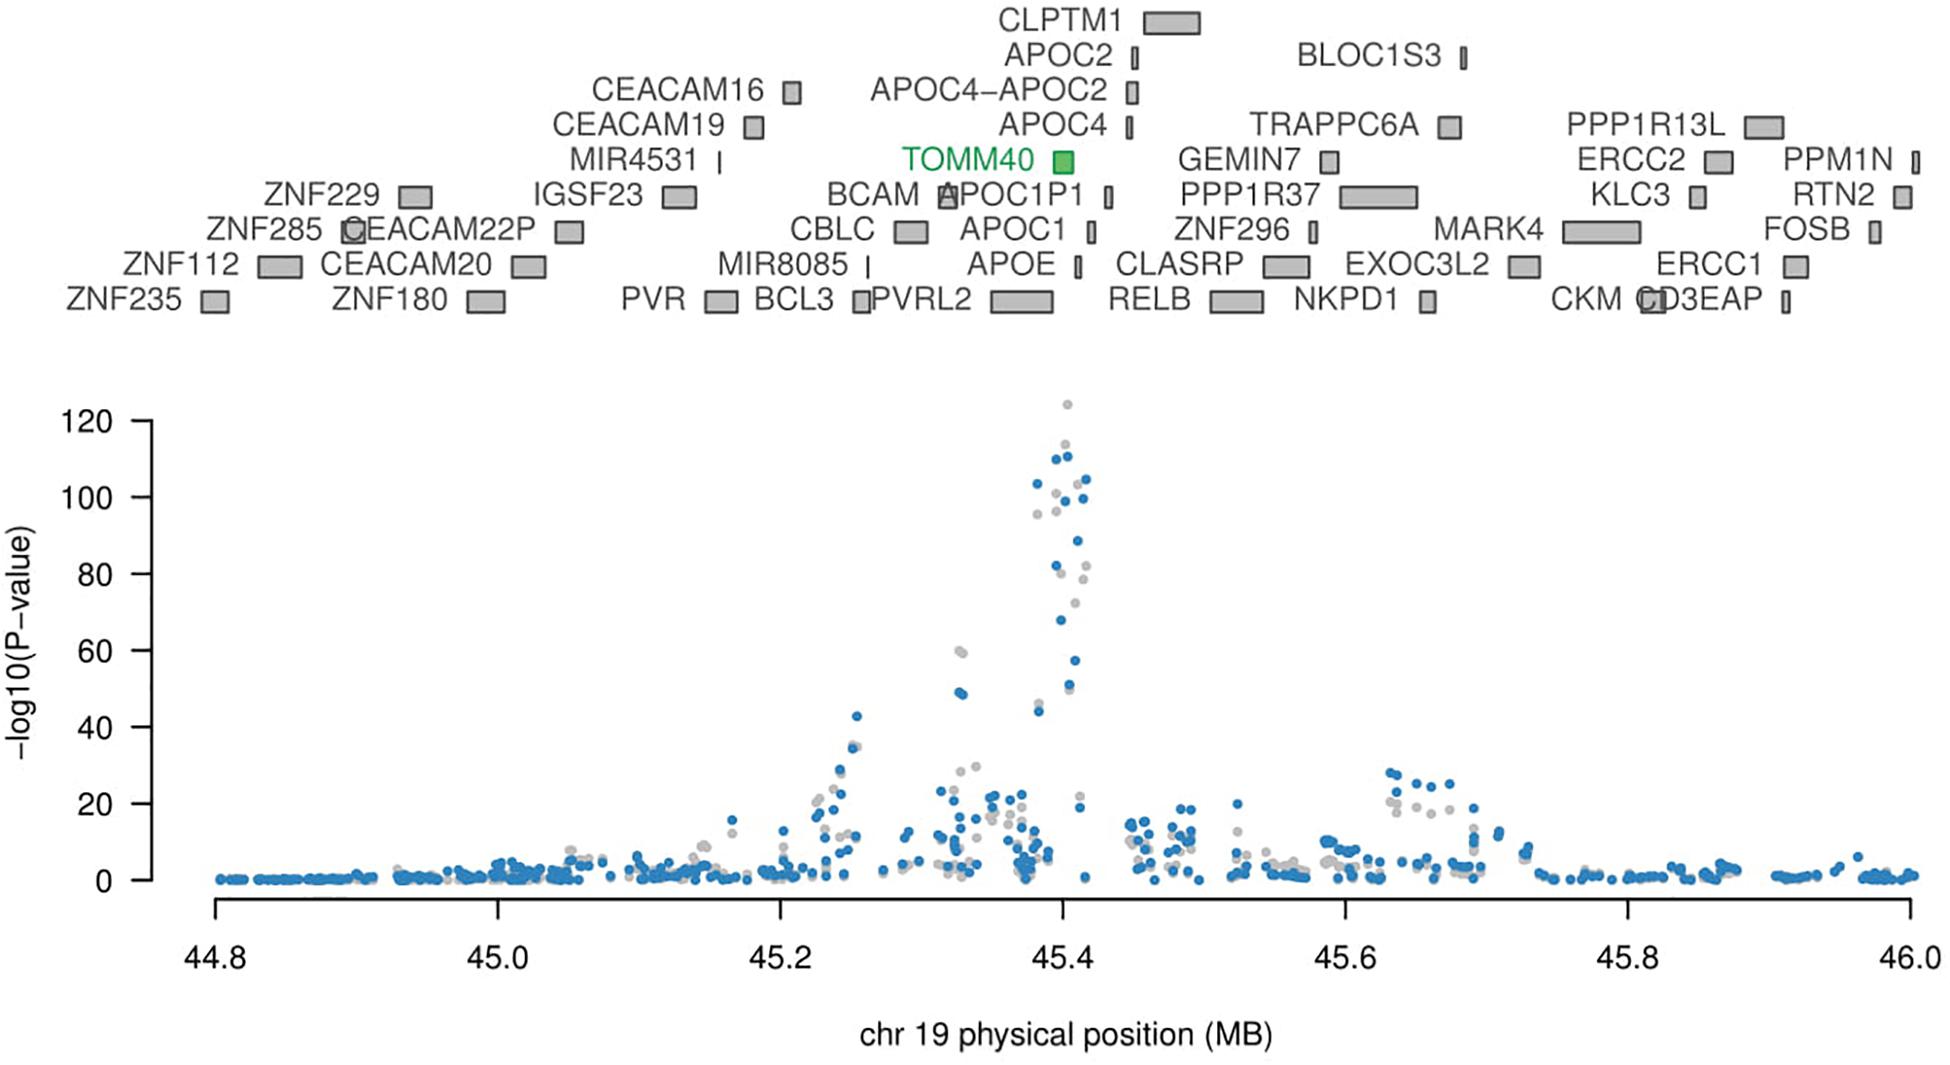
Figure 2. Geneposition plot in chromosome 19. Expression data: whole blood.
Association With Autoimmune Diseases
Complex disease such as AD, often shares common pathways or causal genes with other diseases (Hu et al., 2017c). For instance, TOMM40 is a shared disease-associated gene between AD and Type II diabetes (Greenbaum et al., 2014). Recent studies showing autoimmune diseases have closed relation with AD (D’Andrea, 2005; Lehrer and Rheinstein, 2015; Wotton and Goldacre, 2017). Among all the genes we identified through TWAS method, eight of them are related to autoimmune diseases.
As shown in Figure 3, PICALM, PVRL2, PVR, and CLU have shown to be related to systemic, an autoimmune disease characterized by vascular injury and debilitating tissue fibrosis (Xia et al., 2010; Ryu et al., 2014; Tsou et al., 2016; van Luijn et al., 2016). CR1 and CLU gene are related to thymus function which could potentially cause an autoimmune disorder (French et al., 1992; Pekalski et al., 2017). MLH3 and BIN1 gene have shown to be associated with Lupus, another severe autoimmune disease (Armstrong et al., 2014; Souliotis et al., 2016). Although with existing result, we don’t have enough evidence to prove these genes are both disease causal genes for AD and autoimmune disease, further research from areas such as metabolomics and proteomics is needed to study the disease association between AD and autoimmune diseases (Cheng et al., 2016b, 2017; Hu et al., 2018).
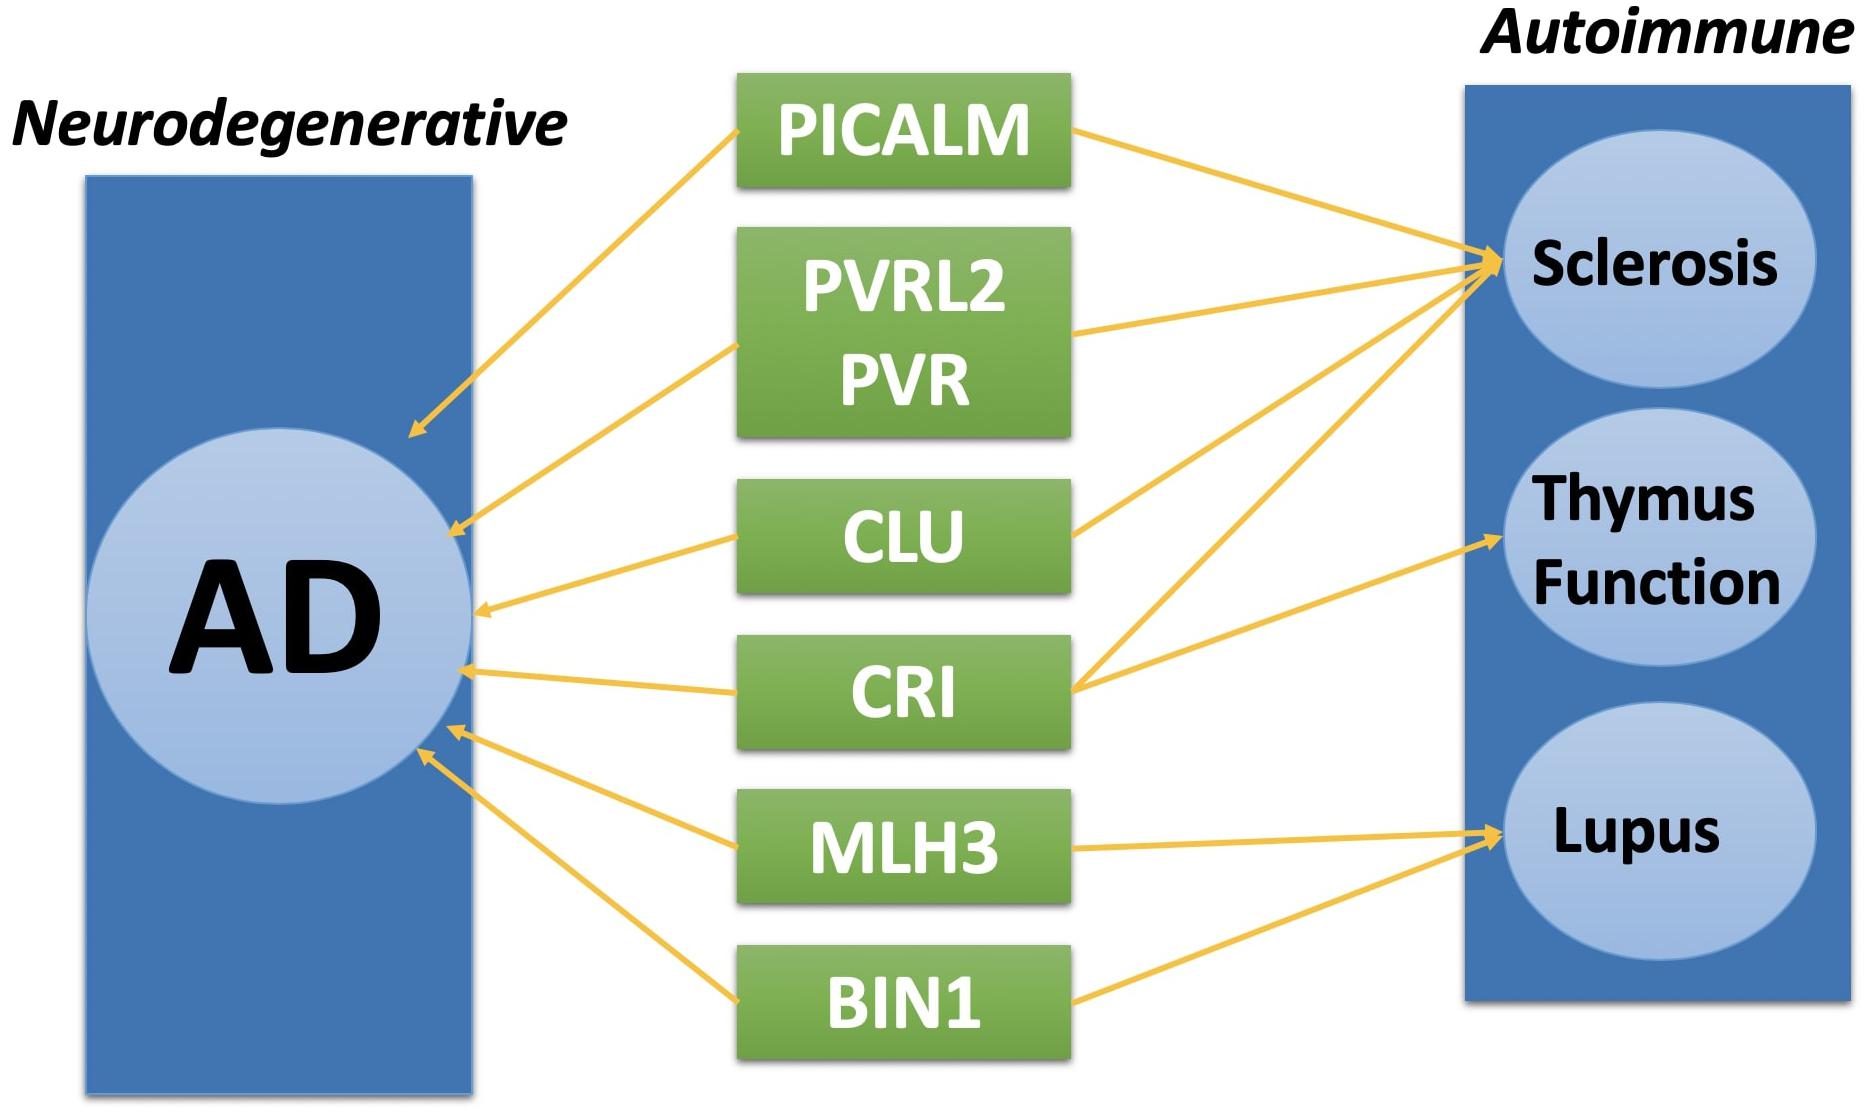
Figure 3. Shared disease associated gene between Alzheimer’s disease (AD) and Autoimmune diseases.
Author Contributions
RW and YZ wrote the method manuscript. SH and HZ analyzed the data and wrote the manuscript. All authors read and approved the final manuscript.
Funding
Publication costs were funded by the Fundamental Research Funds for the Central Universities (Grant No. HIT NSRIF 201856), National Natural Science Foundation of China (Grant No. 61502125), Heilongjiang Postdoctoral Fund (Grant Nos. LBH-Z6064 and LBH-Z15179), and China Postdoctoral Science Foundation (Grant No. 2016 M590291).
Conflict of Interest Statement
The authors declare that the research was conducted in the absence of any commercial or financial relationships that could be construed as a potential conflict of interest.
Supplementary Material
The Supplementary Material for this article can be found online at: https://www.frontiersin.org/articles/10.3389/fgene.2018.00653/full#supplementary-material
References
Al-Sweel, N., Raghavan, V., Dutta, A., Ajith, V. P., Di Vietro, L., Khondakar, N., et al. (2017). mlh3 mutations in baker’s yeast alter meiotic recombination outcomes by increasing noncrossover events genome-wide. PLoS Genet. 13:e1006974. doi: 10.1371/journal.pgen.1006974
Alzheimer’s Association (2016). Alzheimer’s disease facts and figures. Alzheimers Dement. 12, 459–509.
Armstrong, D. L., Zidovetzki, R., Alarcon-Riquelme, M. E., Tsao, B. P., Criswell, L. A., Kimberly, R. P., et al. (2014). GWAS identifies novel SLE susceptibility genes and explains the association of the HLA region. Genes Immun. 15, 347–354. doi: 10.1038/gene.2014.23
Benjamini, Y., and Hochberg, Y. (1995). Controlling the false discovery rate - a practical and powerful approach to multiple testing. J. R. Stat. Soc. Series B Methodol. 57, 289–300. doi: 10.1111/j.2517-6161.1995.tb02031.x
Cacciottolo, M., Christensen, A., Moser, A., Liu, J. H., Pike, C. J., Smith, C., et al. (2016). The APOE4 allele shows opposite sex bias in microbleeds and Alzheimer’s disease of humans and mice. Neurobiol. Aging 37, 47–57. doi: 10.1016/j.neurobiolaging.2015.10.010
Carter, C. (2011). Alzheimer’s disease: APP, gamma secretase, APOE, CLU, CR1, PICALM, ABCA7, BIN1, CD2AP, CD33, EPHA1, and MS4A2, and their relationships with herpes simplex, C. Pneumoniae, other suspect pathogens, and the immune system. Int. J. Alzheimers Dis. 2011:501862. doi: 10.4061/2011/501862
Carter, C. J. (2010). Alzheimer’s disease: a pathogenetic autoimmune disorder caused by herpes simplex in a gene-dependent manner. Int. J. Alzheimers Dis. 2010:140539. doi: 10.4061/2010/140539
Cheng, L., Hu, Y., Sun, J., Zhou, M., and Jiang, Q. (2018a). DincRNA: a comprehensive web-based bioinformatics toolkit for exploring disease associations and ncRNA function. Bioinformatics 34, 1953–1956. doi: 10.1093/bioinformatics/bty002
Cheng, L., Jiang, Y., Ju, H., Sun, J., Peng, J., Zhou, M., et al. (2018b). InfAcrOnt: calculating cross-ontology term similarities using information flow by a random walk. BMC Genomics 19:919. doi: 10.1186/s12864-017-4338-6
Cheng, L., Jiang, Y., Wang, Z., Shi, H., Sun, J., Yang, H., et al. (2016a). DisSim: an online system for exploring significant similar diseases and exhibiting potential therapeutic drugs. Sci. Rep. 6:30024. doi: 10.1038/srep30024
Cheng, L., Sun, J., Xu, W., Dong, L., Hu, Y., and Zhou, M. (2016b). OAHG: an integrated resource for annotating human genes with multi-level ontologies. Sci. Rep. 10:34820. doi: 10.1038/srep34820
Cheng, L., Yang, H., Zhao, H., Pei, X., Shi, H., Sun, J., et al. (2017). MetSigDis: a manually curated resource for the metabolic signatures of diseases. Brief. Bioinform. doi: 10.1093/bib/bbx103 [Epub ahead ofprint].
D’Andrea, M. R. (2005). Add Alzheimer’s disease to the list of autoimmune diseases. Med. Hypotheses 64, 458–463. doi: 10.1016/j.mehy.2004.08.024
David, D. C., Hauptmann, S., Scherping, I., Schuessel, K., Keil, U., Rizzu, P., et al. (2005). Proteomic and functional analyses reveal a mitochondrial dysfunction in P301L tau transgenic mice. J. Biol. Chem. 280, 23802–23814. doi: 10.1074/jbc.M500356200
Estiar, M. A., Esmaeili, R., Zare, A. A., Farahmand, L., Fazilaty, H., Zekri, A., et al. (2017). High expression of CEACAM19, a new member of carcinoembryonic antigen gene family, in patients with breast cancer. Clin. Exp. Med. 17, 547–553. doi: 10.1007/s10238-016-0442-1
French, L. E., Sappino, A. P., Tschopp, J., and Schifferli, J. A. (1992). Distinct sites of production and deposition of the putative cell death marker clusterin in the human thymus. J. Clin. Invest. 90, 1919–1925. doi: 10.1172/JCI116069
Fromer, M., Roussos, P., Sieberts, S. K., Johnson, J. S., Kavanagh, D. H., Perumal, T. M., et al. (2016). Gene expression elucidates functional impact of polygenic risk for schizophrenia. Nat. Neurosci. 19, 1442–1453. doi: 10.1038/nn.4399
Gamazon, E. R., Wheeler, H. E., Shah, K. P., Mozaffari, S. V., Aquino-Michaels, K., Carroll, R. J., et al. (2015). A gene-based association method for mapping traits using reference transcriptome data. Nat. Genet. 47, 1091–1098. doi: 10.1038/ng.3367
Gatz, M., Reynolds, C. A., Fratiglioni, L., Johansson, B., Mortimer, J. A., Berg, S., et al. (2006). Role of genes and environments for explaining Alzheimer disease. Arch. Gen. Psychiatry 63, 168–174. doi: 10.1001/archpsyc.63.2.168
Gharesouran, J., Rezazadeh, M., Khorrami, A., Ghojazadeh, M., and Talebi, M. (2014). Genetic evidence for the involvement of variants at APOE, BIN1, CR1, and PICALM loci in risk of late-onset Alzheimer’s disease and evaluation for interactions with APOE genotypes. J. Mol. Neurosci. 54, 780–786. doi: 10.1007/s12031-014-0377-5
Goh, L. K., Lim, W. S., Teo, S., Vijayaraghavan, A., Chan, M., Tay, L., et al. (2015). TOMM40 alterations in Alzheimer’s disease over a 2-year follow-up period. J. Alzheimers Dis. 44, 57–61. doi: 10.3233/JAD-141590
Greenbaum, L., Springer, R. R., Lutz, M. W., Heymann, A., Lubitz, I., Cooper, I., et al. (2014). The TOMM40 poly-T rs10524523 variant is associated with cognitive performance among non-demented elderly with type 2 diabetes. Eur. Neuropsychopharmacol. 24, 1492–1499. doi: 10.1016/j.euroneuro.2014.06.002
Gusev, A., Ko, A., Shi, H., Bhatia, G., Chung, W., Penninx, B. W., et al. (2016). Integrative approaches for large-scale transcriptome-wide association studies. Nat. Genet. 48, 245–252. doi: 10.1038/ng.3506
Han, Z., Huang, H., Gao, Y., and Huang, Q. (2017). Functional annotation of Alzheimer’s disease associated loci revealed by GWASs. PLoS One 12:e0179677. doi: 10.1371/journal.pone.0179677
Hu, Y., Cheng, L., Zhang, Y., Bai, W., Wang, T., Han, Z., et al. (2017a). Rs4878104 contributes to Alzheimer’s disease risk and regulates DAPK1 gene expression. Neurol. Sci. 38, 1255–1262. doi: 10.1007/s10072-017-2959-9
Hu, Y., Zheng, L., Cheng, L., Bai, W., Wang, T., Han, Z., et al. (2017b). GAB2 rs2373115 variant contributes to Alzheimer’s disease risk specifically in European population. J. Neurol. Sci. 375, 18–22. doi: 10.1016/j.jns.2017.01.030
Hu, Y., Zhou, M., Shi, H., Ju, H., Jiang, Q., and Cheng, L. (2017c). Measuring disease similarity and predicting disease-related ncRNAs by a novel method. BMC Med. Genomics 10(Suppl. 5):71. doi: 10.1186/s12920-017-0315-9
Hu, Y., Zhao, T., Zhang, N., Zang, T., Zhang, J., and Cheng, L. (2018). Identifying diseases-related metabolites using random walk. BMC Bioinformatics 19(Suppl. 5):116. doi: 10.1186/s12859-018-2098-1
Humphries, A. D., Streimann, I. C., Stojanovski, D., Johnston, A. J., Yano, M., Hoogenraad, N. J., et al. (2005). Dissection of the mitochondrial import and assembly pathway for human Tom40. J. Biol. Chem. 280, 11535–11543. doi: 10.1074/jbc.M413816200
Javid, M., Sasanakietkul, T., Nicolson, N. G., Gibson, C. E., Callender, G. G., Korah, R., et al. (2018). DNA mismatch repair deficiency promotes genomic instability in a subset of papillary thyroid cancers. World J. Surg. 42, 358–366. doi: 10.1007/s00268-017-4299-6
Karch, C. M., Ezerskiy, L. A., Bertelsen, S., Alzheimer’s Disease Genetics Consortium (ADGC), and Goate, A. M. (2016). Alzheimer’s disease risk polymorphisms regulate gene expression in the ZCWPW1 and the CELF1 loci. PLoS One 11:e0148717. doi: 10.1371/journal.pone.0148717
Kulminski, A. M., Huang, J., Wang, J., He, L., Loika, Y., and Culminskaya, I. (2018). Apolipoprotein E region molecular signatures of Alzheimer’s disease. Aging Cell doi: 10.1111/acel.12779 [Epub ahead of print].
Lambert, J. C., Ibrahim-Verbaas, C. A., Harold, D., Naj, A. C., Sims, R., Bellenguez, C., et al. (2013). Meta-analysis of 74,046 individuals identifies 11 new susceptibility loci for Alzheimer’s disease. Nat. Genet. 45, 1452–1458. doi: 10.1038/ng.2802
Lee, D. H., Heo, Y. R., Park, W. J., and Lee, J. H. (2017). A TERT-CLPTM1 locus polymorphism (rs401681) is associated with EGFR mutation in non-small cell lung cancer. Pathol. Res. Pract. 213, 1340–1343. doi: 10.1016/j.prp.2017.09.028
Lehrer, S., and Rheinstein, P. H. (2015). Is Alzheimer’s disease autoimmune inflammation of the brain that can be treated with nasal nonsteroidal anti-inflammatory drugs? Am. J. Alzheimers Dis. 30, 225–227. doi: 10.1177/1533317514545478
Liao, F., Yoon, H., and Kim, J. (2017). Apolipoprotein E metabolism and functions in brain and its role in Alzheimer’s disease. Curr. Opin. Lipidol. 28, 60–67. doi: 10.1097/MOL.0000000000000383
Llorca-Cardenosa, M. J., Pena-Chilet, M., Mayor, M., Gomez-Fernandez, C., Casado, B., Martin-Gonzalez, M., et al. (2014). Long telomere length and a TERT-CLPTM1 locus polymorphism association with melanoma risk. Eur. J. Cancer 50, 3168–3177. doi: 10.1016/j.ejca.2014.09.017
Lofgren, D. L., Harris, D. L., Stewart, T. S., and Schinckel, A. P. (1989). Adapting best linear unbiased prediction (BLUP) for timely genetic evaluation: II. Progeny traits in multiple contemporary groups within a herd. J. Anim. Sci. 67, 3223–3242. doi: 10.2527/jas1989.67123223x
Lyall, D. M., Harris, S. E., Bastin, M. E., Munoz Maniega, S., Murray, C., Lutz, M. W., et al. (2014). Alzheimer’s disease susceptibility genes APOE and TOMM40, and brain white matter integrity in the Lothian Birth Cohort 1936. Neurobiol. Aging 35, 1513.e25–1533.e25. doi: 10.1016/j.neurobiolaging.2014.01.006
Mahoney-Sanchez, L., Belaidi, A. A., Bush, A. I., and Ayton, S. (2016). The complex role of apolipoprotein E in Alzheimer’s disease: an overview and update. J. Mol. Neurosci. 60, 325–335. doi: 10.1007/s12031-016-0839-z
Mazure, C. M., and Swendsen, J. (2017). Sex differences in Alzheimer’s disease and other dementias. Lancet Neurol. 15, 451–452. doi: 10.1016/S1474-4422(16)00067-3
Mise, A., Yoshino, Y., Yamazaki, K., Ozaki, Y., Sao, T., Yoshida, T., et al. (2017). TOMM40 and APOE gene expression and cognitive decline in Japanese Alzheimer’s disease subjects. J. Alzheimers Dis. 60, 1107–1117. doi: 10.3233/JAD-170361
Morgen, K., Ramirez, A., Frolich, L., Tost, H., Plichta, M. M., Kolsch, H., et al. (2014). Genetic interaction of PICALM and APOE is associated with brain atrophy and cognitive impairment in Alzheimer’s disease. Alzheimers Dement. 10(5 Suppl.), S269–S276. doi: 10.1016/j.jalz.2013.11.001
Nicolae, D. L., Gamazon, E., Zhang, W., Duan, S. W., Dolan, M. E., and Cox, N. J. (2010). Trait-associated SNPs are more likely to be eQTLs: annotation to enhance discovery from GWAS. PLoS Genet. 6:e1000888. doi: 10.1371/journal.pgen.1000888
Nuotio, J., Oikonen, M., Magnussen, C. G., Jokinen, E., Laitinen, T., Hutri-Kahonen, N., et al. (2014). Cardiovascular risk factors in 2011 and secular trends since 2007: the cardiovascular risk in young finns study. Scand. J. Public Health 42, 563–571. doi: 10.1177/1403494814541597
Pasaniuc, B., Zaitlen, N., Shi, H., Bhatia, G., Gusev, A., Pickrell, J., et al. (2014). Fast and accurate imputation of summary statistics enhances evidence of functional enrichment. Bioinformatics 30, 2906–2914. doi: 10.1093/bioinformatics/btu416
Pekalski, M. L., Garcia, A. R., Ferreira, R. C., Rainbow, D. B., Smyth, D. J., Mashar, M., et al. (2017). Neonatal and adult recent thymic emigrants produce IL-8 and express complement receptors CR1 and CR2. JCI Insight 2:93739. doi: 10.1172/jci.insight.93739
Pomara, N., Bruno, D., Sidtis, J. J., Lutz, M. W., Greenblatt, D. J., Saunders, A. M., et al. (2011). Translocase of outer mitochondrial membrane 40 homolog (TOMM40) poly-T length modulates lorazepam-related cognitive toxicity in healthy APOE epsilon4-negative elderly. J. Clin. Psychopharmacol. 31, 544–546. doi: 10.1097/JCP.0b013e318222810e
Raitakari, O. T., Juonala, M., Ronnemaa, T., Keltikangas-Jarvinen, L., Rasanen, L., Pietikainen, M., et al. (2008). Cohort profile: the cardiovascular risk in young finns study. Int. J. Epidemiol. 37, 1220–1226. doi: 10.1093/ije/dym225
Roses, A., Sundseth, S., Saunders, A., Gottschalk, W., Burns, D., and Lutz, M. (2016). Understanding the genetics of APOE and TOMM40 and role of mitochondrial structure and function in clinical pharmacology of Alzheimer’s disease. Alzheimers Dement. 12, 687–694. doi: 10.1016/j.jalz.2016.03.015
Roses, A. D., Lutz, M. W., Crenshaw, D. G., Grossman, I., Saunders, A. M., and Gottschalk, W. K. (2013). TOMM40 and APOE: requirements for replication studies of association with age of disease onset and enrichment of a clinical trial. Alzheimers Dement. 9, 132–136. doi: 10.1016/j.jalz.2012.10.009
Ryu, J., Woo, J., Shin, J., Ryoo, H., Kim, Y., and Lee, C. (2014). Profile of differential promoter activity by nucleotide substitution at GWAS signals for multiple sclerosis. Medicine 93:e281. doi: 10.1097/MD.0000000000000281
Souliotis, V. L., Vougas, K., Gorgoulis, V. G., and Sfikakis, P. P. (2016). Defective DNA repair and chromatin organization in patients with quiescent systemic lupus erythematosus. Arthritis Res. Ther. 18:182. doi: 10.1186/s13075-016-1081-3
Storey, J. D., and Tibshirani, R. (2003). Statistical significance for genomewide studies. Proc. Natl. Acad. Sci. U.S.A. 100, 9440–9445. doi: 10.1073/pnas.1530509100
Swerdlow, R. H., and Khan, S. M. (2004). A ”mitochondrial cascade hypothesis” for sporadic Alzheimer’s disease. Med. Hypotheses 63, 8–20. doi: 10.1016/j.mehy.2003.12.045
Tibshirani, R. (1997). The lasso method for variable selection in the Cox model. Stat. Med. 16, 385–395. doi: 10.1002/(SICI)1097-0258(19970228)16:4<385::AID-SIM380>3.0.CO;2-3
Tsou, P.-S., Wren, J. D., Amin, M. A., Schiopu, E., Fox, D. A., Khanna, D., et al. (2016). Histone deacetylase 5 is overexpressed in scleroderma endothelial cells and impairs angiogenesis via repression of proangiogenic factors. Arthritis Rheumatol. 68, 2975–2985. doi: 10.1002/art.39828
van Luijn, M. M., van Meurs, M., Stoop, M. P., Verbraak, E., Wierenga-Wolf, A. F., Melief, M. J., et al. (2016). Elevated expression of the cerebrospinal fluid disease markers chromogranin a and clusterin in astrocytes of multiple sclerosis white matter lesions. J. Neuropathol. Exp. Neurol. 75, 86–98. doi: 10.1093/jnen/nlv004
Welter, D., MacArthur, J., Morales, J., Burdett, T., Hall, P., Junkins, H., et al. (2014). The NHGRI GWAS catalog, a curated resource of SNP-trait associations. Nucleic Acids Res. 42, D1001–D1006. doi: 10.1093/nar/gkt1229
Wotton, C. J., and Goldacre, M. J. (2017). Associations between specific autoimmune diseases and subsequent dementia: retrospective record-linkage cohort study, UK. J. Epidemiol. Community Health 71, 576–583. doi: 10.1136/jech-2016-207809
Wright, F. A., Sullivan, P. F., Brooks, A. I., Zou, F., Sun, W., Xia, K., et al. (2014). Heritability and genomics of gene expression in peripheral blood. Nat. Genet. 46, 430–437. doi: 10.1038/ng.2951
Xia, Z., Chibnik, L. B., Glanz, B. I., Liguori, M., Shulman, J. M., Tran, D., et al. (2010). A putative Alzheimer’s disease risk allele in PCK1 influences brain atrophy in multiple sclerosis. PLoS One 5:e14169. doi: 10.1371/journal.pone.0014169
Yu, C. E., Seltman, H., Peskind, E. R., Galloway, N., Zhou, P. X., Rosenthal, E., et al. (2007). Comprehensive analysis ofAPOE and selected proximate markers for late-onset Alzheimer’s disease: patterns of linkage disequilibrium and disease/marker association. Genomics 89, 655–665. doi: 10.1016/j.ygeno.2007.02.002
Keywords: Alzheimer’s disease, genome-wide association study, autoimmune diseases, transcriptome-wide association study, false discover rate
Citation: Hao S, Wang R, Zhang Y and Zhan H (2019) Prediction of Alzheimer’s Disease-Associated Genes by Integration of GWAS Summary Data and Expression Data. Front. Genet. 9:653. doi: 10.3389/fgene.2018.00653
Received: 15 October 2018; Accepted: 03 December 2018;
Published: 07 January 2019.
Edited by:
Yan Huang, Harvard Medical School, United StatesReviewed by:
Mingxuan Han, University of Utah, United StatesYaohui Nie, Harvard University, United States
Copyright © 2019 Hao, Wang, Zhang and Zhan. This is an open-access article distributed under the terms of the Creative Commons Attribution License (CC BY). The use, distribution or reproduction in other forums is permitted, provided the original author(s) and the copyright owner(s) are credited and that the original publication in this journal is cited, in accordance with accepted academic practice. No use, distribution or reproduction is permitted which does not comply with these terms.
*Correspondence: Sicheng Hao, aGFvLnNpY0BodXNreS5uZXUuZWR1 Yu Zhang, eXdrd3kyMDEyQDE2My5jb20= Hui Zhan, MjAwMDA5MkBobGp1LmVkdS5jbg==