 Elaina M. Maldonado
 Fatma Taha
 Joyeeta Rahman
 Shamima Rahman
- 1Mitochondrial Research Group, UCL Great Ormond Street Institute of Child Health, London, United Kingdom
- 2Metabolic Unit, Great Ormond Street Hospital for Children NHS Foundation Trust, London, United Kingdom
Primary mitochondrial diseases form one of the most common and severe groups of genetic disease, with a birth prevalence of at least 1 in 5000. These disorders are multi-genic and multi-phenotypic (even within the same gene defect) and span the entire age range from prenatal to late adult onset. Mitochondrial disease typically affects one or multiple high-energy demanding organs, and is frequently fatal in early life. Unfortunately, to date there are no known curative therapies, mostly owing to the rarity and heterogeneity of individual mitochondrial diseases, leading to diagnostic odysseys and difficulties in clinical trial design. This review aims to discuss recent advances and challenges of systems approaches for the study of primary mitochondrial diseases. Although there has been an explosion in the generation of omics data, few studies have progressed toward the integration of multiple levels of omics. It is evident that the integration of different types of data to create a more complete representation of biology remains challenging, perhaps due to the scarcity of available integrative tools and the complexity inherent in their use. In addition, “bottom-up” systems approaches have been adopted for use in the iterative cycle of systems biology: from data generation to model prediction and validation. Primary mitochondrial diseases, owing to their complex nature, will most likely benefit from a multidisciplinary approach encompassing clinical, molecular and computational studies integrated together by systems biology to elucidate underlying pathomechanisms for better diagnostics and therapeutic discovery. Just as next generation sequencing has rapidly increased diagnostic rates from approximately 5% up to 60% over two decades, more recent advancing technologies are encouraging; the generation of multi-omics, the integration of multiple types of data, and the ability to predict perturbations will, ultimately, be translated into improved patient care.
Introduction
Mitochondria are double membraned sub-cellular structures that perform multiple cellular and metabolic functions including the production of reducing equivalents through the tricarboxylic acid (TCA) cycle and fatty acid β-oxidation, maintenance of calcium homeostasis, nutrient signalling through mTOR, AMPK and other pathways, and the production of reactive oxygen and nitrogen species (Rahman and Rahman, 2018). The best studied and most well-known function of mitochondria, however, is the production of energy in the form of ATP through the process of oxidative phosphorylation (OXPHOS). The pumping of protons through four enzyme complexes (complexes I–IV) results in an electrochemical gradient across the inner mitochondrial membrane which in turn generates a chemiosmotic force that is utilised by the fifth complex, the F1F0-ATP-synthase, to phosphorylate ADP to ATP (Hatefi, 1985). OXPHOS requires the coordinated effort of greater than 400 proteins (Pagliarini et al., 2008) including the subunits and assembly factors of the five multi-subunit enzyme complexes, mobile electron carriers, and protein and nucleotide transporters. Whilst most OXPHOS proteins and the majority of the ∼1500 mitochondrial proteins (Calvo et al., 2016) are encoded in the nuclear genome, mitochondria also have endogenous mitochondrial DNA (mtDNA) as a result of an endosymbiotic event nearly 2 billion years ago (Gray et al., 1999). The mitochondrial genome is a small circular genome present in multiple copies, encoding 13 protein-coding genes, all of which are OXPHOS subunits, as well as 24 tRNA and rRNA genes to enable their translation (Anderson et al., 1981).
Both genomic and mtDNA mutations can lead to primary mitochondrial disorders which represent one of the most common (prevalence of 1:5000) and debilitating inherited metabolic diseases (Gorman et al., 2015), often resulting in early mortality. To date, more than 350 genes have been causally linked to mitochondrial disease (Rahman and Rahman, 2018). The genetic landscape of mitochondrial disorders is not only complicated by the involvement of multiple genomes, but also by the co-existence of mutant and wild-type mtDNA molecules in different cells and tissues, a phenomenon known as heteroplasmy (Stewart and Chinnery, 2015). Furthermore, patients often present with multi-systemic disease, especially affecting organs with high bioenergetic demands such as the brain (Rahman, 2015; Pitceathly, 2016; Hikmat et al., 2017), heart (Götz et al., 2011; Enns, 2017), muscle (DiMauro et al., 1985; Holt et al., 1988; Pfeffer and Chinnery, 2013) and liver (McKiernan et al., 2016). A number of mitochondrial gene defects can be associated with defined clinical syndromes, such as mitochondrial encephalopathy lactic acidosis and stroke-like episodes (MELAS), which is usually associated with a specific mutation in the mitochondrial leucine tRNA (El-Hattab et al., 2015), or Leigh syndrome, an encephalomyelopathy characterised by bilateral basal ganglia lesions, which can be caused by defects of more than 89 different mitochondrial and nuclear genes (Leigh, 1951; Rahman et al., 2017). Most mitochondrial diseases, however, do not fit into a classical syndromic presentation and can affect nearly any organ or system in the body in any combination (Munnich et al., 1992). Moreover, mutations in the same gene can lead to contrasting clinical presentations between patients, even within a single family. While OXPHOS dysfunction certainly contributes to disease pathophysiology, especially in patients with isolated or combined OXPHOS complex deficiencies, it is evident that a multitude of impaired mitochondrial functions contribute to disease. These include imbalanced mitochondrial dynamics (Janer et al., 2016), aberrant mitochondrial lipid homeostasis (Wortmann et al., 2012), deficiencies of vitamin and cofactor metabolism (Duncan et al., 2009), and altered redox ratios (Khan et al., 2014; Titov et al., 2016). Many aspects of mitochondrial dysfunction also contribute to the pathophysiology of cancer (Warburg et al., 1927; Vyas et al., 2016), neurodegenerative disorders (Lin and Beal, 2006; Grunewald et al., 2018), and organismal ageing (Bratic and Larsson, 2013). The genetic, pathophysiological, and clinical heterogeneity observed in mitochondrial disorders have resulted in diagnostic odysseys and a lack of curative therapies for affected patients, contributing to an overall poor prognosis.
An improvement in diagnostic and therapeutic outcomes requires an enhanced understanding of mitochondrial function and pathophysiology. In recent years, systems biology, or the use of computational and mathematical methods to model complex biological systems, has emerged as a valuable tool to analyse and characterise complex cellular and organellar relationships in health and disease states. Biological networks can be created using experimental “omics” datasets (e.g., genomics, transcriptomics, proteomics, metabolomics, and epigenomics) (Topol, 2014) as scaffolds to construct models (Baumgart et al., 2016; Lienhard et al., 2017; Ali et al., 2018). This approach enables identification of novel pathomechanisms, but can also be used to identify novel biomarkers and therapeutic targets for mitochondrial disease (Suomalainen et al., 2011). Conversely, the modelling of biological systems can be achieved by constructing GEnome-scale Metabolic models (GEMs) from pre-existing database and literature inputs rather than using novel experimental data (O’Brien et al., 2015; Brunk et al., 2018). The latter approach aims to fully encompass all interactions within a system. These models can then be subjected to manipulations and provide another means for predictive modelling. In the context of mitochondrial disorders, this approach can be exploited to observe the functional consequences of aberrant genetic changes or to identify novel therapeutic points of intervention which could facilitate targeted novel drug design or orphan drug repurposing. Additionally, the combination of top-down and bottom-up approaches have proved to be powerful tools to effectively integrate experimental data with the compendium of literature to gain a holistic understanding of a complex biological system (Sun et al., 2018). In practice, model reconstructions begin from whichever level is most rich with data, and build up or down to other levels as required (Noble, 2002), see Figure 1. Network-based approaches therefore are powerful tools to study mitochondrial function (and dysfunction) as they facilitate the visualisation and manipulation of multitudinous interactions between genes, transcripts, proteins, and metabolites. This enables the elucidation of integrative mitochondrial functions and can expedite the discovery of novel interactions which otherwise may have been missed using traditional experimental techniques. These approaches will ultimately have beneficial implications for developing novel diagnostic and therapeutic strategies for mitochondrial disease, refer to Box 1 for key terms. This review will discuss the recent advances that systems approaches have contributed to an overall understanding of mitochondrial biology and pathophysiology, as well as the limitations of these approaches and some of the remaining challenges in the field.
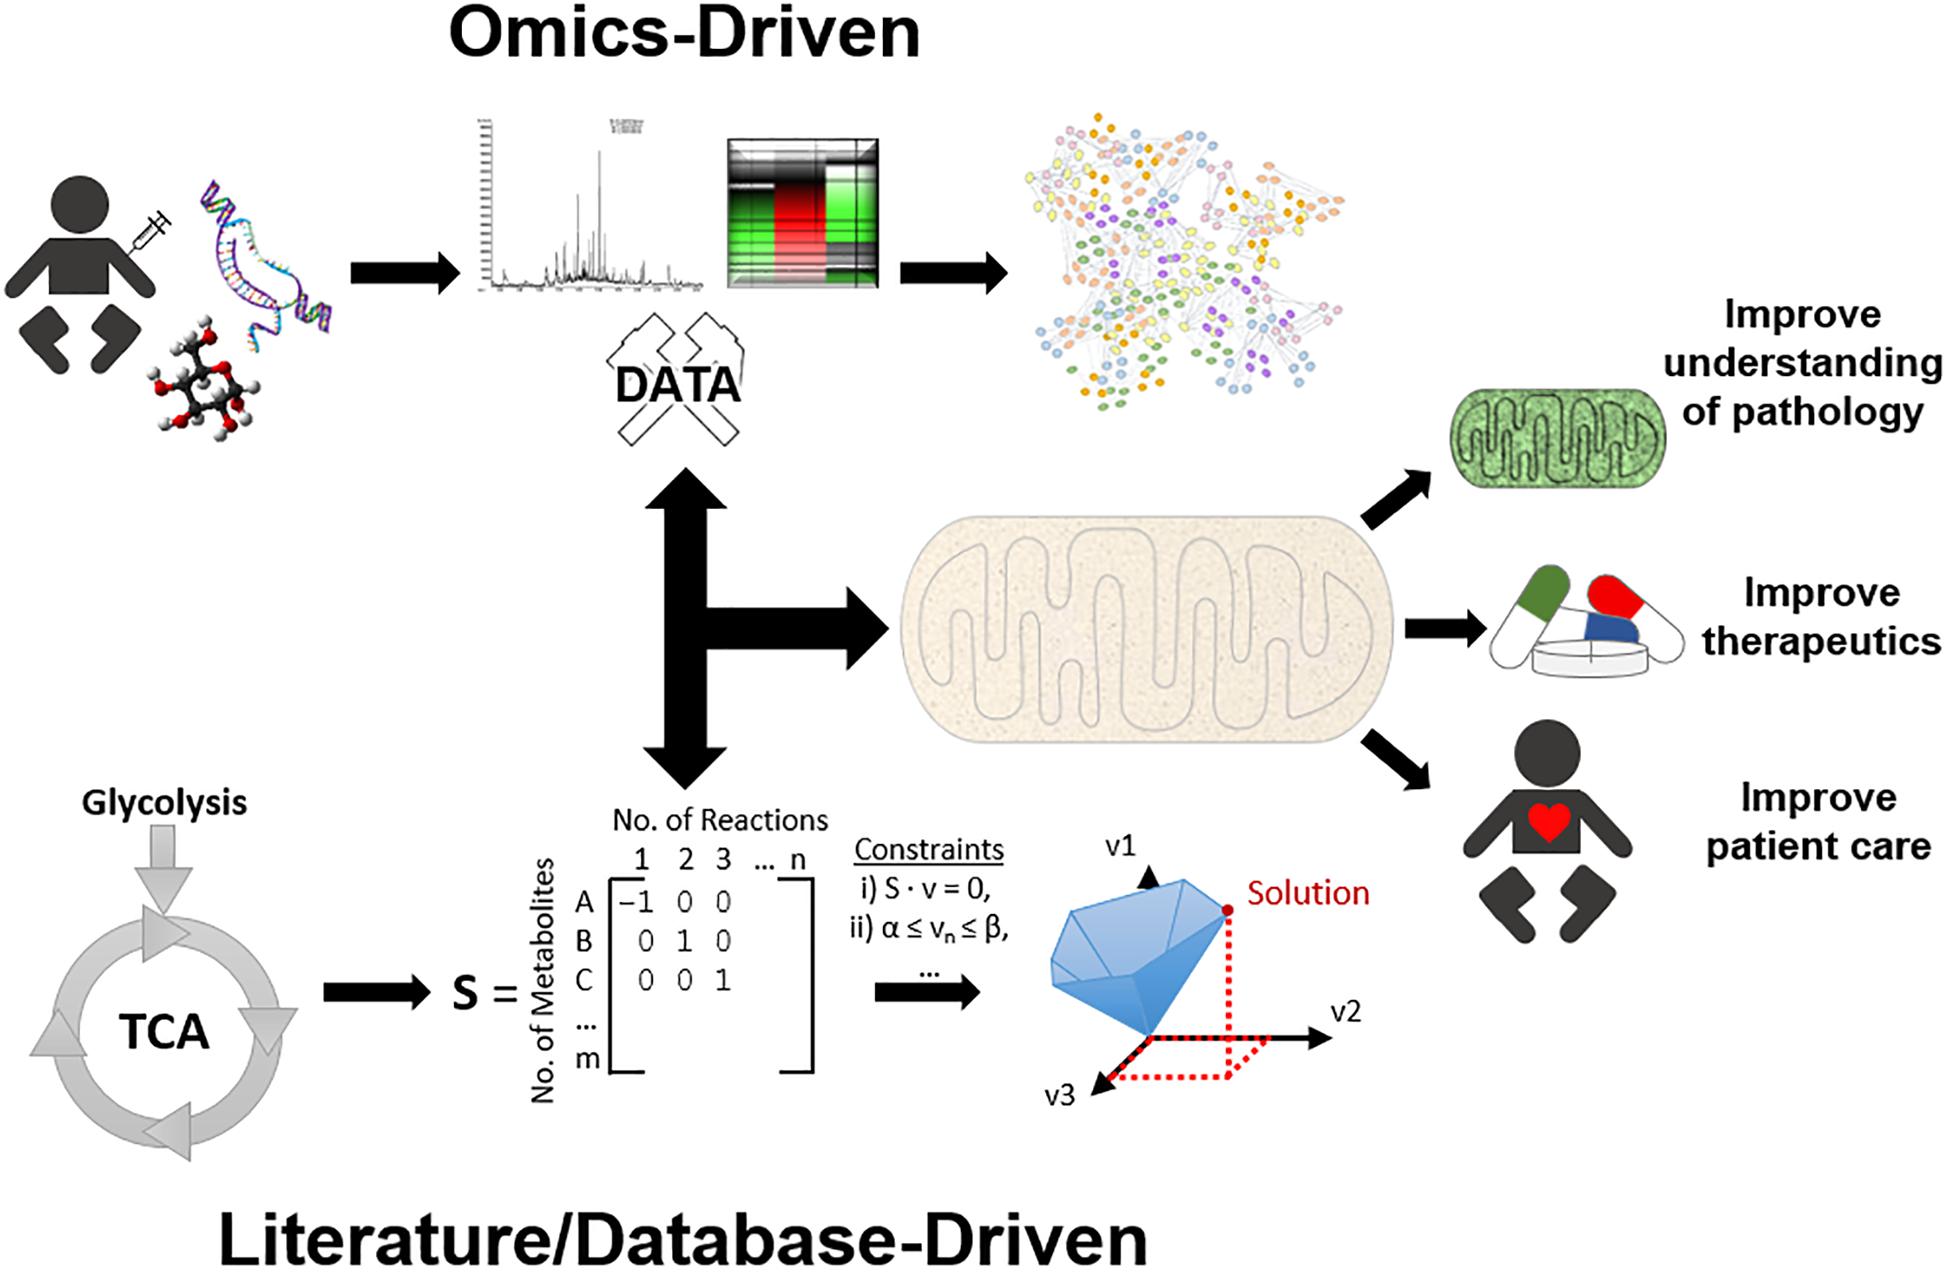
Figure 1. An overview of systems approaches applied for mitochondrial research. To simplify systems-based approaches, they can be categorised into two main approaches, top-down and bottom-up. The top-down workflow can simplistically be described as samples that have been collected, processed by high throughput methods, and analysed by bioinformatics, e.g., protein network analysis, to gain a better understanding of function. On the other side of the spectrum, the bottom-up workflow can be described as identifying molecular data, formatting this information into a genome scale metabolic model (GEM), and utilising constraint-based modelling (CBM) to predict solutions and gain a better understanding of mechanisms. However, in practice the researcher must use whatever data is sufficiently available at any level of organisation, and build up/down/across to other levels, known as middle-out. Together, these systems approaches can aid in mitochondrial research by providing further insight into mitochondrial diseases, therapeutic approaches, and ultimately improving patient health care.
Box 1. Glossary of key terms.
Biological network: a graphical representation of interacting moieties typically depicted as nodes (circles) and edges (lines).
Constraint-based modelling (CBM): a modelling approach that computes mathematical relationships imposed by a set of constraints.
Flux balance analysis (FBA): a constraint-based modelling method that uses linear programming to maximise the objective function, and computes the set of fluxes through the network while satisfying all defined constraints.
Flux variability analysis (FVA): a constraint-based modelling method that computes the minimum and maximum range of each reaction flux through a metabolic network while satisfying all defined constraints.
GEnome-scale Metabolic model (GEM): a mathematical, structured network of chemical reactions to represent the metabolism of a living organism based on its genome and the literature. A GEM can be structured based on defined model constraints which, if known, can include their stoichiometry, thermodynamics, enzymatic capacity, localisation, and functional annotation of gene-protein-reaction association, and other known constraints.
Interactome: a set of all known interactions involved in a particular system studied.
Mitochondrial protein functional (MPF) network: a network modality generated considering protein functions and their subsequent network position.
Network position: a numerical score for nodes within a network ranging from 0 to 1 in order of most central (0) to most peripheral (1) node, corresponding to contribution of that node to network functionality.
Node: an interacting molecule (gene, protein, etc.) in a biological network.
Objective function: a function (or a target reaction/flux) that is desired to be maximised or minimised.
Protein–protein interaction network (PPIN): common network representation in systems biology of all known proteins within a particular system, and all their interactions.
Solution space: a set of all possible values (or solutions) of an optimisation problem that satisfy the problem’s constraints.
Systems biology: an interdisciplinary science which uses mathematical and computational methods, by in silico simulations, to aid the understanding of complex biology by elucidating emergent properties once the system is studied as a whole, rather than in parts.
Transcriptome-metabolome-wide association study (TMWAS): an association study between two layers of omics data, transcriptomic and metabolomic data.
Advances in Systems Mitochondrial Biology
The advent of multi-omics techniques in mitochondrial biology has given rise to a vast amount of large, complex datasets (Rahman and Rahman, 2018). A large number of these datasets can be found online, including UniProt (The UniProt, 2017), Kyoto Encyclopedia of Genes and Genomes (Kanehisa et al., 2016), the Human Protein Atlas (Thul et al., 2017), and mitochondrial databases including MitoCarta (Calvo et al., 2016) and MitoMiner (Smith and Robinson, 2016), in addition to many other mitochondrion-specific databases as listed in Table 1. However, the enormity of these data creates considerable challenges in drawing meaningful conclusions. The development of sophisticated bioinformatics pipelines has enabled the management and analysis of large complex datasets and facilitated meaningful biological interpretation (Luscombe et al., 2001). Although bioinformatics can provide additional insight by re-analysing experimental data, it is limited in its ability to predict behaviour of complex systems. More recently, predictive computational biology has become a fundamental part of systems approaches. It provides a natural continuation within experimental biology to elucidate complex, synergistic, interactive behaviours that underpin emergent properties from a biological system studied as a whole (Kitano, 2002; Pagliarini and Rutter, 2013). For application purposes, several complementary tools can be used in systems approaches, e.g., multiple dataset analyses, omics integration tools, GEMs and constraint-based modelling (CBM), to incorporate and reconcile the increasingly available independent, diverse datasets.
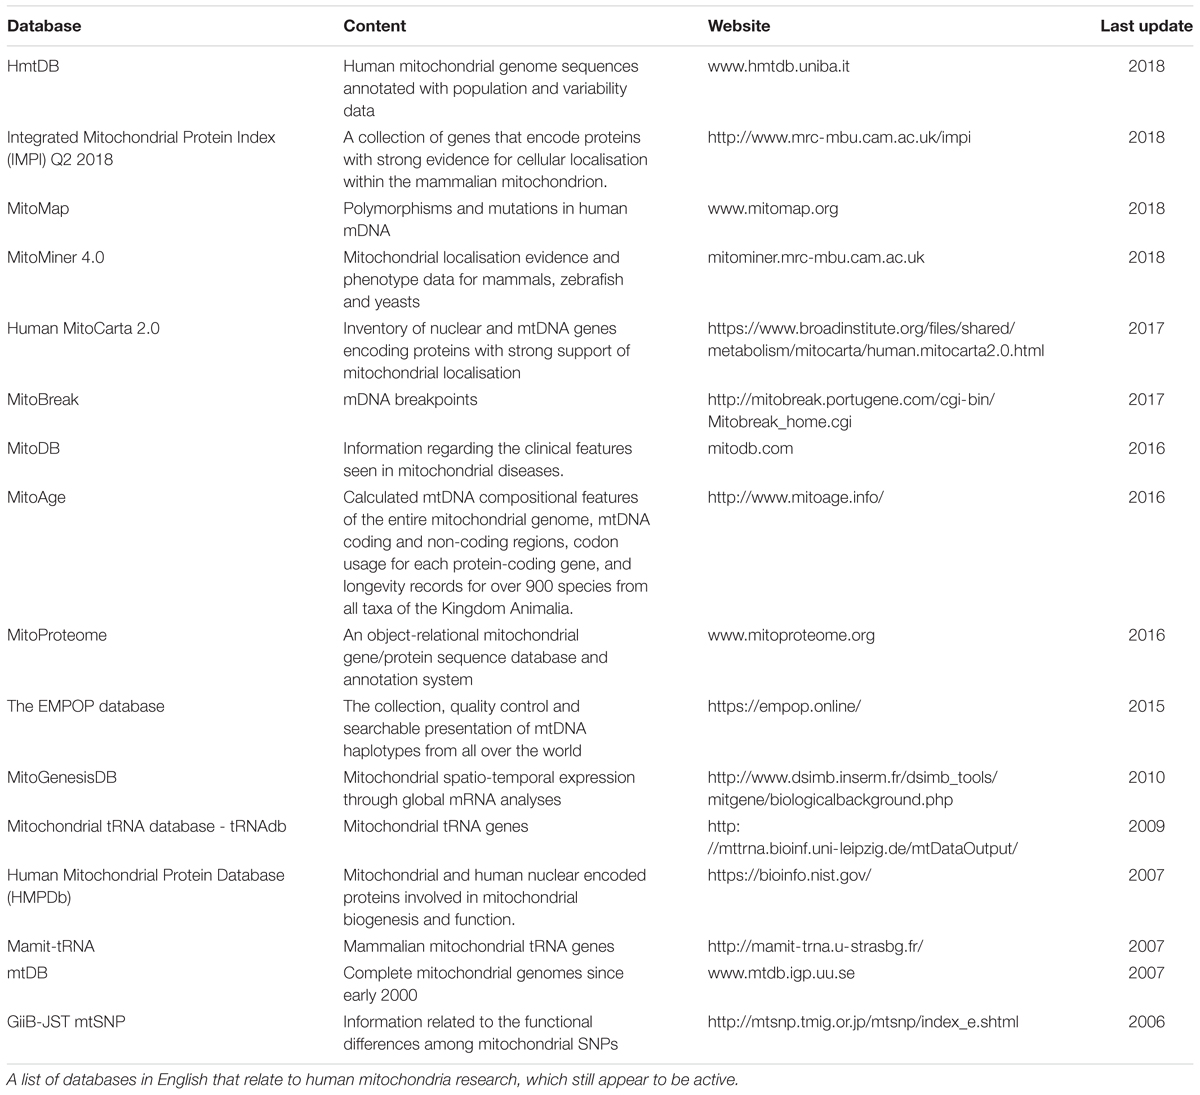
Table 1. Human Mitochondrial Databases.
Multi-Omics Approaches to Understanding Mitochondrial Function
Omics as a Tool in Mitochondrial Research
Systems biology can be used to answer several outstanding (patho)physiological mitochondrial questions including the basic biology of mitochondrial pathways, the pathophysiology underpinning primary mitochondrial disease; and also in models of neoplasms and ageing. Utilising global non-biassed datasets acquired from high-throughput assays or “omics” datasets is one method of enhancing our understanding of complex biological systems. The majority of these types of studies have focussed linearly on one type of analysis and make inferences [reviewed in (Rahman and Rahman, 2018)]. Significant advances have been made in revealing novel aspects of mitochondrial structure and function such as the mitochondrial phosphorylation targets of AMPK (Toyama et al., 2016) or the elucidation of the step-wise assembly of eukaryotic mitochondrial complex I (Stroud et al., 2016). Furthermore, omics-based analyses have been instrumental in understanding disease mechanisms beyond OXPHOS dysfunction/energy deficit which often is insufficient in explaining the clinical phenotypes observed in patients (Thompson Legault et al., 2015; Esterhuizen et al., 2018; Rahman and Rahman, 2018). A notable example is the alteration of one-carbon metabolism in mtDNA maintenance defects in mouse of models of adult and paediatric mitochondrial disease (Nikkanen et al., 2016; Khan et al., 2017).
Integrative Genomics
More than a decade ago, the availability of genome-scale data from Saccharomyces cerevisiae enabled yeast biologists to begin to integrate large-scale functional genomics data to identify candidate mitochondrial disease genes (Steinmetz et al., 2002; Prokisch et al., 2004; Aiyar et al., 2008). At around the same time, the Mootha group at Harvard integrated data from diverse genome-scale data sets using a Bayesian mathematical model, to predict the probability of a mitochondrial function for a specific candidate protein (Calvo et al., 2006). The resulting compendium, named ‘Maestro’, used 8 data sets to compute the likelihood of mitochondrial localisation of 33860 proteins listed in the Ensembl human genome database: presence of an N-terminal mitochondrial import sequence, as predicted by the TargetP programme; presence of protein domains suggesting mitochondrial function, as predicted by the MitoPred programme; cis-regulatory motifs containing binding sites for any of 3 transcription factors (Errα, Gapba, and NRF1) located within 2 kb upstream of the gene; homology to one or more of 749 mitochondrial proteins encoded by the S. cerevisiae genome; ancestral bacterial homology to proteins in Rickettsia prowazekii, thought to be the closest bacterial progenitor of mitochondria; co-expression with genes known to encode mitochondrial proteins; tandem mass spectrometry survey of the mouse mitochondrial proteome; transcriptional activation during a cellular model of mitochondrial biogenesis, in which mitochondrial proliferation was stimulated by exposure to the mitochondrial transcriptional co-activator PGC1-α. Maestro correctly predicted 71% of known mitochondrial proteins when it was first devised. More recent iterations of this compendium, known as MitoCarta and MitoCarta 2.0 (Pagliarini et al., 2008; Calvo et al., 2016), are even more comprehensive and have underpinned the mitochondrial genomic diagnostic revolution (Rahman and Rahman, 2018). It is anticipated that new data and techniques will facilitate development of a complete mitochondrial proteome catalogue in the fullness of time, including tissue-specific databases that might explain tissue-specific manifestations of particular mitochondrial gene defects.
Combining Multi-Omic Datasets
Multi-omics studies are emerging as valuable tools to gain a dynamic understanding of the mitochondrion. Integrative omics approaches as opposed to single-omics based techniques are beneficial as they increase the certainty of a biological finding if it can be validated by concordant multiple omics signatures (genomic, transcriptomic, and proteomic). Frequently, transcriptomic and proteomic signatures do not correlate; thus making endpoint phenotypic inferences based on untargeted transcriptome analyses with no prior associations can be inaccurate or misleading (Wu et al., 2014). This can partially be explained by the fact that high-throughput discovery techniques largely focus on endpoint measurements (transcript/protein level) and cannot accurately account for transcriptional and translational control events which may alter protein expression and downstream functional consequences (Fisher-Wellman et al., 2018). Meaningful functional interpretations can be aided with specialist assays which can be compatible with omics techniques to observe real-time phenotypic changes in response to global transcriptomic/proteomic remodelling. Genome-wide CRISPR-Cas9 screening is one such technique which has been used in conjunction with genomics to identify novel genes involved in OXPHOS (Arroyo et al., 2016). Multi-omics studies can also be aided by functional phenotyping techniques which are compatible with high-throughput screens such as a novel assay suite developed to measure mitochondrial bioenergetics parameters in real-time (Fisher-Wellman et al., 2018).
Multi-layered omics in recent years has been instrumental in elucidating the molecular basis of complex mitochondrial processes including the activation of the mitochondrial unfolded protein response (Wu et al., 2014), identifying transcription factor ATF4 as a regulator of mitonuclear stress (Quirós et al., 2017), the involvement of mitoribosomes and complex IV subunits in T-cell activation (Tan et al., 2017) and the role of mitoprotease Oct1p as a novel regulator of Coenzyme Q10 biosynthesis (Veling et al., 2017). Integrated omics are useful in mitochondrial physiology to discriminate between primary disease-causing mechanisms and compensatory mechanisms. This was recently demonstrated by a study conducted by Mootha and colleagues wherein multi-omic profiling of benign mitochondria-rich renal tumours showed a selective loss-of-function of complex I which in turn led to compensatory glutathione biosynthesis (Gopal et al., 2018). At present, these integrated studies have been limited to cell and animal models (Wu et al., 2014; Kühl et al., 2017; Quirós et al., 2017; Tan et al., 2017; Veling et al., 2017; Lapointe et al., 2018; Lee et al., 2018). However, this body of work highlights the power of systems approaches and integrative omics in elucidating novel mechanisms and will undoubtedly be invaluable in studies of mitochondrial disease pathology in relevant patient cohorts and animal disease models as they become increasingly available.
Interactome Models
Another approach, which has become central to systems biology, has been to build ‘interactome’ networks based on known protein–protein interactions. Early examples of these protein-protein interaction networks (PPINs) include ‘MitoInteractome’ and InterMitoBase (Reja et al., 2009; Gu et al., 2011). MitoInteractome used homology-based interaction modelling across 74 species to produce a database of 6,549 protein sequences (Reja et al., 2009), whilst InterMitoBase mined a range of resources to create a compendium of 5,883 protein–protein interactions between 2,813 proteins (Gu et al., 2011). Another interactome model, the Mitochondrial Protein Functional (MPF) network, built on the observation that the spatial organisation of mitochondrial proteins is linked to function, and localised mitochondrial proteins known to interact with other mitochondrial proteins at the centre of the network, and mitochondrial proteins interacting with non-mitochondrial proteins at the periphery of the network (Yang et al., 2013). The MPF network aimed to use network position (scored 0–1, with more centrally localised proteins scoring closer to 0 and peripheral proteins closer to 1) to represent submitochondrial localisation of 1,254 mitochondrial proteins (Yang et al., 2013). The MPF was validated by finding proteins with core mitochondrial functions such as OXPHOS and fatty acid β-oxidation at the centre of the network (e.g., the short/branched chain acylCoA dehydrogenase ACADSB had a score of 0.062), whereas proteins linked to mitochondrial biogenesis and apoptosis were peripherally located (e.g., the mitochondrial fission factor MFF scored 0.935). Furthermore, network position was highly correlated with mitochondrial compartment – matrix and inner mitochondrial membrane proteins had central network positions, whereas outer mitochondrial membrane proteins were peripherally located in the network. There also appeared to be correlations between disease genes within the network. For example, five genes associated with MELAS had a network position of 0.01, five genes causing pyruvate dehydrogenase (PDH) deficiency had an average score of 0.03 (±0.01), and 21 genes associated with Leigh syndrome had an average network position of 0.10 (±0.09). MELAS, PDH deficiency and Leigh syndrome are all considered primary mitochondrial disorders. In contrast Charcot-Marie-Tooth disease type 2, caused by a defect of axonal mitochondrial transport, had a more peripheral network position with a score of 0.68 (Yang et al., 2013). The authors then went on to use the MPF network to try to predict candidate mitochondrial disease genes, but this approach will need to be finessed as the MPF becomes more sophisticated by the addition of further data. Another application of interactome modelling was the identification of drug targets that could rescue a cellular model of Parkinson’s disease caused by the MPP+ toxin, an inhibitor of mitochondrial complex I (Keane et al., 2015).
Other Network Approaches
Molecular networks can also be used to derive gene ontologies, and this approach was employed to develop the Ingenuity Pathway Analysis software, that uses algorithms to infer omics networks based on functional similarity (Calvano et al., 2005). Disease-specific networks (‘diseasomes’) are increasingly being developed, including for many cancer types, orphan diseases and inborn errors of metabolism (Goh et al., 2007; Barabasi et al., 2011; Zhang et al., 2011). Organ-specific networks are also being created, such as The Virtual Brain, which simulates primate brain network dynamics and holds the promise of a neuroinformatics-based personalised medicine strategy for neurological disorders (Sanz Leon et al., 2013; Falcon et al., 2016). So far, there do not appear to be any mitochondrial disease specific networks, but this is likely to change as multi-omics data sets are generated from larger patient cohorts affected by primary mitochondrial diseases (Rahman and Rahman, 2018). Another emerging field is that of network pharmacology, where molecular networks are being used to screen drugs for efficacy in silico before wet lab testing begins, to try to reduce the costs associated with drug development (Guney et al., 2016).
The aim of network biology is to provide an ‘eagle eye’ view of the system using in silico simulations, and can be applied to view multi-omic datasets. The field of biological networks is expanding exponentially and, going forward, the integration of multiple omics data sets, including genomic, transcriptomic, proteomic, metabolomic and phenomic data, will increase the power of network biology to identify disease mechanisms, biomarkers, and novel treatments (Stevens et al., 2014; Rahman and Rahman, 2018). Previously few tools were able to integrate more than two omics data sets. This is because the different topological features of different omics datasets may render them unable to identify community structures within networks and observe network changes in response to perturbations (e.g., treated versus untreated, or healthy versus diseased) (Uppal et al., 2018). In addition, the integrative analysis of large omics datasets may lead to fitting problems (Liang and Kelemen, 2017). Newer methods such as the Similarity Network Fusion (SNF) are able to aggregate and analyse multiple data sets on a genomic scale (Wang et al., 2014). The fused similarity network is composed of nodes (patients) positioned based on similarity; the greater the similarities between two nodes (a function of all inputted data), the closer they are positioned. The resulting network of clusters of similar patients can then be used to derive information about the very basic molecules that caused these patient clusters to form. If these molecules are consistently present in more than one patient, the SNF can be inferred to be highlighting pertinent disease-related molecules (Wang et al., 2014). In addition, several frameworks are emerging to accommodate the integration of multiple complex omics datasets to visualise data and evaluate changes under different physiological conditions and these have been successfully applied in cancer and immunology (Mo et al., 2013; Argelaguet et al., 2018; Bakker et al., 2018; Forsberg et al., 2018). Recently the xMWAS software has been developed as a new tool to integrate, visualise and analyse up to four omics datasets, by using a partial least squares regression algorithm (Uppal et al., 2018). One application of xMWAS was to analyse mitochondrial mediated toxicity to the toxins paraquat and maneb, and to demonstrate that these exert their mitochondrial toxicities by different molecular mechanisms, as elucidated by global remodelling of the nuclear transcriptome and metabolome. Clustering analysis revealed that paraquat toxicity induced increased antioxidant production, stress response, and mitochondrial biogenesis (Go et al., 2018). Although the molecular mechanisms of paraquat toxicity have been well-characterised (Tawara et al., 1996), the reliable in silico reproducibility of complex pharmacological phenomena can hopefully be used in future to supplement multi-omics mitochondrial studies to identify novel biomarkers and therapeutic targets.
Genome-Scale Metabolic Models
To address the diversity of data that has been accumulating for more than a decade, datasets have been tailored into genetically and biochemically consistent formats, mathematically structured ‘knowledge bases,’ such as GEMs (Papin et al., 2003; O’Brien et al., 2015). A GEM is an organised list of metabolic reactions derived from all available data of an organism’s metabolism. GEMs can be reconstructed into a mathematically structured network, a stoichiometric matrix S = (m × n) where m is the number of metabolites and n is the number of reactions to perform CBM, see Figure 2. It is often assumed that the system is at steady state, thus the net flux is null, Sv = 0, where v is the flux vector. Additional commonly used constraints are thermodynamic constraints to allow irreversibility of reactions, enzymatic capacity and availability of nutrients. These may also be applied so that GEMs can be analysed by CBM methods to target fluxes of metabolic reactions specific to phenotypic behaviour (e.g., growth or energy production) without the need for detailed kinetics, which are frequently not available. Initially, these models were used to represent single cell organisms with only relatively few metabolic reactions to maximise a desired phenotype, or an objective function, e.g., biomass (Price et al., 2003). However, metabolic reconstructions have since increased in size and scope, representing multicellular organisms with much larger genomes, such as Recon3D, the latest global reconstruction of human metabolism (Brunk et al., 2018). Some limitations to using GEMs for CBM methods is that arbitrary rates are typically used to model metabolic behaviour, and that classic CBM methods tend to lack the ability to model stochastic, complex behaviours, such as whole human cell metabolism. This can be due to a number of limiting factors of CBM, but one major controversy in the field is the use of a single defined objective function. Historically, this was used in biotechnology studies of single-cell organisms, where it was a simpler question to determine a single desired phenotype, e.g., growth or biomass. However, when modelling complex organisms where study of more than one phenotype is desirable, this becomes much less trivial. Although this continues to be debated, more recent advances in CBM have included the development of more sophisticated algorithms that allow modelling of more complex behaviours, as briefly discussed later in this review. Additionally, the majority of genome scale models are based on metabolism rather than signalling, although this area is also progressing (Hyduke and Palsson, 2010; Münzner et al., 2017).
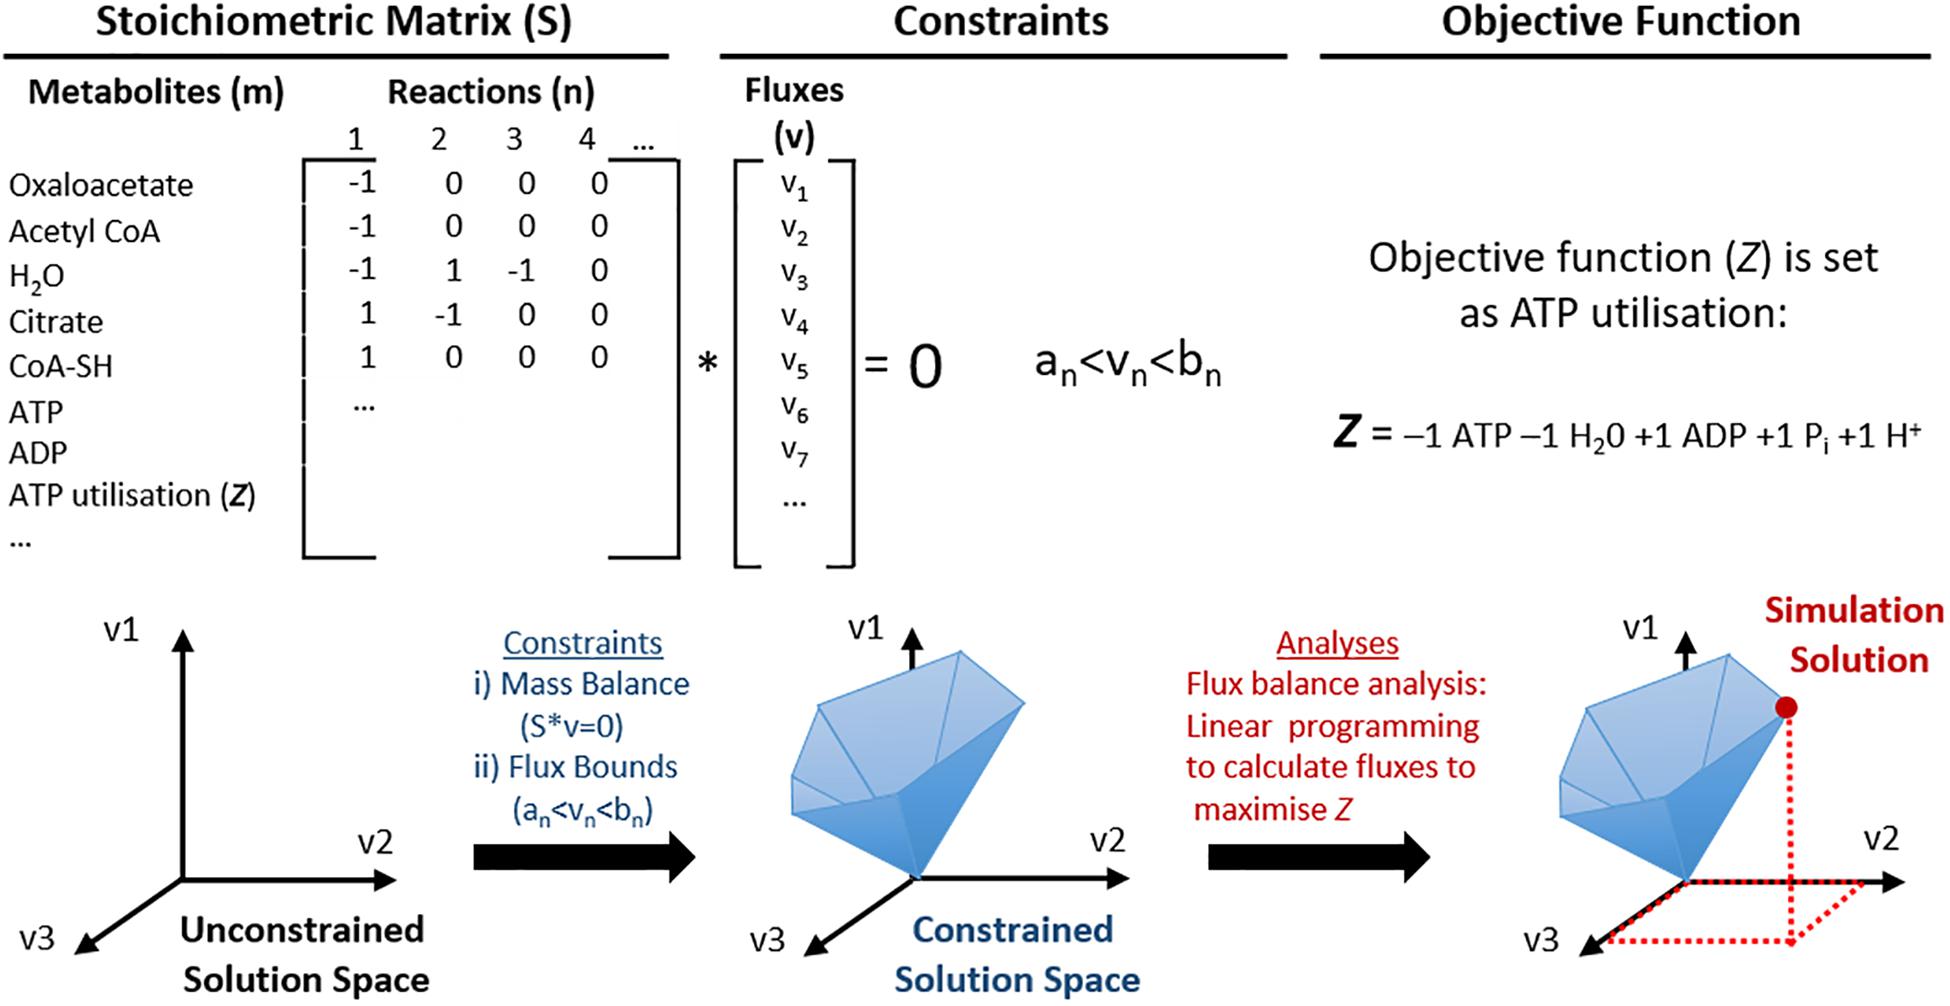
Figure 2. Schematic representation of the utilisation of genome scale metabolic models (GEMs) for constraint-based modelling (CBM). Mitochondrial metabolic pathways can be represented as a list of stoichiometric formulas and converted into a large stoichiometric matrix (S). In this format, the model does not have any constraints, thus the solution space may even include biologically irrelevant solutions. Constraints are then applied to utilise constraint-based modelling (CBM); such as (i) mass balance so that energy is conserved and the net flux is zero; (ii) flux bounds so that each flux (v) has a lower (an) and upper (bn) flux rate, and others such as directionality and nutrient availability. This creates a constrained solution space that represents predictable solutions that are more biologically feasible. One example of CBM used in this illustration is flux balance analysis, where an objective function (Z, ATP utilisation) is defined and maximised for the optimal solution of Z, which can be identified within the solution space.
Mitochondrial GEMs and CBMs
One predecessor of one of the first GEMs to study the functional mitochondrion using CBM was published in 2001 (Ramakrishna et al., 2001). This metabolic model included 46 metabolic reactions in two subcellular compartments, the mitochondrial matrix and cytosol with key shuttles, and included the glycolytic pathway, TCA cycle and OXPHOS. This model was simulated by a CBM method, termed flux balance analysis [FBA (Orth et al., 2010)]. In practise, FBA calculates a steady-state flux distribution, while maximising or minimising a desired reaction flux tagged as the “objective function.” This analysis gives an output of the optimal result for the objective function in question, within the biological solution space. As an initial cheque, FBA was used to predict energy metabolism (i.e., maximised ATP production) from the utilisation of various substrates (glucose, lactate, and palmitic acid) (Ramakrishna et al., 2001). The model predictions agreed with expected ATP yields from each substrate, and confirmed that glucose was the preferred energy substrate, determined by the maximum ATP production per mole of oxygen consumed. FBA was also performed independently to predict functional consequences of genetic knockouts (disabling individual metabolic reactions). Examples of genetic knockout simulations in the TCA cycle enzymes leading up to alpha-ketoglutarate, resulted in a lower rate of ATP production and an accumulation of oxaloacetate. Meanwhile, gene knockouts in the later stages of the TCA cycle from alpha-ketoglutarate dehydrogenase (mAKGD) to malate dehydrogenase also resulted in a lower rate of ATP production, but with an accumulation of alpha-ketoglutarate (Ramakrishna et al., 2001). This has encouraged confidence in the prediction results, since they correspond with the clinical observation of increased urinary excretion of alpha-ketoglutarate in patients with mAKGD, succinate dehydrogenase (SDH), and fumarase deficiencies (Rustin et al., 1997).
The first mitochondrial GEM was later generated by incorporating human cardiac mitochondrial proteomic and biochemical data, increasing the model to 189 reactions with 230 metabolites and 29 exchange reactions (Vo et al., 2004). In addition to the Ramakrishna model (Ramakrishna et al., 2001), pathways represented in the Vo model include fatty acid β-oxidation, phospholipid biosynthesis, urea cycle, and reactive oxygen species (ROS) detoxification. Initially, the biological solution space is created by constraints, including laws of thermodynamics to impose directionality, and can be further reduced with the addition of more constraints, e.g., enzymatic capacity based on experimental conditions or perturbations. Again, as a proof of principle study to build a GEM, CBM was used to characterise the model using FBA with three objective functions tested: ATP hydrolysis, phospholipid biosynthesis, and protohaem production (Vo et al., 2004). This study also utilised a different CBM, flux variability analysis (FVA) (Mahadevan and Schilling, 2003). FVA determines the maximum upper and lower flux bounds of all steady state reaction fluxes within the network while satisfying the optimal objective function, resulting in a solution space of flux distributions to determine what is physiologically feasible based on the condition of the model. This can reveal the level of model robustness in response to perturbations. The FVA simulation predicted that ATP production was the least flexible, while haem and phospholipid synthesis had greater flexibility (Vo et al., 2004). It is important to note that the less flexible a model response is, the less adaptable it is to maintain a steady state. The instability of metabolic reaction flux can then lead to the identification of critical points in dysregulation. With some modifications, the Vo model (Vo et al., 2004) was also utilised to investigate the impact of setting constraints that resembled diabetes, ischaemia, and low fat-high glucose (high carbohydrate) diet and high fat-low glucose (ketogenic) diet (Thiele et al., 2005). Network modifications included the addition of ketone body degradation and six transport reactions and the removal of 39 unused reactions, totalling 235 metabolites and 185 reactions, including 23 exchange reactions. Each simulated condition resulted in a reduction of network flexibility, rendering mitochondrial metabolism more sensitive to perturbations, such as changes in oxygen levels or higher ATP demands (Thiele et al., 2005). Although several therapies tested in this model were found to have only minimal effects, other therapies may be tested in future to identify potential targets which may have the greatest restoration of the network closest to the normal physiological condition.
Through the iterative cycles of GEM reconstruction, characterisation, testing and refinement, these sub-cellular models of metabolism contributed to the development of the first human whole cell metabolism models in 2007 (Duarte et al., 2007; Ma et al., 2007). These global models have since been utilised for various studies of human health and disease (Cook and Nielsen, 2017). As one of the first to use this methodology, Recon 1 (Duarte et al., 2007) was modified to represent the metabolism of human fibroblasts to study Leigh syndrome (Vo et al., 2007). This resulted in a network of 430 metabolites and 508 reactions, further expanding the previous mitochondrial model (Thiele et al., 2005) to include the pentose phosphate pathway, the malate-aspartate shuttle and de novo fatty acid synthesis. The study aimed to identify affected enzymes by non-invasively profiling the metabolic phenotype of normal and Leigh syndrome fibroblasts. This was performed by setting the model flux rates to isotopomer data of C13 labelled metabolites (pyruvate, lactate, glucose, and amino acids) from one control and one Leigh syndrome patient primary cell line and spent media. This study concluded that the Leigh syndrome-affected cell line had a slower metabolic rate and lower network flexibility within the respiratory chain enzyme fluxes. More specifically, succinate cytochrome c reductase (SCCR) enzyme activity was identified to be deficient with a higher activity ratio of cytochrome c oxidase/SCCR compared to control. Thus complex II deficiency was considered to be the most likely candidate for this particular Leigh syndrome-cell line. This provides an important step forward to alternative, non-invasive investigations to study the underlying mechanisms of a highly heterogeneous primary mitochondrial disease, such as Leigh syndrome. The interpretation of C13 isotopomer data analysis can then be enhanced by integrating it into a GEM for a more comprehensive coverage of mitochondrial metabolism. However, due to the lack of annotation, i.e., gene-protein reaction data, in Recon 1 at the time, further model improvements would be necessary in order to optimise such analyses. Another major limitation of this study was that the Leigh syndrome-affected cell line used in this work was not genetically characterised. Leigh syndrome is a heterogeneous disorder with more than 89 genetic causes described to date (Rahman et al., 2017). Thus it would be important to repeat these experiments in a series of Leigh syndrome cell cultures with different known gene defects, to determine whether there are common pathway abnormalities in all forms of Leigh syndrome or whether each gene defect has a unique profile. This would greatly impact biomarker discovery and therapy development.
A more comprehensive mitochondrial model was later generated, iAS253, a human heart mitochondrial model (Smith and Robinson, 2011). This model was manually reconstructed and annotated based on metabolite availability from the MitoMiner database (Smith and Robinson, 2009) and thoroughly annotated. iAS253 featured 253 reactions, 245 metabolites and 89 transport reactions. FBA was used to simulate perturbations, e.g., deficiency of fumarase, SDH and mAKGD, and to test dietary or supplementary therapeutic options in silico. This model showed high similarity between the in silico model features and clinical phenotypes, revealing possible disease mechanistic insights and initial stratification of potential therapeutic options. An expanded version of this model was later used to study OXPHOS disorders with deficiencies of complexes I–IV (Zielinski et al., 2016). Conclusions of this study were that complex I deficiency could be compensated by alternative pathways and complex II deficiency had lower metabolic flexibility leading to detrimental effects in both the TCA cycle and OXPHOS, whilst complexes III and IV deficiencies had the largest impact on ATP production. iAS253 has now been updated to MitoCore, which is currently the most comprehensive mitochondrial GEM to date (Smith et al., 2017). The model was manually upgraded to include 324 metabolic reactions, 83 transport steps between the mitochondrion and the cytosol, and 74 metabolite inputs and outputs through the plasma membrane. Initially, MitoCore was systematically compared with Recon 2.2, e.g., modelling fuel utilisation and fumarase deficiency, resulting in a more accurate representation of central metabolism (Smith et al., 2017).
More recently, MitoCore was used to investigate the effects of impaired mitochondrial citrate carrier (SLC25A1) function by FBA simulations (Majd et al., 2018). Whilst maintaining a minimal rate of ATP production, two objective functions were maximised; (i) fatty acid biosynthesis or (ii) glucose production via gluconeogenesis, with SLC25A1 specific reactions disabled to represent SLC25A1 deficiency. Although the majority of the connected pathways were sufficiently compensated by alternative pathways, the lack of citrate export had a detrimental effect on the production of acetyl-CoA required for fatty acid biosynthesis. The deficiency in acetyl-CoA would impair lipid, cholesterol, sphingolipid, and dolichol synthesis, all of which are vital for brain development, function and maintenance. In accordance with these predictions, these biosynthetic pathways also appear to be compromised in patients with missense mutations in SLC25A1, associated with an autosomal recessive neurometabolic disorder characterised by neonatal–onset encephalopathy. Future analyses could utilise this computational model to test therapeutic options for SLC25A1 deficiency.
MitoCore has also been used, after some modifications to include the production and efflux of tryptophan and lysine intermediates, to determine the effect of deficiency of the mitochondrial oxodicarboxylate carrier SLC25A21 on central metabolism (Boczonadi et al., 2018). The corresponding transport reactions of SLC25A21 were disabled during the FBA simulation while maximising ATP production. Simulation results showed that while ATP production and respiratory chain fluxes were maintained, there was an accumulation of lysine and tryptophan intermediates, L-pipecolic acid and quinolinic acid. The intermediate 2-oxoadipate was also found to be accumulated without affecting central metabolism in general. Furthermore, mass spectrometry analysis confirmed an accumulation of these three metabolites in patient urine samples compared to controls. Functional consequences were also tested in vitro by supplementing oxoadipate and quinolinic acid in control fibroblasts and neuronal SH-SY5Y cells, at equivalent concentrations to those measured in urine samples from affected patients using ultrahigh-performance liquid chromatography-tandem mass spectrometry. Although treated fibroblasts were largely unaffected, treated neuronal cells had decreased mitochondrial respiratory chain complexes and lower mtDNA copy number, resulting in induction of apoptosis. This implies that the intermediates are likely neurotoxic, which relates to the patient phenotype of a spinal muscular atrophy-like disease. Again, future analyses could use this model to identify critical points that could be targeted to allow restoration of normal levels of intermediates.
Other Systems Biological Models for Mitochondrial Research
An early GEM that represented the whole cell, rather than just the mitochondrion, included the Vo mitochondrial model (Vo et al., 2004; Duarte et al., 2007). Whole cell GEMs have evolved dramatically over the last decade, with the most recently published global GEM being Recon3D (Brunk et al., 2018). Recon3D can be accessed on the Virtual Metabolic Human [VMH, (Noronha et al., 2019)] and is graphically represented in ReconMap (Noronha et al., 2017). Several primary mitochondrial diseases have been mapped to Recon, including mitochondrial trifunctional protein deficiency, phosphate carrier deficiency and SUCLA2-related mtDNA depletion syndrome (Sahoo et al., 2012). Global GEM reconstructions have also been utilised for predictive modelling to represent multi-tissue systems (Bordbar et al., 2011). This could be a particularly useful approach to represent primary mitochondrial dysfunction in one or several tissues, and the interactions between tissues and their effects on the system as a whole. An example of a more detailed mitochondrion-centric model include a brain model with different cell types (Lewis et al., 2010). Such tissue-specific models could aid the eventual reconstruction of multi-tissue mitochondrial models.
Another common approach to computational modelling is the use of mathematical models, e.g., ordinary differential equations and kinetic data as parameters, to predict biological outcomes. There has also been a long historic use of mathematical models for mitochondrial basic science research, which is beyond the scope of this review. However, some noteworthy examples will be described briefly here. Many mathematical models have focused on modelling mitochondrial energy metabolism and signalling, calcium dynamics and regulation, ROS and redox, apoptosis, and fission and fusion. Historically, a popular mitochondrial model based on OXPHOS was made by Magnus and Keizer (1997) and other mitochondrial models were also developed independently by using different datasets and alternative biophysical theories, also focusing on OXPHOS (Korzeniewski, 1998, 2000; Korzeniewski and Zoladz, 2001; Beard, 2005). The Magnus and Keizer model (Magnus and Keizer, 1997) was widely used and adapted, e.g., to include metabolic pathways such as the TCA cycle, (Dudycha, 2000), calcium dynamics (Cortassa et al., 2003), and the production of ROS (Cortassa et al., 2004). Further model iterations for investigating these behaviours have since been developed, e.g., ROS (Gauthier et al., 2013), pH regulation and ion dynamics (Wei et al., 2011). Mitochondrial apoptosis has also been extensively investigated using this approach (Fussenegger et al., 2000; Rehm et al., 2006; Albeck et al., 2008; Bertaux et al., 2014). More recently, advances in computational and statistical approaches and the increasing availability of kinetic data have allowed these models to be developed to capture more mitochondrial behaviours, e.g., dynamic regulation of cellular metabolism and energetics (Dash et al., 2008; Zhang et al., 2018). Additionally, models have aimed to capture diversity within a mitochondrial population to investigate mitochondrial spatial and temporal dynamics (fission, fusion, mass, and motility) and heterogeneity by identifying sources of cell-to-cell variation of mitochondrial morphology and energetic stress states (Kowald and Kirkwood, 2011; Johnston et al., 2015; Dalmasso et al., 2017). Notably, kinetic modelling has covered a combination of metabolic and signalling models. It is a powerful method with its detailed use of reaction rates and metabolic concentrations for modelling, and can describe dynamic behaviour over time. However, this can become an incompatible method to model at a whole cell or tissue scale, since parameters may be limited or may not be suitable for the conditions in question.
A different type of predictive mitochondrial model recently built is Leigh Map (Rahman et al., 2017). Leigh Map was manually curated, incorporating >500 publications dated to November 2016 and information from the senior author’s clinical archive to include 89 genes and 237 phenotypes. This model is designed to be used as a diagnostic tool for Leigh syndrome to query a gene to identify associated phenotypes, or query phenotype(s) to identify the most likely causative gene(s). The efficiency of Leigh Map was found to be 80% identification of the correct gene in 20 Leigh syndrome cases (Rahman et al., 2017). Future work to expand the application of this tool to diagnose other primary mitochondrial diseases is ongoing.
Challenges in the Systems Understanding of the Mitochondrion
Despite numerous advances, several challenges remain in the application of systems biology to mitochondrial research. The involvement of two genomes is an inherent challenge to the study of mitochondria. Varying mtDNA copy number and differing heteroplasmy levels between different cells and tissues are additional challenges (Guantes et al., 2016). These challenges are especially pronounced when studying the diversity of the multi-systemic phenotypes of primary mitochondrial diseases. Systems biology methods that can be used to address some of these issues include the use of whole cell GEMs, which have evolved to include the incorporation of both nuclear and mitochondrial genomes responsible for membrane transport, and have mapped several primary mitochondrial diseases (Sahoo et al., 2012). Additionally, whole-cell models can be applied to represent multiple tissues, and can be enhanced for mitochondrial research by the development of more detailed mitochondria-centric models (Lewis et al., 2010). In addition, other computational methods, e.g., agent-based modelling, have attempted to capture diversity within a mitochondrial population and cell-to-cell variation (Dalmasso et al., 2017). Mitochondrial disorders display significant phenotypic heterogeneity, even between individuals in the same family. This heterogeneity poses challenges for the diagnosis of mitochondrial diseases, which have begun to be addressed by a predictive diagnostic knowledgebase for Leigh syndrome (Rahman et al., 2017).
Analytical tools that could be used to understand mitochondrial biology and pathology using systems-level data are continuously evolving. Network-based approaches have played critical roles in the progression of systems biology, as they help illustrate complex molecular interactions. Until recently, a shortcoming of these networks was that network modalities were based on the analysis of a single datum type with manual comparisons to networks of different data types (Barabasi et al., 2011; Stevens et al., 2014; Wang et al., 2014). The impracticality of this approach led to the development of integrative network tools. There has also been a paradigm shift in the nature of data integration networks toward patient (population/study cohort)-centric approaches, such as SNF, which has not yet been explicitly used for mitochondrial datasets. Ultimately, the aim of this would be to develop more efficient integration tools to combine multi-omics datasets to gain further insight into mitochondrial biology and pathology, see Figure 3.
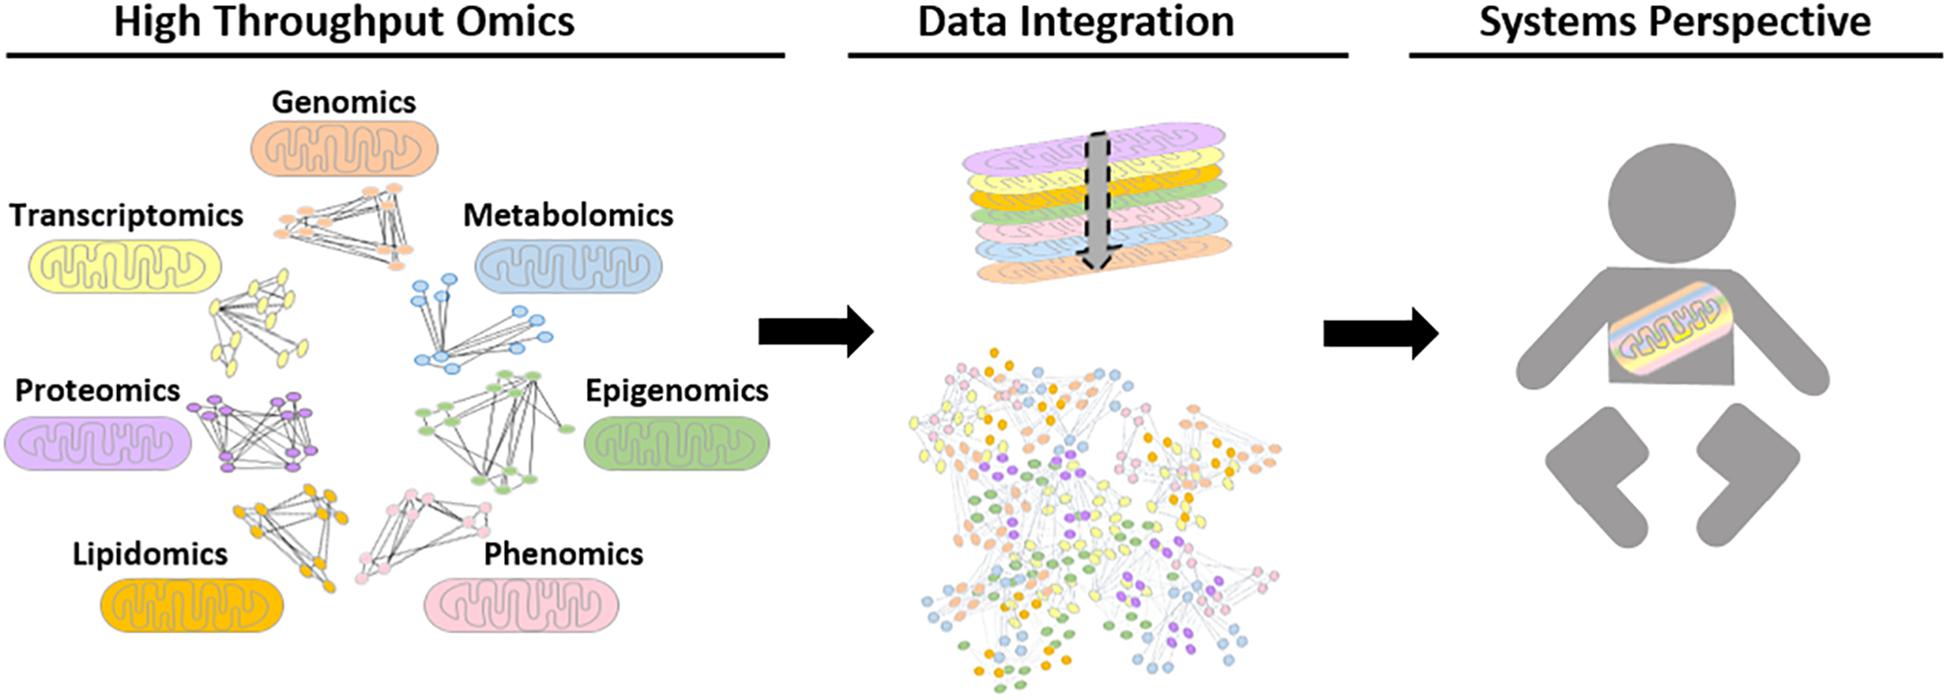
Figure 3. Schematic representation of possible future biological networks for mitochondrial systems biology. Different omics datasets can be generated from high throughput mitochondrial studies. To date, these are performed for single data types, for example using proteomic data to generate protein-protein interaction networks. However, future advances in computational tools could allow high-throughput omics data to be transformed into biological networks using mathematical algorithms, in order to find interactions and connections between biological moieties. Ultimately, the aim is to be able to integrate all relevant data types together to study the mitochondria within a whole system to improve patient care.
We have also discussed several examples of the use of CBM methods such as FBA and FVA which can provide predictive, valuable insights of the subject model. However, these results are only static snapshots of metabolism. Several methods have been developed to predict behaviour over time [dynamic FBA (Varma and Palsson, 1994) and dynamic FVA (Maldonado et al., 2018)], integrate regulation [regulatory FBA (Covert et al., 2001)] and integrate other data types [integrated FBA (Covert et al., 2008) and integrated dynamic FBA (Lee et al., 2008)]. Furthermore, other CBM methods and simulators have been developed to expand their applications, e.g., multi-objective function analyses (Costanza et al., 2012; Zakrzewski et al., 2012), whole human cell metabolic analyses (Fisher et al., 2013), integrate multiple simulation formats (Liao et al., 2012; Wu et al., 2016; Heirendt et al., 2017), of which all could be adapted for use in future primary mitochondrial research.
The generation and analysis of computational models have been shown to aid further insight into disease mechanisms and potential therapeutic discovery. However, the limitations of these network models are that they are only as accurate as the information input into them. Thus, these models have a tendency to only represent well-established pathways. However, as data and integration tools become increasingly available, there are well-characterised models such as MitoCore that could be built upon in the future. As we gain an increasing understanding of mitochondrial biology and pathophysiology, future computational models and accompanying analysis tools will be instrumental in improving diagnostic and therapeutic outcomes for primary mitochondrial disorders.
Concluding Remarks
Systems biology research is still in early development for primary mitochondrial diseases. Since mitochondria are central organelles for many cellular functions across multiple tissues, the application of recent advances in systems biology will likely improve our understanding of mitochondrial diseases (Perocchi et al., 2006; Shutt and Shadel, 2007). The most recent predictive models MitoCore and Leigh Map provide useful examples of ongoing efforts using available mitochondrial resources, and the need to continue the iterative cycle of systems approaches to build, test and refine models for better computational representations. Indeed, as context-specific models become more comprehensive, global reconstructions will inevitably improve in future iterations and be more useful for mitochondrial research, made possible by utilising high throughput omics data (Palese and Bossis, 2012; Williams et al., 2016; Palmfeldt and Bross, 2017). For instance, GEMs may evolve to feature more detailed data and omics profiles specific to the subject of study, as these data become available (Argmann et al., 2016). This development will be of particular interest to represent the different types of primary mitochondrial diseases to characterise and identify what is common to all mitochondrial diseases and what is unique to particular gene defects or subgroups, for better diagnostic and therapeutic approaches.
Although current computational models have not yet reached standards needed for use in a clinical setting for diagnostic and therapeutic purposes, the quality of computational models has vastly improved in the last decade; the evolution of models is summarised in Table 2. Furthermore, computational modelling of mitochondrial biology can be enhanced by other datasets as described recently to gain mechanistic insight, progress therapeutic development and improve outcomes for patients with mitochondrial diseases (Rahman and Rahman, 2018). Systems biology will most certainly become more applicable to personalised medicine as these models evolve to encompass patient-tailored models, ultimately aiming for improved patient care.
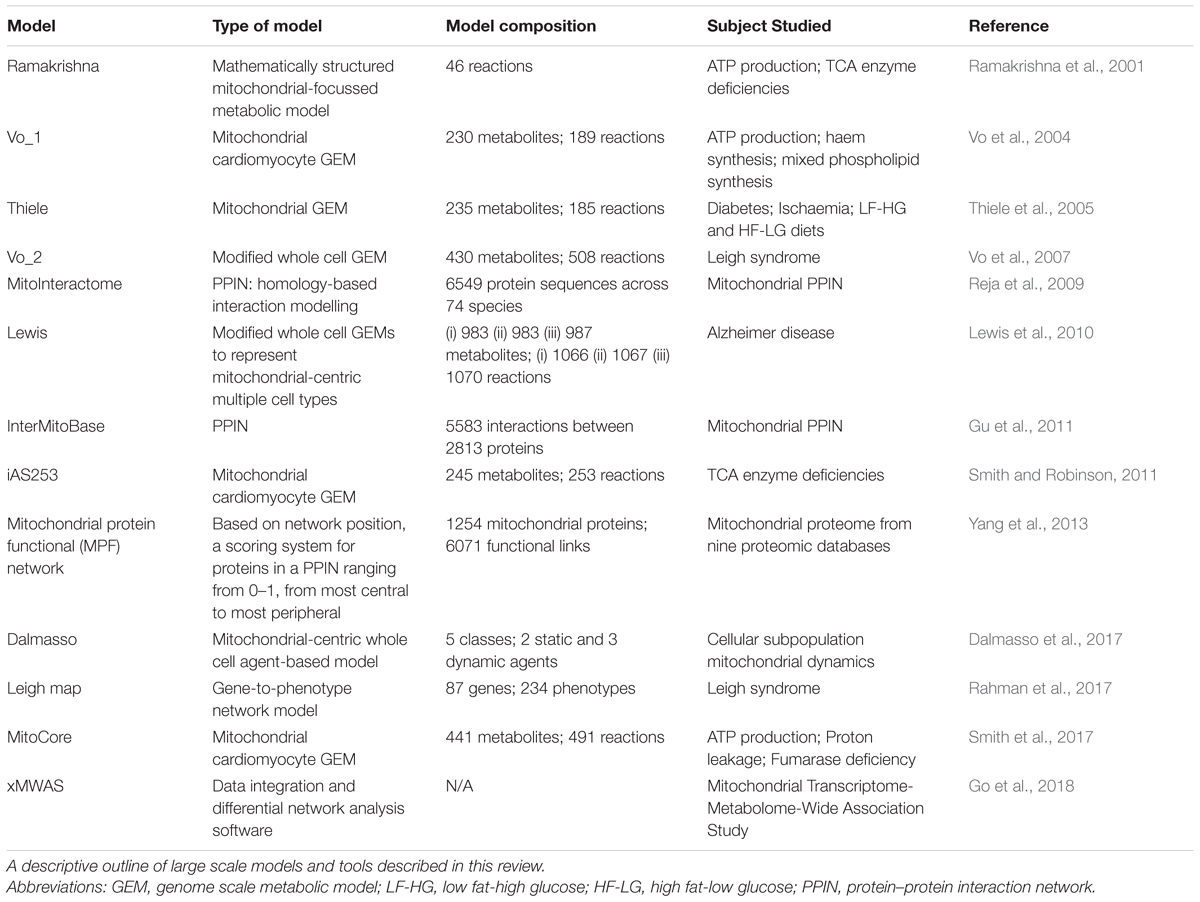
Table 2. Model summary.
Author Contributions
EM, FT, JR, and SR contributed to conceptualisation, drafting, and critical revision of the manuscript.
Conflict of Interest Statement
The authors declare that the research was conducted in the absence of any commercial or financial relationships that could be construed as a potential conflict of interest.
Acknowledgments
The authors acknowledge research grant funding from Great Ormond Street Hospital Children’s Charity, the NIHR Great Ormond Street Hospital Biomedical Research Centre, and the Lily Foundation.
References
Aiyar, R. S., Gagneur, J., and Steinmetz, L. M. (2008). Identification of mitochondrial disease genes through integrative analysis of multiple datasets. Methods 46, 248–255. doi: 10.1016/j.ymeth.2008.10.002
Albeck, J. G., Burke, J. M., Spencer, S. L., Lauffenburger, D. A., and Sorger, P. K. (2008). Modeling a snap-action, variable-delay switch controlling extrinsic cell death. PLoS Biol. 6, 2831–2852. doi: 10.1371/journal.pbio.0060299
Ali, M., Khan, S. A., Wennerberg, K., and Aittokallio, T. (2018). Global proteomics profiling improves drug sensitivity prediction: results from a multi-omics, pan-cancer modeling approach. Bioinformatics 34, 1353–1362. doi: 10.1093/bioinformatics/btx766
Anderson, S., Bankier, A. T., Barrell, B. G., de Bruijn, M. H., Coulson, A. R., Drouin, J., et al. (1981). Sequence and organization of the human mitochondrial genome. Nature 290, 457–465. doi: 10.1038/290457a0
Argelaguet, R., Velten, B., Arnol, D., Dietrich, S., Zenz, T., Marioni, J. C., et al. (2018). Multi-omics factor analysis—a framework for unsupervised integration of multi-omics data sets. Mol. Syst. Biol. 14:e8124. doi: 10.15252/msb.20178124
Argmann, C. A., Houten, S. M., Zhu, J., and Schadt, E. E. (2016). A next generation multiscale view of inborn errors of metabolism. Cell Metab. 23, 13–26. doi: 10.1016/j.cmet.2015.11.012.
Arroyo, J. D., Jourdain, A. A., Calvo, S. E., Ballarano, C. A., Doench, J. G., Root, D. E., et al. (2016). A genome-wide CRISPR death screen identifies genes essential for oxidative phosphorylation. Cell Metab. 24, 875–885. doi: 10.1016/j.cmet.2016.08.017
Bakker, O. B., Aguirre-Gamboa, R., Sanna, S., Oosting, M., Smeekens, S. P., Jaeger, M., et al. (2018). Integration of multi-omics data and deep phenotyping enables prediction of cytokine responses. Nat. Immunol. 19, 776–786. doi: 10.1038/s41590-018-0121-3
Barabasi, A. L., Gulbahce, N., and Loscalzo, J. (2011). Network medicine: a network-based approach to human disease. Nat. Rev. Genet. 12, 56–68. doi: 10.1038/nrg2918
Baumgart, M., Priebe, S., Groth, M., Hartmann, N., Menzel, U., Pandolfini, L., et al. (2016). Longitudinal RNA-Seq analysis of vertebrate aging identifies mitochondrial complex i as a small-molecule-sensitive modifier of lifespan. Cell Syst. 2, 122–132. doi: 10.1016/j.cels.2016.01.014
Beard, D. A. (2005). A biophysical model of the mitochondrial respiratory system and oxidative phosphorylation. PLoS Comput. Biol. 1:e36. doi: 10.1371/journal.pcbi.0010036
Bertaux, F., Stoma, S., Drasdo, D., and Batt, G. (2014). Modeling dynamics of cell-to-cell variability in TRAIL-induced apoptosis explains fractional killing and predicts reversible resistance. PLoS Comput. Biol. 10:e1003893. doi: 10.1371/journal.pcbi.1003893
Boczonadi, V., King, M. S., Smith, A. C., Olahova, M., Bansagi, B., Roos, A., et al. (2018). Mitochondrial oxodicarboxylate carrier deficiency is associated with mitochondrial DNA depletion and spinal muscular atrophy-like disease. Genet Med 20, 1224–1235. doi: 10.1038/gim.2017.251
Bordbar, A., Feist, A. M., Usaite-Black, R., Woodcock, J., Palsson, B. O., and Famili, I. (2011). A multi-tissue type genome-scale metabolic network for analysis of whole-body systems physiology. BMC Syst. Biol. 5:180. doi: 10.1186/1752-0509-5-180
Bratic, A., and Larsson, N. G. (2013). The role of mitochondria in aging. J. Clin. Invest. 123, 951–957. doi: 10.1172/JCI64125.
Brunk, E., Sahoo, S., Zielinski, D. C., Altunkaya, A., Drager, A., Mih, N., et al. (2018). Recon3D enables a three-dimensional view of gene variation in human metabolism. Nat. Biotechnol. 36, 272–281. doi: 10.1038/nbt.4072
Calvano, S. E., Xiao, W., Richards, D. R., Felciano, R. M., Baker, H. V., Cho, R. J., et al. (2005). A network-based analysis of systemic inflammation in humans. Nature 437, 1032–1037. doi: 10.1038/nature03985
Calvo, S., Jain, M., Xie, X., Sheth, S. A., Chang, B., Goldberger, O. A., et al. (2006). Systematic identification of human mitochondrial disease genes through integrative genomics. Nat. Genet. 38, 576–582. doi: 10.1038/ng1776
Calvo, S. E., Clauser, K. R., and Mootha, V. K. (2016). MitoCarta2.0: an updated inventory of mammalian mitochondrial proteins. Nucleic Acids Res. 44, D1251–D1257. doi: 10.1093/nar/gkv1003
Cook, D. J., and Nielsen, J. (2017). Genome-scale metabolic models applied to human health and disease. Wiley Interdiscip. Rev. Syst. Biol. Med. 9:e1393. doi: 10.1002/wsbm.1393
Cortassa, S., Aon, M. A., Marban, E., Winslow, R. L., and O’Rourke, B. (2003). An integrated model of cardiac mitochondrial energy metabolism and calcium dynamics. Biophys. J. 84, 2734–2755. doi: 10.1016/S0006-3495(03)75079-6
Cortassa, S., Aon, M. A., Winslow, R. L., and O’Rourke, B. (2004). A mitochondrial oscillator dependent on reactive oxygen species. Biophys. J. 87, 2060–2073. doi: 10.1529/biophysj.104.041749
Costanza, J., Carapezza, G., Angione, C., Liò, P., and Nicosia, G. (2012). “Multi-objective optimisation, sensitivity and robustness analysis in FBA modelling,” in Computational Methods in Systems Biology, eds D. Gilbert and M. Heiner (Berlin: Springer), 127–147.
Covert, M. W., Schilling, C. H., and Palsson, B. (2001). Regulation of gene expression in flux balance models of metabolism. J. Theor. Biol. 213, 73–88. doi: 10.1006/jtbi.2001.2405
Covert, M. W., Xiao, N., Chen, T. J., and Karr, J. R. (2008). Integrating metabolic, transcriptional regulatory and signal transduction models in Escherichia coli. Bioinformatics 24, 2044–2050. doi: 10.1093/bioinformatics/btn352
Dalmasso, G., Marin Zapata, P. A., Brady, N. R., and Hamacher-Brady, A. (2017). Agent-based modeling of mitochondria links sub-cellular dynamics to cellular homeostasis and heterogeneity. PLoS One 12:e0168198. doi: 10.1371/journal.pone.0168198
Dash, R. K., Li, Y., Kim, J., Beard, D. A., Saidel, G. M., and Cabrera, M. E. (2008). Metabolic dynamics in skeletal muscle during acute reduction in blood flow and oxygen supply to mitochondria: in-silico studies using a multi-scale, top-down integrated model. PLoS One 3:e3168. doi: 10.1371/journal.pone.0003168
DiMauro, S., Bonilla, E., Zeviani, M., Nakagawa, M., and DeVivo, D. C. (1985). Mitochondrial myopathies. Ann. Neurol. 17, 521–538. doi: 10.1002/ana.410170602
Duarte, N. C., Becker, S. A., Jamshidi, N., Thiele, I., Mo, M. L., Vo, T. D., et al. (2007). Global reconstruction of the human metabolic network based on genomic and bibliomic data. Proc. Natl. Acad. Sci. U.S.A. 104, 1777–1782. doi: 10.1073/pnas.0610772104
Dudycha, S. (2000). A Detailed Model of the Tricarboxylic Acid Cycle in Heart Cells. Baltimore, MD: Johns Hopkins University.
Duncan, A. J., Bitner-Glindzicz, M., Meunier, B., Costello, H., Hargreaves, I. P., Lopez, L. C., et al. (2009). A nonsense mutation in COQ9 causes autosomal-recessive neonatal-onset primary coenzyme Q10 deficiency: a potentially treatable form of mitochondrial disease. Am. J. Hum. Genet. 84, 558–566. doi: 10.1016/j.ajhg.2009.03.018
El-Hattab, A. W., Adesina, A. M., Jones, J., and Scaglia, F. (2015). MELAS syndrome: clinical manifestations, pathogenesis, and treatment options. Mol. Genet. Metab. 116, 4–12. doi: 10.1016/j.ymgme.2015.06.004
Enns, G. M. (2017). Pediatric mitochondrial diseases and the heart. Curr. Opin. Pediatr. 29, 541–551. doi: 10.1097/MOP.0000000000000535
Esterhuizen, K., Lindeque, J. Z., Mason, S., van der Westhuizen, F. H., Suomalainen, A., Hakonen, A. H., et al. (2018). A urinary biosignature for mitochondrial myopathy, encephalopathy, lactic acidosis and stroke like episodes (MELAS). Mitochondrion doi: 10.1016/j.mito.2018.02.003 [Epub ahead of print].
Falcon, M. I., Jirsa, V., and Solodkin, A. (2016). A new neuroinformatics approach to personalized medicine in neurology: the virtual brain. Curr. Opin. Neurol. 29, 429–436. doi: 10.1097/WCO.0000000000000344
Fisher, C. P., Plant, N. J., Moore, J. B., and Kierzek, A. M. (2013). QSSPN: dynamic simulation of molecular interaction networks describing gene regulation, signalling and whole-cell metabolism in human cells. Bioinformatics 29, 3181–3190. doi: 10.1093/bioinformatics/btt552
Fisher-Wellman, K. H., Davidson, M. T., Narowski, T. M., Lin, C. -T., Koves, T. R., and Muoio, D. M. (2018). Mitochondrial diagnostics: a multiplexed assay platform for comprehensive assessment of mitochondrial energy fluxes. Cell Rep. 24, 3593.e10–3606.e10. doi: 10.1016/j.celrep.2018.08.091.
Forsberg, E. M., Huan, T., Rinehart, D., Benton, H. P., Warth, B., Hilmers, B., et al. (2018). Data processing, multi-omic pathway mapping, and metabolite activity analysis using XCMS Online. Nat. Protoc. 13, 633–651. doi: 10.1038/nprot.2017.151
Fussenegger, M., Bailey, J. E., and Varner, J. (2000). A mathematical model of caspase function in apoptosis. Nat. Biotechnol. 18, 768–774. doi: 10.1038/77589
Gauthier, L. D., Greenstein, J. L., O’Rourke, B., and Winslow, R. L. (2013). An integrated mitochondrial ROS production and scavenging model: implications for heart failure. Biophys. J. 105, 2832–2842. doi: 10.1016/j.bpj.2013.11.007
Go, Y. M., Fernandes, J., Hu, X., Uppal, K., and Jones, D.P. (2018). Mitochondrial network responses in oxidative physiology and disease. Free Radic. Biol. Med. 116, 31–40. doi: 10.1016/j.freeradbiomed.2018.01.005
Goh, K. I., Cusick, M. E., Valle, D., Childs, B., Vidal, M., and Barabasi, A. L. (2007). The human disease network. Proc. Natl. Acad. Sci. U.S.A. 104, 8685–8690. doi: 10.1073/pnas.0701361104
Gopal, R. K., Calvo, S. E., Shih, A. R., Chaves, F. L., McGuone, D., Mick, E., et al. (2018). Early loss of mitochondrial complex I and rewiring of glutathione metabolism in renal oncocytoma. Proc. Natl. Acad. Sci. U.S.A. 115, E6283–E6290. doi: 10.1073/pnas.1711888115
Gorman, G. S., Schaefer, A. M., Ng, Y., Gomez, N., Blakely, E. L., Alston, C. L., et al. (2015). Prevalence of nuclear and mitochondrial DNA mutations related to adult mitochondrial disease. Ann. Neurol. 77, 753–759. doi: 10.1002/ana.24362
Götz, A., Tyynismaa, H., Euro, L., Ellonen, P., Hyötyläinen, T., Ojala, T., et al. (2011). Exome sequencing identifies mitochondrial alanyl-tRNA synthetase mutations in infantile mitochondrial cardiomyopathy. Am. J. Hum. Genet. 88, 635–642. doi: 10.1016/j.ajhg.2011.04.006
Grunewald, A., Kumar, K. R., and Sue, C. M. (2018). New insights into the complex role of mitochondria in Parkinson’s disease. Prog. Neurobiol. doi: 10.1016/j.pneurobio.2018.09.003. [Epub ahead of print].
Gu, Z., Li, J., Gao, S., Gong, M., Wang, J., Xu, H., et al. (2011). InterMitoBase: an annotated database and analysis platform of protein-protein interactions for human mitochondria. BMC Genomics 12:335. doi: 10.1186/1471-2164-12-335
Guantes, R., Diaz-Colunga, J., and Iborra, F. J. (2016). Mitochondria and the non-genetic origins of cell-to-cell variability: more is different. Bioessays 38, 64–76. doi: 10.1002/bies.201500082
Guney, E., Menche, J., Vidal, M., and Barabasi, A. L. (2016). Network-based in silico drug efficacy screening. Nat. Commun. 7:10331. doi: 10.1038/ncomms10331
Hatefi, Y. (1985). The mitochondrial electron transport and oxidative phosphorylation system. Annu. Rev. Biochem. 54, 1015–1069. doi: 10.1146/annurev.bi.54.070185.005055
Heirendt, L., Arreckx, S., Pfau, T., Mendoza, S. N., Richelle, A., Heinken, A., et al. (2017). Creation and Analysis of Biochemical Constraint-Based Models: The COBRA Toolbox V3. 0. Available at: https://arxiv.org/abs/1710.04038
Hikmat, O., Tzoulis, C., Chong, W. K., Chentouf, L., Klingenberg, C., Fratter, C., et al. (2017). The clinical spectrum and natural history of early-onset diseases due to DNA polymerase gamma mutations. Genet. Med. 19, 1217–1225. doi: 10.1038/gim.2017.35
Holt, I. J., Harding, A. E., and Morgan-Hughes, J. A. (1988). Deletions of muscle mitochondrial DNA in patients with mitochondrial myopathies. Nature 331, 717–719. doi: 10.1038/331717a0
Hyduke, D. R., and Palsson, B. O. (2010). Towards genome-scale signalling network reconstructions. Nat. Rev. Genet. 11, 297–307. doi: 10.1038/nrg2750
Janer, A., Prudent, J., Paupe, V., Fahiminiya, S., Majewski, J., Sgarioto, N., et al. (2016). SLC25A46 is required for mitochondrial lipid homeostasis and cristae maintenance and is responsible for leigh syndrome. EMBO Mol. Med. 8, 1019–1038. doi: 10.15252/emmm.201506159
Johnston, I. G., Burgstaller, J. P., Havlicek, V., Kolbe, T., Rulicke, T., Brem, G., et al. (2015). Stochastic modelling, bayesian inference, and new in vivo measurements elucidate the debated mtdna bottleneck mechanism. eLife 4:e07464. doi: 10.7554/eLife.07464
Kanehisa, M., Sato, Y., Kawashima, M., Furumichi, M., and Tanabe, M. (2016). KEGG as a reference resource for gene and protein annotation. Nucleic Acids Res. 44, D457–D462. doi: 10.1093/nar/gkv1070.
Keane, H., Ryan, B. J., Jackson, B., Whitmore, A., and Wade-Martins, R. (2015). Protein-protein interaction networks identify targets which rescue the MPP+ cellular model of Parkinson’s disease. Sci. Rep. 5:17004. doi: 10.1038/srep17004
Khan, N. A., Auranen, M., Paetau, I., Pirinen, E., Euro, L., Forsstrom, S., et al. (2014). Effective treatment of mitochondrial myopathy by nicotinamide riboside, a vitamin B3. EMBO Mol. Med. 6, 721–731. doi: 10.1002/emmm.201403943
Khan, N. A., Nikkanen, J., Yatsuga, S., Jackson, C., Wang, L., Pradhan, S., et al. (2017). mTORC1 regulates mitochondrial integrated stress response and mitochondrial myopathy progression. Cell Metab. 26, 419.e5–428.e5. doi: 10.1016/j.cmet.2017.07.007.
Korzeniewski, B. (1998). Regulation of ATP supply during muscle contraction: theoretical studies. Biochem. J. 330 ( Pt 3), 1189–1195. doi: 10.1042/bj3301189
Korzeniewski, B. (2000). Regulation of ATP supply in mammalian skeletal muscle during resting state– > intensive work transition. Biophys. Chem. 83, 19–34. doi: 10.1016/S0301-4622(99)00120-9
Korzeniewski, B., and Zoladz, J. A. (2001). A model of oxidative phosphorylation in mammalian skeletal muscle. Biophys. Chem. 92, 17–34. doi: 10.1016/S0301-4622(01)00184-3
Kowald, A., and Kirkwood, T. B. (2011). Evolution of the mitochondrial fusion-fission cycle and its role in aging. Proc. Natl. Acad. Sci. U.S.A. 108, 10237–10242. doi: 10.1073/pnas.1101604108
Kühl, I., Miranda, M., Atanassov, I., Kuznetsova, I., Hinze, Y., Mourier, A., et al. (2017). Transcriptomic and proteomic landscape of mitochondrial dysfunction reveals secondary coenzyme Q deficiency in mammals. eLife 6:e30952. doi: 10.7554/eLife.30952
Lapointe, C. P., Stefely, J. A., Jochem, A., Hutchins, P. D., Wilson, G. M., Kwiecien, N. W., et al. (2018). Multi-omics reveal specific targets of the rna-binding protein puf3p and its orchestration of mitochondrial biogenesis. Cell Syst. 6, 125.e6–135.e6. doi: 10.1016/j.cels.2017.11.012
Lee, J. M., Gianchandani, E. P., Eddy, J. A., and Papin, J. A. (2008). Dynamic analysis of integrated signaling, metabolic, and regulatory networks. PLoS Comput. Biol. 4:e1000086. doi: 10.1371/journal.pcbi.1000086
Lee, J. S., Adler, L., Karathia, H., Carmel, N., Rabinovich, S., Auslander, N., et al. (2018). Urea cycle dysregulation generates clinically relevant genomic and biochemical signatures. Cell 174, 1559.e22–1570.e22. doi: 10.1016/j.cell.2018.07.019
Leigh, D. (1951). Subacute necrotizing encephalomyelopathy in an infant. J. Neurol. Neurosurg. Psychiatry 14, 216–221 doi: 10.1136/jnnp.14.3.216
Lewis, N. E., Schramm, G., Bordbar, A., Schellenberger, J., Andersen, M. P., Cheng, J. K., et al. (2010). Large-scale in silico modeling of metabolic interactions between cell types in the human brain. Nat. Biotechnol. 28, 1279–1285. doi: 10.1038/nbt.1711
Liang, Y., and Kelemen, A. (2017). Computational dynamic approaches for temporal omics data with applications to systems medicine. BioData Min. 10:20. doi: 10.1186/s13040-017-0140-x
Liao, Y. C., Tsai, M. H., Chen, F. C., and Hsiung, C. A. (2012). GEMSiRV: a software platform for GEnome-scale metabolic model simulation, reconstruction and visualization. Bioinformatics 28, 1752–1758. doi: 10.1093/bioinformatics/bts267
Lienhard, M., Grasse, S., Rolff, J., Frese, S., Schirmer, U., Becker, M., et al. (2017). QSEA-modelling of genome-wide DNA methylation from sequencing enrichment experiments. Nucleic Acids Res. 45:e44. doi: 10.1093/nar/gkw1193
Lin, M. T., and Beal, M. F. (2006). Mitochondrial dysfunction and oxidative stress in neurodegenerative diseases. Nature 443, 787–795. doi: 10.1038/nature05292
Luscombe, N. M., Greenbaum, D., and Gerstein, M. (2001). What is bioinformatics? A proposed definition and overview of the field. Methods Inf. Med. 40, 346–358. doi: 10.1055/s-0038-1634431
Ma, H., Sorokin, A., Mazein, A., Selkov, A., Selkov, E., Demin, O., et al. (2007). The edinburgh human metabolic network reconstruction and its functional analysis. Mol. Syst. Biol. 3:135. doi: 10.1038/msb4100177
Magnus, G., and Keizer, J. (1997). Minimal model of beta-cell mitochondrial Ca2+ handling. Am. J. Physiol. 273(2 Pt 1), C717–C733. doi: 10.1152/ajpcell.1997.273.2.C717
Mahadevan, R., and Schilling, C. H. (2003). The effects of alternate optimal solutions in constraint-based genome-scale metabolic models. Metab. Eng. 5, 264–276. doi: 10.1016/j.ymben.2003.09.002
Majd, H., King, M. S., Smith, A. C., and Kunji, E. R. S. (2018). Pathogenic mutations of the human mitochondrial citrate carrier SLC25A1 lead to impaired citrate export required for lipid, dolichol, ubiquinone and sterol synthesis. Biochim. Biophys. Acta 1859, 1–7. doi: 10.1016/j.bbabio.2017.10.002
Maldonado, E. M., Fisher, C. P., Mazzatti, D. J., Barber, A. L., Tindall, M. J., Plant, N. J., et al. (2018). Multi-scale, whole-system models of liver metabolic adaptation to fat and sugar in non-alcoholic fatty liver disease. NPJ Syst. Biol. Appl. 4:33. doi: 10.1038/s41540-018-0070-3
McKiernan, P., Ball, S., Santra, S., Foster, K., Fratter, C., Poulton, J., et al. (2016). Incidence of primary mitochondrial disease in children younger than 2 years presenting with acute liver failure. J. Pediatr. Gastroenterol. Nutr. 63, 592–597. doi: 10.1097/MPG.0000000000001345
Mo, Q., Wang, S., Seshan, V. E., Olshen, A. B., Schultz, N., Sander, C., et al. (2013). Pattern discovery and cancer gene identification in integrated cancer genomic data. Proc. Natl. Acad. Sci. U.S.A. 110, 4245–4250. doi: 10.1073/pnas.1208949110
Munnich, A., Rustin, P., Rötig, A., Chretien, D., Bonnefont, J. P., Nuttin, C., et al. (1992). Clinical aspects of mitochondrial disorders. J. Inherit. Metab. Dis. 15, 448–455. doi: 10.1007/BF01799603
Münzner, U., Lubitz, T., Klipp, E., and Krantz, M. (2017). “Toward genome-scale models of signal transduction networks,” in Systems Biology, eds J. Nielsen and S. Hohmann. (Germany: Wiley-VCH Verlag).
Nikkanen, J., Forsstrom, S., Euro, L., Paetau, I., Kohnz, R. A., Wang, L., et al. (2016). Mitochondrial DNA replication defects disturb cellular dNTP pools and remodel one-carbon metabolism. Cell Metab. 23, 635–648. doi: 10.1016/j.cmet.2016.01.019
Noble, D. (2002). Modeling the heart–from genes to cells to the whole organ. Science 295, 1678–1682. doi: 10.1126/science.1069881
Noronha, A., Danielsdottir, A. D., Gawron, P., Johannsson, F., Jonsdottir, S., Jarlsson, S., et al. (2017). ReconMap: an interactive visualization of human metabolism. Bioinformatics 33, 605–607. doi: 10.1093/bioinformatics/btw667
Noronha, A., Modamio, J., Jarosz, Y., Sompairac, N., Gonzalez, G. P., Danielsdottir, A. D., et al. (2019). The virtual metabolic human database: integrating human and gut microbiome metabolism with nutrition and disease. Nucleic Acids Res. 47, D614–D624. doi: 10.1093/nar/gky992
O’Brien, E. J., Monk, J. M., and Palsson, B. O. (2015). Using genome-scale models to predict biological capabilities. Cell 161, 971–987. doi: 10.1016/j.cell.2015.05.019
Orth, J. D., Thiele, I., and Palsson, B. O. (2010). What is flux balance analysis? Nat. Biotechnol. 28, 245–248. doi: 10.1038/nbt.1614
Pagliarini, D. J., Calvo, S. E., Chang, B., Sheth, S. A., Vafai, S. B., Ong, S. E., et al. (2008). A mitochondrial protein compendium elucidates complex I disease biology. Cell 134, 112–123. doi: 10.1016/j.cell.2008.06.016
Pagliarini, D. J., and Rutter, J. (2013). Hallmarks of a new era in mitochondrial biochemistry. Genes Dev. 27, 2615–2627. doi: 10.1101/gad.229724.113
Palese, L. L., and Bossis, F. (2012). The human extended mitochondrial metabolic network: new hubs from lipids. Biosystems 109, 151–158. doi: 10.1016/j.biosystems.2012.04.001.
Palmfeldt, J., and Bross, P. (2017). Proteomics of human mitochondria. Mitochondrion 33, 2–14. doi: 10.1016/j.mito.2016.07.006
Papin, J. A., Price, N. D., Wiback, S. J., Fell, D. A., and Palsson, B. O. (2003). Metabolic pathways in the post-genome era. Trends Biochem. Sci. 28, 250–258. doi: 10.1016/S0968-0004(03)00064-1
Perocchi, F., Jensen, L. J., Gagneur, J., Ahting, U., von Mering, C., Bork, P., et al. (2006). Assessing systems properties of yeast mitochondria through an interaction map of the organelle. PLoS Genet 2:e170. doi: 10.1371/journal.pgen.0020170
Pfeffer, G., and Chinnery, P. F. (2013). Diagnosis and treatment of mitochondrial myopathies. Ann. Med. 45, 4–16. doi: 10.3109/07853890.2011.605389
Pitceathly, R. D. (2016). Mitochondrial extrapyramidal syndromes: using age and phenomenology to guide genetic testing. JAMA Neurol. 73, 630–632. doi: 10.1001/jamaneurol.2016.0756
Price, N. D., Papin, J. A., Schilling, C. H., and Palsson, B. O. (2003). Genome-scale microbial in silico models: the constraints-based approach. Trends Biotechnol. 21, 162–169. doi: 10.1016/S0167-7799(03)00030-1
Prokisch, H., Scharfe, C., Camp, D. G. II, Xiao, W., David, L., Andreoli, C., et al. (2004). Integrative analysis of the mitochondrial proteome in yeast. PLoS Biol. 2:e160. doi: 10.1371/journal.pbio.0020160
Quirós, P. M., Prado, M. A., Zamboni, N., D’Amico, D., Williams, R. W., Finley, D., et al. (2017). Multi-omics analysis identifies ATF4 as a key regulator of the mitochondrial stress response in mammals. J. Cell Biol. 216, 2027–2045. doi: 10.1083/jcb.201702058
Rahman, J., Noronha, A., Thiele, I., and Rahman, S. (2017). Leigh map: a novel computational diagnostic resource for mitochondrial disease. Ann. Neurol. 81, 9–16. doi: 10.1002/ana.24835
Rahman, J., and Rahman, S. (2018). Mitochondrial medicine in the omics era. Lancet 391, 2560–2574. doi: 10.1016/S0140-6736(18)30727-X
Rahman, S. (2015). Pathophysiology of mitochondrial disease causing epilepsy and status epilepticus. Epilepsy Behav. 49, 71–75. doi: 10.1016/j.yebeh.2015.05.003
Ramakrishna, R., Edwards, J. S., McCulloch, A., and Palsson, B. O. (2001). Flux-balance analysis of mitochondrial energy metabolism: consequences of systemic stoichiometric constraints. Am. J. Physiol. Regul. Integr. Comp. Physiol. 280, R695–R704. doi: 10.1152/ajpregu.2001.280.3.R695
Rehm, M., Huber, H. J., Dussmann, H., and Prehn, J. H. (2006). Systems analysis of effector caspase activation and its control by X-linked inhibitor of apoptosis protein. EMBO J. 25, 4338–4349. doi: 10.1038/sj.emboj.7601295
Reja, R., Venkatakrishnan, A. J., Lee, J., Kim, B. C., Ryu, J. W., Gong, S., et al. (2009). MitoInteractome: mitochondrial protein interactome database, and its application in ’aging network’ analysis. BMC Genomics 10 (Suppl 3):S20. doi: 10.1186/1471-2164-10-S3-S20
Rustin, P., Bourgeron, T., Parfait, B., Chretien, D., Munnich, A., and Rotig, A. (1997). Inborn errors of the Krebs cycle: a group of unusual mitochondrial diseases in human. Biochim. Biophys. Acta 1361, 185–197. doi: 10.1016/S0925-4439(97)00035-5
Sahoo, S., Franzson, L., Jonsson, J. J., and Thiele, I. (2012). A compendium of inborn errors of metabolism mapped onto the human metabolic network. Mol. Biosyst. 8, 2545–2558. doi: 10.1039/c2mb25075f
Sanz Leon, P., Knock, S. A., Woodman, M. M., Domide, L., Mersmann, J., McIntosh, A. R., et al. (2013). The Virtual Brain: a simulator of primate brain network dynamics. Front. Neuroinform. 7:10. doi: 10.3389/fninf.2013.00010
Shutt, T. E., and Shadel, G. S. (2007). Expanding the mitochondrial interactome. Genome Biol. 8:203. doi: 10.1186/gb-2007-8-2-203
Smith, A. C., Eyassu, F., Mazat, J. P., and Robinson, A. J. (2017). MitoCore: a curated constraint-based model for simulating human central metabolism. BMC Syst. Biol. 11:114. doi: 10.1186/s12918-017-0500-7
Smith, A. C., and Robinson, A. J. (2009). MitoMiner, an integrated database for the storage and analysis of mitochondrial proteomics data. Mol. Cell. Proteom. 8, 1324–1337. doi: 10.1074/mcp.M800373-MCP200
Smith, A. C., and Robinson, A. J. (2011). A metabolic model of the mitochondrion and its use in modelling diseases of the tricarboxylic acid cycle. BMC Syst. Biol. 5:102. doi: 10.1186/1752-0509-5-102
Smith, A. C., and Robinson, A. J. (2016). MitoMiner v3.1, an update on the mitochondrial proteomics database. Nucleic Acids Res. 44, D1258–D1261. doi: 10.1093/nar/gkv1001.
Steinmetz, L. M., Scharfe, C., Deutschbauer, A. M., Mokranjac, D., Herman, Z. S., Jones, T., et al. (2002). Systematic screen for human disease genes in yeast. Nat. Genet. 31, 400–404. doi: 10.1038/ng929
Stevens, A., De Leonibus, C., Hanson, D., Dowsey, A. W., Whatmore, A., Meyer, S., et al. (2014). Network analysis: a new approach to study endocrine disorders. J. Mol. Endocrinol. 52, R79–R93. doi: 10.1530/JME-13-0112
Stewart, J. B., and Chinnery, P. F. (2015). The dynamics of mitochondrial DNA heteroplasmy: implications for human health and disease. Nat. Rev. Genet. 16, 530–542. doi: 10.1038/nrg3966
Stroud, D. A., Surgenor, E. E., Formosa, L. E., Reljic, B., Frazier, A. E., Dibley, M. G., et al. (2016). Accessory subunits are integral for assembly and function of human mitochondrial complex I. Nature 538, 123–126. doi: 10.1038/nature19754
Sun, B. B., Maranville, J. C., Peters, J. E., Stacey, D., Staley, J. R., Blackshaw, J., et al. (2018). Genomic atlas of the human plasma proteome. Nature 558, 73–79. doi: 10.1038/s41586-018-0175-2
Suomalainen, A., Elo, J. M., Pietilainen, K. H., Hakonen, A. H., Sevastianova, K., Korpela, M., et al. (2011). FGF-21 as a biomarker for muscle-manifesting mitochondrial respiratory chain deficiencies: a diagnostic study. Lancet Neurol. 10, 806–818. doi: 10.1016/S1474-4422(11)70155-2
Tan, H., Yang, K., Li, Y., Shaw, T. I., Wang, Y., Blanco, D. B., et al. (2017). Integrative proteomics and phosphoproteomics profiling reveals dynamic signaling networks and bioenergetics pathways underlying T cell activation. Immunity 46, 488–503. doi: 10.1016/j.immuni.2017.02.010
Tawara, T., Fukushima, T., Hojo, N., Isobe, A., Shiwaku, K., Setogawa, T., et al. (1996). Effects of paraquat on mitochondrial electron transport system and catecholamine contents in rat brain. Arch. Toxicol. 70, 585–589. doi: 10.1007/s002040050316
The UniProt (2017). UniProt: the universal protein knowledgebase. Nucleic Acids Res. 45, D158–D169. doi: 10.1093/nar/gkw1099.
Thiele, I., Price, N. D., Vo, T. D., and Palsson, B. O. (2005). Candidate metabolic network states in human mitochondria. Impact of diabetes, ischemia, and diet. J. Biol. Chem. 280, 11683–11695. doi: 10.1074/jbc.M409072200
Thompson Legault, J., Strittmatter, L., Tardif, J., Sharma, R., Tremblay-Vaillancourt, V., Aubut, C., et al. (2015). A metabolic signature of mitochondrial dysfunction revealed through a monogenic form of leigh syndrome. Cell Rep. 13, 981–989. doi: 10.1016/j.celrep.2015.09.054
Thul, P. J., Akesson, L., Wiking, M., Mahdessian, D., Geladaki, A., Ait Blal, H., et al. (2017). A subcellular map of the human proteome. Science 356:eaal3321. doi: 10.1126/science.aal3321.
Titov, D. V., Cracan, V., Goodman, R. P., Peng, J., Grabarek, Z., and Mootha, V. K. (2016). Complementation of mitochondrial electron transport chain by manipulation of the NAD+/NADH ratio. Science 352, 231–235. doi: 10.1126/science.aad4017
Topol, E. J. (2014). Individualized medicine from prewomb to tomb. Cell 157, 241–253. doi: 10.1016/j.cell.2014.02.012
Toyama, E. Q., Herzig, S., Courchet, J., Lewis, T. L., Losón, O. C., Hellberg, K., et al. (2016). AMP-activated protein kinase mediates mitochondrial fission in response to energy stress. Science 351, 275–281. doi: 10.1126/science.aab4138
Uppal, K., Ma, C., Go, Y. M., Jones, D. P., and Wren, J. (2018). xMWAS: a data-driven integration and differential network analysis tool. Bioinformatics 34, 701–702. doi: 10.1093/bioinformatics/btx656
Varma, A., and Palsson, B. O. (1994). Stoichiometric flux balance models quantitatively predict growth and metabolic by-product secretion in wild-type Escherichia coli W3110. Appl. Environ. Microbiol. 60, 3724–3731.
Veling, M. T., Reidenbach, A. G., Freiberger, E. C., Kwiecien, N. W., Hutchins, P. D., Drahnak, M. J., et al. (2017). Multi-omic mitoprotease profiling defines a role for oct1p in coenzyme Q production. Mol. Cell. 68, 970.e11–977.e11. doi: 10.1016/j.molcel.2017.11.023
Vo, T. D., Greenberg, H. J., and Palsson, B. O. (2004). Reconstruction and functional characterization of the human mitochondrial metabolic network based on proteomic and biochemical data. J. Biol. Chem. 279, 39532–39540. doi: 10.1074/jbc.M403782200
Vo, T. D., Paul Lee, W. N., and Palsson, B. O. (2007). Systems analysis of energy metabolism elucidates the affected respiratory chain complex in Leigh’s syndrome. Mol. Genet. Metab. 91, 15–22. doi: 10.1016/j.ymgme.2007.01.012
Vyas, S., Zaganjor, E., and Haigis, M. C. (2016). Mitochondria and cancer. Cell 166, 555–566. doi: 10.1016/j.cell.2016.07.002
Wang, B., Mezlini, A. M., Demir, F., Fiume, M., Tu, Z., Brudno, M., et al. (2014). Similarity network fusion for aggregating data types on a genomic scale. Nat. Methods 11, 333–337. doi: 10.1038/nmeth.2810
Warburg, O., Wind, F., and Negelein, E. (1927). The metabolism of tumors in the body. J. Gen. Physiol. 8, 519–530. doi: 10.1085/jgp.8.6.519
Wei, A. C., Aon, M. A., O’Rourke, B., Winslow, R. L., and Cortassa, S. (2011). Mitochondrial energetics, pH regulation, and ion dynamics: a computational-experimental approach. Biophys. J. 100, 2894–2903. doi: 10.1016/j.bpj.2011.05.027.
Williams, E. G., Wu, Y., Jha, P., Dubuis, S., Blattmann, P., Argmann, C. A., et al. (2016). Systems proteomics of liver mitochondria function. Science 352:aad0189. doi: 10.1126/science.aad0189
Wortmann, S. B., Vaz, F. M., Gardeitchik, T., Vissers, L. E., Renkema, G. H., Schuurs-Hoeijmakers, J. H., et al. (2012). Mutations in the phospholipid remodeling gene SERAC1 impair mitochondrial function and intracellular cholesterol trafficking and cause dystonia and deafness. Nat. Genet. 44, 797–802. doi: 10.1038/ng.2325
Wu, H., von Kamp, A., Leoncikas, V., Mori, W., Sahin, N., Gevorgyan, A., et al. (2016). MUFINS: multi-formalism interaction network simulator. NPJ Syst. Biol. Appl. 2:16032. doi: 10.1038/npjsba.2016.32
Wu, Y., Williams, E. G., Dubuis, S., Mottis, A., Jovaisaite, V., Houten, S. M., et al. (2014). Multilayered genetic and omics dissection of mitochondrial activity in a mouse reference population. Cell 158, 1415–1430. doi: 10.1016/j.cell.2014.07.039
Yang, J. S., Kim, J., Park, S., Jeon, J., Shin, Y. E., and Kim, S. (2013). Spatial and functional organization of mitochondrial protein network. Sci Rep 3:1403. doi: 10.1038/srep01403
Zakrzewski, P., Medema, M. H., Gevorgyan, A., Kierzek, A. M., Breitling, R., and Takano, E. (2012). Multimeteval: comparative and multi-objective analysis of genome-scale metabolic models. PLoS One 7:e51511. doi: 10.1371/journal.pone.0051511
Zhang, M., Zhu, C., Jacomy, A., Lu, L. J., and Jegga, A. G. (2011). The orphan disease networks. Am. J. Hum. Genet. 88, 755–766. doi: 10.1016/j.ajhg.2011.05.006
Zhang, X., Dash, R. K., Jacobs, E. R., Camara, A. K. S., Clough, A. V., and Audi, S. H. (2018). Integrated computational model of the bioenergetics of isolated lung mitochondria. PLoS One 13:e0197921. doi: 10.1371/journal.pone.0197921
Keywords: integrative omics, genome scale models, constraint based modelling, network biology, mitochondrial disease, diagnostics, biomarkers, novel therapy development
Citation: Maldonado EM, Taha F, Rahman J and Rahman S (2019) Systems Biology Approaches Toward Understanding Primary Mitochondrial Diseases. Front. Genet. 10:19. doi: 10.3389/fgene.2019.00019
Received: 08 October 2018; Accepted: 14 January 2019;
Published: 01 February 2019.
Edited by:
Ivana Kurelac, University of Bologna, ItalyReviewed by:
Ranjan K. Dash, Medical College of Wisconsin, United StatesJuvid Aryaman, University of Cambridge, United Kingdom
Copyright © 2019 Maldonado, Taha, Rahman and Rahman. This is an open-access article distributed under the terms of the Creative Commons Attribution License (CC BY). The use, distribution or reproduction in other forums is permitted, provided the original author(s) and the copyright owner(s) are credited and that the original publication in this journal is cited, in accordance with accepted academic practice. No use, distribution or reproduction is permitted which does not comply with these terms.
*Correspondence: Shamima Rahman, c2hhbWltYS5yYWhtYW5AdWNsLmFjLnVr