 Zhen Xiang1†
 Shuzheng Song1†
 Zhenggang Zhu1Wenhong Sun2*Jaron E. Gifts3Sam Sun3Qiushi Shauna Li3
 Yingyan Yu1*
 Keqin Kathy Li3*
- 1Department of Surgery of Ruijin Hospital, and Shanghai Institute of Digestive Surgery, Shanghai Key Laboratory for Gastric Neoplasms, Shanghai Jiao Tong University School of Medicine, Shanghai, China
- 2Guangxi Key Laboratory of Processing for Non-ferrous Metal and Featured Materials, Research Center for Optoelectronic Materials and Devices, School of Physical Science Technology, Guangxi University, Nanning, China
- 3Department of Chemistry, Center for Diagnostics and Therapeutics, Georgia State University, Atlanta, GA, United States
Lapatinib is a small molecule inhibitor of EGFR (HER1) and ERBB2 (HER2) receptors, which is used for treatment of advanced or metastatic breast cancer. To find the drug resistance mechanisms of treatment for EGFR/ERBB2 positive tumors, we analyzed the possible effects of lncRNAs. In this study, using CCLE (Cancer Cell Line Encyclopedia) database, we explored the relationship between the lncRNAs and Lapatinib sensitivity/resistance, and then validated those findings through in vitro experiments. We found that the expression of EGFR/ERBB2 and activation of ERBB pathway was significantly related to Lapatinib sensitivity. GO (Gene Oncology) analysis of top 10 pathways showed that the sensitivity of Lapatinib was positively correlated with cell keratin, epithelial differentiation, and cell-cell junction, while negatively correlated with signatures of extracellular matrix. Forty-four differentially expressed lncRNAs were found between the Lapatinib sensitive and resistant groups (fold-change > 1.5, P < 0.01). Gene set variation analysis (GSVA) was performed based on 44 lncRNAs and genes in the top 10 pathways. Five lncRNAs were identified as hub molecules. Co-expression network was constructed by more than five lncRNAs and 199 genes in the top 10 pathways, and three lncRNAs (GIHCG, SPINT1-AS1, and MAGI2-AS3) and 47 genes were identified as close-related molecules. The three lncRNAs in epithelium-derived cancers were differentially expressed between sensitive and resistant groups, but no significance was found in non-epithelium-derived cancer cells. Correlation analysis showed that SPINT1-AS1 (R = −0.715, P < 0.001) and GIHCG (R = 0.557, P = 0.013) were correlated with the IC50 of epithelium-derived cancer cells. In further experiments, GIHCG knockdown enhanced cancer cell susceptibility to Lapatinib, while high level of SPINT1-AS1 was a sensitive biomarker of NCI-N87 and MCF7 cancer cells to Lapatinib. In conclusions, lncRNAs GIHCG and SPINT1-AS1 were involved in regulating Lapatinib sensitivity. Up-regulation of GIHCG was a drug-resistant biomarker, while up-regulation of SPINT1-AS1 was a sensitive indicator.
Introduction
Lapatinib is a small molecular drug that has been shown to be a dual tyrosine kinase inhibitor, which is involved in the EGFR/HER1 and ERBB2/HER2 pathways and suppresses the autophosphorylation of these receptors. Clinically, it has been used in combination therapy with capecitabine in patients with advanced or metastatic breast cancer that overexpressed ERBB2/HER2 in the cases of previous treatment with anthracyclines, taxanes, or trastuzumab (Herceptin) (Geyer et al., 2006). In addition, a satisfactory response rate has also been found with Lapatinib treatment for ERBB2-positive progressive gastric cancer (Cetin et al., 2014; Satoh et al., 2014). However, in patients with head and neck squamous cell carcinoma, Lapatinib combined with radiotherapy did not show therapeutic effects (Harrington et al., 2015). Similarly, in ERBB2/EGFR positive metastatic bladder cancer patients who underwent first-line chemotherapy didn't get benefit from Lapatinib maintenance treatment (Powles et al., 2017). Therefore, uncovering the drug-resistant mechanism of Lapatinib will help improve the therapeutic effects of Lapatinib targeted therapy and find new sensitive biomarkers.
Long non-coding RNAs (lncRNAs) are a large class of transcribed RNA molecules that are longer than 200 nucleotides but do not encode proteins. In addition to the regulation of diverse cellular processes, such as epigenetics, cell cycle, and cell differentiation, they have been found to play important roles in carcinogenesis, tumor development, and treatment resistance (Heery et al., 2017; Peng et al., 2017; Hahne and Valeri, 2018; Wang et al., 2018; Wu et al., 2018). For instance, Ma et al. found that lncRNAs CASC9 and EWAST1 were two crucial molecules associated to EGFR-TKIs resistant in non-small cell lung cancer (Ma et al., 2017).
The Cancer Cell Line Encyclopedia (CCLE) database (https://portals.broadinstitute.org/ccle) is an open access resource with the most completely integrated datasets of cancer cells genomes and drug effectiveness. It includes the experimental datasets of drug treatment of 24 kinds of chemical compounds in almost 1,000 cancer cell lines of various human cancers (Barretina et al., 2012). Kim et al. used CCLE database in their recent publication. They found that high levels of FGFR and integrin β3 are resistant to crizotinib treatment, suggesting that FGFR, and integrin β3 could be predictive markers for Met-targeted therapy (Kim et al., 2015). To date, there is a limited number of studies (Jiang et al., 2014; Niknafs et al., 2016; Bester et al., 2018; Li D. et al., 2018; Sun et al., 2018) to explore lncRNAs by CCLE database. In this study, we analyzed the lncRNAs of whole-genome datasets of CCLE after treatment with Lapatinib on pan-cancer cell lines, and proposed crucial lncRNAs GIHCG and SPINT1-AS1 involved in regulating Lapatinib sensitivity.
Materials and Methods
Data Extraction From CCLE
There are 5,344 lncRNA probes and 49,331 non-lncRNA probes in the whole-genome gene expression profile chip used in CCLE (Barretina et al., 2012). There are 1,037 cell lines of various cancer types in the database. Among those, 504 cell lines had been treated with Lapatinib and got IC50 (half maximal inhibitory concentration) data and 501 cell lines were examined by microarrays. Since the study focused on solid tumors, we deleted cell lines of hematopoietic and lymphoid cell lines. Finally, 420 solid tumor cell lines were enrolled in the study (Table 1).
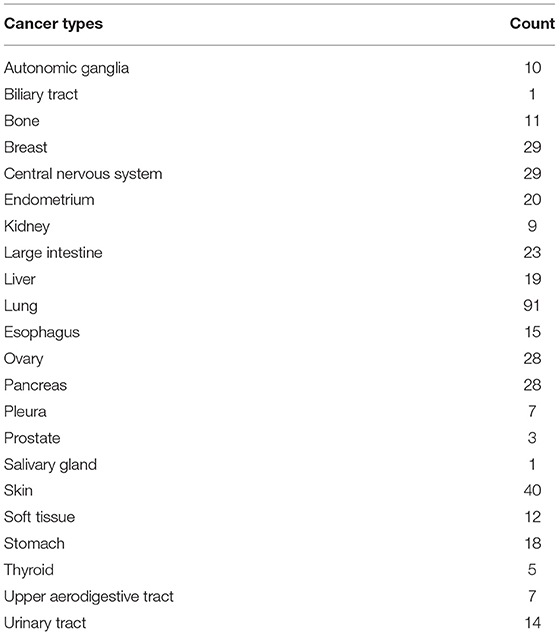
Table 1. The distribution of 420 cancer cell lines of solid tumor.
Cancer Cell Lines and Cell Culture
Nineteen cancer cell lines were used for validating experiments in vitro. Four of those were gastric cancer cell lines (NCI-N87, SGC-7901, AGS, and MKN-45), three were melanoma cell lines (MuM-2C, MV3, and A-375), three were hepatocarcinoma cell lines (LM3, 97L, and Huh7), three were thyroid cancer cell lines (KHM-5M, CAL-62, and C643), two were breast cancer cell lines (MCF7 and SK-BR-3), two were pancreatic cancer cell lines (TCC-PAN2 and BxPC3), and two were colorectal cancer lines (DLD-1 and NCIH-747). Cell lines NCI-N87, MuM-2C, LM3, MV3, Huh7, SGC-7901, CAL-62, AGS, MCF7, C643, 97L, SK-BR-3, KHM-5M, A-375, TCC-PAN2, MKN-45, and BxPC3 were purchased from the Cell Bank of Type Culture Collection of Chinese Academy of Sciences (Shanghai, China). Cell lines DLD-1 and NCIH-747 were purchased from The Global Bioresource Center ATCC (Maryland, USA). The cell lines were cultured in RPMI-1640 supplemented with 10% fetal bovine serum in a humidified incubator at 37°C with 95% air and 5% CO2.
Transient Transfection of siRNAs
SPINT1-AS1 and GIHCG siRNAs were transfected into cancer cells by Lipofectamine 2000 (Invitrogen, Carlsbad, California, USA) according to the manufacturer's instructions. The siRNA sequences are shown in Table S1.
RNA Extraction and Quantitative Real-Time PCR Analysis
Total RNA was isolated using the TRIzol solution (Invitrogen, California, USA). The cDNA was synthesized using Reverse Transcription kit (TOYOBO, Japan). Real-time PCR was performed in 10 μl reaction mixtures with the HT 7900 (Applied Biosystems, Foster City, USA) using SYBR™ Select Master Mix (Applied Biosystems, Foster City, USA). The sequences of primers were designed and synthesized by Sunny Biotech (Shanghai, China): The primer sequences are shown in Table S1.
Cell Viability Assay
Five thousand cells of different cancers were placed in each well of 96-well plates (100 μl/well). Different concentrations of Lapatinib (Selleck, Houston, USA) were incubated for 48 h. After adding 10 μl CCK-8 for 2 h, OD value was measured at 450 nm by spectrophotometry (BioTek, Vermont, USA).
Data Analysis
The “corrplot” and “pheatmap” package in R software were utilized for visualizing pearson correlation analysis and cluster analysis by “euclidean” method. The Benjamini and Hochberg method was used to calculate P. adjust value. By means of “clusterProfiler” package in R, GSEA (Gene Set Enrichment Analysis) and GO (Gene Ontology) analyses were carried out to explore involved gene clusters. GSEA is a computational method based on previous publication by Subramanian et al. (2005). GO analysis is a kind of gene enrichment analysis to classify gene set on three aspects: molecular function, cellular component and biological process (Ashburner et al., 2000). Differentially expressed lncRNAs and genes with difference larger than 1.5-fold were obtained by “limma” package, which is often used to explore differentially expressed genes between two phenotypes (Ritchie et al., 2015). The top 10 gene clusters of all cancer cell lines were scored using “GSVA” package (Gene Set Variation Analysis,) in R language, which utilizes non-parametric unsupervised method for evaluating gene set enrichment (GSE) in transcriptomic data (Hanzelmann et al., 2013). Cytoscape software was applied to establish co-expression network and determine hub lncRNAs. The inhibiting ratio and Lapatinib IC50 were calculated according to OD value by GraphPad Prism 6.0 (Inc., La Jolla, CA, USA). The relative RNA levels were calculated by 2−ΔΔCT (ΔCT = LncRNACTvalue − GAPDHCTvalue, ΔΔCT = ΔCT−ΔCTmin, ΔCTmin: minimum ΔCT of expression levels of lncRNA GIHCG or SPINT1-AS1 in cell line). Student's t-tests were performed by GraphPad Prism 6.0. P < 0.05 was considered statistically significant.
Results
Lapatinib IC50 From Pan-Cancer Cell Lines Analysis
The CCLE data of Lapatinib IC50 of the selected 420 cell lines was shown in Table 2. The upper limit of IC50 was originally determined as 8 μM for those cancer cell lines in the database. There were 302 cancer cell lines with IC50 higher than 8 μM, which were insensitive to Lapatinib drug. There were 118 cancer cell lines with IC50 lower than 8 μM, which were relatively sensitive to Lapatinib drug. Taking 8 μM of IC50 as a threshold, we categorized 420 cancer cell lines into two groups, high_IC50 (n = 302) and low_IC50 (n = 118). Since EGFR and ERBB2 are the targets of the Lapatinib drug, the expression levels of EGFR, and ERBB2 in high_IC50 and low_IC50 groups were analyzed. The expression levels of EGFR and ERBB2 were significantly higher in low-IC50 group than in high_IC50 (Figure 1A, P = 0.006 and P < 0.001, respectively). The distribution tendency of 22 types of solid cancer cell lines in high-IC50 (up to 8 μM) and low_IC50 (lower than 8 μM) groups is presented in Figure 1B. GSEA analysis showed that ERBB pathway-related genes were enriched in low_IC50 group (Figure 1C, ERBB signaling pathway NES = −1.81, P < 0.002, p. adjust = 0.064; regulation of ERBB signaling pathway NES = −1.69, P < 0.002, p. adjust = 0.064).

Table 2. Lapatinib IC50 of 420 cancer cell lines.
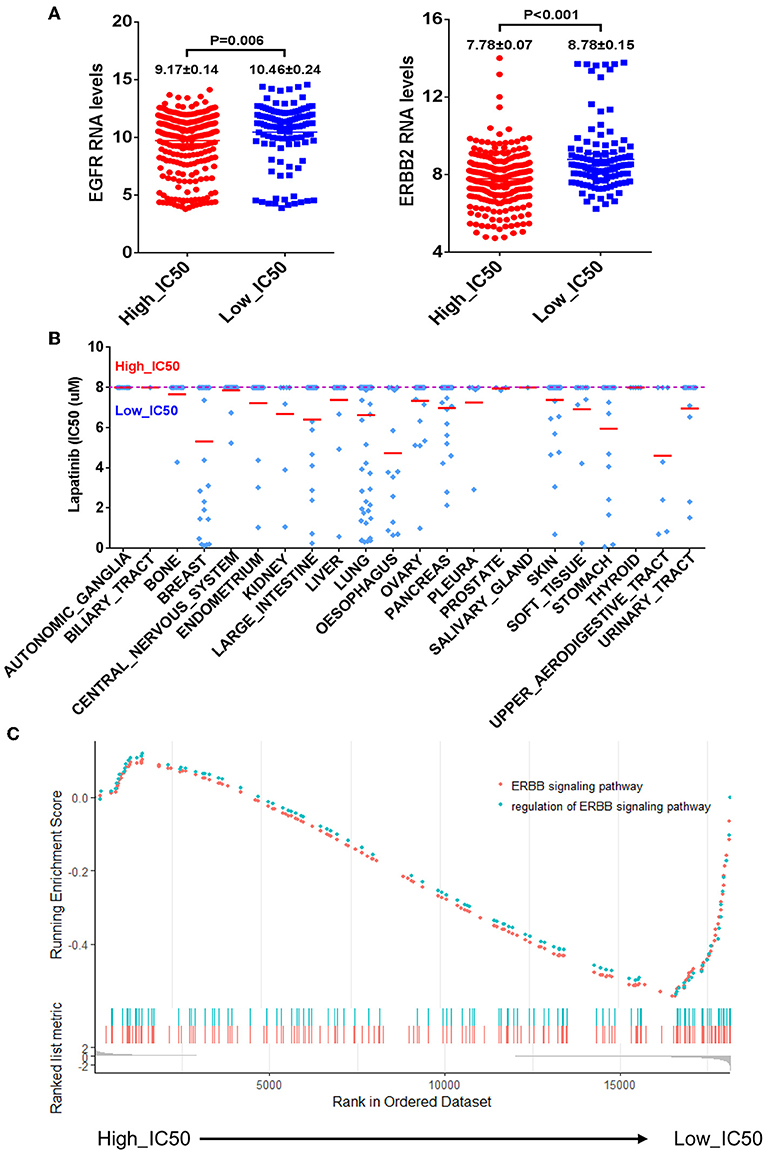
Figure 1. The correlation of mRNA expression levels of EGFR and ERBB2 and Lapatinib IC50. (A) The bar charts of mRNA expression levels of EGFR (left) and ERBB2 (right) of cancer cell lines between the high_IC50 and low_IC50 groups of Lapatinib drug. The expression levels of EGFR and ERBB2 are significantly higher in the low_IC50 group than that in the high_IC50 group (p < 0.01). (B) The distribution tendency of 22 types of solid cancer cell lines in high-IC50 (up to 8 μM) and low_IC50 (lower than 8 μM). The red lines represent mean value of Lapatinib IC50. (C) The enrichment analysis of ERBB signaling pathway reveals that ERBB signaling pathway is significantly enriched in Lapatinib low_IC50 group. “Y” axis indicates the enrichment score (ES) value, and “X” axis indicates genes according to differential expression value between high_IC50 and low_IC50 groups. The blue and red dot curves represent ES value. The bottom barcodes represent the leading gene set that strongly contributed to ES value. The positive ES value represents positive correlation to Lapatinib IC50, and minus ES value represents negative correlation to Lapatinib IC50.
Pathway Analysis Involved in Lapatinib Sensitivity
To illustrate the mechanism of Lapatinib resistance, we selected genes with fold-change >1.5 times to perform GO analysis (Table S2). In the top 10 involved pathways, Lapatinib sensitivity was positively associated with cell keratin, epithelial differentiation, and cell-cell junction, while negatively related to signatures of extracellular matrix (Figure 2, P < 0.001, P. adjust < 0.001).
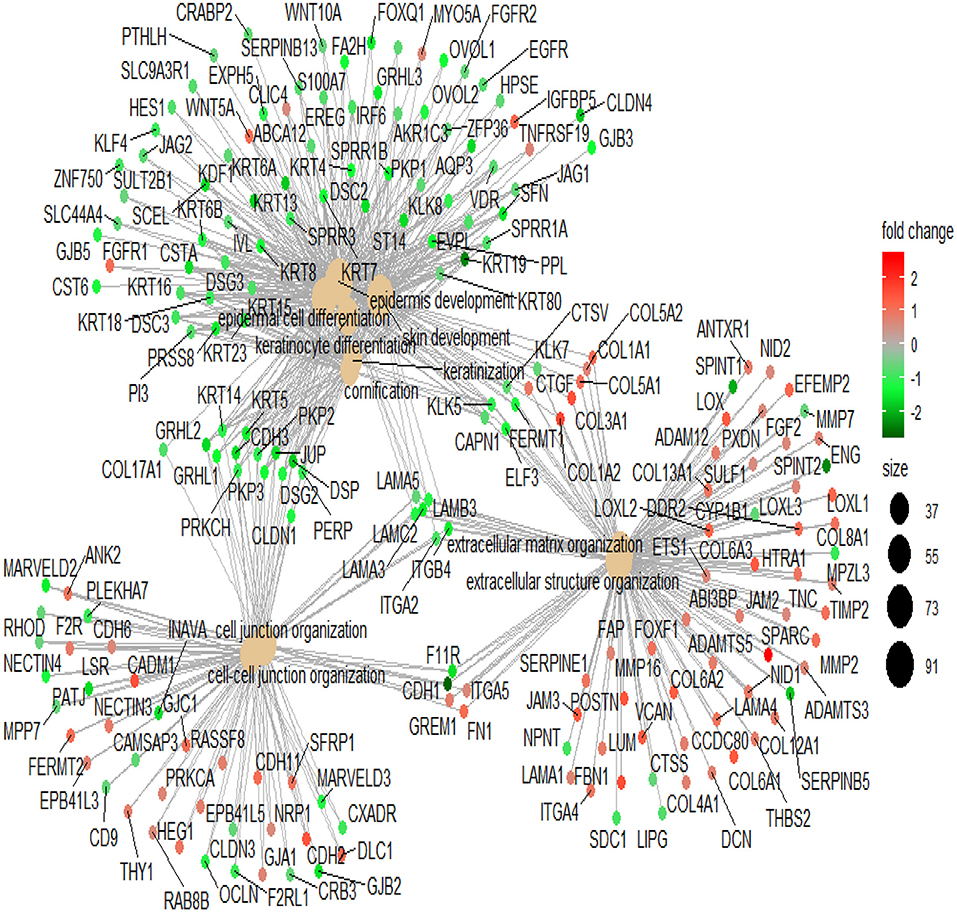
Figure 2. The network of top 10 genes by GO pathway analysis. The large spots in the center of the networks are the gene clusters, and the small spots connected with large spots are the related genes in the pathways. Red spots indicate that the genes are highly expressed in the high_IC50 group. Green spots indicate that the genes are highly expressed in the low_IC50 group. The darker red or green spot are the larger fold-change of differential genes. The black spots with different sizes and numbers on the right side indicate the gene numbers in the gene clusters.
Analysis of LncRNAs Involved in Lapatinib Sensitivity
We further screened the differentially expressed lncRNAs, and 44 lncRNAs were identified between the high_IC50 group and low_IC50 group (Figure 3A and Table 3, fold-change >1.5, P < 0.01). Then, we selected genes in the top 10 pathways and 44 differential lncRNAs for the construction of the co-expression network. The enrichment scores of the top 10 pathway genes in every cancer cell lines were calculated and determined by GSVA analysis. Five lncRNAs were highlighted as the hub factors in the top 10 regulating pathways (Figure 3B). The association of the 5 lncRANs with 199 genes in the top 10 pathways was further analyzed, and a molecular network of co-expression was established, which included top 50 key molecules closely associated to Lapatinib sensitivity. Three crucial lncRNAs, GIHCG, SPINT1-AS1, and MAGI2-AS3, still remained in the co-expression network (Figure 3C).
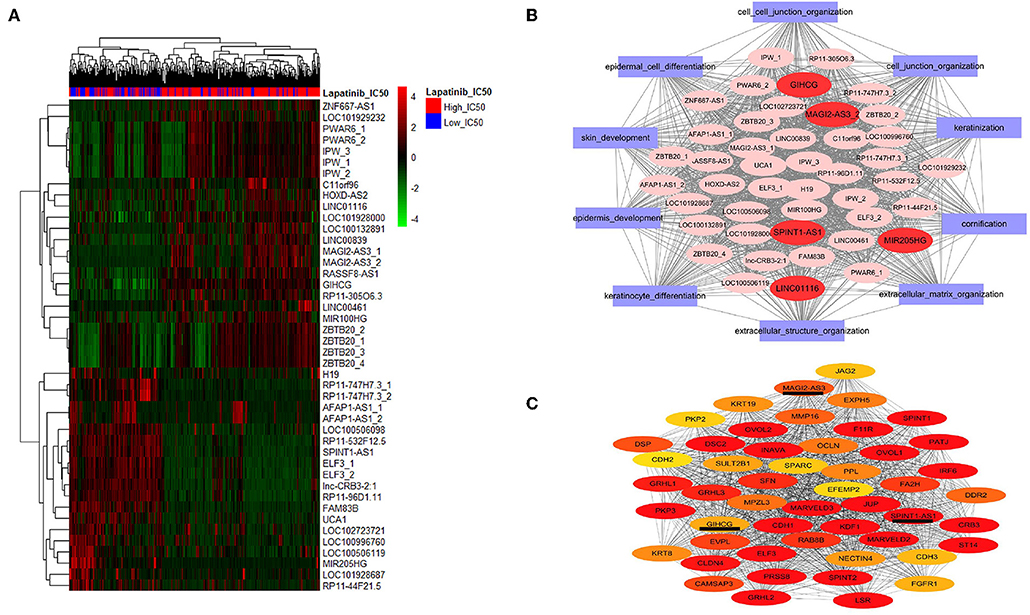
Figure 3. Screening lncRNAs related to Lapatinib sensitivity. (A) The heatmap of 44 differentially expressed lncRNAs between high_IC50 group and low_IC50 groups (fold-change >1.5, P < 0.05). The red bars on the top present high_IC50 cases, and blue bars represent low_IC50 cases. The numbers of the right side are the names of lncRNAs. The numbers tagged in lncRNAs represent probe codes. (B) The co-expression molecular network of the 44 differentially expressed lncRNAs. The red ovals represent five crucial lncRNAs in the network, and the purple rectangles outside indicate the top 10 functional gene sets by GO analysis. (C) The co-expression molecular network of the top 50 differentially expressed genes and lncRNAs between the high_IC50 group and the low_IC50 group. In this network, three of differentially expressed molecules are lncRNAs (SPINT1-AS1, MAGI2-AS3, and GIHCG), which are underlined. The colors nodes of the network from red, dark yellow to light yellow indicate gradually weakened correlation to Lapatinib sensitivity.
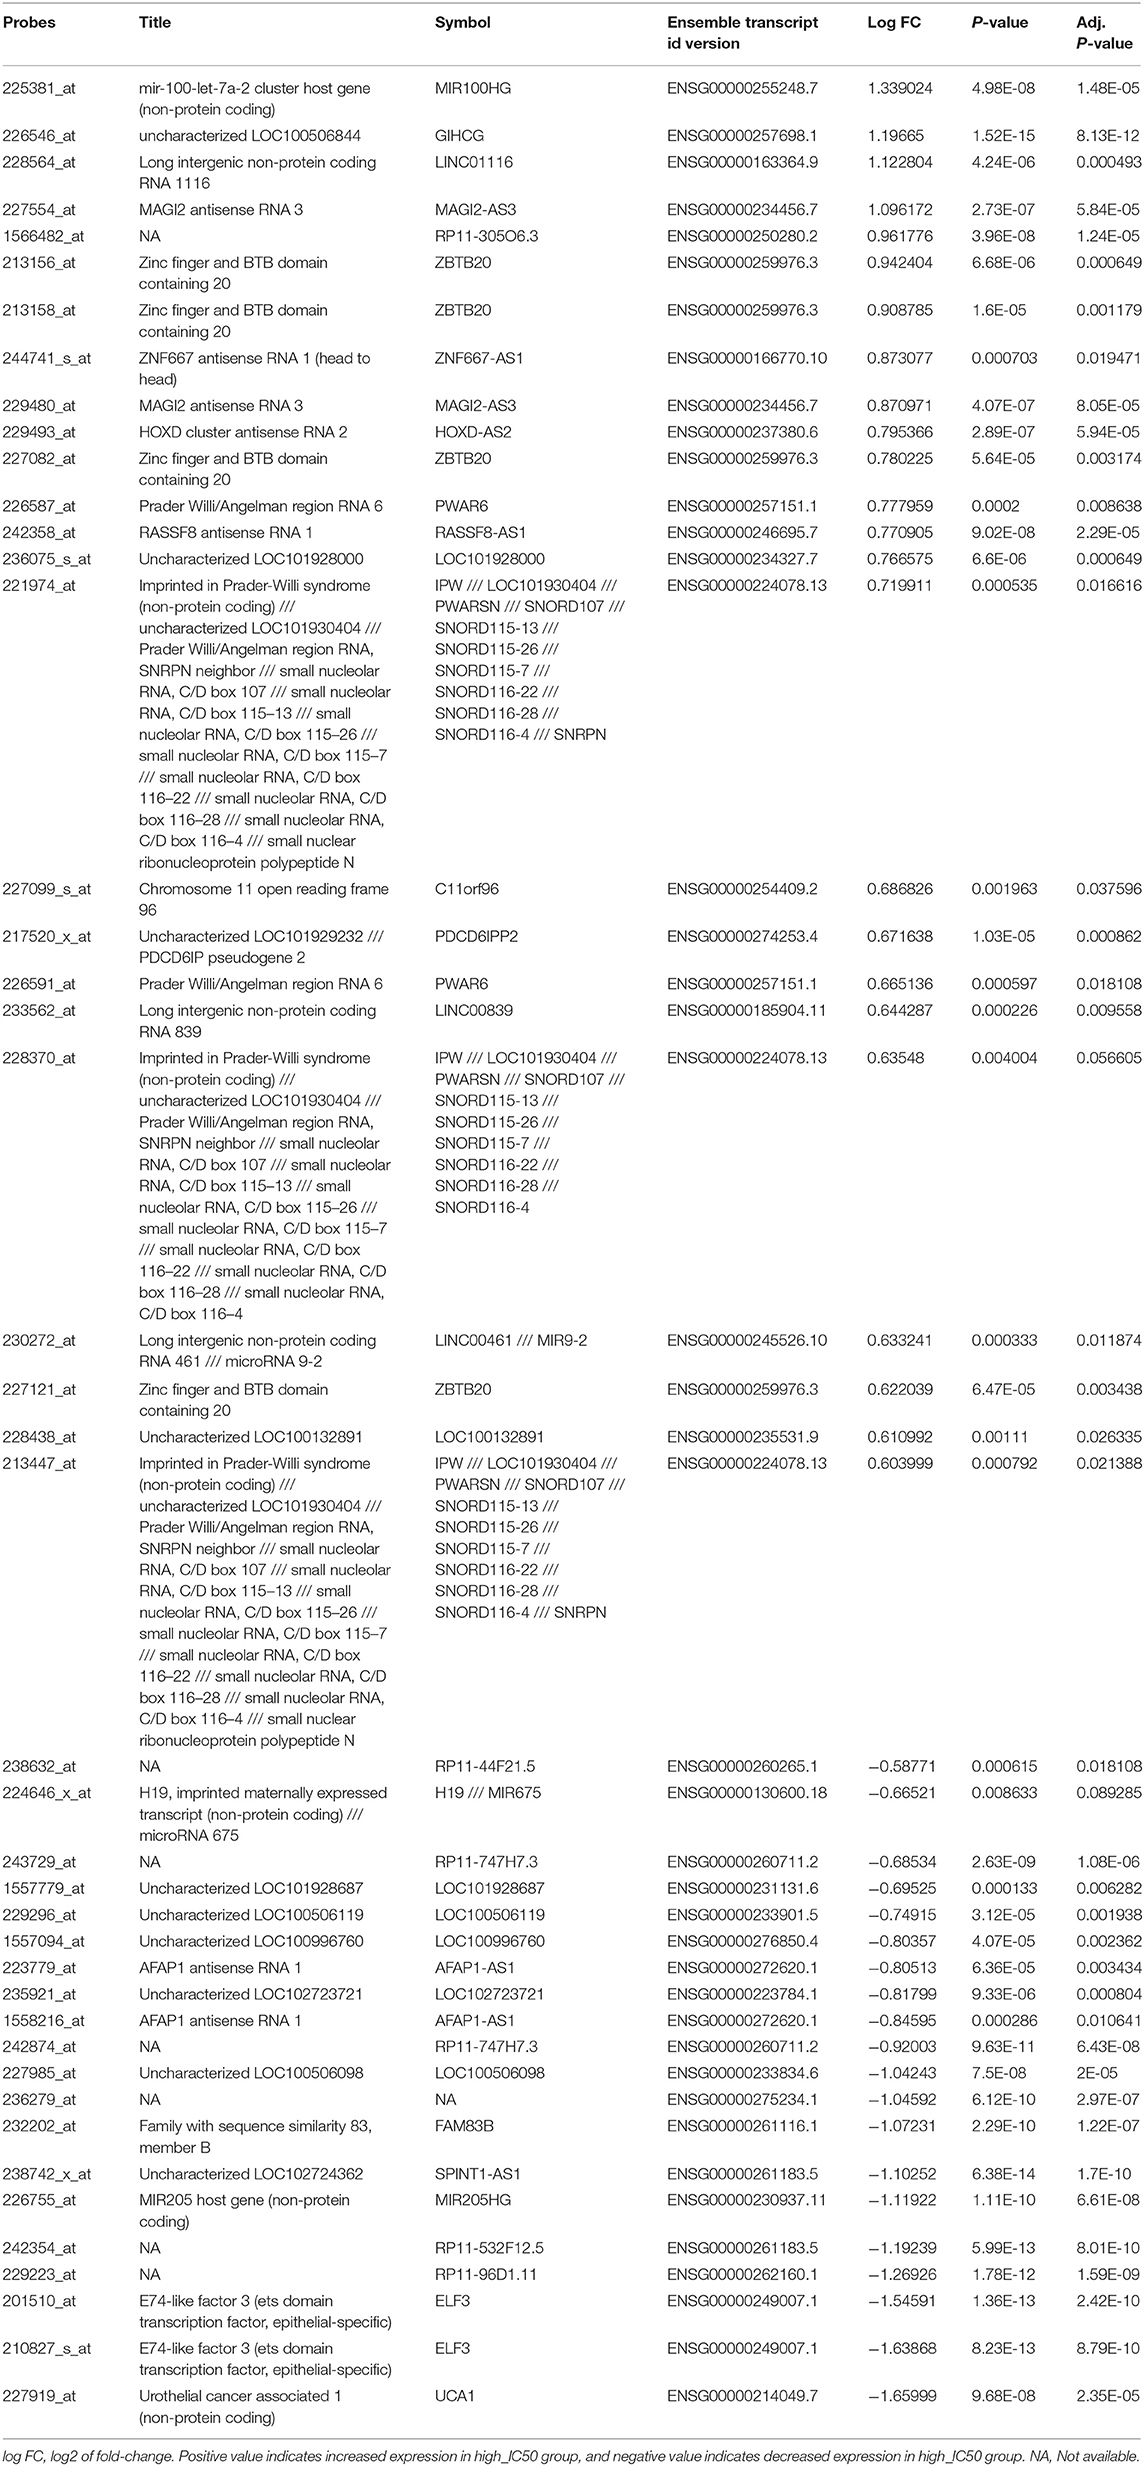
Table 3. Differentially expressed lncRNAs between Lapatinib high_IC50 and low_IC50 groups of 420 cancer cell lines (fold-change >1.5, P < 0.01).
Differential Expressing Analysis of Three LncRNAs Between Epithelial and Non-epithelial Cancer Groups
We divided the 420 cancer cell lines into epithelium derived group (n = 278) and non-epithelium derived group (n = 142; including nervous system, bone, cartilage, and pleura). The differential expression levels of the three lncRNAs between the two groups are presented in Figure 4A. In the epithelium-derived group, the differential expression levels of the three lncRNAs between Lapatinib high_IC50 and low_IC50 groups were significantly different (Figure 4B, P < 0.05). In the non-epithelium groups, there was no significant difference of the three lncRNAs between Lapatinib high_IC50 and low_IC50 groups. Higher expressing level of SPINT1-AS1 was found in epithelium-derived cancer cells, and higher expressing levels of MAGI2-AS3 and GIHCG were observed in the non-epithelium group.
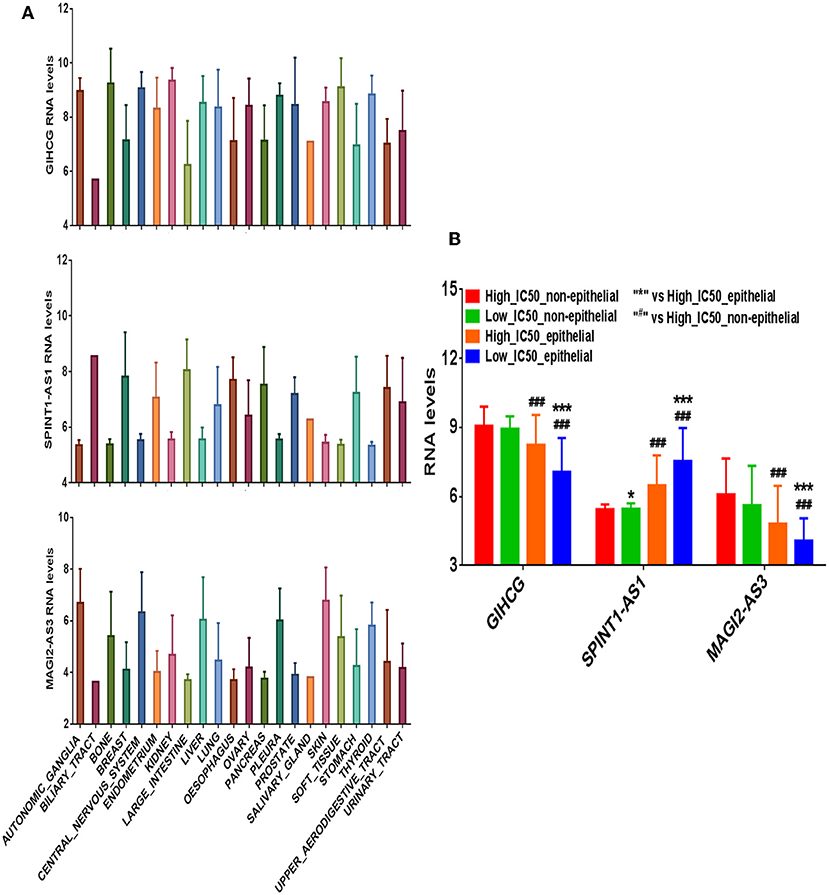
Figure 4. The correlation of expression levels of three crucial lncRNAs and originated sites of cancer cell lines. (A) The expression levels of GIHCG, SPINT1-AS1, and MAGI2-AS3 on 22 types of cancer cell lines. (B) The bar charts of expression levels of GIHCG, SPINT1-AS1, and MAGI2-AS3 between Lapatinib high_IC50 and low_IC50 groups in epithelial cancer cell lines and non-epithelial cancer cell lines.
Differentially expressed genes (1.5-fold change) between the Lapatinib high_IC50 and low_IC50 groups in epithelial group (Table S3) were utilized to perform GO analysis. Enhanced signatures of cell keratin, epithelial differentiation, and cell-cell junction were observed in Lapatinib low_IC50 group, and decreased signature of extracellular matrix were observed in Lapatinib low_IC50 group (Figure 5, P < 0.001, P. adjust < 0.001).
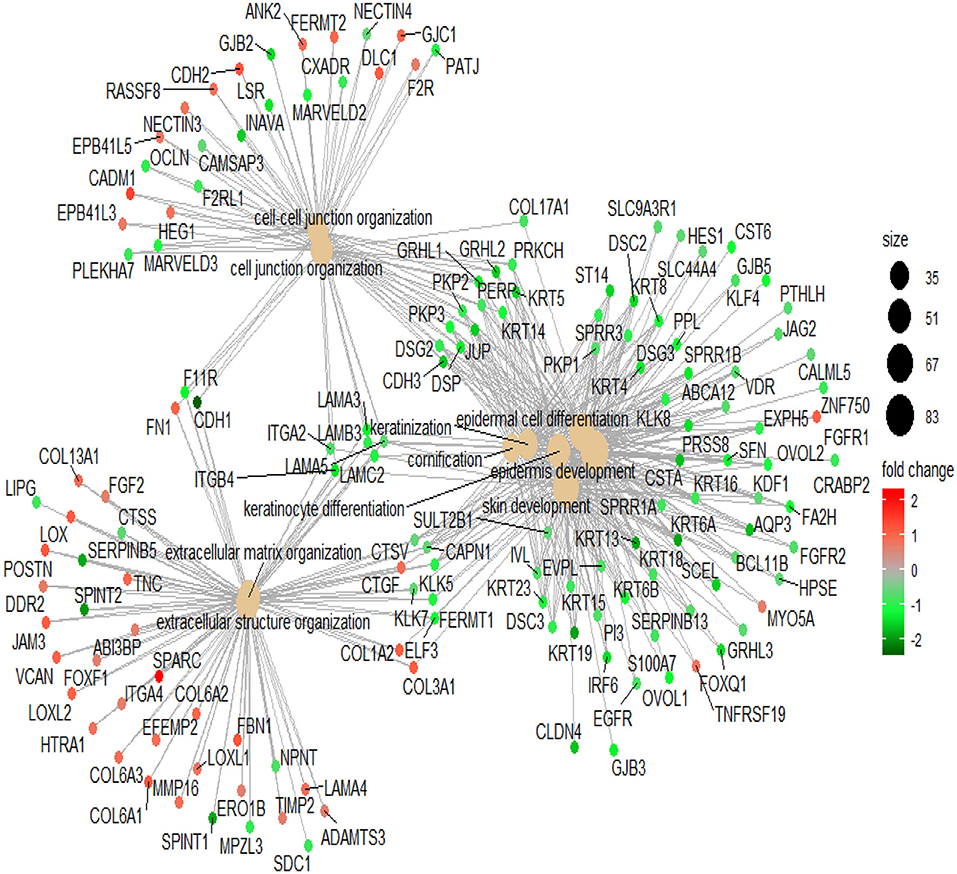
Figure 5. Pathway analysis of Lapatinib sensitivity related genes. The genes in the top 10 pathways with fold-change more than 1.5 are used between Lapatinib high_IC50 and low_IC50 groups. The middle brown dot of each network indicates the name of a gene set, and the small dots surrounding it indicate the genes of the gene set. The red dots represent the up-regulated genes in the high_IC50 group, and the green dots represent the up-regulated genes in the low_IC50 group. The darker red or green spot are the larger fold-change of differential genes. The black spots with different sizes and numbers on the right side indicate the gene numbers in the gene clusters.
Correlation of LncRNAs SPINT1-AS1, GIHCG, or MAGI2-AS3 and Lapatinib Sensitivity in Epithelial Group
Correlation analysis revealed that Lapatinib IC50 of the non-epithelial group was higher than that of the epithelial group (Figure 6A). Of the three critical lncRNAs, SPINT1-AS1, and GIHCG were the lncRNAs most correlated to Lapatinib sensitivity (Figure 6B). SPINT1-AS1 and GIHCG were selected as key factors of affecting Lapatinib sensitivity of epithelial cancers. The up-regulation of SPINT1-AS1 was found in low_IC50 group and increased GIHCG was found in high_IC50 group (Figure 6C).
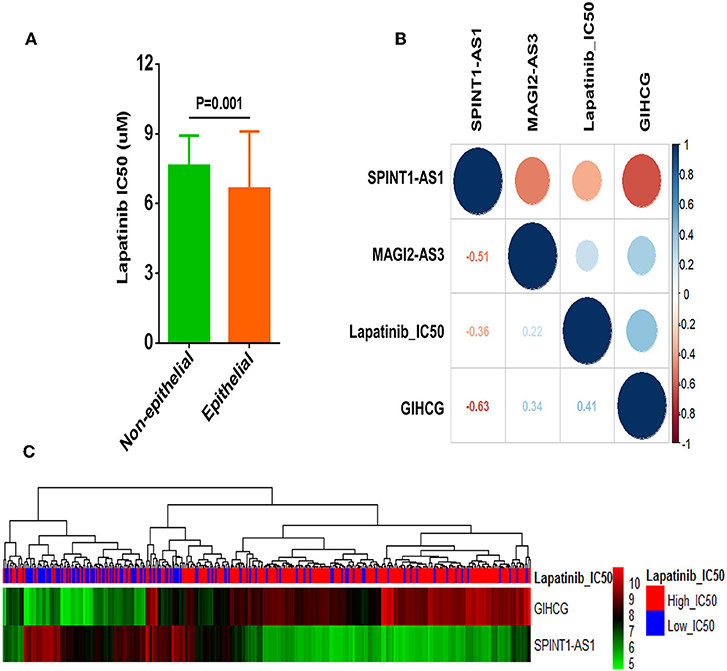
Figure 6. Correlation analysis of three crucial lncRNAs GIHCG, SPINT1-AS1, MAGI2-AS3, and Lapatinib sensitivity in epithelial cancer cells. (A) Non-epithelial cancer cells showed higher Lapatinib_IC50 than epithelial cancer cells in the CCLE database. (B) Correlation between three lncRNAs and Lapatinib IC50 of epithelial cancer cells. Red circles represent negative correlation, and blue circles represent positive correlation. The number of the lower left grids indicates correlation coefficient between two factors (all P-values < 0.001). (C) The heatmap presents expression levels of GIHCG and SPINT1-AS1 in Lapatinib high_IC50 and low_IC50 groups of epithelial cancer cell lines.
Validating Study of GIHCG and SPINT1-AS1 on Regulating Lapatinib Sensitivity in vitro
In validating experiments, we examined expression levels of GIHCG and SPINT1-AS1 in seven types of cancer cell lines (thyroid cancer, pancreatic cancer, liver cancer, melanoma, gastric cancer, breast cancer, and colorectal cancer) and Lapatinib IC50 of the same cancer cell lines. Correlation analysis showed that higher expression levels of SPINT1-AS1 were significantly associated with lower Lapatinib IC50 (Figure 7A, R = −0.715, P < 0.001), while higher expression levels of GIHCG were significantly related to higher Lapatinib IC50 (Figure 7A, R = 0.557, P = 0.013).
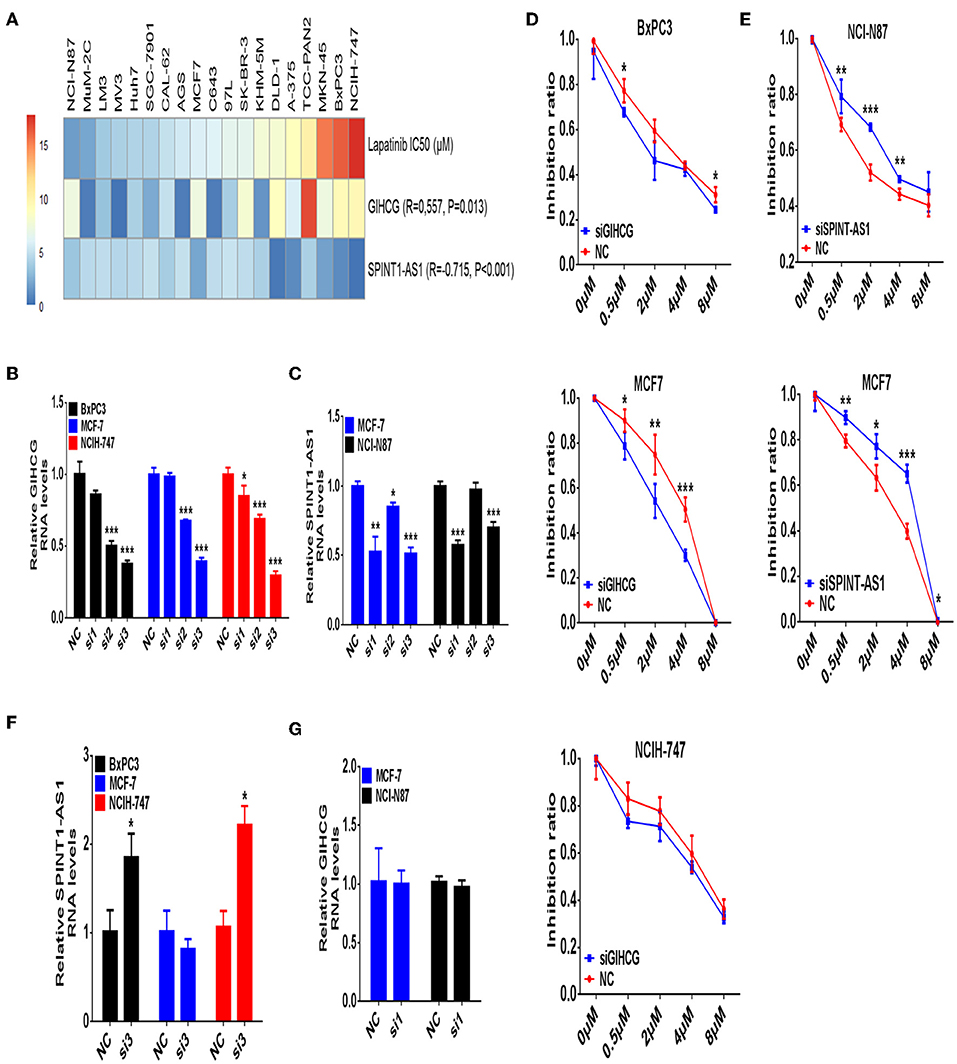
Figure 7. Validating study of lncRNAs GIHCG and SPINT1-AS1 on regulating Lapatinib sensitivity. (A) The Lapatinib IC50 and expression levels of GIHCG and SPINT1-AS1 are assayed on 19 cancer cell lines from different types of cancer origin. The expression level of GIHCG is positively related to Lapatinib IC50 (R = 0.557, P = 0.013), while the expression level of SPINT1-AS1 is negatively related to Lapatinib IC50 (R = −0.715, P < 0.001). (B) Knockdown of GIHCG is performed by siRNA in BxPC3, MCF7, and NCIH-747 cancer cells. (C) Knockdown of SPINT1-AS1 is performed by siRNA in NCI-N87 and MCF7 cancer cells. (D) Knockdown of GIHCG shows enhancing Lapatinib sensitivity in BxPC3, MCF7, and NCIH-747 cancer cells. (E) Knockdown of SPINT1-AS1 shows promoting Lapatinib resistance in NCI-N87 and MCF7 cancer cells. (F) Knockdown of GIHCG discloses increased SPINT1-AS1 expression in BxPC3 and NCIH-747 cancer cells. (G) Knockdown of SPINT1-AS1 does not increase GIHCG expression in NCI-N87 and MCF7 cancer cells. Experimental group vs. negative control (NC), *P < 0.05, **P < 0.01, ***P < 0.001.
The sensitive cancer cell lines of NCI-N87 (gastric cancer) and MCF7 (breast cancer), as well as the resistant cancer cell lines of NCIH-747(colon cancer) and BxPC3 (pancreatic cancer) were selected for a subsequent validating study. After knocking-down expression levels of GIHCG and SPINT1-AS1 by small interfering RNAs, Lapatinib IC50, and inhibitory rate of cancer cells were detected. Among three small interference sequences of GIHCG and SPINT1-AS1 mRNAs, siRNA sequence 3 of GIHCG (Si3, Figure 7B), and siRNA sequence 1 of SPINT1-AS1 (Si1, Figure 7C) were identified as effective siRNAs for further experiments.
Knocking-down of GIHCG could significantly enhance the sensitivity to Lapatinib in MCF7 and BxPC3 cancer cell lines (Figure 7D), while down-regulation of SPINT1-AS1 could promote resistance to Lapatinib in NCI-N87 and MCF7 cancer cell lines (Figure 7E). To clarify whether there is a mutual regulatory relationship between GIHCG and SPINT1-AS1, we detected the expression level of SPINT1-AS1 after GIHCG knockdown and vice versa. As shown in Figures 7F,G, suppression of GIHCG in Lapatinib resistant cancer cell lines NCIH-747 and BxPC3 could induce up-regulation of SPINT1-AS1 (P < 0.05), while knockdown of SPINT1-AS1 did not change the expression level of GIHCG (P > 0.05).
Discussion
LncRNA is an important regulatory molecule in drug resistance during chemotherapy or gene targeted therapy (Li et al., 2016; Dong et al., 2018; Wu et al., 2018; Zhou et al., 2018). In this study, we analyzed Lapatinib sensitivity to EGFR and ERBB2 targeted therapy pan-cancer cell line wide. We noticed that Lapatinib sensitivity was not only positively correlated to the activation of EGFR and ERBB2 signaling pathways, but also positively associated to cell keratin, epithelial differentiation, and cell-cell junction. The Lapatinib sensitivity of cancer cell lines was negatively associated to extracellular matrix signature. By screening differentially expressed lncRNAs and establishing co-expression network between Lapatinib high_IC50 and low_IC50 groups, three key lncRNAs, SPINT1-AS1, GIHCG, and MAGI2-AS3, were found. Of those, GIHCG and SPINT1-AS1 were only differentially expressed in epithelial derived cancers. SPINT1-AS1 was negatively related to Lapatinib IC50, whereas GIHCG was positively associated to Lapatinib IC50. By siRNAs treatment, downregulation of SPINTA-AS1 could promote Lapatinib resistance, while downregulation of GIHCG promoted Lapatinib sensitivity. The combination of bioinformatical approach and experimental study confirmed that lncRNAs were involved in regulating sensitivity to Lapatinib targeted therapy.
PI3K/Akt, Ras/Raf/MEK/ERK1/2, and PLCγ pathways are downstream pathways of EGFR and ERBB2 and play important roles in cell proliferation and survival of multiple cancers (Roskoski, 2014). The expression levels of EGFR and ERBB2 are positively correlated to Lapatinib sensitivity (Rusnak et al., 2007; Xiang et al., 2018). Trastuzumab (Herceptin) is a molecular targeted drug of ERBB2-positive metastatic/advanced breast cancer and gastric cancer (Bang et al., 2010; Loibl and Gianni, 2017). Lapatinib is a small molecule chemical, which proved effective for ERBB2-positive advanced or metastatic breast cancer when combined with capecitabine after previous treatment with anthracyclines, paclitaxel, or trastuzumab (Geyer et al., 2006). In gastric cancer, treatment with Lapatinib plus capecitabine and oxaliplatin also revealed anti-cancer effects on HER2-amplified gastroesophageal adenocarcinoma, especially in Asian and younger patients (Hecht et al., 2016). LncRNAs emerged as one of the new resistance mechanisms to chemotherapy or molecule targeted therapy. By bioinformatics analysis, Lapatinib sensitive cancer cells exhibited enrichment of genes related to cell keratin, epithelial differentiation, and cell-cell junction. The ERBB family plays an important role in regulating cell differentiation (Pellat et al., 2017). We noticed that Lapatinib sensitivity is positively correlated to ERBB pathway activation. It means that cancer cells sensitive to Lapatinib drug often showed enrichment of cell differentiation-related genes, while Lapatinib-resistant cancer cells are often accompanied by enrichment of extracellular matrix pathway (D'Amato et al., 2015; Khan et al., 2016; Lin et al., 2017; Watson et al., 2018). Furthermore, increases of extracellular matrix could further induce epithelial-mesenchymal transition of cancer cells (Tzanakakis et al., 2018).
Although the role of lncRNAs in cancer progression and Lapatinib resistance have been reported in other studies (Russell et al., 2015; Li et al., 2016; Liang et al., 2018; Ma et al., 2018), this is the first study that proved that lncRNAs GIHCG and SPINT1-AS1 are involved in regulating therapeutic sensitivity to Lapatinib. Based on pan-cancer cell lines analysis, Lapatinib IC50 is significantly different between non-epithelial cancer cell lines, and epithelial cancer cell Lines. As the inhibitor of miR-200b/200a/429, LncRNA GIHCG was shown effectively promoting the progression of liver cancer through inducing methylation of miR-200b/200a/429 promoter (Sui et al., 2016). GIHCG is also involved in promoting cancer proliferation and migration in tongue and renal cancers (D'Aniello et al., 2018; Ma et al., 2018). However, there is no study $om whether or not GIHCG could regulate Lapatinib drug sensitivity in cancers. LncRNA SPINT1-AS1 is a Kunitz type 1 antisense RNA1, belonging to serine peptidase inhibitor. An increased expression of SPINT1-AS1 has been observed in colorectal cancer (Li C. et al., 2018). It is also the first time that lncRNA SPINT1-AS1 has been found regulating Lapatinib drug sensitivity on multiple cancer cells. In validating experiments, the knockdown of SPINT1-AS1 did not result in the up-regulation of GIHCG. We speculated that GIHCG may regulate SPINT1-AS1 expression through regulating promoter methylation or by manner of competitive endogenous RNA (ceRNA) (Zhang G. et al., 2018; Zhang L. et al., 2018). However, the mutual regulatory mechanisms of lncRNA GIHCG and SPINT1-AS1 remain to be studied in the future.
Conclusion
In conclusion, the current study proposed a group of lncRNAs related to Lapatinib sensitivity based on pan-cancer cell lines analysis. By subsequent experimental study, lncRNAs GIHCG and SPINT1-AS1 were firstly identified as crucial lncRNAs in regulating Lapatinib resistance or sensitivity in epithelium-derived cancer cell lines. SPINT1-AS1 is a Lapatinib sensitivity predictor, while GIHCG is a predictive molecule for Lapatinib resistance.
Ethics Statement
The protocols used in this study were approved by Rui Jin Hospital Ethics Review Boards. Written informed consents were obtained from all human material donors in accordance with the Declaration of Helsinki. Animals were used according to the protocols approved by Rui Jin Hospital Animal Care and Use Committee.
Author Contributions
KL and YY conceived and designed the experiments. ZX, ShS, ZZ, JG, and QL performed the experiments. ZX, ZZ, SaS, WS, YY, and KL analyzed the data. ZX, ShS, ZZ, SaS, WS, YY, and KL contributed reagents, materials, and analysis tools. ZX, YY, and KL wrote the paper.
Funding
This project was supported by the National Natural Science Foundation (NSF 81270622 and 81772505), Bagui Talent Foundations (T3120097921, T3120099202, A3120099201, and C31200992001), Innovation Foundation for Key Laboratory of Processing for Non-ferrous Metal and Featured Materials (AE3390003605), National Key R&D Program of China (2017YFC0908300, 2016YFC1303200), China 973 Program (2013CB733700 and 2011CB510102), Shanghai Science and Technology Committee (18411953100), the Cross-Institute Research Fund of Shanghai Jiao Tong University (YG2017ZD01, YG2015MS62), Innovation Foundation of Translational Medicine of Shanghai Jiao Tong University School of Medicine (15ZH4001, TM201617, and TM 201702), and Technology Transfer Project of Science & Technology Dept. Shanghai Jiao Tong University School of Medicine.
Conflict of Interest Statement
The authors declare that the research was conducted in the absence of any commercial or financial relationships that could be construed as a potential conflict of interest.
Acknowledgments
We acknowledge open database of CCLE.
References
Ashburner, M., Ball, C. A., Blake, J. A., Botstein, D., Butler, H., Cherry, J. M., et al. (2000). Gene ontology: tool for the unification of biology. The gene ontology consortium. Nat. Genet. 25, 25–29. doi: 10.1038/75556
Bang, Y. J., Van Cutsem, E., Feyereislova, A., Chung, H. C., Shen, L., Sawaki, A., et al. (2010). Trastuzumab in combination with chemotherapy versus chemotherapy alone for treatment of HER2-positive advanced gastric or gastro-oesophageal junction cancer (ToGA): a phase 3, open-label, randomised controlled trial. Lancet 376, 687–697. doi: 10.1016/S0140-6736(10)61121-X
Barretina, J., Caponigro, G., Stransky, N., Venkatesan, K., Margolin, A. A., Kim, S., et al. (2012). The cancer cell line encyclopedia enables predictive modelling of anticancer drug sensitivity. Nature 483, 603–607. doi: 10.1038/nature11003
Bester, A. C., Lee, J. D., Chavez, A., Lee, Y. R., Nachmani, D., Vora, S., et al. (2018). An integrated genome-wide CRISPRa approach to functionalize lncRNAs in drug resistance. Cell 173, 649–664 e620. doi: 10.1016/j.cell.2018.03.052
Cetin, B., Benekli, M., Turker, I., Koral, L., Ulas, A., Dane, F., et al. (2014). Lapatinib plus capecitabine for HER2-positive advanced breast cancer: a multicentre study of anatolian society of medical oncology (ASMO). J. Chemother. 26, 300–305. doi: 10.1179/1973947813Y.0000000147
D'Amato, V., Raimondo, L., Formisano, L., Giuliano, M., De Placido, S., Rosa, R., et al. (2015). Mechanisms of lapatinib resistance in HER2-driven breast cancer. Cancer Treat. Rev. 41, 877–883. doi: 10.1016/j.ctrv.2015.08.001
D'Aniello, C., Pisconti, S., Facchini, S., Imbimbo, C., and Cavaliere, C. (2018). Long noncoding RNA GIHCG is a potential diagnostic and prognostic biomarker and therapeutic target for renal cell carcinoma. Eur. Rev. Med. Pharmacol. Sci. 22, 1169–1170. doi: 10.26355/eurrev_201803_14452
Dong, H., Wang, W., Mo, S., Chen, R., Zou, K., Han, J., et al. (2018). SP1-induced lncRNA AGAP2-AS1 expression promotes chemoresistance of breast cancer by epigenetic regulation of MyD88. J. Exp. Clin. Cancer Res. 37:202. doi: 10.1186/s13046-018-0875-3
Geyer, C. E., Forster, J., Lindquist, D., Chan, S., Romieu, C. G., Pienkowski, T., et al. (2006). Lapatinib plus capecitabine for HER2-positive advanced breast cancer. N. Engl. J. Med. 355, 2733–2743. doi: 10.1056/NEJMoa064320
Hahne, J. C., and Valeri, N. (2018). Non-coding RNAs and resistance to anticancer drugs in gastrointestinal tumors. Front. Oncol. 8:226. doi: 10.3389/fonc.2018.00226
Hanzelmann, S., Castelo, R., and Guinney, J. (2013). GSVA: gene set variation analysis for microarray and RNA-seq data. BMC Bioinformatics 14:7. doi: 10.1186/1471-2105-14-7
Harrington, K., Temam, S., Mehanna, H., D'Cruz, A., Jain, M., D'Onofrio, I., et al. (2015). Postoperative adjuvant lapatinib and concurrent chemoradiotherapy followed by maintenance lapatinib monotherapy in high-risk patients with resected squamous cell carcinoma of the head and neck: a phase III, randomized, double-blind, placebo-controlled study. J. Clin. Oncol. 33, 4202–4209. doi: 10.1200/JCO.2015.61.4370
Hecht, J. R., Bang, Y. J., Qin, S. K., Chung, H. C., Xu, J. M., Park, J. O., et al. (2016). Lapatinib in combination with capecitabine plus oxaliplatin in human epidermal growth factor receptor 2-positive advanced or metastatic gastric, esophageal, or gastroesophageal adenocarcinoma: TRIO-013/LOGiC–a randomized phase III trial. J. Clin. Oncol. 34, 443–451. doi: 10.1200/JCO.2015.62.6598
Heery, R., Finn, S. P., Cuffe, S., and Gray, S. G. (2017). Long non-coding RNAs: key regulators of epithelial-mesenchymal transition, tumour drug resistance and cancer stem cells. Cancers 9:E38. doi: 10.3390/cancers9040038
Jiang, M., Huang, O., Xie, Z., Wu, S., Zhang, X., Shen, A., et al. (2014). A novel long non-coding RNA-ARA: adriamycin resistance-associated. Biochem. Pharmacol. 87, 254–283. doi: 10.1016/j.bcp.2013.10.020
Khan, I. A., Yoo, B. H., Masson, O., Baron, S., Corkery, D., Dellaire, G., et al. (2016). ErbB2-dependent downregulation of a pro-apoptotic protein Perp is required for oncogenic transformation of breast epithelial cells. Oncogene 35, 5759–5769. doi: 10.1038/onc.2016.109
Kim, B., Wang, S., Lee, J. M., Jeong, Y., Ahn, T., Son, D. S., et al. (2015). Synthetic lethal screening reveals FGFR as one of the combinatorial targets to overcome resistance to Met-targeted therapy. Oncogene 34, 1083–1093. doi: 10.1038/onc.2014.51
Li, C., Li, W., Zhang, Y., Zhang, X., Liu, T., Yang, Y., et al. (2018). Increased expression of antisense lncRNA SPINT1-AS1 predicts a poor prognosis in colorectal cancer and is negatively correlated with its sense transcript. OncoTargets Ther. 11, 3969–3978. doi: 10.2147/OTT.S163883
Li, D., Zhang, J., Wang, M., Li, X., Gong, H., Tang, H., et al. (2018). Activity dependent LoNA regulates translation by coordinating rRNA transcription and methylation. Nat. Commun. 9:1726. doi: 10.1038/s41467-018-04072-4
Li, W., Zhai, L., Wang, H., Liu, C., Zhang, J., Chen, W., et al. (2016). Downregulation of LncRNA GAS5 causes trastuzumab resistance in breast cancer. Oncotarget 7, 27778–27786. doi: 10.18632/oncotarget.8413
Liang, Y., Chen, X., Wu, Y., Li, J., Zhang, S., Wang, K., et al. (2018). LncRNA CASC9 promotes esophageal squamous cell carcinoma metastasis through upregulating LAMC2 expression by interacting with the CREB-binding protein. Cell Death Differ 25, 1980–1995. doi: 10.1038/s41418-018-0084-9
Lin, C. H., Jokela, T., Gray, J., and LaBarge, M. A. (2017). Combinatorial microenvironments impose a continuum of cellular responses to a single pathway-targeted anti-cancer compound. Cell Rep. 21, 533–545. doi: 10.1016/j.celrep.2017.09.058
Loibl, S., and Gianni, L. (2017). HER2-positive breast cancer. Lancet 389, 2415–2429. doi: 10.1016/S0140-6736(16)32417-5
Ma, L., Wang, Q., Gong, Z., Xue, L., and Zuo, Z. (2018). Long noncoding RNA GIHCG enhanced tongue squamous cell carcinoma progression through regulating miR-429. J. Cell. Biochem. 119, 9064–9071. doi: 10.1002/jcb.27164
Ma, P., Zhang, M., Nie, F., Huang, Z., He, J., Li, W., et al. (2017). Transcriptome analysis of EGFR tyrosine kinase inhibitors resistance associated long noncoding RNA in non-small cell lung cancer. Biomed. Pharmacother. 87, 20–26. doi: 10.1016/j.biopha.2016.12.079
Niknafs, Y. S., Han, S., Ma, T., Speers, C., Zhang, C., Wilder-Romans, K., et al. (2016). The lncRNA landscape of breast cancer reveals a role for DSCAM-AS1 in breast cancer progression. Nat. Commun. 7:12791. doi: 10.1038/ncomms12791
Pellat, A., Vaquero, J., and Fouassier, L. (2017). Role of ErbB/HER family of receptor tyrosine kinases in cholangiocyte biology. Hepatology 67, 762–773. doi: 10.1002/hep.29350
Peng, W. X., Koirala, P., and Mo, Y. Y. (2017). LncRNA-mediated regulation of cell signaling in cancer. Oncogene 36, 5661–5667. doi: 10.1038/onc.2017.184
Powles, T., Huddart, R. A., Elliott, T., Sarker, S. J., Ackerman, C., Jones, R., et al. (2017). Phase III, double-blind, randomized trial that compared maintenance lapatinib versus placebo after first-line chemotherapy in patients with human epidermal growth factor receptor 1/2-positive metastatic bladder cancer. J. Clin. Oncol. 35, 48–55. doi: 10.1200/JCO.2015.66.3468
Ritchie, M. E., Phipson, B., Wu, D., Hu, Y., Law, C. W., Shi, W., et al. (2015). limma powers differential expression analyses for RNA-sequencing and microarray studies. Nucleic Acids Res. 43:e47. doi: 10.1093/nar/gkv007
Roskoski, R. Jr. (2014). The ErbB/HER family of protein-tyrosine kinases and cancer. Pharmacol. Res. 79, 34–74. doi: 10.1016/j.phrs.2013.11.002
Rusnak, D. W., Alligood, K. J., Mullin, R. J., Spehar, G. M., Arenas-Elliott, C., Martin, A. M., et al. (2007). Assessment of epidermal growth factor receptor (EGFR, ErbB1) and HER2 (ErbB2) protein expression levels and response to lapatinib (Tykerb, GW572016) in an expanded panel of human normal and tumour cell lines. Cell Prolif. 40, 580–594. doi: 10.1111/j.1365-2184.2007.00455.x
Russell, M. R., Penikis, A., Oldridge, D. A., Alvarez-Dominguez, J. R., McDaniel, L., Diamond, M., et al. (2015). CASC15-S is a tumor suppressor lncRNA at the 6p22 neuroblastoma susceptibility locus. Cancer Res. 75, 3155–3166. doi: 10.1158/0008-5472.CAN-14-3613
Satoh, T., Xu, R. H., Chung, H. C., Sun, G. P., Doi, T., Xu, J. M., et al. (2014). Lapatinib plus paclitaxel versus paclitaxel alone in the second-line treatment of HER2-amplified advanced gastric cancer in Asian populations: TyTAN–a randomized, phase III study. J. Clin. Oncol. 32, 2039–2049. doi: 10.1200/JCO.2013.53.6136
Subramanian, A., Tamayo, P., Mootha, V. K., Mukherjee, S., Ebert, B. L., Gillette, M. A., et al. (2005). Gene set enrichment analysis: a knowledge-based approach for interpreting genome-wide expression profiles. Proc. Natl. Acad. Sci. U.S.A. 102, 15545–15550. doi: 10.1073/pnas.0506580102
Sui, C. J., Zhou, Y. M., Shen, W. F., Dai, B. H., Lu, J. J., Zhang, M. F., et al. (2016). Long noncoding RNA GIHCG promotes hepatocellular carcinoma progression through epigenetically regulating miR-200b/a/429. J. Mol. Med. 94, 1281–1296. doi: 10.1007/s00109-016-1442-z
Sun, Q., Tripathi, V., Yoon, J. H., Singh, D. K., Hao, Q., Min, K. W., et al. (2018). MIR100 host gene-encoded lncRNAs regulate cell cycle by modulating the interaction between HuR and its target mRNAs. Nucleic Acids Res. 46, 10405–10416. doi: 10.1093/nar/gky696
Tzanakakis, G., Kavasi, R. M., Voudouri, K., Berdiaki, A., Spyridaki, I., Tsatsakis, A., et al. (2018). Role of the extracellular matrix in cancer-associated epithelial to mesenchymal transition phenomenon. Dev. Dyn. 247, 368–381. doi: 10.1002/dvdy.24557
Wang, Q., Li, C., Tang, P., Ji, R., Chen, S., and Wen, J. (2018). A minimal lncRNA-mRNA signature predicts sensitivity to neoadjuvant chemotherapy in triple-negative breast cancer. Cell. Physiol. Biochem. 48, 2539–2548. doi: 10.1159/000492698
Watson, S. S., Dane, M., Chin, K., Tatarova, Z., Liu, M., Liby, T., et al. (2018). Microenvironment-mediated mechanisms of resistance to HER2 inhibitors differ between HER2+ breast cancer subtypes. Cell Syst. 6, 329–342 e326. doi: 10.1016/j.cels.2018.02.001
Wu, L., Pan, C., Wei, X., Shi, Y., Zheng, J., Lin, X., et al. (2018). lncRNA KRAL reverses 5-fluorouracil resistance in hepatocellular carcinoma cells by acting as a ceRNA against miR-141. Cell Commun. Signal. 16:47. doi: 10.1186/s12964-018-0260-z
Xiang, Z., Huang, X., Wang, J., Zhang, J., Ji, J., Yan, R., et al. (2018). Cross-database analysis reveals sensitive biomarkers for combined therapy for ERBB2+ gastric cancer. Front. Pharmacol. 9:861. doi: 10.3389/fphar.2018.00861
Zhang, G., Li, S., Lu, J., Ge, Y., Wang, Q., Ma, G., et al. (2018). LncRNA MT1JP functions as a ceRNA in regulating FBXW7 through competitively binding to miR-92a-3p in gastric cancer. Mol. Cancer 17:87. doi: 10.1186/s12943-018-0829-6
Zhang, L., Kang, W., Lu, X., Ma, S., Dong, L., and Zou, B. (2018). LncRNA CASC11 promoted gastric cancer cell proliferation, migration and invasion in vitro by regulating cell cycle pathway. Cell Cycle 17, 1886–1900. doi: 10.1080/15384101.2018.1502574
Keywords: pan-cancer, computational analysis, LncRNAs, lapatinib, targeted therapy
Citation: Xiang Z, Song S, Zhu Z, Sun W, Gifts JE, Sun S, Li QS, Yu Y and Li KK (2019) LncRNAs GIHCG and SPINT1-AS1 Are Crucial Factors for Pan-Cancer Cells Sensitivity to Lapatinib. Front. Genet. 10:25. doi: 10.3389/fgene.2019.00025
Received: 15 November 2018; Accepted: 16 January 2019;
Published: 19 February 2019.
Edited by:
Yujing Li, Emory University, United StatesReviewed by:
Feng Wang, Emory University School of Medicine, United StatesKesheng Wang, East Tennessee State University, United States
Haidong Huang, Cleveland Clinic, United States
Copyright © 2019 Xiang, Song, Zhu, Sun, Gifts, Sun, Li, Yu and Li. This is an open-access article distributed under the terms of the Creative Commons Attribution License (CC BY). The use, distribution or reproduction in other forums is permitted, provided the original author(s) and the copyright owner(s) are credited and that the original publication in this journal is cited, in accordance with accepted academic practice. No use, distribution or reproduction is permitted which does not comply with these terms.
*Correspondence: Wenhong Sun, MjAxODAwMUBneHUuZWR1LmNu
Yingyan Yu, eWluZ3lhbjN5QHNqdHUuZWR1LmNu
Keqin Kathy Li, a2xpQGVwaWdlbnRpYy51cw==
†These authors have contributed equally to this work