 Hongxiao Jiao1Yong Zang2Miaomiao Zhang2Yuan Zhang2Yaogang Wang3
 Kai Wang4,5*R. Arlen Price6*
 Wei-Dong Li2*
- 1Research Center of Basic Medical Sciences, Tianjin Medical University, Tianjin, China
- 2Department of Genetics, College of Basic Medical Sciences, Tianjin Medical University, Tianjin, China
- 3College of Public Health, Tianjin Medical University, Tianjin, China
- 4Raymond G. Perelman Center for Cellular and Molecular Therapeutics, Children’s Hospital of Philadelphia, Philadelphia, PA, United States
- 5Laboratory Medicine, Department of Pathology, University of Pennsylvania, Philadelphia, PA, United States
- 6Department of Psychiatry, Center for Neurobiology and Behavior, University of Pennsylvania Perelman School of Medicine, Philadelphia, PA, United States
Objective: We investigated gene interactions (epistasis) for body mass index (BMI) in a European-American adult female cohort via genome-wide interaction analyses (GWIA) and pathway association analyses.
Methods: Genome-wide pairwise interaction analyses were carried out for BMI in 493 extremely obese cases (BMI > 35 kg/m2) and 537 never-overweight controls (BMI < 25 kg/m2). To further validate the results, specific SNPs were selected based on the GWIA results for haplotype-based association studies. Pathway-based association analyses were performed using a modified Gene Set Enrichment Algorithm (GSEA) (GenGen program) to further explore BMI-related pathways using our genome wide association study (GWAS) data set, GIANT, ENGAGE, and DIAGRAM Consortia.
Results: The EXOC4-1q23.1 interaction was associated with BMI, with the most significant epistasis between rs7800006 and rs10797020 (P = 2.63 × 10⁻¹¹). In the pathway-based association analysis, Tob1 pathway showed the most significant association with BMI (empirical P < 0.001, FDR = 0.044, FWER = 0.040). These findings were further validated in different populations.
Conclusion: Genome-wide pairwise SNP-SNP interaction and pathway analyses suggest that EXOC4 and TOB1-related pathways may contribute to the development of obesity.
Introduction
Obesity is a worldwide epidemic associated with increased morbidity of chronic diseases, including diabetes, cardiovascular diseases, metabolic syndrome, and cancer. In 2015, 603.7 million adults and 107.7 million children were obese; furthermore, in many countries the incidence of obesity continues to rise, doubling since 1980 (Afshin et al., 2017). This in turn imposes an enormous burden on the public health system. Many studies have shown that 40–70% of inter-individual variability in obesity can be attributed to genetic factors (Zaitlen et al., 2013; Locke et al., 2015). Currently, large-scale genome-wide association studies (GWASs) and meta-analyses have successfully identified in excess of 75 loci associated with obesity (Fall and Ingelsson, 2014). Nevertheless, these genetic variability can explain only a minor fraction of obesity cases (Li et al., 2010; Speliotes et al., 2010). This is partly due to the existence of other mechanisms such as epigenetics, gene-environment, and gene-gene interactions, that influence the heritability of obesity (Gibson, 2010; Wang X. et al., 2010). Almost one-third of the genetic variance in the etiology of obesity were due to non-additive factors, according to the family, twin and adoption studies (Stunkard et al., 1986; Price, 1987; Sorensen et al., 1989; Stunkard et al., 1990).
SNP-SNP interactions are considered to be potential sources of the unexplained heritability of common diseases (Manolio et al., 2009). In research to date on the influence of interactions, most studies invariably selected loci based on biological knowledge and known associated loci, studies of genome-wide gene x gene interactions are rare. Speliotes et al. (2010) tested SNP-SNP interaction effects among 32 BMI-associated SNPs in their GWAS result, however, no significant results were obtained after multiple test corrections. Young et al. (2016) found the interaction rs11847697(PRKD1)-rs9939609 (FTO) associated with BMI via pairwise SNP × SNP interactions analysis based on 34 established BMI-related SNPs in European American adolescents. Ding et al. (2012) also examined Gene-Gene interactions for abdominal obesity in Chinese population. Nevertheless, these studies ignored genomic regions that were not individually associated but could contribute to disease development if combined.
Until now, following the traditional GWAS approach, genome-wide interaction analyses (GWIAs) were used to investigate SNP-SNP interactions. This method did not need the selection of candidate sites, but computational time was a very large barrier. With the advancement of computing technology, the major barrier has been overcome, and SNP-SNP interaction studies gradually focused on the whole genome level. Wei et al. (2012) performed GWIAs for BMI using multiple human populations, and found eight interactions that had a significant P-value in one or more cohorts. Their studies further demonstrated the GWIA is an effective approach to explain the genetic factor of BMI. SNP-SNP interactions have always been explained by mapping to gene-gene interactions, and genome-wide pathway-based association analysis will further support the interpretation of gene-gene interactions. “Pathway” means a gene set collected from the same biological or functional pathway. Pathway-based association analysis will measure the correlations between phenotypes and gene sets based on the whole genome. This approach can provide additional biological insights and allow one to explore new candidate genes (Wang K. et al., 2010).
Compared to association analysis, fewer studies have assessed potential gene-gene interactions in obesity, and the relatively high heritability of obesity still has not been completely explained. We explored genome-wide IBD (identical by descent) sharing in obese families using linkage with data derived from genome-wide genotyping data, observing an interaction between 2p25-p24 and 13q13-21 that may influence extreme obesity (Dong et al., 2005). In the present study, we sought to discover novel susceptibility loci through assessing interaction effects with BMI across the whole genome, and to determine how multiple genetic variants contribute to the development of obesity.
Materials and Methods
Subjects
One thousand and seventy-one (1071) unrelated European American adults were recruited, 1030 of which were females. In this study, we carried out our analyses only in females, comprising 493 extremely obese cases (BMI > 35 kg/m2) and 537 never over-weight controls (BMI < 25 kg/m2). The collection processes have been described in our previous report (Wang et al., 2011). All participants gave informed consent, and the investigation protocol was approved by the Committee on Studies Involving Human Beings at the University of Pennsylvania.
Genome-Wide Interaction Analysis
About 550,000 SNP markers were genotyped by Illumina HumanHap 550 SNP Arrays in our previous GWAS (Wang et al., 2011). PLINK 1.90 was used to perform GWIA for BMI. Due to the computational-demand, we used the “–fast-epistasis” command to screen for association. This test was based on a Z-score for the difference in SNP1-SNP2 association (odds ratio) between cases and controls by logistic regression, Z = [log(R)-log(S)]/sqrt[SE(R) + SE(S)], where R and S are the odds ratios in cases and controls, respectively (Purcell et al., 2007). We excluded SNPs of minor allele frequencies (MAF) < 5%. After frequency and genotyping pruning, 497174 SNPs were used to carry out interaction analyses. A total of 123,590,744,551 valid SNP-SNP tests were performed. We then selected the SNPs with interaction P < 1 × 10⁻⁸ (Bonferroni-corrected significant threshold P = 4.05 × 10⁻¹³) to analyze interactions by logistic regression based on allele dosage for each SNP.
Haplotype-Based Association Analysis
Eight hundred and thirty-one (831) SNP-SNP interactions showed P < 10-8 in the results of the SNP-SNP interaction tests based on Z-scores. In order to rule out the possibility of an accidental finding, we mapped these SNPs to genes, then excluded the SNP-SNP interactions by the following criteria: ① neither SNPs exist in genes; ② either of the two SNPs exist independently in a gene. Through the above exclusion criteria, the rs7800006(EXOC4)-rs10797020(1q23.1) interaction was the most significant (P = 2.63 × 10⁻¹¹), where there were 39 interactions with P < 10-8 between EXOC4 and 1q23.1. Five SNPs exist in the EXOC4 gene region and 9 SNPs exist in the 1q23.1 region, but their interaction P-value did not pass Bonferroni multiple tests. However, the Bonferroni correction test is highly conservative and would overcorrect for the non-independent SNPs, which fall within blocks of strong linkage disequilibrium (LD) (Duggal et al., 2008). Morris and Kaplan (2002) have reported that haplotype-based association analyses are more powerful than single allele-based methods when multiple disease-susceptibility mutations occur within the same gene. Epstein and Satten (2003) also have pointed out that haplotypes are useful during disease development due to the interaction of multiple cis-acting susceptibility variants located at the gene.
Therefore, in case of producing false negatives, we selected the 5 SNPs that exist in EXOC4 and the 9 SNPs that exist in 1q23.1, respectively, for the next haplotype-based association analysis, which were conducted by PLINK1.07. The haplotype windows were defined at two SNPs, three SNPs, and four SNPs.
Genome-Wide Pathway-Based Association Analysis
To further study the gene-gene interactions by pathway analysis, the GenGen program was used to analyze pathway-based association based on the modified Gene Set Enrichment Algorithm (GSEA) (Subramanian et al., 2005; Wang et al., 2007). The calculation steps have been outlined previously (Li et al., 2015). In this study, a total of 518230 SNPs passed the quality-control thresholds of minor allele frequencies > 0.01 and Hardy-Weinberg equilibrium > 0.001, which covered 17,438 genes, mapping SNPs to 20 kb upstream and downstream of each gene. A total of 1347 gene sets were selected from BioCarta, Kyoto Encyclopedia of Genes and Genomes (KEGG), and Gene Ontology (GO) databases, gene set sizes were between 5 and 200 genes.
Replication of the Pathway-Based Association Results
We further attempted to replicate the GenGen results in data sets from the GIANT (N = 339,224) (Locke et al., 2015), ENGAGE (N = 87,048) (Horikoshi et al., 2015), and DIAGRAM (N = 119,688) (Wood et al., 2016) consortia. Given that no phenotypes and genotypes were available online from the three consortia, GSA-SNP software (Nam et al., 2010) was carried out to perform the pathway associations analyses using the GWAS P-values. To better compare with GenGen analysis results, we obtained SNP specific P-values from GIANT, ENGAGE, and DIAGRAM GWASs, and the same SNPs identified by the GenGen analysis were selected for the pathway association analysis for BMI in the three consortium data sets.
As described above, the flow chart of experimental analysis was shown in Figure 1.
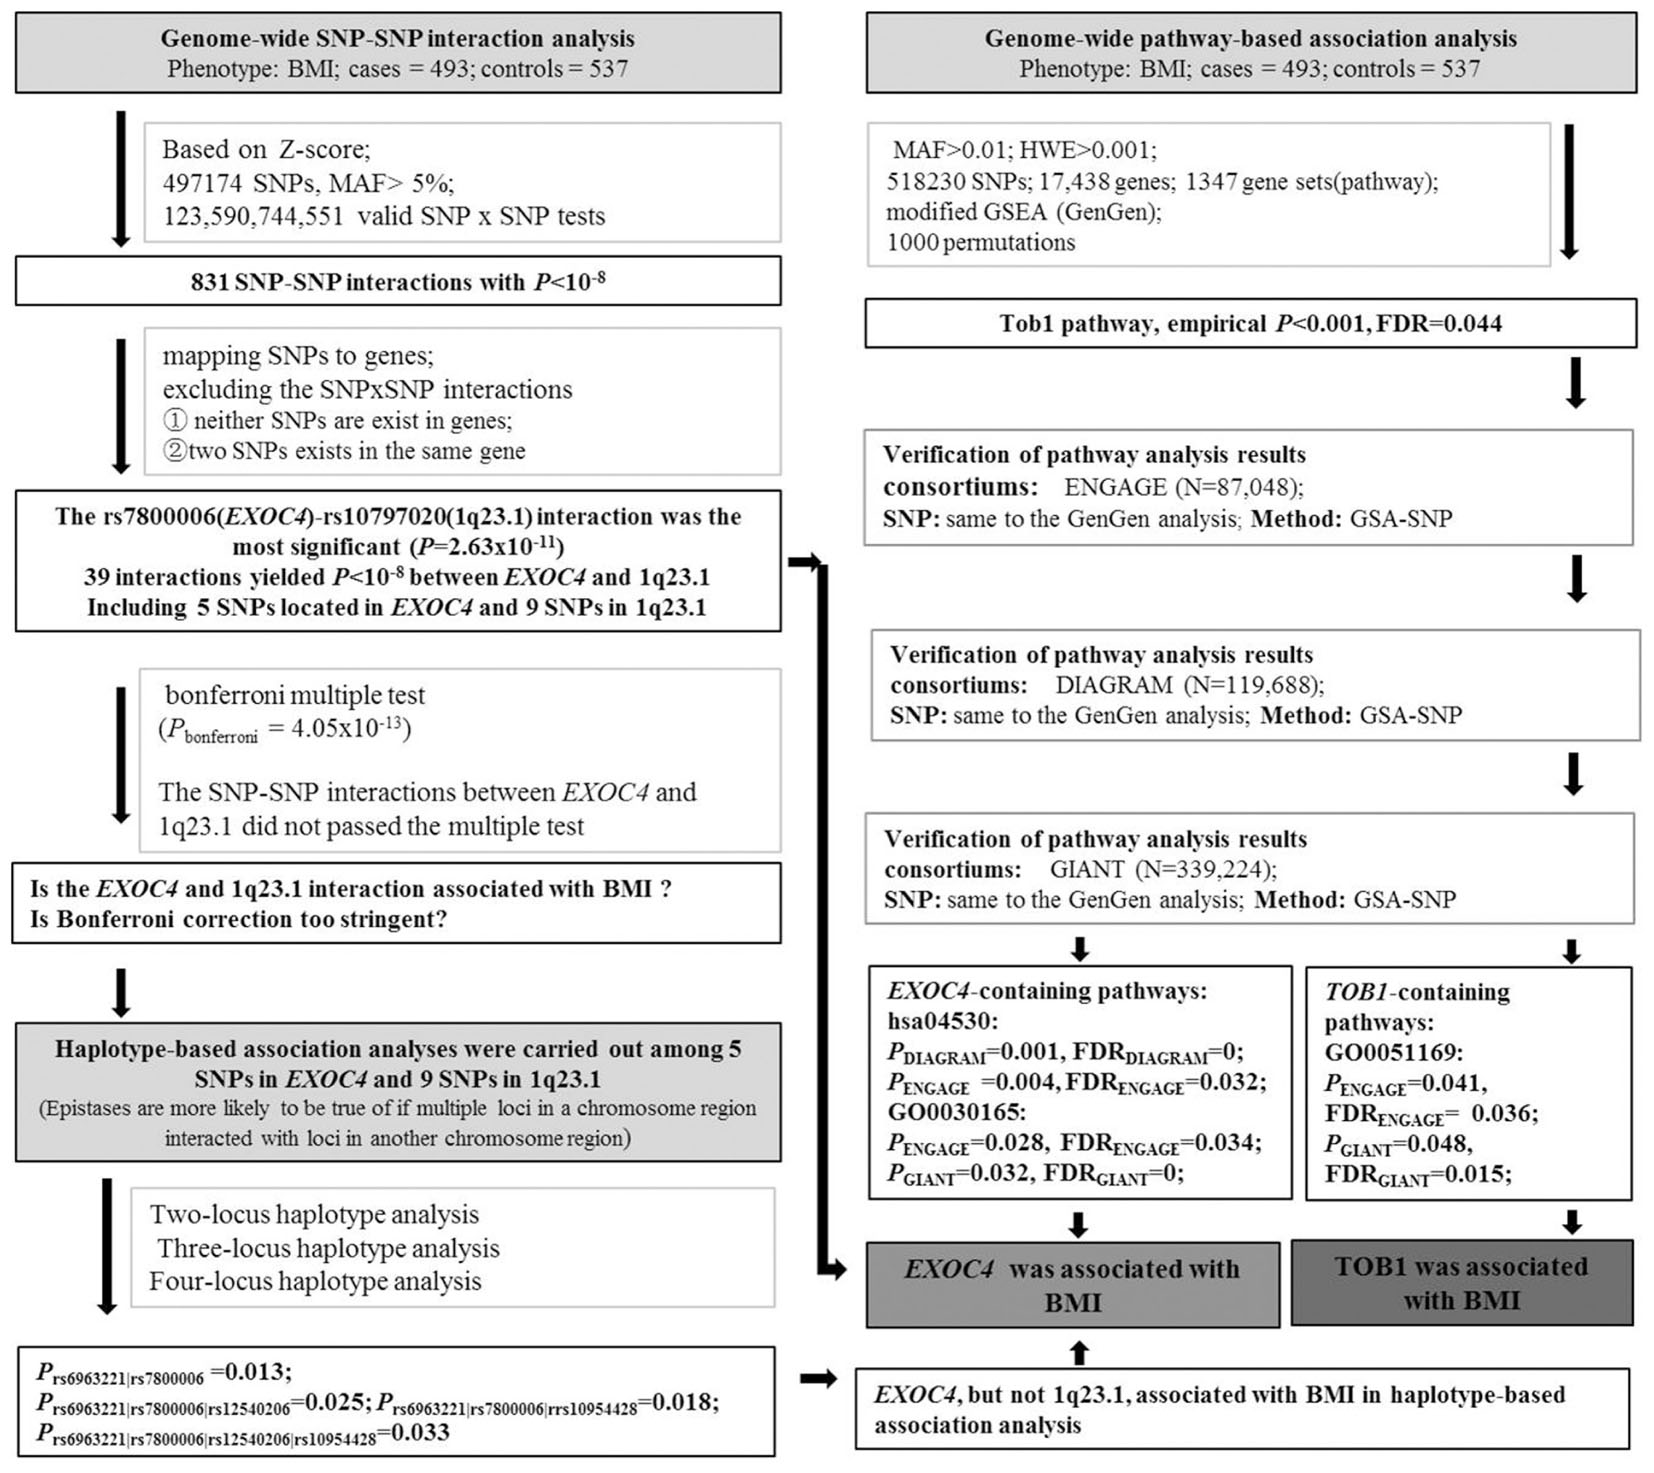
Figure 1. The flow chart of experimental analysis.
Results
The average age of the 1030 female subjects was 42.2 ± 9.0 years (range, 17–65 years). In our study, we defined BMI > 35 kg/m2 as “cases,” N = 493, and BMI < 25 kg/m2 as “controls,” N = 537 (Figure 2). Distributions of BMI in cases and controls are shown in Table 1.
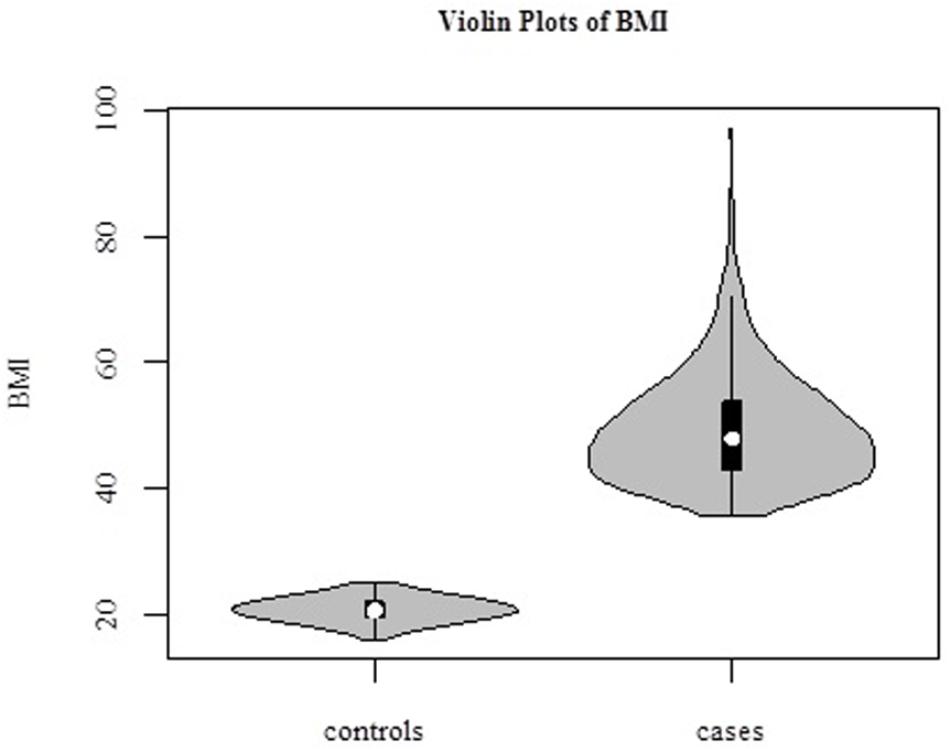
Figure 2. Violin plots of BMI in 1030 samples. Cases (BMI > 35 kg/m2, N = 493), and controls (BMI < 25 kg/m2, N = 537).

Table 1. BMI distributions in cases and controls.
Genome-Wide Interaction Analysis
GWIA based on Z-score of BMI determined 831 SNP-SNP interactions with P < 10-8, those with P < 1 × 10⁻⁹ were shown in Figure 3. To avoid errors caused by chance and rare genotypes, some interactions were excluded according to the exclusion criteria, which has been described in method. rs7800006(EXOC4)-rs10797020(1q23.1) interaction yielded the lowest P-value (P = 2.63 × 10⁻¹¹) after screening by exclusion criteria, but did not pass the threshold for multiple testing (P < 4.05 × 10⁻¹³). Fourteen SNPs resulted in 39 interactions that had P < 10-8 between EXOC4 and 1q23.1. Five SNPs (rs10954428, rs12540206, rs6963221, rs7800006, and rs6976491) were found in the EXOC4 gene region, while 9 SNPs (rs1578761, rs975118, rs10489833, rs10797020, rs11264997, rs7512592, rs6679056, rs1873511, and rs6697656) were found in 1q23.1among which the maximum distance is 70.4 kb (Table 2).
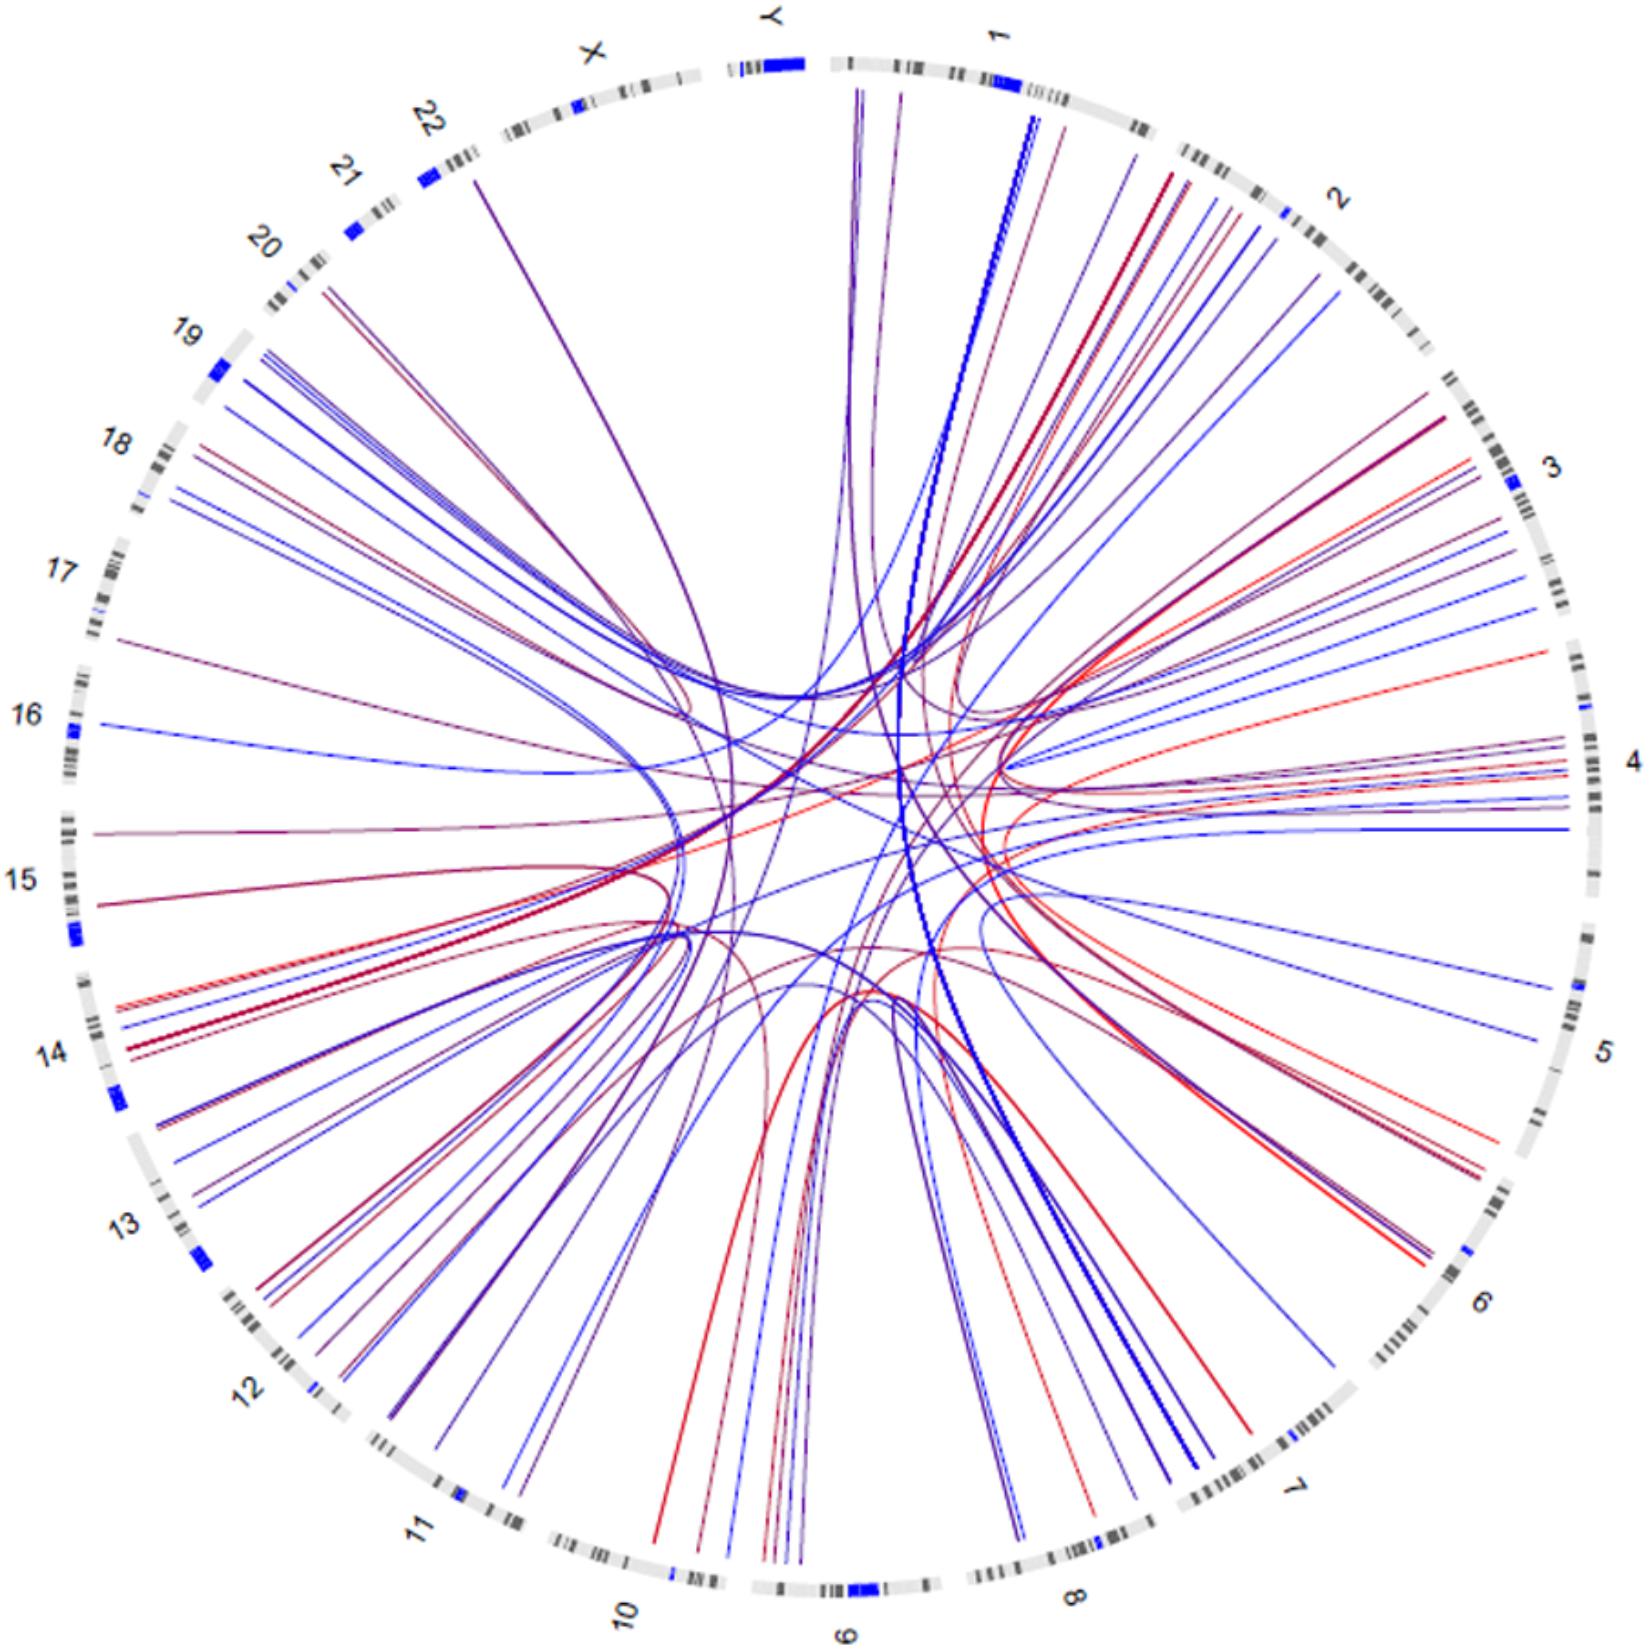
Figure 3. Circos visualization of mapped SNP-SNP interactions for BMI (P < 1 × 10⁻⁹). The curves represent the interactions between the two SNPs, and the color gradually changes from red to blue as the P-value decreases.
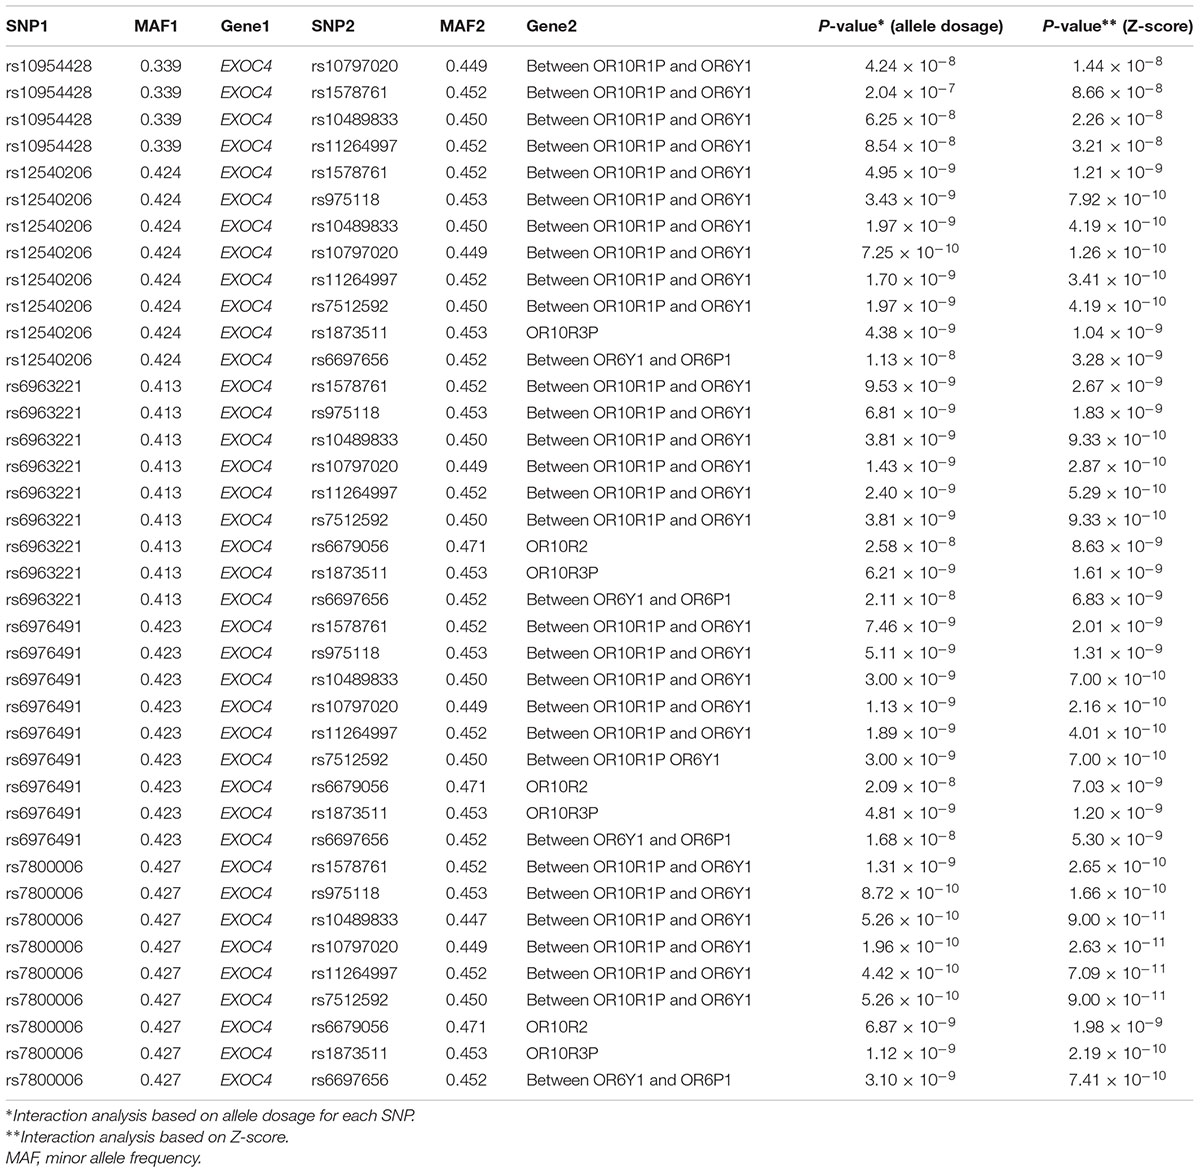
Table 2. Genotype interactions (epistasis) associated with BMI.
Haplotype-Based Association Analysis
Due to the highly conservative of Bonferroni correction test, false negatives were prone. We selected the above-mentioned 14 SNPs located in EXOC4 or 1q23.1 for haplotype-based association analyses. The SNPs showed LD in both EXOC4 (D’ > 0.94), and 1q23.1 (D’ > 0.99) (Supplement Figure 1). Two-locus haplotype analysis revealed that rs6963221| rs7800006 (A| C) was associated with BMI (P = 0.013). BMI was also influenced by three-locus haplotypes rs6963221| rs7800006| rs12540206 (A|C|date, fewer studies have examined T, P = 0.025), rs6963221| rs7800006| rs10954428 (A|C|G, P = 0.018) and the four-locus haplotype rs6963221| rs7800006| rs12540206| rs10954428 (A|C|T|G, P = 0.033) (Table 3). The four SNPs are in EXOC4, indicating that EXOC4 associated with BMI.

Table 3. Haplotype analysis of EXOC4 gene SNPs.
In the genome-wide pathway-based association study carried out with GenGen, 43 pathways achieved a significance of empirical P < 0.05 (Figure 4 and Supplement Table 1). The Tob1 pathway (role of Tob in T-cell activation) showed the most significant association with BMI (empirical P < 0.001, FDR = 0.044, FWER = 0.040, Table 4). Empirical P-values (denoted as “nominal P” values by the GenGen program) were calculated based on the 1000 phenotype permutations.
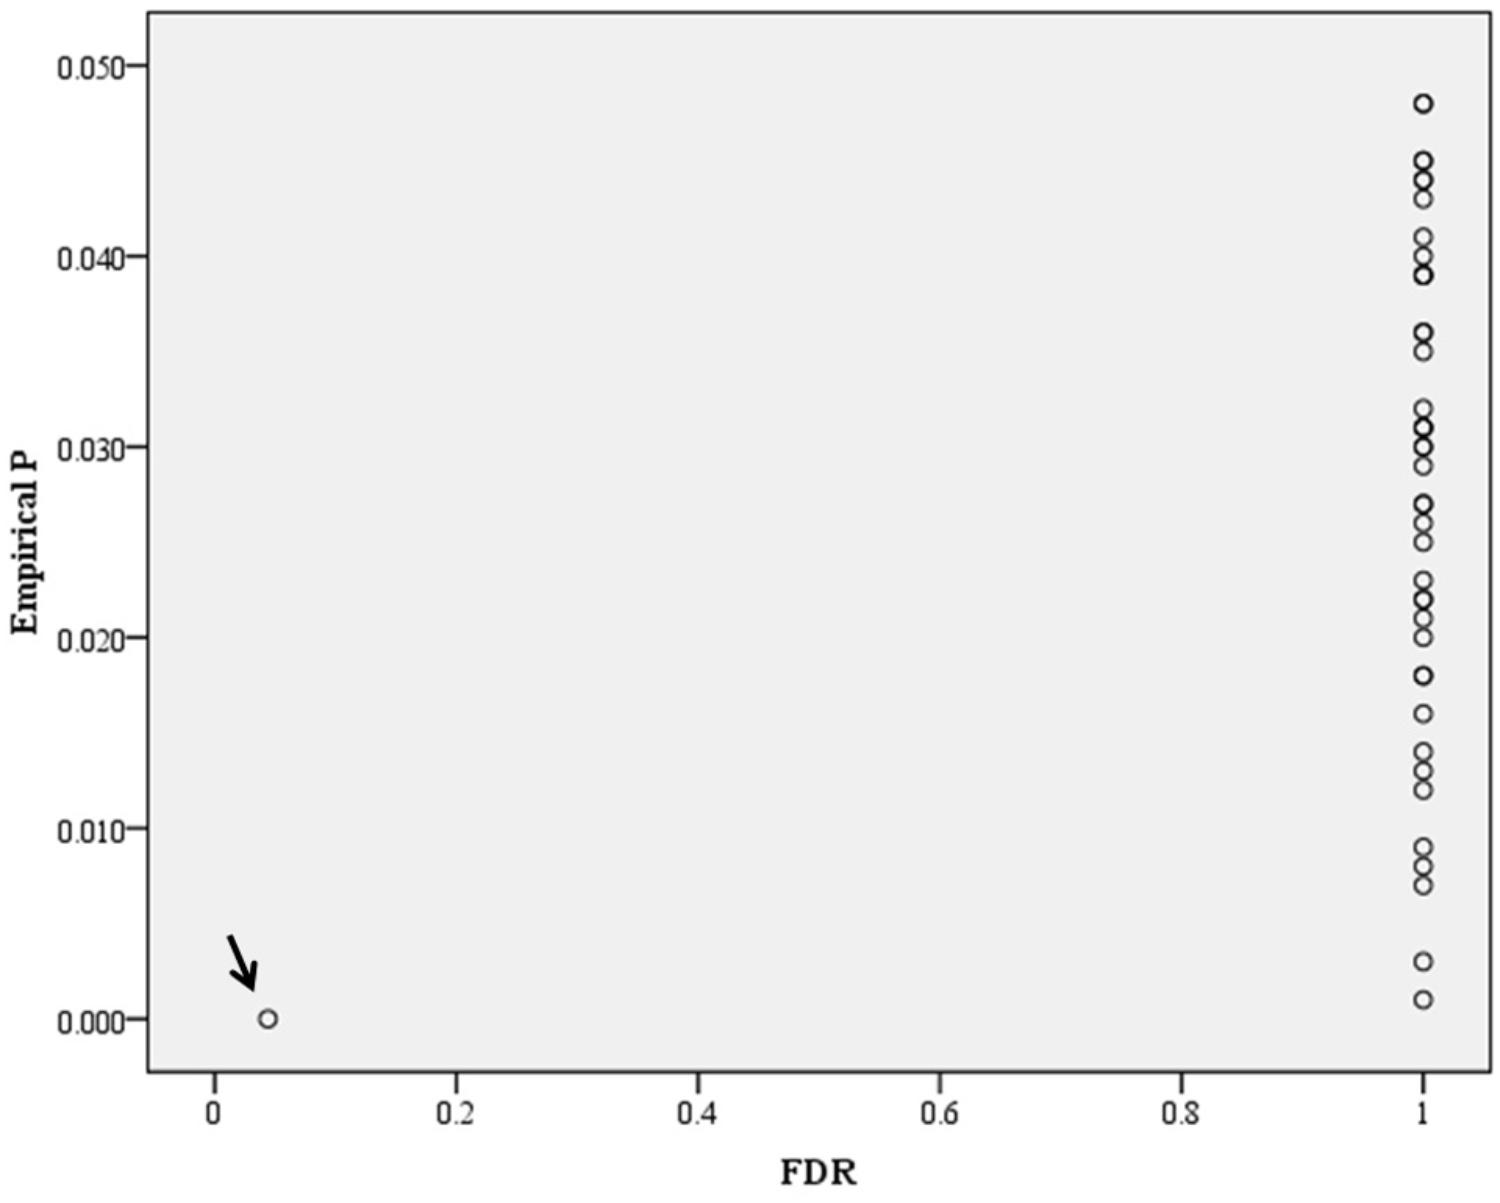
Figure 4. Distribution of empirical P-FDR for BMI. Empirical P-FDR for BMI- related pathways (empirical P < 0.05, denoted as “nominal” P-values in the GenGen program) obtained by modified GSEA (GenGen), Tob1 pathway is indicated by the arrow.
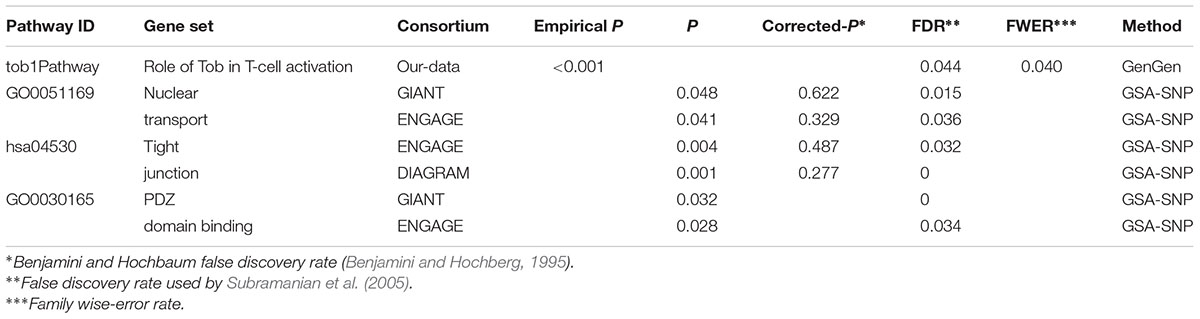
Table 4. Pathway-based association study for BMI.
Replication studies were conducted in data sets from the GIANT, ENGAGE, and DIAGRAM consortia by GSA-SNP. The Tob1 pathway did not have a significant P-value in these settings. However, the pathway GO0051169 (nuclear transport) containing TOB1 was associated with BMI in GIANT and ENGAGE consortia, and passed FDR correction for multiple testing (PGIANT = 0.048, FDRGIANT = 0.015; PENGAGE = 0.041, FDRENGAGE = 0.036, Table 4). The EXOC4-contained pathway hsa04530 was also associated with BMI in ENGAGE and DIAGRAM consortium data sets by GSA-SNP (Table 4). GO0030165 containing EXOC4 was also related to BMI in the GIANT and ENGAGE consortium data sets and passed FDR correction (Table 4).
Discussion
In the context of genetic epidemiology, although GWASs have found the majority of BMI-related genes identified to date, combined these loci explain only about 4% of the phenotypic variation of BMI (Loos, 2018). Modest and rare variants have been ignored by the GWASs, partly because of the other mechanisms, including epigenetics, gene-gene and gene-environment interactions, and statistical issues (Gibson, 2010; Wang X. et al., 2010; Chiefari et al., 2013, 2016; Lee et al., 2014). To date, fewer studies have examined the effects of interactions on obesity. Despite this, some obesity-related interactions still have been found, including PRKD1-FTO and WNT4-WNT5A (Wei et al., 2012; Young et al., 2016; Dong et al., 2017). Pathway-based analysis is an alternative approach to detect gene interactions. Liu et al. (2010) had found that the vasoactive intestinal peptide pathway was significantly correlated with BMI and fat mass, suggesting that this pathway plays an important role in the development of obesity. Our previous studies also revealed that the Rac1pathway was associated with the obesity-related phenotype plasma adiponectin (Li et al., 2015).
In the present study, our GWIA for BMI found an interaction between EXOC4 and 1q23.1 that may contribute to the development of obesity, although this interaction did not pass the Bonferroni correction test, they had the lowest interaction P-value (P = 4.05 × 10⁻¹³) after accidental exclusion. To further examine whether EXOC4 and 1q23.1 were related to BMI, we selected the SNPs locate in EXOC4 and 1q23.1 accordingly base on the results of GWIA to carry out haplotype-based association analyses, the results verified that EXOC4 contributed to BMI. In genome-wide pathway-based association studies, the relation between the TOB1 pathway and BMI was identified. EXOC4 and TOB1 associated with BMI were replicated in GIANT, ENGAGE, and DIAGRAM data sets. To our knowledge, these findings have not been identified having main effects in previous BMI-related studies.
EXOC4 (exocyst complex component 4, also known as SEC8) is a component of the exocyst complex involved in the targeting of exocytic vesicles, which participate in temporal and spatial regulation of exocytosis (Hsu et al., 1996; TerBush et al., 1996). Numerous research results show that exocysts interact directly or indirectly with many proteins including cell membranes, cytoskeletal, the small GTPases and other proteins in the cell cortex (Wu et al., 2008; Tanaka and Iino, 2015). Tanaka et al. indicated that EXOC4 modulates cell migration by controlling the ERK and p38 MAPK signaling pathways (Tanaka and Iino, 2015). They also found that EXOC4 can mediate cell migration and adhesion via controlling Smad3/4 expression through CBP (Tanaka et al., 2017).
EXOC4 is located in a widely replicated obesity linkage peak on chromosome 7q22-q36 (Feitosa et al., 2002; Li et al., 2003), and has been connected with various diseases, such as type 2 diabetes, cancer, and neuronal disorders. GLUT4 (glucose transporter 4) transports most of the glucose in muscle and adipose tissue; the docking and tethering of the GLUT4 vesicle to the plasma membrane is mediated via EXOC4 (Inoue et al., 2003; Inoue et al., 2006). A population genetic study also identified several type 2 diabetes-associated SNPs near EXOC4 in The NHLBI Family Heart Study (Laramie et al., 2008).
Nineteen genes are involved in BMI-related Tob1 pathway (role of Tob in T-cell activation): TOB1, TOB2, IFNG, IL2, IL2RA, IL4, SMAD3, SMAD4, TGFB1, TGFB2, TGFB3, TGFBR1, TGFBR2, TGFBR3, CD3D, CD3E, CD3G, CD247, and CD28. This pathway is a component of balanced functioning of the immune system. TOB1 represses T cell activation and is a member of a family of genes with anti-proliferative properties. Research has shown that TOB1 interacts with the TGF (transforming growth factor) and can stimulate transcription factors SMAD4 and SMAD2, increasing their binding to the IL-2 promoter and helping to repress IL-2 expression, suggesting that interference in TOB1 function be associated with autoimmune disease (Tzachanis et al., 2001; Tzachanis and Boussiotis, 2009; Gibson, 2010). Numerous studies have found a significant correlation between obesity and many autoimmune diseases, adipokines such as leptin, adiponectin and resistin may be key players in interactions among them (Versini et al., 2014).
TOB1and TOB2 belong to the TOB family of anti-proliferative proteins that have the potential to regulate cell growth. As a repressor of the p38/MAPK pathway, TOB1 can suppress p38/MAPK signaling by decreasing phosphorylation of p38 and ATF2 (Sun et al., 2013; Ng et al., 2017); p38/MAPK acts as an enhancer of adipogenesis contributes to obesity (Patel et al., 2003). The miR-32-TOB1-FGF21 pathway can regulate brown adipose tissue adipocyte function and development and is associated with obesity and metabolic syndrome (Ng et al., 2017). The biological functions mentioned above are consistent with our study results and provided evidence of a direct connection between TOB1 and obesity.
Traditional GWASs have identified many obesity-associated genes, however, additional loci have yet to be identified. EXOC4 and Tob1 pathway genes may be among these from our GWIA and genome-wide pathway-based association analysis.
EXOC4 join in the tight junction signal pathway: this pathway receives not only assembly signals but also transmit information (Zihni et al., 2014). Therefore, EXOC4 may play a role in signal transmission from sensory perception to the brain, thus affecting obesity. The Tob1 pathway may contribute to obesity through the MAPK pathway. Needless to say, molecular biological experiments are needed to repeat the results. For the GWASs, statistical replication is the golden rule to prevent false positives. Although our findings were replicated in different populations with different methods, it also needs to be confirmed in larger populations by GWIAs.
Ethics Statement
All participants gave informed consent, and the investigation protocol was approved by the Committee on Studies Involving Human Beings at the University of Pennsylvania.
Author Contributions
W-DL designed the study, researched data, and edited the manuscript. HJ researched data and wrote the manuscript. KW researched data and edited the manuscript. RP designed the study and contributed to the discussion. YoZ, MZ, and YuZ researched data. YW researched data and contributed to discussion. All authors have reviewed the manuscript.
Funding
This work was supported in part by National Key R&D Program of China (2017YFC1001900); Grant 91746205 from the National Natural Science Foundation of China; NIH Grants R01DK44073, R01DK56210, and R01DK076023 to RP; Scientist Development Grant (0630188N) from the American Heart Association, Grant 81070576 from the National Natural Science Foundation of China, and Grant 12JCZDJC24700 from Tianjin Municipal Science and Technology Commission to W-DL; and by Tianjin Medical University Grant 2016KYZQ08 to HJ. Genome-wide genotyping was funded in part by an Institutional Development Award to the Center for Applied Genomics (H.H.) from the Children’s Hospital of Philadelphia.
Conflict of Interest Statement
The authors declare that the research was conducted in the absence of any commercial or financial relationships that could be construed as a potential conflict of interest.
Acknowledgments
We thank all subjects who donated blood samples for genetic research purposes. We thank Dr. Struan Grant for his comments on the manuscript.
Supplementary Material
The Supplementary Material for this article can be found online at: https://www.frontiersin.org/articles/10.3389/fgene.2019.00404/full#supplementary-material
References
Afshin, A., Forouzanfar, M. H., Reitsma, M. B., Sur, P., Estep, K., Lee, A., et al. (2017). Health effects of overweight and obesity in 195 countries over 25 years. N. Engl. J. Med. 377, 13–27. doi: 10.1056/NEJMoa1614362
Benjamini, Y., and Hochberg, Y. (1995). Controlling the false discovery rate: a practical and powerful approach to multiple testing. J. R. Stat. Soc. B 57, 289–300. doi: 10.1111/j.2517-6161.1995.tb02031.x
Chiefari, E., Tanyolac, S., Iiritano, S., Sciacqua, A., Capula, C., Arcidiacono, B., et al. (2013). A polymorphism of HMGA1 is associated with increased risk of metabolic syndrome and related components. Sci. Rep. 3:1491. doi: 10.1038/srep01491
Chiefari, E., Ventura, V., Capula, C., Randazzo, G., Scorcia, V., Fedele, M., et al. (2016). A polymorphism of HMGA1 protects against proliferative diabetic retinopathy by impairing HMGA1-induced VEGFA expression. Sci. Rep. 6:39429. doi: 10.1038/srep39429
Ding, Y., Guo, Z. R., Wu, M., Chen, Q., Yu, H., and Luo, W. S. (2012). Gene-gene interaction between PPARdelta and PPARgamma is associated with abdominal obesity in a Chinese population. J. Genet. Genomics 39, 625–631. doi: 10.1016/j.jgg.2012.08.005
Dong, C., Li, W. D., Li, D., and Price, R. A. (2005). Interaction between obesity-susceptibility loci in chromosome regions 2p25-p24 and 13q13-q21. Eur. J. Hum. Genet. 13, 102–108. doi: 10.1038/sj.ejhg.5201292
Dong, S. S., Hu, W. X., Yang, T. L., Chen, X. F., Yan, H., Chen, X. D., et al. (2017). SNP-SNP interactions between WNT4 and WNT5A were associated with obesity related traits in Han Chinese Population. Sci. Rep. 7:43939. doi: 10.1038/srep43939
Duggal, P., Gillanders, E. M., Holmes, T. N., and Bailey-Wilson, J. E. (2008). Establishing an adjusted p-value threshold to control the family-wide type 1 error in genome wide association studies. BMC Genomics 9:516. doi: 10.1186/1471-2164-9-516
Epstein, M. P., and Satten, G. A. (2003). Inference on haplotype effects in case-control studies using unphased genotype data. Am. J. Hum. Genet. 73, 1316–1329. doi: 10.1086/380204
Fall, T., and Ingelsson, E. (2014). Genome-wide association studies of obesity and metabolic syndrome. Mol. Cell. Endocrinol. 382, 740–757. doi: 10.1016/j.mce.2012.08.018
Feitosa, M. F., Borecki, I. B., Rich, S. S., Arnett, D. K., Sholinsky, P., Myers, R. H., et al. (2002). Quantitative-trait loci influencing body-mass index reside on chromosomes 7 and 13: the national heart, lung, and blood institute family heart study. Am. J. Hum. Genet. 70, 72–82. doi: 10.1086/338144
Gibson, G. (2010). Hints of hidden heritability in GWAS. Nat. Genet. 42, 558–560. doi: 10.1038/ng0710-558
Horikoshi, M., Mgi, R., van de Bunt, M., Surakka, I., Sarin, A. P., Mahajan, A., et al. (2015). Discovery and fine-mapping of glycaemic and obesity-related trait loci using high-density imputation. PLoS Genet. 11:e1005230. doi: 10.1371/journal.pgen.1005230
Hsu, S. C., Ting, A. E., Hazuka, C. D., Davanger, S., Kenny, J. W., Kee, Y., et al. (1996). The mammalian brain rsec6/8 complex. Neuron 17, 1209–1219. doi: 10.1016/s0896-6273(00)80251-2
Inoue, M., Chang, L., Hwang, J., Chiang, S. H., and Saltiel, A. R. (2003). The exocyst complex is required for targeting of Glut4 to the plasma membrane by insulin. Nature 422, 629–633. doi: 10.1038/nature01533
Inoue, M., Chiang, S. H., Chang, L., Chen, X. W., and Saltiel, A. R. (2006). Compartmentalization of the exocyst complex in lipid rafts controls Glut4 vesicle tethering. Mol. Biol. Cell 17, 2303–2311. doi: 10.1091/mbc.e06-01-0030
Laramie, J. M., Wilk, J. B., Williamson, S. L., Nagle, M. W., Latourelle, J. C., Tobin, J. E., et al. (2008). Polymorphisms near EXOC4 and LRGUK on chromosome 7q32 are associated with Type 2 Diabetes and fasting glucose; the NHLBI Family Heart Study. BMC Med. Genet. 9:46. doi: 10.1186/1471-2350-9-46
Lee, S., Abecasis, G. R., Boehnke, M., and Lin, X. (2014). Rare-variant association analysis: study designs and statistical tests. Am. J. Hum. Genet. 95, 5–23. doi: 10.1016/j.ajhg.2014.06.009
Li, S., Zhao, J. H., Luan, J., Luben, R. N., Rodwell, S. A., Khaw, K. T., et al. (2010). Cumulative effects and predictive value of common obesity-susceptibility variants identified by genome-wide association studies. Am. J. Clin. Nutr. 91, 184–190. doi: 10.3945/ajcn.2009.28403
Li, W. D., Jiao, H., Wang, K., Yang, F., Grant, S. F., Hakonarson, H., et al. (2015). Pathway-based genome-wide association studies reveal that the Rac1 pathway is associated with plasma adiponectin levels. Sci. Rep. 5:13422. doi: 10.1038/srep13422
Li, W. D., Li, D., Wang, S., Zhang, S., Zhao, H., and Price, R. A. (2003). Linkage and linkage disequilibrium mapping of genes influencing human obesity in chromosome region 7q22.1-7q35. Diabetes 52, 1557–1561. doi: 10.2337/diabetes.52.6.1557
Liu, Y. J., Guo, Y. F., Zhang, L. S., Pei, Y. F., Yu, N., Yu, P., et al. (2010). Biological pathway-based genome-wide association analysis identified the vasoactive intestinal peptide (VIP) pathway important for obesity. Obesity 18, 2339–2346. doi: 10.1038/oby.2010.83
Locke, A. E., Kahali, B., Berndt, S. I., Justice, A. E., Pers, T. H., Day, F. R., et al. (2015). Genetic studies of body mass index yield new insights for obesity biology. Nature 518, 197–206. doi: 10.1038/nature14177
Loos, R. J. (2018). The genetics of adiposity. Curr. Opin. Genet. Dev. 50, 86–95. doi: 10.1016/j.gde.2018.02.009
Manolio, T. A., Collins, F. S., Cox, N. J., Goldstein, D. B., Hindorff, L. A., Hunter, D. J., et al. (2009). Finding the missing heritability of complex diseases. Nature 461, 747–753. doi: 10.1038/nature08494
Morris, R. W., and Kaplan, N. L. (2002). On the advantage of haplotype analysis in the presence of multiple disease susceptibility alleles. Genet. Epidemiol. 23, 221–233. doi: 10.1002/gepi.10200
Nam, D., Kim, J., Kim, S. Y., and Kim, S. (2010). GSA-SNP: a general approach for gene set analysis of polymorphisms. Nucleic Acids Res. 38, W749–W754. doi: 10.1093/nar/gkq428
Ng, R., Hussain, N. A., Zhang, Q., Chang, C., Li, H., Fu, Y., et al. (2017). miRNA-32 Drives brown fat thermogenesis and trans-activates subcutaneous white fat browning in mice. Cell Rep. 19, 1229–1246. doi: 10.1016/j.celrep.2017.04.035
Patel, N. G., Holder, J. C., Smith, S. A., Kumar, S., and Eggo, M. C. (2003). Differential regulation of lipogenesis and leptin production by independent signaling pathways and rosiglitazone during human adipocyte differentiation. Diabetes 52, 43–50. doi: 10.2337/diabetes.52.1.43
Purcell, S., Neale, B., Todd-Brown, K., Thomas, L., Ferreira, M. A., Bender, D., et al. (2007). PLINK: a tool set for whole-genome association and population-based linkage analyses. Am. J. Hum. Genet. 81, 559–575. doi: 10.1086/519795
Sorensen, T. I., Price, R. A., Stunkard, A. J., and Schulsinger, F. (1989). Genetics of obesity in adult adoptees and their biological siblings. BMJ 298, 87–90. doi: 10.1136/bmj.298.6666.87
Speliotes, E. K., Willer, C. J., Berndt, S. I., Monda, K. L., Thorleifsson, G., Jackson, A. U., et al. (2010). Association analyses of 249,796 individuals reveal 18 new loci associated with body mass index. Nat. Genet. 42, 937–948. doi: 10.1038/ng.686
Stunkard, A. J., Harris, J. R., Pedersen, N. L., and McClearn, G. E. (1990). The body-mass index of twins who have been reared apart. N. Engl. J. Med. 322, 1483–1487. doi: 10.1056/NEJM199005243222102
Stunkard, A. J., Sorensen, T. I., Hanis, C., Teasdale, T. W., Chakraborty, R., Schull, W. J., et al. (1986). An adoption study of human obesity. N. Engl. J. Med. 314, 193–198. doi: 10.1056/NEJM198601233140401
Subramanian, A., Tamayo, P., Mootha, V. K., Mukherjee, S., Ebert, B. L., Gillette, M. A., et al. (2005). Gene set enrichment analysis: a knowledge-based approach for interpreting genome-wide expression profiles. Proc. Natl. Acad. Sci. U.S.A. 102, 15545–15550. doi: 10.1073/pnas.0506580102
Sun, K. K., Zhong, N., Yang, Y., Zhao, L., and Jiao, Y. (2013). Enhanced radiosensitivity of NSCLC cells by transducer of erbB2.1 (TOB1) through modulation of the MAPK/ERK pathway. Oncol. Rep. 29, 2385–2391. doi: 10.3892/or.2013.2403
Tanaka, T., Goto, K., and Iino, M. (2017). Sec8 modulates TGF-beta induced EMT by controlling N-cadherin via regulation of Smad3/4. Cell Signal. 29, 115–126. doi: 10.1016/j.cellsig.2016.10.007
Tanaka, T., and Iino, M. (2015). Sec8 regulates cytokeratin8 phosphorylation and cell migration by controlling the ERK and p38 MAPK signalling pathways. Cell Signal. 27, 1110–1119. doi: 10.1016/j.cellsig.2015.02.015
TerBush, D. R., Maurice, T., Roth, D., and Novick, P. (1996). The exocyst is a multiprotein complex required for exocytosis in Saccharomyces cerevisiae. EMBO J. 15, 6483–6494. doi: 10.1002/j.1460-2075.1996.tb01039.x
Tzachanis, D., and Boussiotis, V. A. (2009). Tob, a member of the APRO family, regulates immunological quiescence and tumor suppression. Cell Cycle 8, 1019–1025. doi: 10.4161/cc.8.7.8033
Tzachanis, D., Freeman, G. J., Hirano, N., van Puijenbroek, A. A., Delfs, M. W., Berezovskaya, A., et al. (2001). Tob is a negative regulator of activation that is expressed in anergic and quiescent T cells. Nat. Immunol. 2, 1174–1182. doi: 10.1038/ni730
Versini, M., Jeandel, P. Y., Rosenthal, E., and Shoenfeld, Y. (2014). Obesity in autoimmune diseases: not a passive bystander. Autoimmun. Rev. 13, 981–1000. doi: 10.1016/j.autrev.2014.07.001
Wang, K., Li, M., and Bucan, M. (2007). Pathway-based approaches for analysis of genomewide association studies. Am. J. Hum. Genet. 81, 1278–1283. doi: 10.1086/522374
Wang, K., Li, M., and Hakonarson, H. (2010). Analysing biological pathways in genome-wide association studies. Nat. Rev. Genet. 11, 843–854. doi: 10.1038/nrg2884
Wang, K., Li, W. D., Zhang, C. K., Wang, Z., Glessner, J. T., Grant, S. F., et al. (2011). A genome-wide association study on obesity and obesity-related traits. PLoS One 6:e18939. doi: 10.1371/journal.pone.0018939
Wang, X., Elston, R. C., and Zhu, X. (2010). The meaning of interaction. Hum. Hered. 70, 269–277. doi: 10.1159/000321967
Wei, W. H., Hemani, G., Gyenesei, A., Vitart, V., Navarro, P., Hayward, C., et al. (2012). Genome-wide analysis of epistasis in body mass index using multiple human populations. Eur. J. Hum. Genet. 20, 857–862. doi: 10.1038/ejhg.2012.17
Wood, A. R., Tyrrell, J., Beaumont, R., Jones, S. E., Tuke, M. A., Ruth, K. S., et al. (2016). Variants in the FTO and CDKAL1 loci have recessive effects on risk of obesity and type 2 diabetes, respectively. Diabetologia 59, 1214–1221. doi: 10.1007/s00125-016-3908-5
Wu, H., Rossi, G., and Brennwald, P. (2008). The ghost in the machine: small GTPases as spatial regulators of exocytosis. Trends Cell Biol. 18, 397–404. doi: 10.1016/j.tcb.2008.06.007
Young, K. L., Graff, M., North, K. E., Richardson, A. S., Bradfield, J. P., Grant, S. F., et al. (2016). Influence of SNP∗SNP interaction on BMI in european american adolescents: findings from the national longitudinal study of adolescent health. Pediatr. Obes. 11, 95–101. doi: 10.1111/ijpo.12026
Zaitlen, N., Kraft, P., Patterson, N., Pasaniuc, B., Bhatia, G., Pollack, S., et al. (2013). Using extended genealogy to estimate components of heritability for 23 quantitative and dichotomous traits. PLoS Genet. 9:e1003520. doi: 10.1371/journal.pgen.1003520
Keywords: epistasis, obesity, genome wide, pathway associations, EXOC4, TOB1
Citation: Jiao H, Zang Y, Zhang M, Zhang Y, Wang Y, Wang K, Price RA and Li W-D (2019) Genome-Wide Interaction and Pathway Association Studies for Body Mass Index. Front. Genet. 10:404. doi: 10.3389/fgene.2019.00404
Received: 17 November 2018; Accepted: 12 April 2019;
Published: 01 May 2019.
Edited by:
Antonio Brunetti, Università degli Studi Magna Græcia di Catanzaro, ItalyReviewed by:
Guoqiang Gu, Vanderbilt University, United StatesGaia Chiara Mannino, Università degli Studi Magna Græcia di Catanzaro, Italy
Copyright © 2019 Jiao, Zang, Zhang, Zhang, Wang, Wang, Price and Li. This is an open-access article distributed under the terms of the Creative Commons Attribution License (CC BY). The use, distribution or reproduction in other forums is permitted, provided the original author(s) and the copyright owner(s) are credited and that the original publication in this journal is cited, in accordance with accepted academic practice. No use, distribution or reproduction is permitted which does not comply with these terms.
*Correspondence: Kai Wang, d2FuZ2tAZW1haWwuY2hvcC5lZHU= R. Arlen Price, YXJsZW5AZXhjaGFuZ2UudXBlbm4uZWR1 Wei-Dong Li, bGl3ZWlkb25nOThAdGlqbXUuZWR1LmNu