 Hao Lv
 Fu-Ying Dao1
 Yong Zhang
 Wei Chen
 Hao Lin
- 1Key Laboratory for Neuro-Information of Ministry of Education, School of Life Science and Technology, Center for Informational Biology, University of Electronic Science and Technology of China, Chengdu, China
- 2Innovative Institute of Chinese Medicine and Pharmacy, Chengdu University of Traditional Chinese Medicine, Chengdu, China
DNA N6-methyladenine (6mA) is a dominant DNA modification form and involved in many biological functions. The accurate genome-wide identification of 6mA sites may increase understanding of its biological functions. Experimental methods for 6mA detection in eukaryotes genome are laborious and expensive. Therefore, it is necessary to develop computational methods to identify 6mA sites on a genomic scale, especially for plant genomes. Based on this consideration, the study aims to develop a machine learning-based method of predicting 6mA sites in the rice genome. We initially used mono-nucleotide binary encoding to formulate positive and negative samples. Subsequently, the machine learning algorithm named Random Forest was utilized to perform the classification for identifying 6mA sites. Our proposed method could produce an area under the receiver operating characteristic curve of 0.964 with an overall accuracy of 0.917, as indicated by the fivefold cross-validation test. Furthermore, an independent dataset was established to assess the generalization ability of our method. Finally, an area under the receiver operating characteristic curve of 0.981 was obtained, suggesting that the proposed method had good performance of predicting 6mA sites in the rice genome. For the convenience of retrieving 6mA sites, on the basis of the computational method, we built a freely accessible web server named iDNA6mA-Rice at http://lin-group.cn/server/iDNA6mA-Rice.
Introduction
Methylated bases, such as N4-methylcytosine (4mC), N6-methyladenine (6mA), and 5-methylcytosine (5mC), exist in genomic DNA of diverse species (Cheng, 1995; Ratel et al., 2006). All these DNA methylation modifications play important roles in controlling many biological functions (Tang et al., 2018b). As an epigenetic mechanism, DNA methylation refers to a process that methyl groups are transferred to DNA molecules and is essential in the normal development of organisms (Bergman and Cedar, 2013; Smith and Meissner, 2013; von Meyenn et al., 2016). Through DNA methylation, the activity of a DNA segment can be changed without changing its sequence. For example, gene transcription can be repressed when DNA methylation occurs at its promoter (Bird, 1992).
As shown in Figure 1, after a methyl group is transferred to the sixth position of adenine ring, under the catalysis action of methyltransferases, 6mA is formed. 6mA is a noncanonical DNA modification form in different eukaryotes at low levels (Fu et al., 2015; Greer et al., 2015; Zhang et al., 2015; Koziol et al., 2016; Liu et al., 2016; Mondo et al., 2017; Wang et al., 2017). 6mA in prokaryotes and eukaryotes shows similar characteristics (Heyn and Esteller, 2015). It has diverse functions, including guiding the discrimination of an original DNA strand from a newly synthesized DNA strand (Wion and Casadesus, 2006), regulating gene transcription (Cheng et al., 2016), repressing transposable elements, and reducing the stability of base pairings (Fang et al., 2012). Surprisingly, the methylation protection is an inheritable state, although it may be changed by environmental factors (Wion and Casadesus, 2006). Therefore, it is worth underscoring the importance of 6mA throughout generations.
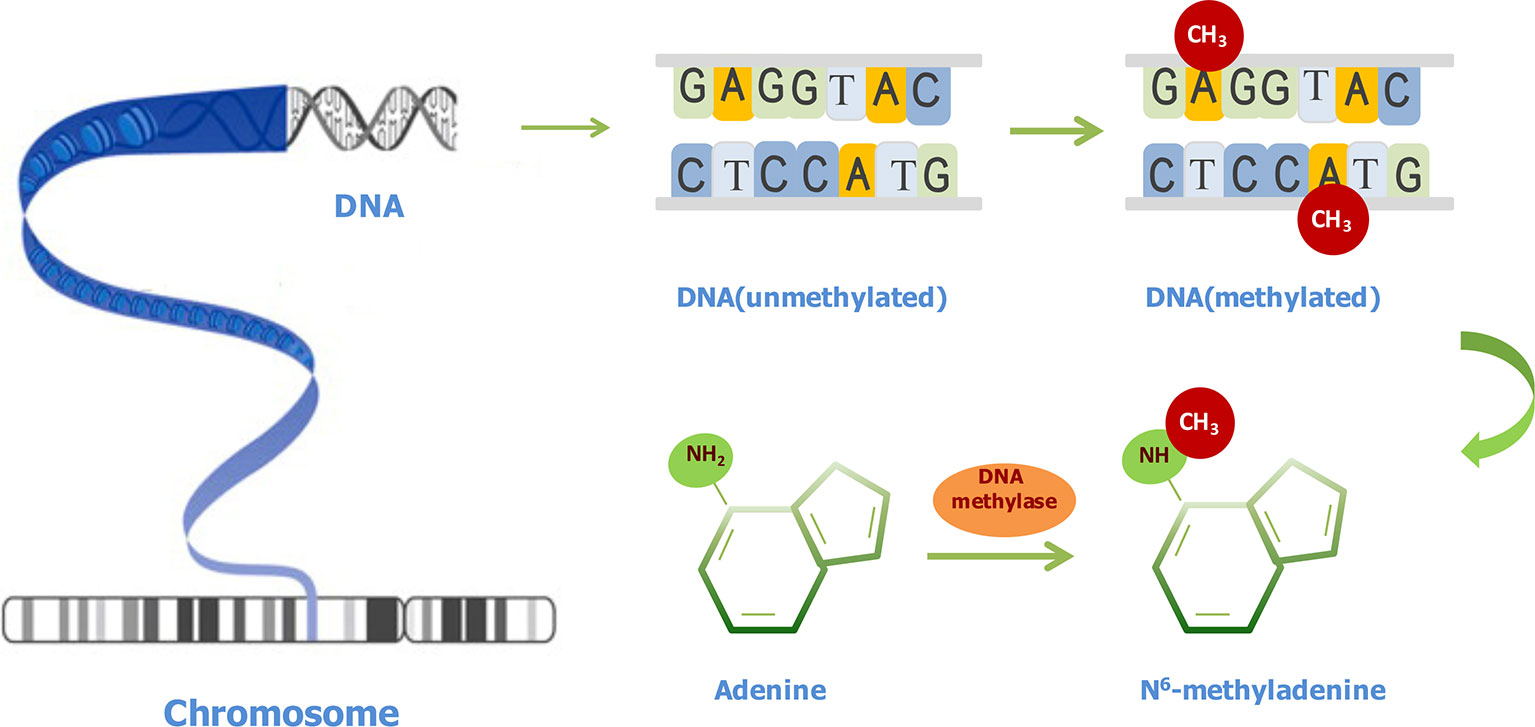
Figure 1 Illustration of N6-methyladenine (6mA) modifications in DNA. The conversion of adenine to 6mA is mediated by methyl-transferases.
Recent studies revealed the genome-wide distributions of 6mA in Tetrahymena (Wang et al., 2017), Chlamydomonas reinhardtii (Fu et al., 2015), Drosophila melanogaster (Zhang et al., 2015), Caenorhabditis elegans (Greer et al., 2015), vertebrates (e.g. frog and fish) (Koziol et al., 2016; Liu et al., 2016), mammals (e.g., human and Mus. musculus) (Wu et al., 2016; Yao et al., 2017; Xiao et al., 2018; Zou et al., 2018a), fungi (Mondo et al., 2017), and vascular plants (e.g. rice) (Zhou et al., 2018). Although these studies testified the presence of 6mA in eukaryotic genomes based on experimental means and indeed achieved encouraging results, the implication of 6mA in epigenetics is still obscure (Ratel et al., 2006). In addition, in eukaryotes, the level of 6mA was so low that it could only be detected by advanced techniques. In rice, with two antibodies, based on SMRT and IP-seq, Zhou et al. (2018) found that AGG-rich sequences were the most significantly enriched for 6mA. Thus, the computational prediction of 6mA sites may be a good choice to reduce experimental costs and guide the experimental study on plant 6mA.
In fact, several computational methods have been applied in the identification of DNA methylation sites. Based on the data of experimentally confirmed 4mC sites,Chen et al. (2017) firstly developed a predictor called iDNA4mC to identify 4mC sites, in which DNA samples were formulated with nucleotide frequency and nucleotide chemical property. Then, based on the dataset (Chen et al., 2017), He et al. (2018a) established another tool named 4mCPred, and Wei et al. (2018b) built a new predictor (4mcPred-SVM) to predict 4mC sites. Recently, a free tool called iDNA6mA-PseKNC was constructed for the computational prediction of 6mA sites (Feng et al., 2019). The tool could be used to identify 6mA sites in Mus. musculus genome. However, the tool could not provide valuable data contained in plant genomes due to the difference between mammal and plant genomes. Thus, it is necessary to develop a 6mA site predictor for plant genomes. Recently, a tool named i6mA-Pred was constructed to identify 6mA site in rice (Chen et al., 2019). The tool could realize the area under the receiver operating characteristic curve (auROC) of 0.886 in jackknife cross-validation. However, the database used was not large enough, and the accuracy should be further improved.
In view of the aforementioned descriptions, this study aims to develop a new method and establish an efficient tool to identify 6mA sites in the rice genome. A flowchart is shown in Figure 2. We firstly collected the existing data in the rice genome, including experimentally confirmed non-6mA sequences and 6mA sequences and built a benchmark dataset based on the report by Zhou et al. (2018). Subsequently, three kinds of sequence encoding features were proposed to formulate samples as the input of the Random Forest algorithm (RF) to discriminate 6mA sequences from non-6mA sequences. Then, several experiments were performed to investigate the prediction capability of the proposed method. Finally, on the basis of the method, we established a predictor called iDNA6mA-Rice.
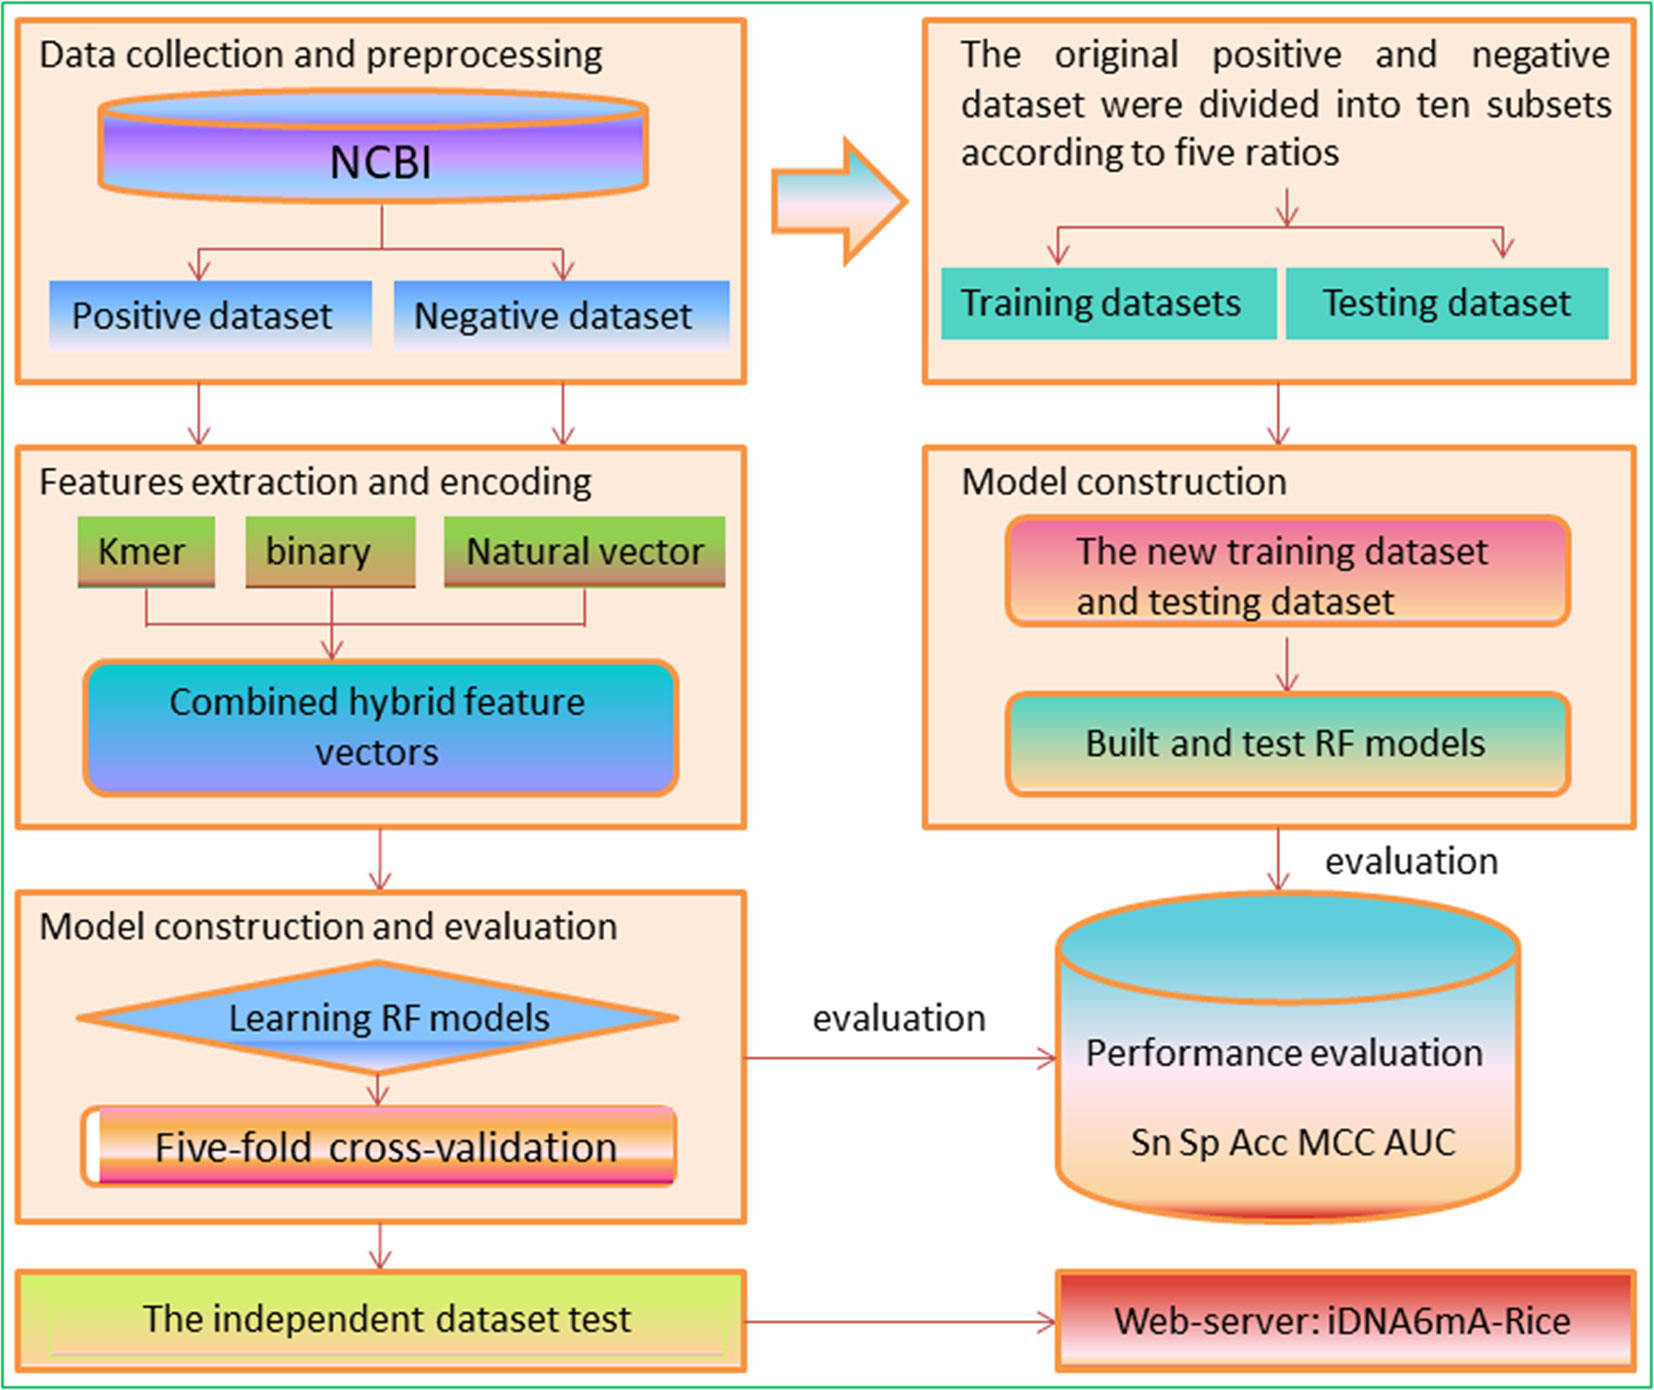
Figure 2 A flowchart used in this study.
Materials and Methods
Benchmark Dataset
A benchmark dataset is important in building a reliable prediction model. By combining immunoprecipitation with single-molecular real-time sequencing approach, 6mA sites in the rice genome had been detected (Zhou et al., 2018) and deposited in Gene Expression Omnibus (GEO) database, which was created and is maintained by the National Center for Biotechnology Information (NCBI) (Long et al., 2019). Therefore, a total of 265,290 6mA sites containing sequences were obtained from GEO. All of these sequences in GEO are 41 nt long with the 6mA site at the center. To reduce homologous bias and avoid redundancy (Dao et al., 2018; Su et al., 2018; Tang et al., 2018a; Zou et al., 2018b; Feng et al., 2019), sequences with the similarity above 80% were excluded by using the CD-HIT program (Li and Godzik, 2006). Finally, we obtained 154,000 6mA sites-contained sequences as positive samples.
Negative samples were collected from NCBI (https://www.ncbi.nlm.nih.gov/genome/10) and according to the following three rules. Firstly, the 41-nt long sequences with adenine at the center were selected. Secondly, experimental results proved that the centered adenine was not methylated. Thirdly, Zhou et al. (2018) believed that 6mA most frequently occurred at GAGG, AGG, and AG motifs, so we statistically analyzed the ratios of GAGG, AGG, and AG motifs in positive samples and reported the result in Table 1. Based on the result in Table 1, we selected the negative samples with the same ratio of motifs so that the negative data were more objective. In this way, a large number of negative samples were obtained. In machine learning processes, imbalanced datasets lead to unreliable results. To balance positive and negative samples, 154,000 non-modified segments were randomly picked out as negative samples in model training. Finally, the benchmark dataset contained 154,000 positive samples and 154,000 negative samples. The benchmark dataset S is formulated as:
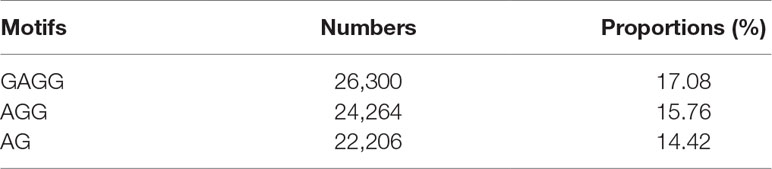
Table 1 Details of the three motifs in positive samples.
where the S+contains 154,000 positive samples; the S− contains 154,000 negative samples; is the symbol of “union” in the set theory. The benchmark dataset is available at http://lin-group.cn/server/iDNA6mA-Rice.
Feature Descriptions
Feature extraction is a key step in establishing an excellent predictor (Song et al., 2012; Zuo et al., 2017; Stephenson et al., 2018; Manavalan et al., 2018a; Wei et al., 2018a; Manavalan et al., 2018b; Song et al., 2018b; Song et al., 2018c). The following three feature extraction techniques were adopted to formulate 6mA samples.
K-tuple Nucleotide Frequency Component
As a special form of PseKNC (Guo et al., 2014; Lin et al., 2014), the K-tuple nucleotide frequency component has been widely used in a variety of bioinformatics problems (Lin and Li, 2011; Yang et al., 2018b).
A DNA sequence D can be expressed as:
where Ri represents the nucleotide [Adenine (A), Thymine (T), Cytosine (C), and Guanine (G)] at the ith position; L is the length of sequence D and equals to 41 in this study. The strategy of k-tuple composition is to convert each sample into a 4k dimension vector expressed as:
where T represents the transposition of the vector and represents the frequency of the ith k-tuple composition in the DNA sequence sample. The feature has been applied in DNA element identification (Wei et al., 2018b). Here, we set k = 2, 3, 4.
Mono-Nucleotide Binary Encoding
The second feature technique is to transfer nucleotide into a binary code formulated as:
Thus, an arbitrary DNA sequence with L nucleotides can be described as a vector of 4 × L features (Song et al., 2018a; Wei et al., 2018b).
Natural Vector
In the natural vector method proposed by Deng et al. (2011), sequences are represented as points in high-dimensional space based on statistical characteristics (Liu et al., 2018). With the sequence data, such as occurrence frequencies, the central moments, and average positions of nucleotides, the natural vector method is used to describe the distributions and numbers of nucleotides, cluster sequences, and predict their various attributes.
Based on Eq. (3), each nucleotide R can be defined as follows:
where WR (Ri) = 1 if Di = R and WR (Di) = 0, otherwise
where nR represents the number of nucleotide R in the DNA sequence D:
where S[R][i] represents the distance from the first nucleotide to the ith nucleotide R.
where TR represents the total distance of each set of the four nucleotides.
where μR represents the mean position of the nucleotide R.
Finally, the second-order normalized central moments can be defined as:
Then, the natural vector of sequence D is expressed as (Tian et al., 2018):
Random Forest Algorithm
The RF algorithm has been extensively applied in computational biology (Zhao et al., 2014; Zhang et al., 2016; Lv et al., 2019), since it is a flexible and practical machine learning method and can deal with many input variables without variable deletion and provide an internal unbiased estimate of the generalization error. According to the principle of RF, many trees are randomly generated with the recursive partitioning approach, and then, the results are aggregated according to voting rules. In this study, the number of trees is set to 100 with the seed of 1. The details of RF had been described by Breiman (2001).
Performance Evaluation
Cross-validation test is a statistical analysis method for assessing a classifier. For the purpose of saving computation time, the fivefold cross-validation test was performed to assess the method proposed in this study. We used four metrics [Matthew’s correlation coefficient (MCC), sensitivity (Sn), overall accuracy (Acc), and specificity (Sp)] to measure the predictive capability of our model (Zuo et al., 2014; Zou et al., 2016; Manavalan and Lee, 2017; Manavalan et al., 2017; Cao et al., 2017a; Cao et al., 2017b; Cheng et al., 2018a; Yang et al., 2018a; Zhu et al., 2019).
where N+ and N− are, respectively, the numbers of 6mA sites and non-6mA sites in benchmark dataset; indicates the number of the 6mA sites recognized as non-6mA sites; and indicates the number of the wrongly predicted non-6mA sites. Sn and Sp represent the ability of a model to correctly identify 6mA sites and non-6mA sites, respectively. The value of Acc indicates the overall accuracy of our model distinguishing 6mA sites from non-6mA sites. MCC indicates the performance of our model based on real and predicted values. When , meaning that none of the 6mA sites in the dataset S+ and none of the non-6mA sites in the dataset S− was mispredicted, we have MCC = 1; when and , we have MCC = 0, meaning no better than random prediction; when and we have MCC = -1, meaning total disagreement between prediction and observation.
In addition to the analysis based on the previously discussed indicators, the ROC curves (Metz, 1989; Chen et al., 2016; Dao et al., 2018; Feng et al., 2018; Lai et al., 2019; Tan et al., 2019) were plotted, and then, the area under the receiver operating characteristic curve (AUC) was calculated to objectively evaluate our proposed model.
Results and Discussion
Sequence Analysis
To investigate the nucleotide distribution around the 21st site (6mA or non 6mA) in positive and negative samples, the pLogo (O’Shea et al., 2013) was plotted to analyze the statistical difference of nucleotide occurrence between two kinds of samples. The 6mA samples were dramatically different from non-6mA samples in terms of nucleotide compositions (Figure 3). The nucleotide composition bias regions existed in the ranges from -8 to +10 sites and from +15 to +18 downstream of the 6mA site. Unlike the distribution in the non-6mA samples, a consensus motif of AAAA was observed in the upstream of the 6mA site. These results suggested that it was feasible to construct a machine learning model for identifying 6mA sites with extracted sequence features.
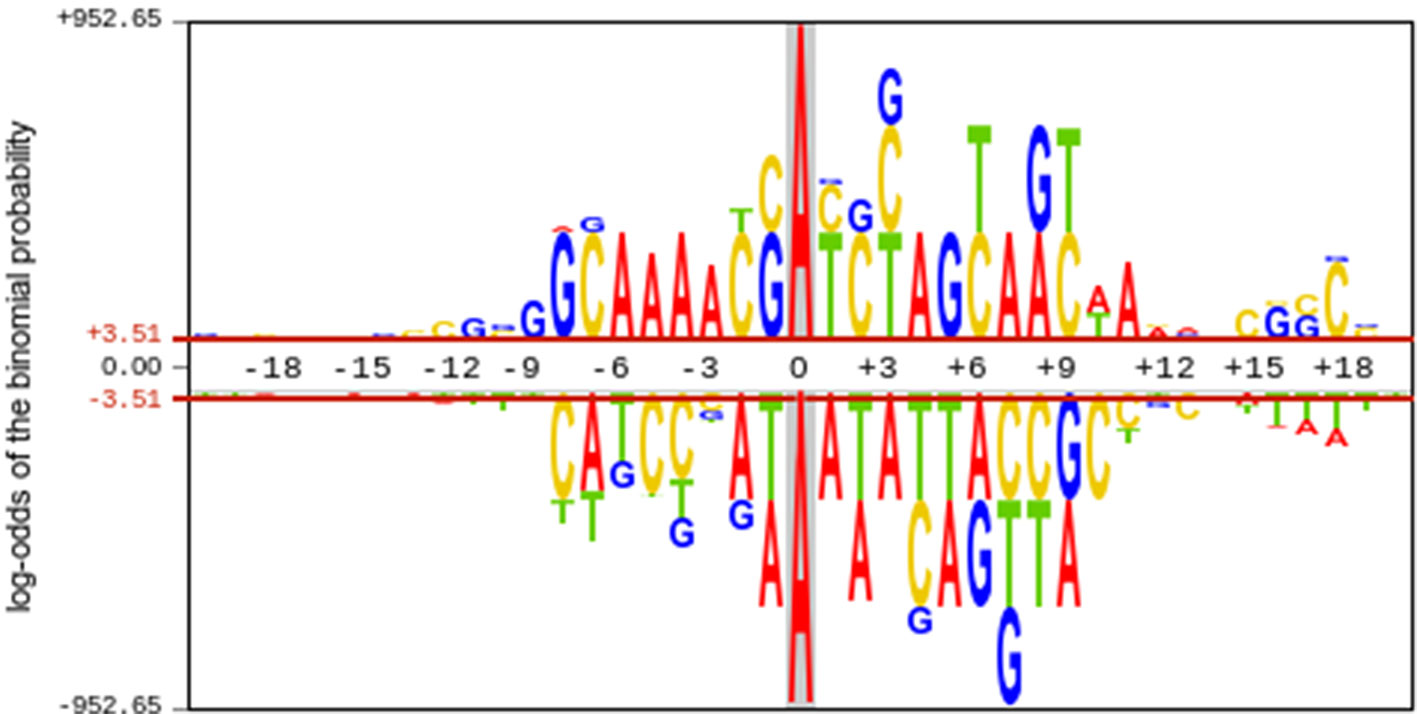
Figure 3 Nucleotide distribution preferences around 6mA and non-6mA sites. The upper half of the x-axis indicates the nucleotide distribution in 6mA site containing sequence, whereas the lower half of the x-axis indicates the nucleotide distribution in non-6mA site containing sequences.
Performance Evaluation on Different Features
The prediction performances of three features [K-tuple nucleotide frequency component (KNFC), mono-nucleotide binary encoding (MNBE), and natural vector (NV)] and their combinations were firstly explored with RF. Accordingly, we built four computational models and evaluated them through the fivefold cross-validation test. The prediction results are provided in Figure 4 and Table 2. It was found that MNBE could produce the best prediction performance among all features, indicating that it was the best descriptor for 6mA samples.
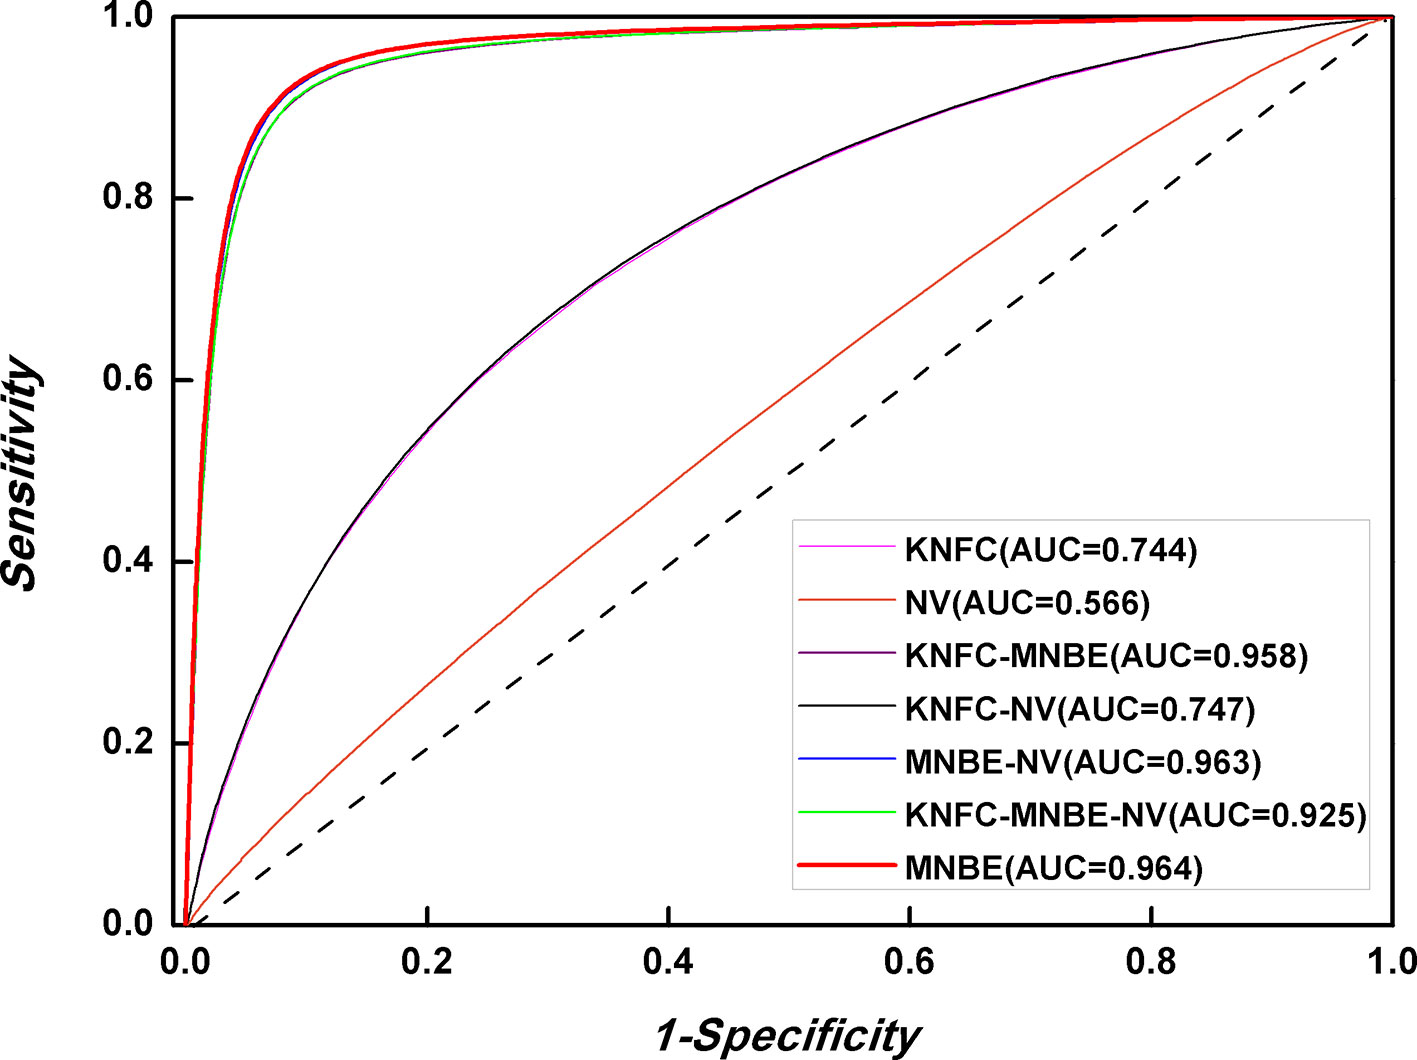
Figure 4 Performance evaluation based on three features and their combinations.

Table 2 Predictive performances of KNFC, MNBE, and NV.
KNFC is a commonly used feature extractor technique and has been successfully applied in DNA regulatory element prediction. However, the results in Table 2 showed that the accuracy of KNFC was only 68.3%, which was far from satisfactory. For the 41-nt long 6mA samples, KNFC is a high-dimension vector (16 + 64 + 256), which is so large that many elements in feature vector are zero. Although high-dimension features contain more information, more noise and redundant information are also included, thus decreasing the discrimination capability. Therefore, KNFC is not suitable for 6mA identification. In fact, the NV is the worst descriptor among all features in this study, since it can only obtain the overall accuracy of 54.3%, which almost equals the accuracy of random guess. The reason for the poor performance of NV in 6mA prediction is that NV contains too few features to capture enough sequence information of 6mA and non-6mA samples.
For the combinations of different features, if MNBE was included, the prediction performances are always good. However, they are still not higher than those obtained with MNBE alone. Thus, subsequent studies were based on MNBE.
Performance Evaluation of Different Algorithms
It is natural to ask whether other classification is better than RF in 6mA identification. Thus, we investigated the discriminant capabilities of three algorithms, namely, Naïve Bayes, Bayes Net, and Logistic Regression, with the benchmark dataset through fivefold cross-validation. All algorithms were implemented in WEKA (Frank et al., 2004). The ROC curves were plotted (Figure 5). It is obvious that RF is the best one for 6mA prediction among four algorithms. Thus, the final model was built with RF.
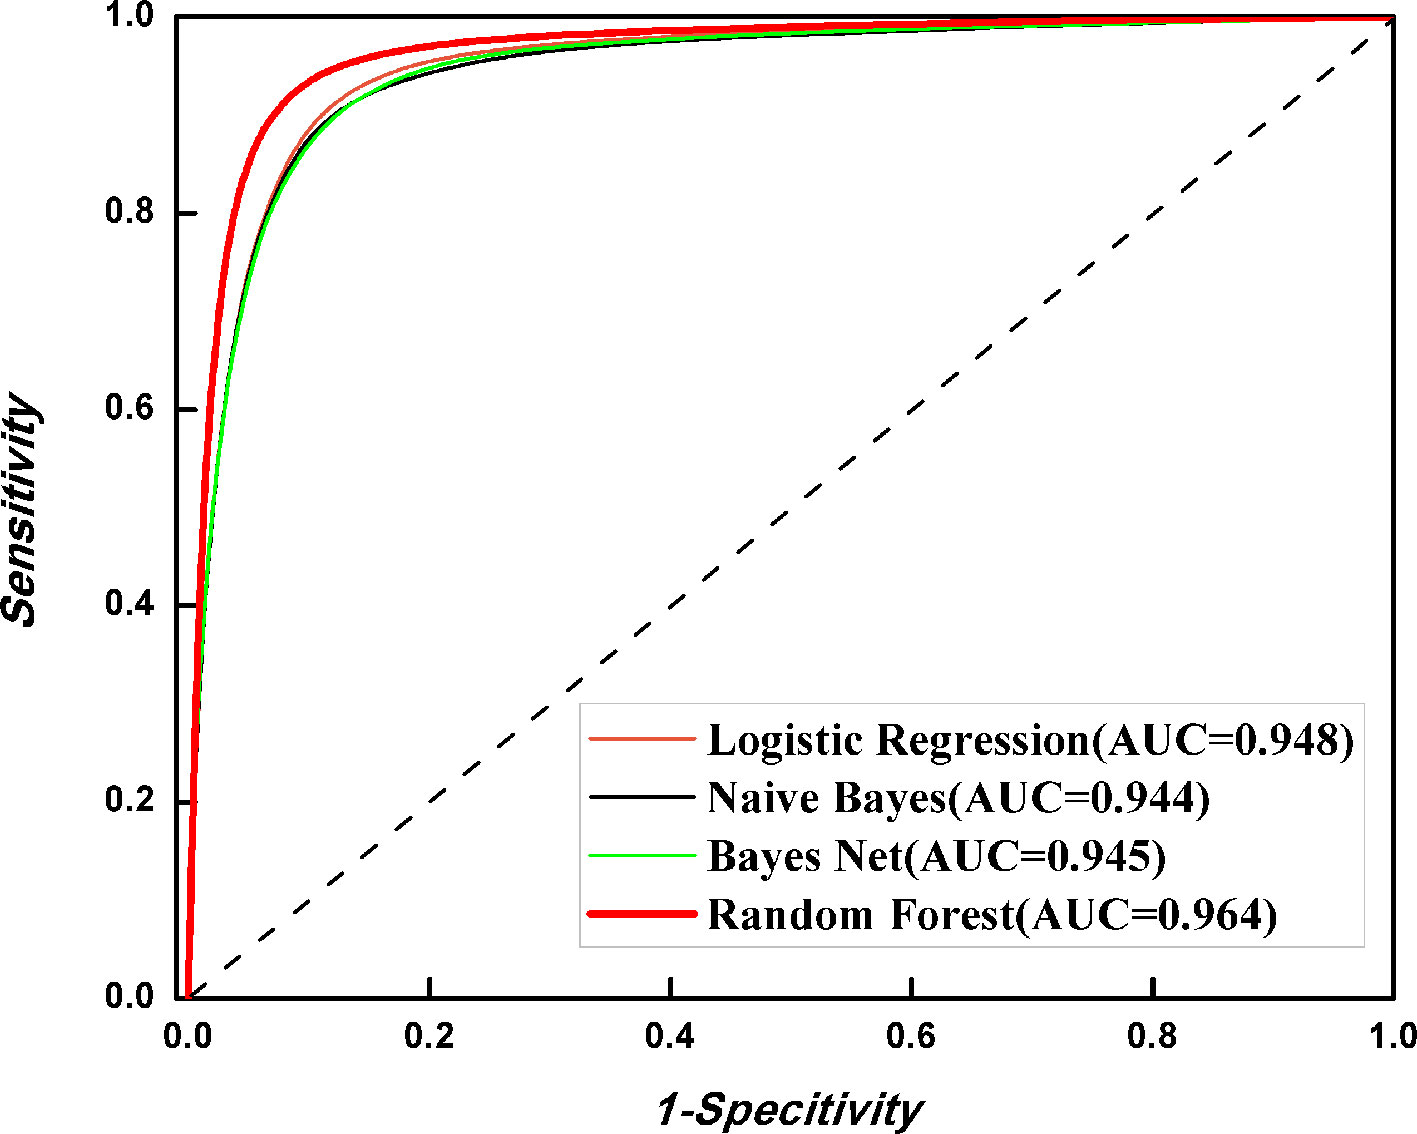
Figure 5 Performance evaluation of different algorithms.
Performance Evaluation Based on Different Data Ratios
In order to further assess the proposed method, the benchmark dataset was randomly divided into two parts according to five ratios (5:5, 6:4, 7:3, 8:2, and 9:1): training dataset and testing dataset. The former part was used to train the model, whereas the other part was used to test corresponding model. In this way, the training dataset and testing dataset are independent of each other. The predictive results are listed in Table 3. For each ratio between training and testing datasets, the model could always produce the AUC of >0.90, suggesting that our method was robust and reliable.

Table 3 Predictive performances of five ratios on the testing and training datasets.
Performance Evaluation With an Independent Dataset
We designed the third experiment to investigate the performance of our proposed predictor. In the experiment, an independent test set was collected from NCBI Gene Expression Omnibus (https://www.ncbi.nlm.nih.gov/geo/) with the accession number GSE103145 (Zhou et al., 2018). All the sequences were 41 nt long with the 6mA site at the center. After removing redundant information with CD-HIT program according to the cutoff of 60%, a total of 880 positive samples were obtained (Chen et al., 2019). The negative samples were also obtained from the rice genome. In the report by Zhou et al., 6mA most frequently occurs at GAGG motifs and seldom occurs in coding sequences (CDSs). Thus, negative samples were extracted from CDSs with GAGG motifs in the rice genome. In total, 880 negative samples with the sequence identity less than 60% were obtained. All negative samples were also 41 nt long with non-methylated adenosine at the center. The data were utilized as the benchmark dataset in i6mA-Pred (Chen et al., 2019). The details for the benchmark dataset are available at http://lin-group.cn/server/iDNA6mA-Rice.
We utilized these data to examine our proposed model (Table 4). In total, 95.8% 6mA sites and 93.3% non-6mA sites were correctly identified, suggesting that the method was a powerful tool for identifying 6mA sites in rice genome.

Table 4 Comparison of different methods for predicting 6mA sites in independent dataset.
Comparison With Published Methods
Till now, i6mA-Pred (Chen et al., 2019) is the only computational-based predictor for 6mA site prediction in the rice genome. To provide an objective and strict comparison, we investigated the performance of our method with the same data through jackknife cross-validation. The method could produce the auROC of 0.910 (Table 5), which was higher than that of i6mA-Pred. This comparison demonstrated that our method was powerful.

Table 5 Comparison of different methods for predicting 6mA sites in the rice genome with jackknife test.
Subsequently, iDNA6mA-PseKNC (Feng et al., 2019) is a tool to identify 6mA sites in Mus. musculus genome, and it can identify 6mA sites in many other species with high success rates. Thus, it is necessary to compare our proposed method with it. We investigated the performance of our predictor and iDNA6mA-PseKNC based on the independent dataset used in this work. All compared results were recorded in Table 4. It is obvious that the model proposed in this paper is superior to iDNA6mA-PseKNC for identifying 6mA sites.
Web Server
Databases and web servers (Wang et al., 2014; Liang et al., 2017; Yi et al., 2017; Zhang et al., 2017; Cui et al., 2018; Dao et al., 2018; Cheng et al., 2018b; He et al., 2018b; Hu et al., 2019; Cheng et al., 2019a; Cheng et al., 2019b) can provide scholars with more convenient services. Thus, the basis of the novel method, we built a web server named iRNA6mA-Rice to identify 6mA sites in the rice genome. The web server can be freely accessible at http://lin-group.cn/server/iDNA6mA-Rice.
Users can open the homepage shown in Figure 6 to see a short introduction about iDNA6mA-Rice. One may firstly click the “Web-server” button, then type or copy/paste DNA sequences in the input box, or upload the FASTA format file. Note that the length of each sequence should be greater than 41 nt. Subsequently, after clicking the “submit” button, the predicted results will appear on a new page. As described previously, the tool is simple and can provide a convenient way for users to identify putative 6mA sites in DNA of their interest. Moreover, in order to facilitate the processing of large-scale data, the stand-alone package can be downloaded at http://lin-group.cn/server/iDNA6mA-Rice/download.html.
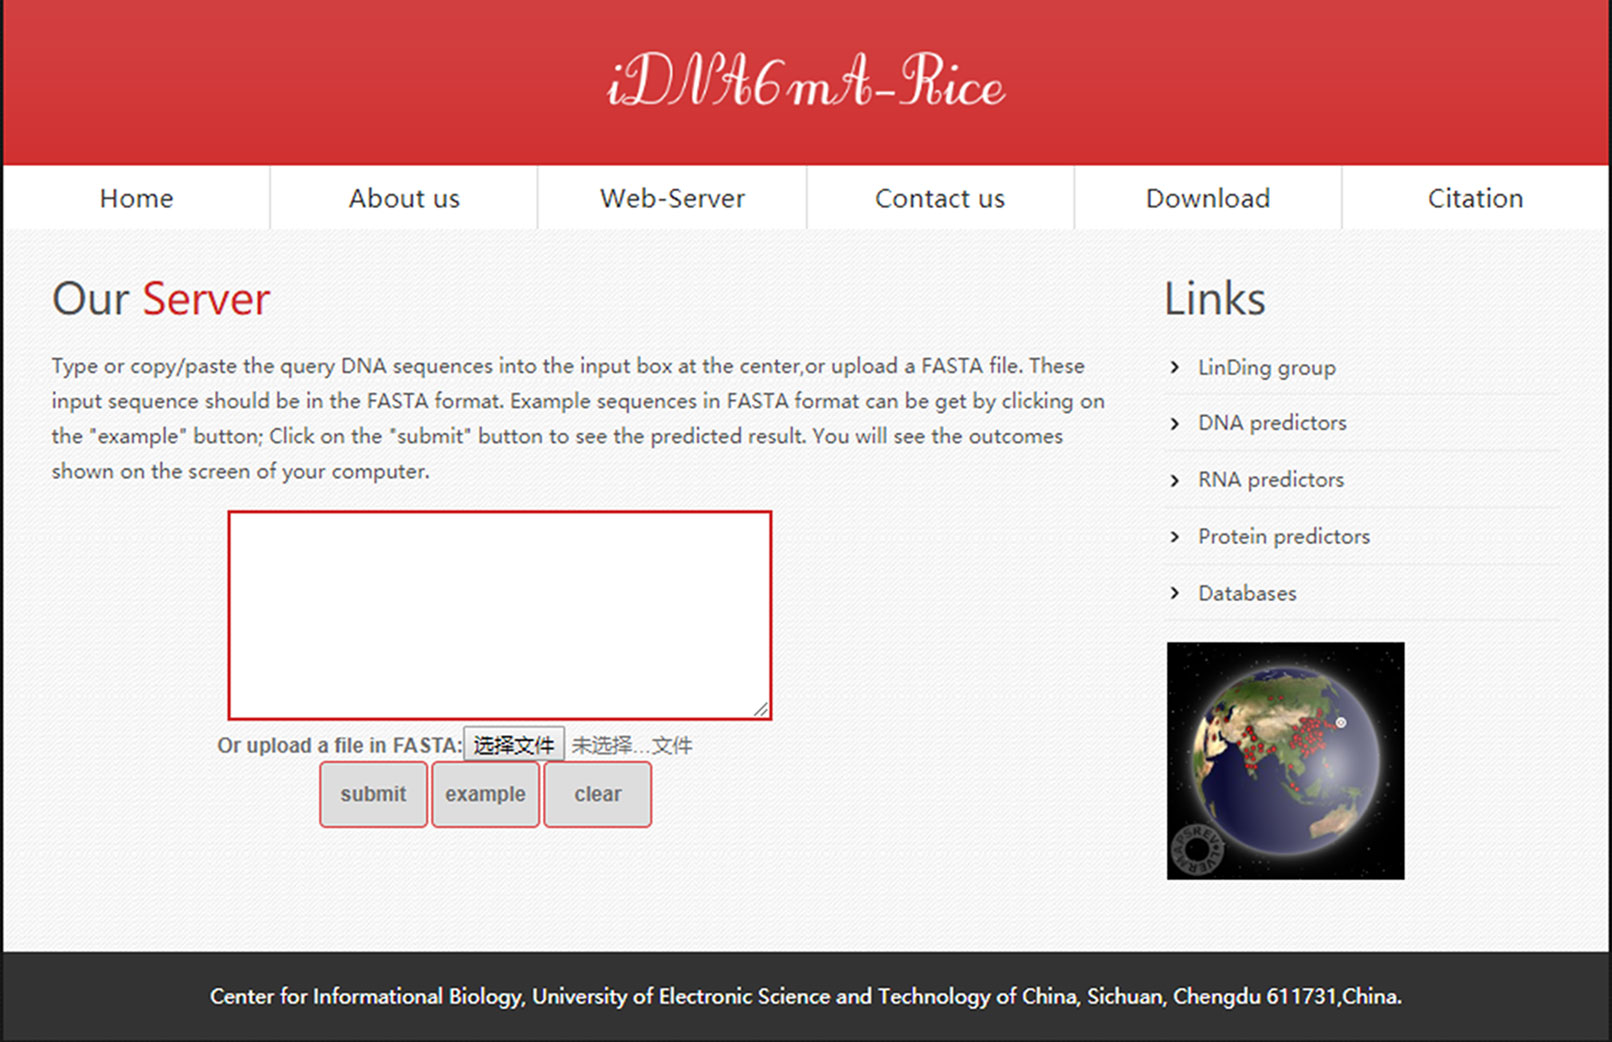
Figure 6 A semi-screenshot for the web server page of the iDNA6mA-Rice web server at http://lin-group.cn/server/iDNA6mA-Rice.
Conclusions
This paper developed a computational method for the identification of 6mA sites in the rice genome. We designed several kinds of experiments to examine the performance of the proposed method, for example, the performance evaluation on different features, performance evaluation on different algorithms, performance evaluation based on different data ratios, performance evaluation with an independent dataset, and comparison with published methods. All results demonstrated that our proposed method could accurately recognize 6mA sites in the rice genome. For the convenience of most wet-experimental scholars, we established a free web server to predict 6mA sites. We anticipate that the web server can promote the efficient discovery of novel potential 6mA sites in the rice genome and facilitate the exploration of their functional mechanisms in gene regulation.
Data Availability
All datasets generated for this study are included in the manuscript/supplementary files.
Author Contributions
WC, YZ, and HLin conceived the study. HLv and F-YD implemented the study and drafted the manuscript. HLv, Z-XG, and DZ wrote the custom scripts and performed analysis. HLv, WC, and YZ interpreted the data. All authors read and approved the manuscript.
Funding
This work has been supported by the National Nature Scientific Foundation of China (grant nos. 61772119 and 31771471) and the Science Strength Promotion Programme of UESTC.
Conflict of Interest Statement
The authors declare that the research was conducted in the absence of any commercial or financial relationships that could be construed as a potential conflict of interest.
References
Bergman, Y., Cedar, H. (2013). DNA methylation dynamics in health and disease. Nat. Struct. Mol. Biol. 20, 274–281. doi: 10.1038/nsmb.2518
Cao, R., Freitas, C., Chan, L., Sun, M., Jiang, H., Chen, Z. (2017a). ProLanGO: protein function prediction using neural machine translation based on a recurrent neural network. Molecules 22. doi: 10.3390/molecules22101732
Cao, R. Z., Adhikari, B., Bhattacharya, D., Sun, M., Hou, J., Cheng, J. L. (2017b). QAcon: single model quality assessment using protein structural and contact information with machine learning techniques. Bioinformatics 33. doi: 10.1093/bioinformatics/btw694
Chen, W., Lv, H., Nie, F., Lin, H. (2019). i6mA-Pred: Identifying DNA N6-methyladenine sites in the rice genome. Bioinformatics. doi: 10.1093/bioinformatics/btz015
Chen, W., Yang, H., Feng, P., Ding, H., Lin, H. (2017). iDNA4mC: identifying DNA N4-methylcytosine sites based on nucleotide chemical properties. Bioinformatics 33, 3518–3523. doi: 10.1093/bioinformatics/btx479
Chen, X. X., Tang, H., Li, W. C., Wu, H., Chen, W., Ding, H., et al. (2016). Identification of bacterial cell wall lyases via pseudo amino acid composition. Biomed. Res. Int. 2016, 1654623. doi: 10.1155/2016/1654623
Cheng, J. H., Yang, H., Liu, M. L., Su, W., Feng, P. M., Ding, H., et al. (2018a). Prediction of bacteriophage proteins located in the host cell using hybrid features. Chemometr. Intell. Lab. Syst. 180, 64–69. doi: 10.1016/j.chemolab.2018.07.006
Cheng, L., Hu, Y., Sun, J., Zhou, M., Jiang, Q. (2018b). DincRNA: a comprehensive web-based bioinformatics toolkit for exploring disease associations and ncRNA function. Bioinformatics 34, 1953–1956. doi: 10.1093/bioinformatics/bty002
Cheng, L., Sun, J., Xu, W. Y., Dong, L. X., Hu, Y., Zhou, M. (2016). OAHG: an integrated resource for annotating human genes with multi-level ontologies. Sci. Rep. 6, 1–9. doi: 10.1038/srep34820
Cheng, L., Yang, H., Zhao, H., Pei, X., Shi, H., Sun, J., et al. (2019a). MetSigDis: a manually curated resource for the metabolic signatures of diseases. Brief. Bioinform. 20, 203–209. doi: 10.1093/bib/bbx103
Cheng, L., Wang, P., Tian, R., Wang, S., Guo, Q., Luo, M., et al. (2019b). LncRNA2Target v2.0: a comprehensive database for target genes of lncRNAs in human and mouse. Nucleic Acids Res. 47, D140–D144. doi: 10.1093/nar/gky1051
Cheng, X. (1995). Structure and function of DNA methyltransferases. Annu. Rev. Biophys. Biomol. Struct. 24, 293–318. doi: 10.1146/annurev.bb.24.060195.001453
Cui, T., Zhang, L., Huang, Y., Yi, Y., Tan, P., Zhao, Y., et al. (2018). MNDR v2.0: an updated resource of ncRNA-disease associations in mammals. Nucleic Acids Res. 46, D371–D374. doi: 10.1093/nar/gkx1025
Dao, F. Y., Lv, H., Wang, F., Feng, C. Q., Ding, H., Chen, W., et al. (2018). Identify origin of replication in Saccharomyces cerevisiae using two-step feature selection technique. Bioinformatics 35, 2075–2083. doi: 10.1093/bioinformatics/bty943
Deng, M., Yu, C., Liang, Q., He, R. L., Yau, S. S. (2011). A novel method of characterizing genetic sequences: genome space with biological distance and applications. PLoS One 6, e17293. doi: 10.1371/journal.pone.0017293
Fang, G., Munera, D., Friedman, D. I., Mandlik, A., Chao, M. C., Banerjee, O., et al. (2012). Genome-wide mapping of methylated adenine residues in pathogenic Escherichia coli using single-molecule real-time sequencing. Nat. Biotechnol. 30, 1232–1239. doi: 10.1038/nbt.2432
Feng, C. Q., Zhang, Z. Y., Zhu, X. J., Lin, Y., Chen, W., Tang, H., et al. (2018). iTerm-PseKNC: a sequence-based tool for predicting bacterial transcriptional terminators. Bioinformatics 35, 1469–1477. doi: 10.1093/bioinformatics/bty827
Feng, P., Yang, H., Ding, H., Lin, H., Chen, W., Chou, K. C. (2019). iDNA6mA-PseKNC: Identifying DNA N(6)-methyladenosine sites by incorporating nucleotide physicochemical properties into PseKNC. Genomics 111, 96–102. doi: 10.1016/j.ygeno.2018.01.005
Frank, E., Hall, M., Trigg, L., Holmes, G., Witten, I. H. (2004). Data mining in bioinformatics using Weka. Bioinformatics 20, 2479–2481. doi: 10.1093/bioinformatics/bth261
Fu, Y., Luo, G. Z., Chen, K., Deng, X., Yu, M., Han, D., et al. (2015). N6-methyldeoxyadenosine marks active transcription start sites in Chlamydomonas. Cell 161, 879–892. doi: 10.1016/j.cell.2015.04.010
Greer, E. L., Blanco, M. A., Gu, L., Sendinc, E., Liu, J., Aristizabal-Corrales, D., et al. (2015). DNA Methylation on N6-adenine in C. elegans. Cell 161, 868–878. doi: 10.1016/j.cell.2015.04.005
Guo, S. H., Deng, E. Z., Xu, L. Q., Ding, H., Lin, H., Chen, W., et al. (2014). iNuc-PseKNC: a sequence-based predictor for predicting nucleosome positioning in genomes with pseudo k-tuple nucleotide composition. Bioinformatics 30, 1522–1529. doi: 10.1093/bioinformatics/btu083
He, W., Jia, C., Zou, Q. (2018a). 4mCPred: machine learning methods for DNA N4-methylcytosine sites prediction. Bioinformatics 35, 593–601. doi: 10.1093/bioinformatics/bty668
He, W., Jia, C., Duan, Y., Zou, Q. (2018b). 70ProPred: a predictor for discovering sigma70 promoters based on combining multiple features. BMC Syst. Biol. 12, 44. doi: 10.1186/s12918-018-0570-1
Heyn, H., Esteller, M. (2015). An adenine code for DNA: a second life for N6-Methyladenine. Cell 161, 710–713. doi: 10.1016/j.cell.2015.04.021
Hu, B., Zheng, L., Long, C., Song, M., Li, T., Yang, L., et al. (2019). EmExplorer: a database for exploring time activation of gene expression in mammalian embryos. Open Biol. 9, 190054. doi: 10.1098/rsob.190054
Koziol, M. J., Bradshaw, C. R., Allen, G. E., Costa, A. S. H., Frezza, C., Gurdon, J. B. (2016). Identification of methylated deoxyadenosines in vertebrates reveals diversity in DNA modifications. Nat. Struct. Mol. Biol. 23, 24–30. doi: 10.1038/nsmb.3145
Lai, H. Y., Zhang, Z. Y., Su, Z. D., Su, W., Ding, H., Chen, W., et al. (2019). iProEP: a computational predictor for predicting promoter. Mol. Ther. Nucleic Acids 17, 337–346. doi: 10.1016/j.omtn.2019.05.028
Li, W., Godzik, A. (2006). Cd-hit: a fast program for clustering and comparing large sets of protein or nucleotide sequences. Bioinformatics 22, 1658–1659. doi: 10.1093/bioinformatics/btl158
Liang, Z. Y., Lai, H. Y., Yang, H., Zhang, C. J., Yang, H., Wei, H. H., et al. (2017). Pro54DB: a database for experimentally verified sigma-54 promoters. Bioinformatics 33, 467–469. doi: 10.1093/bioinformatics/btw630
Lin, H., Li, Q. Z. (2011). Eukaryotic and prokaryotic promoter prediction using hybrid approach. Theory Biosci. 130, 91–100. doi: 10.1007/s12064-010-0114-8
Lin, H., Deng, E. Z., Ding, H., Chen, W., Chou, K. C. (2014). iPro54-PseKNC: a sequence-based predictor for identifying sigma-54 promoters in prokaryote with pseudo k-tuple nucleotide composition. Nucleic Acids Res. 42, 12961–12972. doi: 10.1093/nar/gku1019
Liu, D., Li, G., Zuo, Y. (2018). Function determinants of TET proteins: the arrangements of sequence motifs with specific codes. Brief. Bioinform. doi: 10.1093/bib/bby053
Liu, J., Zhu, Y., Luo, G. Z., Wang, X., Yue, Y., Wang, X., et al. (2016). Abundant DNA 6mA methylation during early embryogenesis of zebrafish and pig. Nat. Commun. 7, 13052. doi: 10.1038/ncomms13052
Long, C. S., Li, W., Liang, P. F., Liu, S., Zuo, Y. C. (2019). Transcriptome comparisons of multi-species identify differential genome activation of mammals embryogenesis. IEEE Access 7, 7794–7802. doi: 10.1109/ACCESS.2018.2889809
Lv, H., Zhang, Z. M., Li, S. H., Tan, J. X., Chen, W., Lin, H. (2019). Evaluation of different computational methods on 5-methylcytosine sites identification. Brief. Bioinform. doi: 10.1093/bib/bbz048
Manavalan, B., Lee, J. (2017). SVMQA: support-vector-machine-based protein single-model quality assessment. Bioinformatics 33, 2496–2503. doi: 10.1093/bioinformatics/btx222
Manavalan, B., Shin, T. H., Lee, G. (2018a). PVP-SVM: sequence-based prediction of phage virion proteins using a support vector machine. Front. Microbiol. 9, 476. doi: 10.3389/fmicb.2018.00476
Manavalan, B., Shin, T. H., Lee, G. (2018b). DHSpred: support-vector-machine-based human DNase I hypersensitive sites prediction using the optimal features selected by random forest. Oncotarget 9, 1944–1956. doi: 10.18632/oncotarget.23099
Manavalan, B., Basith, S., Shin, T. H., Choi, S., Kim, M. O., Lee, G. (2017). MLACP: machine-learning-based prediction of anticancer peptides. Oncotarget 8, 77121–77136. doi: 10.18632/oncotarget.20365
Metz, C. E. (1989). Some practical issues of experimental design and data analysis in radiological ROC studies. Invest. Radiol. 24, 234–245. doi: 10.1097/00004424-198903000-00012
Mondo, S. J., Dannebaum, R. O., Kuo, R. C., Louie, K. B., Bewick, A. J., LaButti, K., et al. (2017). Widespread adenine N6-methylation of active genes in fungi. Nat. Genet. 49, 964–968. doi: 10.1038/ng.3859
O’Shea, J. P., Chou, M. F., Quader, S. A., Ryan, J. K., Church, G. M., Schwartz, D. (2013). pLogo: a probabilistic approach to visualizing sequence motifs. Nat. Methods 10, 1211–1212. doi: 10.1038/nmeth.2646
Ratel, D., Ravanat, J. L., Berger, F., Wion, D. (2006). N6-methyladenine: the other methylated base of DNA. Bioessays 28, 309–315. doi: 10.1002/bies.20342
Smith, Z. D., Meissner, A. (2013). DNA methylation: roles in mammalian development. Nat. Rev. Genet. 14, 204–220. doi: 10.1038/nrg3354
Song, J., Zhai, J., Bian, E., Song, Y., Yu, J., Ma, C. (2018a). Transcriptome-wide annotation of m5c RNA modifications using machine learning. Front. Plant Sci. 9, 519. doi: 10.3389/fpls.2018.00519
Song, J., Tan, H., Perry, A. J., Akutsu, T., Webb, G. I., Whisstock, J. C., et al. (2012). PROSPER: an integrated feature-based tool for predicting protease substrate cleavage sites. PLoS One 7, e50300. doi: 10.1371/journal.pone.0050300
Song, J., Wang, Y., Li, F., Akutsu, T., Rawlings, N. D., Webb, G. I., et al. (2018b). iProt-Sub: a comprehensive package for accurately mapping and predicting protease-specific substrates and cleavage sites. Brief. Bioinform. 20, 638–658. doi: 10.1093/bib/bby028
Song, J., Li, F., Leier, A., Marquez-Lago, T. T., Akutsu, T., Haffari, G., et al. (2018c). PROSPERous: high-throughput prediction of substrate cleavage sites for 90 proteases with improved accuracy. Bioinformatics 34, 684–687. doi: 10.1093/bioinformatics/btx670
Stephenson, N., Shane, E., Chase, J., Rowland, J., Ries, D., Justice, N., et al. (2018). Survey of machine learning techniques in drug discovery. Curr. Drug Metab. 20, 185–193. doi: 10.2174/1389200219666180820112457
Su, Z. D., Huang, Y., Zhang, Z. Y., Zhao, Y. W., Wang, D., Chen, W., et al. (2018). iLoc-lncRNA: predict the subcellular location of lncRNAs by incorporating octamer composition into general PseKNC. Bioinformatics 34, 4196–4204. doi: 10.1093/bioinformatics/bty508
Tan, J. X., Li, S. H., Zhang, Z. M., Chen, C. X., Chen, W., Tang, H., et al. (2019). Identification of hormone binding proteins based on machine learning methods. Math. Biosci. Eng. 16, 2466–2480. doi: 10.3934/mbe.2019123
Tang, H., Zhao, Y. W., Zou, P., Zhang, C. M., Chen, R., Huang, P., et al. (2018a). HBPred: a tool to identify growth hormone-binding proteins. Int. J. Biol. Sci. 14, 957–964. doi: 10.7150/ijbs.24174
Tang, W., Wan, S., Yang, Z., Teschendorff, A. E., Zou, Q. (2018b). Tumor origin detection with tissue-specific miRNA and DNA methylation markers. Bioinformatics 34, 398–406. doi: 10.1093/bioinformatics/btx622
Tian, K., Zhao, X., Yau, S. S. (2018). Convex hull analysis of evolutionary and phylogenetic relationships between biological groups. J. Theor. Biol. 456, 34–40. doi: 10.1016/j.jtbi.2018.07.035
von Meyenn, F., Iurlaro, M., Habibi, E., Liu, N. Q., Salehzadeh-Yazdi, A., Santos, F., et al. (2016). Impairment of DNA methylation maintenance is the main cause of global demethylation in naive embryonic stem cells. Mol. Cell 62, 848–861. doi: 10.1016/j.molcel.2016.04.025
Wang, M. J., Zhao, X. M., Tan, H., Akutsu, T., Whisstock, J. C., Song, J. N. (2014). Cascleave 2.0, a new approach for predicting caspase and granzyme cleavage targets. Bioinformatics 30, 71–80. doi: 10.1093/bioinformatics/btt603
Wang, Y., Chen, X., Sheng, Y., Liu, Y., Gao, S. (2017). N6-adenine DNA methylation is associated with the linker DNA of H2A.Z-containing well-positioned nucleosomes in Pol II-transcribed genes in Tetrahymena. Nucleic Acids Res. 45, 11594–11606. doi: 10.1093/nar/gkx883
Wei, L., Zhou, C., Chen, H., Song, J., Su, R. (2018a). ACPred-FL: a sequence-based predictor based on effective feature representation to improve the prediction of anti-cancer peptides. Bioinformatics 34, 4007–4016. doi: 10.1093/bioinformatics/bty451
Wei, L., Luan, S., Nagai, L. A. E., Su, R., Zou, Q. (2018b). Exploring sequence-based features for the improved prediction of DNA N4-methylcytosine sites in multiple species. Bioinformatics 35, 1326–1333. doi: 10.1093/bioinformatics/bty824
Wion, D., Casadesus, J. (2006). N6-methyl-adenine: an epigenetic signal for DNA-protein interactions. Nat. Rev. Microbiol. 4, 183–192. doi: 10.1038/nrmicro1350
Wu, T. P., Wang, T., Seetin, M. G., Lai, Y., Zhu, S., Lin, K., et al. (2016). DNA methylation on N(6)-adenine in mammalian embryonic stem cells. Nature 532, 329–333. doi: 10.1038/nature17640
Xiao, C. L., Zhu, S., He, M., Chen, Zhang, Q., Chen, Y., Yu, G., et al. (2018). N(6)-Methyladenine DNA modification in the human genome. Mol. Cell 71, 306–318 e7. doi: 10.1016/j.molcel.2018.06.015
Yang, H., Lv, H., Ding, H., Chen, W., Lin, H. (2018a). iRNA-2OM: a sequence-based predictor for identifying 2’-O-methylation sites in homo sapiens. J. Comput. Biol. 25, 1266–1277. doi: 10.1089/cmb.2018.0004
Yang, H., Qiu, W. R., Liu, G. Q., Guo, F. B., Chen, W., Chou, K. C., et al. (2018b). iRSpot-Pse6NC: identifying recombination spots in Saccharomyces cerevisiae by incorporating hexamer composition into general PseKNC. Int. J. Biol. Sci. 14, 883–891. doi: 10.7150/ijbs.24616
Yao, B., Cheng, Y., Wang, Z., Li, Y., Chen, L., Huang, L., et al. (2017). DNA N6-methyladenine is dynamically regulated in the mouse brain following environmental stress. Nat. Commun. 8, 1122. doi: 10.1038/s41467-017-01195-y
Yi, Y., Zhao, Y., Li, C., Zhang, L., Huang, H., Li, Y., et al. (2017). RAID v2.0: an updated resource of RNA-associated interactions across organisms. Nucleic Acids Res. 45, D115–D118. doi: 10.1093/nar/gkw1052
Zhang, C. J., Tang, H., Li, W. C., Lin, H., Chen, W., Chou, K. C. (2016). iOri-Human: identify human origin of replication by incorporating dinucleotide physicochemical properties into pseudo nucleotide composition. Oncotarget 7, 69783–69793. doi: 10.18632/oncotarget.11975
Zhang, G., Huang, H., Liu, D., Cheng, Y., Liu, X., Zhang, W., et al. (2015). N6-methyladenine DNA modification in Drosophila. Cell 161, 893–906. doi: 10.1016/j.cell.2015.04.018
Zhang, T., Tan, P., Wang, L., Jin, N., Li, Y., Zhang, L., et al. (2017). RNALocate: a resource for RNA subcellular localizations. Nucleic Acids Res. 45, D135–D138. doi: 10.1093/nar/gkw728
Zhao, X., Zou, Q., Liu, B., Liu, X. (2014). Exploratory predicting protein folding model with random forest and hybrid features. Curr. Proteomics 11, 289–299. doi: 10.2174/157016461104150121115154
Zhou, C., Wang, C., Liu, H., Zhou, Q., Liu, Q., Guo, Y., et al. (2018). Identification and analysis of adenine N(6)-methylation sites in the rice genome. Nat. Plants 4, 554–563. doi: 10.1038/s41477-018-0214-x
Zhu, X. J., Feng, C. Q., Lai, H. Y., Chen, W., Lin, H. (2019). Predicting protein structural classes for low-similarity sequences by evaluating different features. Knowl.-Based Syst. 163, 787–793. doi: 10.1016/j.knosys.2018.10.007
Zou, Q., Xing, P., Wei, L., Liu, B. (2018a). Gene2vec: gene subsequence embedding for prediction of mammalian N6-methyladenosine sites from mRNA. RNA 25, 205–218. doi: 10.1261/rna.069112.118
Zou, Q., Wan, S., Ju, Y., Tang, J., Zeng, X. (2016). Pretata: predicting TATA binding proteins with novel features and dimensionality reduction strategy. BMC Syst. Biol. 10, 114. doi: 10.1186/s12918-016-0353-5
Zou, Q., Lin, G., Jiang, X., Liu, X., Zeng, X. (2018b). Sequence clustering in bioinformatics: an empirical study. Brief. Bioinform. doi: 10.1093/bib/bby090
Zuo, Y., Li, Y., Chen, Y., Li, G., Yan, Z., Yang, L. (2017). PseKRAAC: a flexible web server for generating pseudo K-tuple reduced amino acids composition. Bioinformatics 33, 122–124. doi: 10.1093/bioinformatics/btw564
Keywords: N6-methyladenine, mono-nucleotide binary encoding, random forest, cross-validation, web-server
Citation: Lv H, Dao F-Y, Guan Z-X, Zhang D, Tan J-X, Zhang Y, Chen W and Lin H (2019) iDNA6mA-Rice: A Computational Tool for Detecting N6-Methyladenine Sites in Rice. Front. Genet. 10:793. doi: 10.3389/fgene.2019.00793
Received: 13 June 2019; Accepted: 26 July 2019;
Published: 10 September 2019.
Edited by:
Liang Cheng, Harbin Medical University, ChinaCopyright © 2019 Lv, Dao, Guan, Zhang, Tan, Zhang, Chen and Lin. This is an open-access article distributed under the terms of the Creative Commons Attribution License (CC BY). The use, distribution or reproduction in other forums is permitted, provided the original author(s) and the copyright owner(s) are credited and that the original publication in this journal is cited, in accordance with accepted academic practice. No use, distribution or reproduction is permitted which does not comply with these terms.
*Correspondence: Yong Zhang, emhhbmd5b25nOTE2QHVlc3RjLmVkdS5jbg==; Wei Chen, Y2hlbndlaWltdUBnbWFpbC5jb20=; Hao Lin, aGxpbkB1ZXN0Yy5lZHUuY24=