 Adrián Mosquera Orgueira1,2,3
 Beatriz Antelo Rodríguez1,2,3
 José Ángel Díaz Arias1,2
 Marta Sonia González Pérez1,2José Luis Bello López1,2,3
- 1Research Group on Lymphoproliferative Diseases, Health Research Institute of Santiago de Compostela (IDIS), Santiago de Compostela, Spain
- 2Complexo Hospitalario Universitario de Santiago de Compostela (CHUS), Division of Hematology, SERGAS, Santiago de Compostela, Spain
- 3Department of Medicine, University of Santiago de Compostela, Santiago de Compostela, Spain
Chronic lymphocytic leukemia (CLL) is the most frequent lymphoproliferative syndrome in Western countries, and it is characterized by recurrent large genomic rearrangements. During the last decades, array techniques have expanded our knowledge about CLL’s karyotypic aberrations. The advent of large sequencing databases expanded our knowledge cancer genomics to an unprecedented resolution and enabled the detection of small-scale structural aberrations in the cancer genome. In this study, we have performed exome-sequencing-based copy number aberration (CNA) and loss of heterozygosity (LOH) analysis in order to detect new recurrent structural aberrations. We describe 54 recurrent focal CNAs enriched in cancer-related pathways, and their association with gene expression and clinical evolution. Furthermore, we discovered recurrent large copy number neutral LOH events affecting key driver genes, and we recapitulate most of the large CNAs that characterize the CLL genome. These results provide “proof-of-concept” evidence supporting the existence of new genes involved in the pathogenesis of CLL.
Introduction
Chronic lymphocytic leukemia (CLL) is the most frequent lymphoproliferative disease in Western populations, and it is characterized by its clinical and genetic heterogeneity. Döhner et al. (2000) described the widely used cytogenetic classification of CLL based on the most prevalent chromosomal aberrations in the CLL genome (Döhner et al., 2000), that is, trisomy 12 and deletions in 13q14.2–14.3, 11q22.3, and 17p13.1. Since that moment, new genome-wide studies have revealed new recurrent genomic aberrations, such as trisomy 19, amplifications at 2p and 8q, and deletions at 8p, 6q21, 18p, and 20p (Pfeifer et al., 2007; Landau et al., 2015). Similarly, a wealth of genomic and epigenomic modulators of CLL’s clinical aggressivity have been discovered (Nadeu et al., 2018), such as point mutations in NOTCH1, SF3B1, ATM, TP53, and POT1 and the absence of somatic hypermutation at the IGHV locus. It has been observed that copy number aberrations (CNAs) in CLL genomes tend to be acquired early in disease evolution and usually remain stable, whereas the mutational heterogeneity can increase (Nadeu et al., 2018). Indeed, mounting evidence indicates that the accumulation of these cytogenomic events modulates CLL proliferation and clinical aggressivity to a great extent (Raponi et al., 2018; Gruber et al., 2019), acting as drivers of genomic complexity and clonal evolution (Edelmann et al., 2017; Yu et al., 2017; Hernández-Sánchez et al., 2019) and accumulating in relapsed cases (Ljungström et al., 2016; Leeksma et al., 2019).
CNAs and copy number neutral loss of heterozygosity (CNN-LOH) are oncogenic mechanisms that induce gene-dosage effects, disrupt coding sequences, cause structural rearrangements, or potentiate epigenetic effects. Oncogenes are frequently affected by copy number gains, while tumor suppressor genes tend to be deleted. Massive array-based techniques such as array comparative genomic hybridization and single-nucleotide polymorphism (SNP) arrays have enabled the analysis of structural aberrations on cancer genomes to an unprecedented resolution of 10–100 kb. With the development of massive sequencing technologies, large databases of cancer sequence data have been published. This motivated the development of a variety of CNA detection algorithms from exome-sequencing data, which have the additional benefit of detecting smaller CNA events at the expense of increased false discoveries and reduced sensitivity and specificity (Nam et al., 2016). These methods are specifically designed to face particular issues, particularly those inherent to the sequencing protocol (such as biases induced by hybridization, GC content, and read mappability), due to cancer biology (ploidy estimation and subclonality) (Zare et al., 2017) and due to the presence or absence of matched controls (Kim et al., 2017).
In this analysis, we used previously published exome-seq data in order to detect small recurrent structural events involved in the pathogenesis of CLL. Our results not only reproduce the known cytogenetic aberrations in CLL but also support the existence of multiple recurrent focal CNAs and CNN-LOH affecting key oncogenic pathways, some of which are clearly associated with higher proliferative capacity, shorter survival, and altered gene expression. We conclude that focal CNAs may be more relevant than previously expected in the pathogenesis of CLL, and they merit further consideration for prognostic stratification.
Methodology
Data Source
The International Cancer Genome Consortium (ICGC) Data Access Committee granted us access to the CLL sequencing data (Ramsay et al., 2013) deposited in the European Genome-Phenome Database (EGA) under DACO-1040945. For this analysis, we used exome-seq data from matched control and tumor samples of CLL cases under the accession code EGAD00001001464. Patient characteristics can be consulted in Table 1.
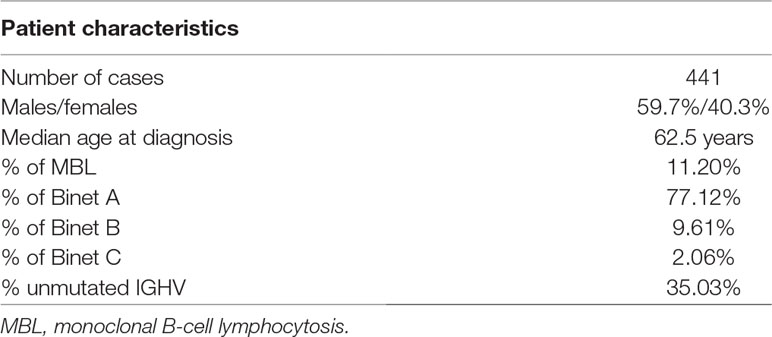
Table 1 Patient characteristics.
Data Preprocessing
Samples were processed by Puente et al. (2015) as described in their original paper (Puente et al., 2015). Briefly, 3 μg of genomic DNA was used for paired-end sequencing library construction, followed by enrichment in exomic sequences using the SureSelect Human All Exon 50Mb kit (Agilent Technologies). Next, DNA was pulled down using magnetic beads with streptavidin, followed by 18 cycles of amplification. Sequencing was performed on an Illumina GAIIx or on a HiSeq2000 sequencer (2 × 76 bp). Exome-seq data were aligned to the reference genome (GRCh37.75) using bwa (Li and Durbin, 2009). Duplicate read removal, sorting, and indexing were done using samtools (Li et al., 2009). Base quality score recalibration was made with BamUtil (Breese and Liu, 2013) using a logistic regression model.
CNA and CNN-LOH Detection
We analyzed paired tumor-normal exome-sequencing data with Control-FREEC version 11.3 in order to identify somatic CNA and CNN-LOH regions (Boeva et al., 2012). Control-FREEC uses aligned reads to construct and normalize a copy number profile and a B-allele frequency (BAF) profile. Then, it performs profile segmentation and infers genotype status for each segment using both copy number and allelic frequency information. Finally, genomic aberrations are identified and annotated.
The following specifications were used: “window = 0,” “ploidy = 2,” “breakPointThreshold = 1.2,” “noisyData = TRUE,” “readCountThreshold = 50,” “forceGContentNormalization = 1,” “contaminationAdjustment = TRUE,” “telocentromeric = 50000,” and “mateOrientation = 0.” BAFs were estimated using all variants reported in dbSNP (version 150) with a minimal coverage per variant position of 5 reads and a minimal sequencing quality per position of 20 Phred. Variant calling was limited to regions covered in the SureSelect Exome Capture 50Mb version 4 kit.
LOH and CNA Selection and Filtering
CNN-LOH were called with p-values < 0.05 (Kolmogorov–Smirnov test) and an uncertainty upper threshold of 5%. Regions with lowmappability according to UCSC 75-bp mappability tracks (score below 0.5) were filtered out. As expected, we observed regions that seemed prone to CNA erroneous detection. Thus, we decided to apply a hard filter and discard those CNAs significantly enriched in both amplifications and deletions, as well as those located near a telomeric or centromeric region. CNA events were detected using GISTIC2.0 (Beroukhim et al., 2007). GITIC2.0 was run with default parameters plus the arm peel-off filter. Focal recurrent CNAs were defined as those spanning less than 50% of a chromosome arm with a residual q-value < 0.05 and a wide peak size below 10 megabases. A 1 − log2 tumor/normal ratio above 0.3 was used to define amplifications, and a ratio below −0.3 was used to define deletions.
Survival Analysis
Variables associated with time to treatment (TTT) and overall survival (OS) were analyzed using Cox regression as implemented in the survival R package (Therneau and Grambsch, 2000; R Development Core Team, 2011; Therneau, 2015). Assessment of the proportional hazards assumption was performed using the cox.zph function. We created two different models: a univariate model that only includes CNA status for each gene and an adjusted model that included variables associated with clinical outcome at a p-value < 0.2 in a univariate model. The combined model (CM) for TTT analysis included as covariates donor sex, stage at diagnosis (monoclonal B-cell lymphocytosis (MBL), Binet A, Binet B, and Binet C), and IGHV mutational status, while the CM for OS analysis included stage at diagnosis, IGHV mutation status, and age at diagnosis. The Benjamini–Hochberg (BH) method was used to adjust for multiple testing.
RNAseq Analysis and Correlation With CNA Status
Two hundred twenty patients had matched RNAseq data of CLL-purified cells (accession IDs EGAD00001001443 and EGAD00001000258). Illumina adapters were removed using cutadapt (Martin, 2011), and alignment to the human reference genome (GRCh37) was performed using Hisat2 (Kim et al., 2015) with default specifications. We used the Hisat2-provided Hierarchical Graph FM index for GRCh37 with SNP and Ensembl transcript information. Bam files were sorted and indexed using samtools (Li et al., 2009). Bam files were processed in R (R Development Core Team, 2011) according to the RNAseq gene expression protocol developed by Love et al. (2015). Briefly, bam files were read using Rsamtools (Morgan et al., 2017), followed by gene-level expression estimation using the SummarizeOverlaps function from the GenomicAlignments package (Lawrence et al., 2013). Gene models in GTF format were downloaded from Ensembl (GRCh37.75 version) (Yates et al., 2016). A log2-transformation on normalized frames per kilobase counts was performed. Focal CNAs were classified according to Gistic into low-range events (tumor/normal log2 ratio > 0.3 and <0.9 for amplifications and less than −0.9 and more than −0.3 for deletions) and higher-range events (tumor/normal log2 ratio > 0.9 for amplifications and less than −0.9 for deletions). Correlation between CNA status and gene expression was performed using Spearman’s correlation. A minimum of 5 CNA events with matched transcriptomic data was set for analysis. Furthermore, immunoglobulin and T-cell receptor gene rearrangements were not included. p-values were adjusted for multiple testing using the BH method.
Results
Focal CNA Regions and Their Association With TTT and OS
We identified 54 recurrent focal CNAs in the CLL genome (residual q-value < 0.05, Supplemental Figure 1, Table 2). Among them, there were 31 recurrent amplifications with a wide peak size of 75.1 kb (Figure 1) and 23 recurrent deletions with a median wide peak size of 405 kb (Figure 2).
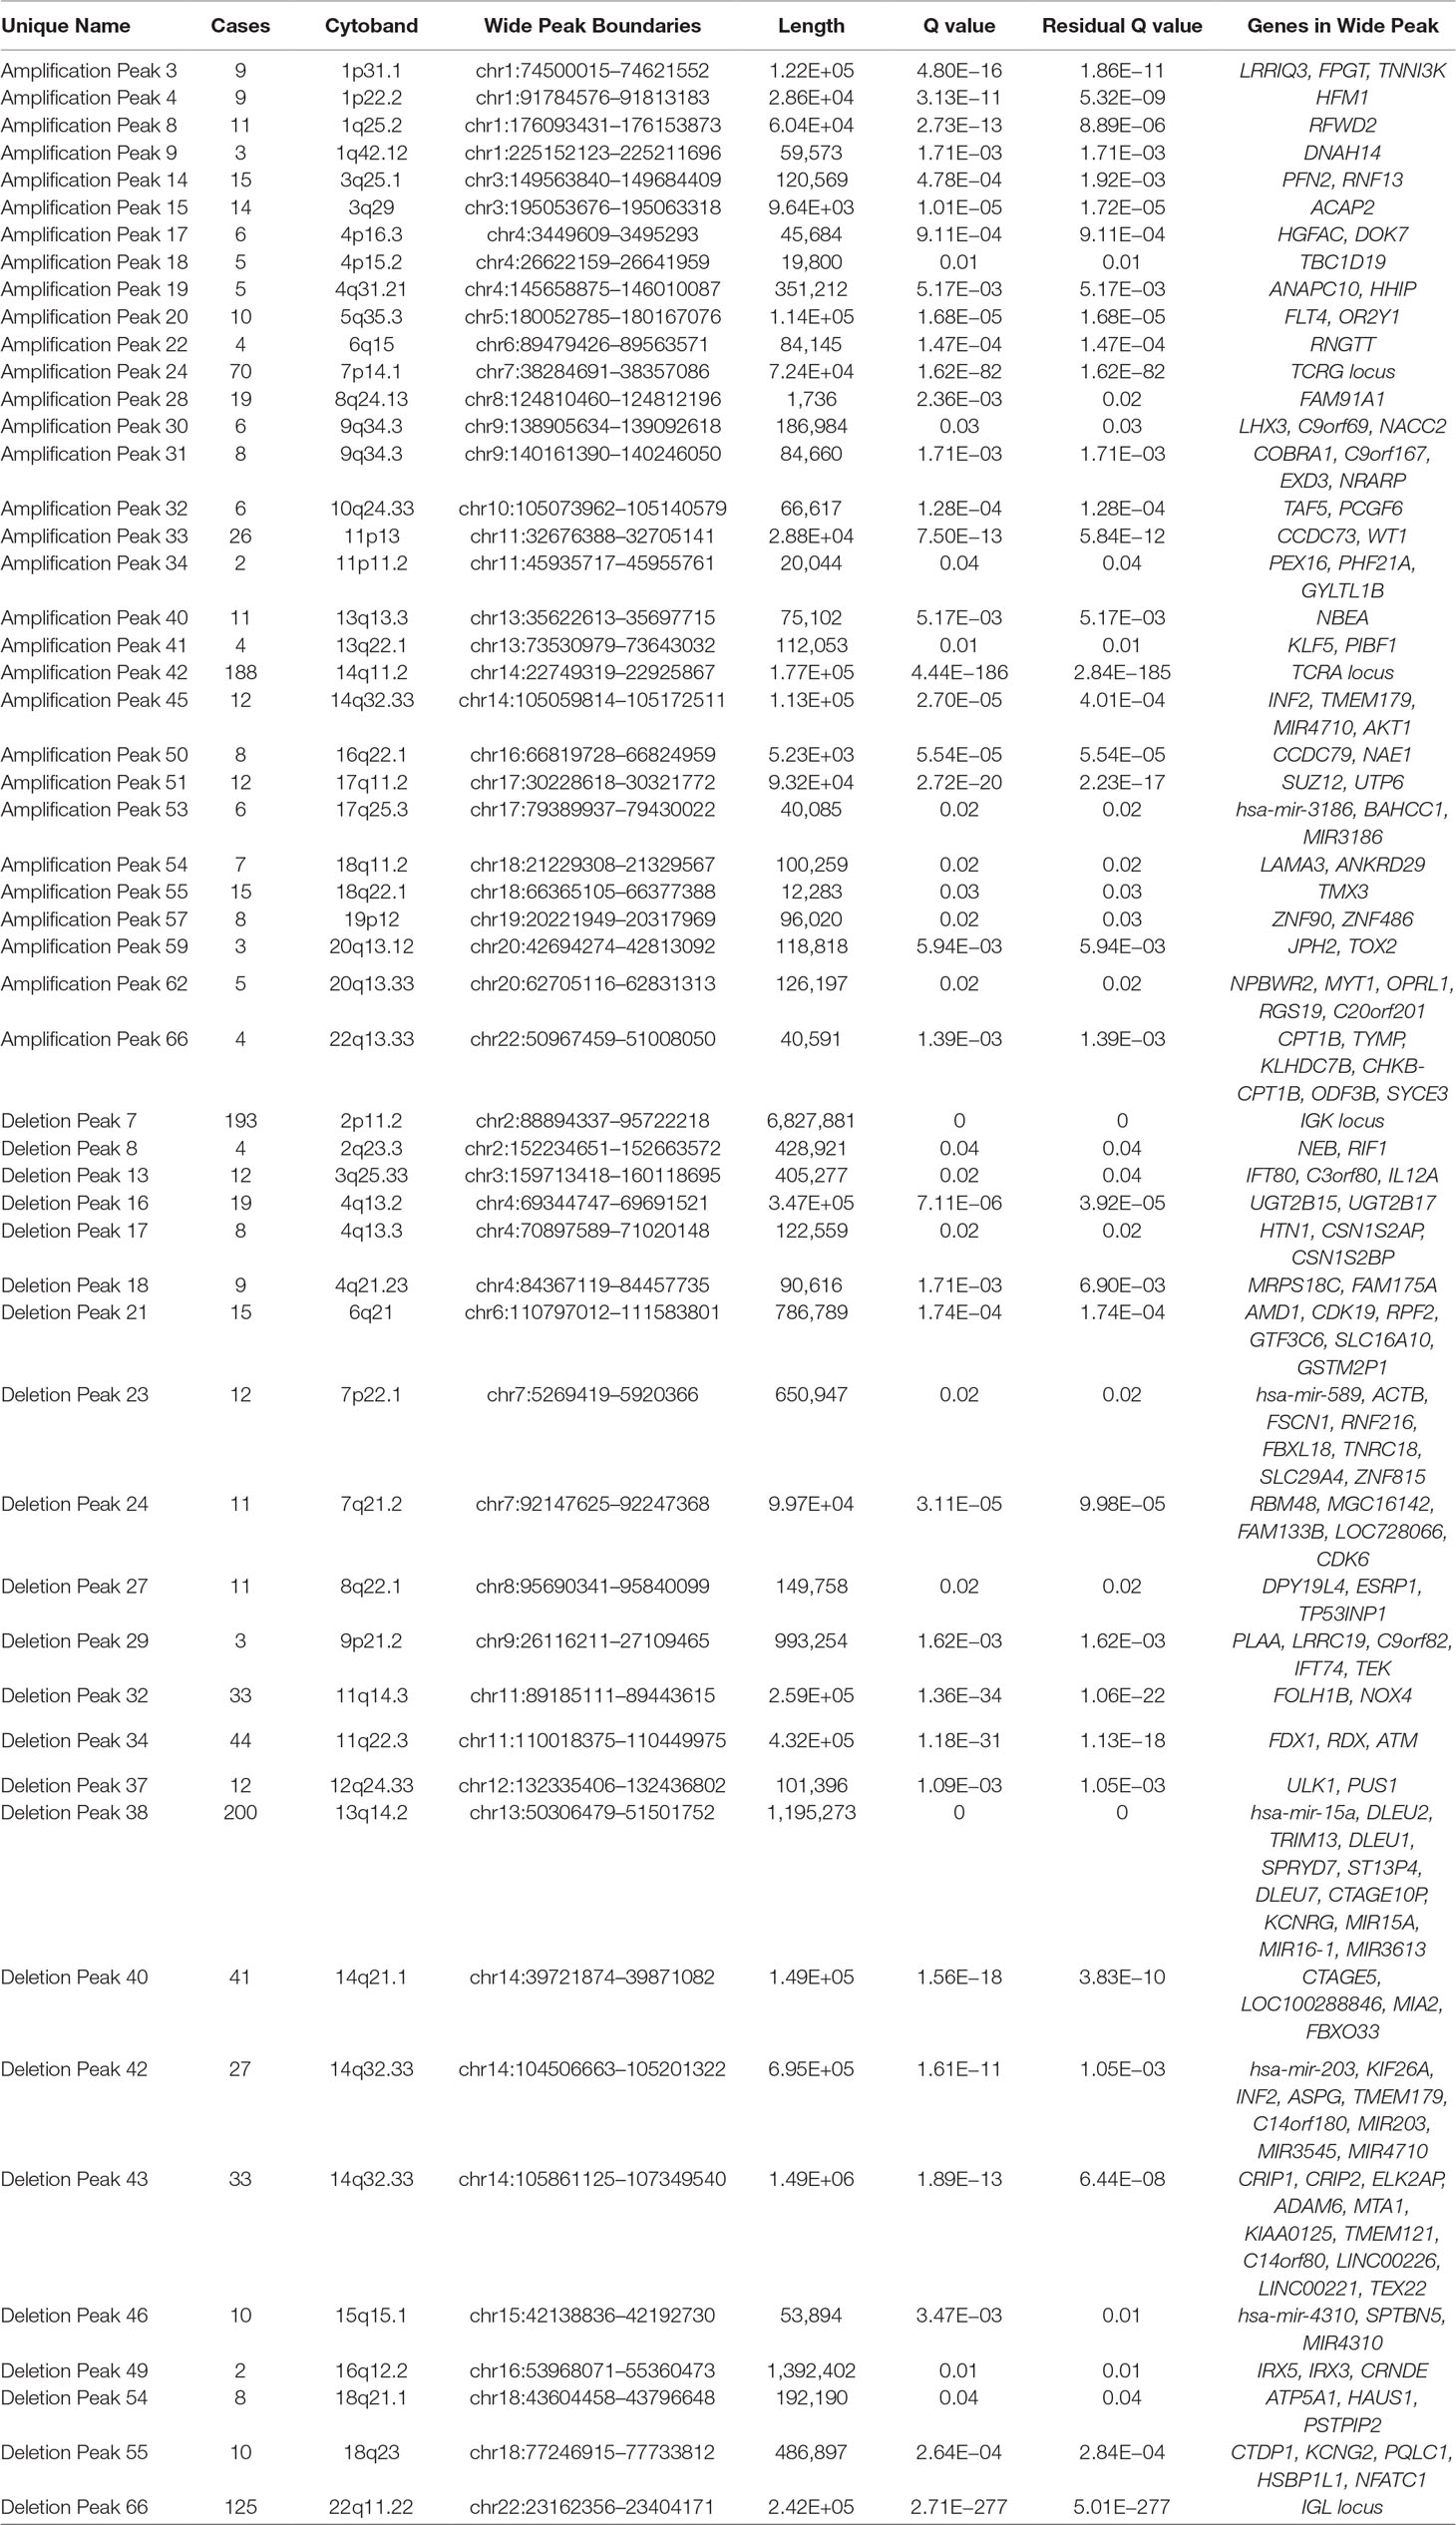
Table 2 Recurrent focal amplifications and deletions in the chronic lymphocytic leukemia (CLL) genome, including their frequency, wide peak region, length, q-value, residual q-value, and involved genes.
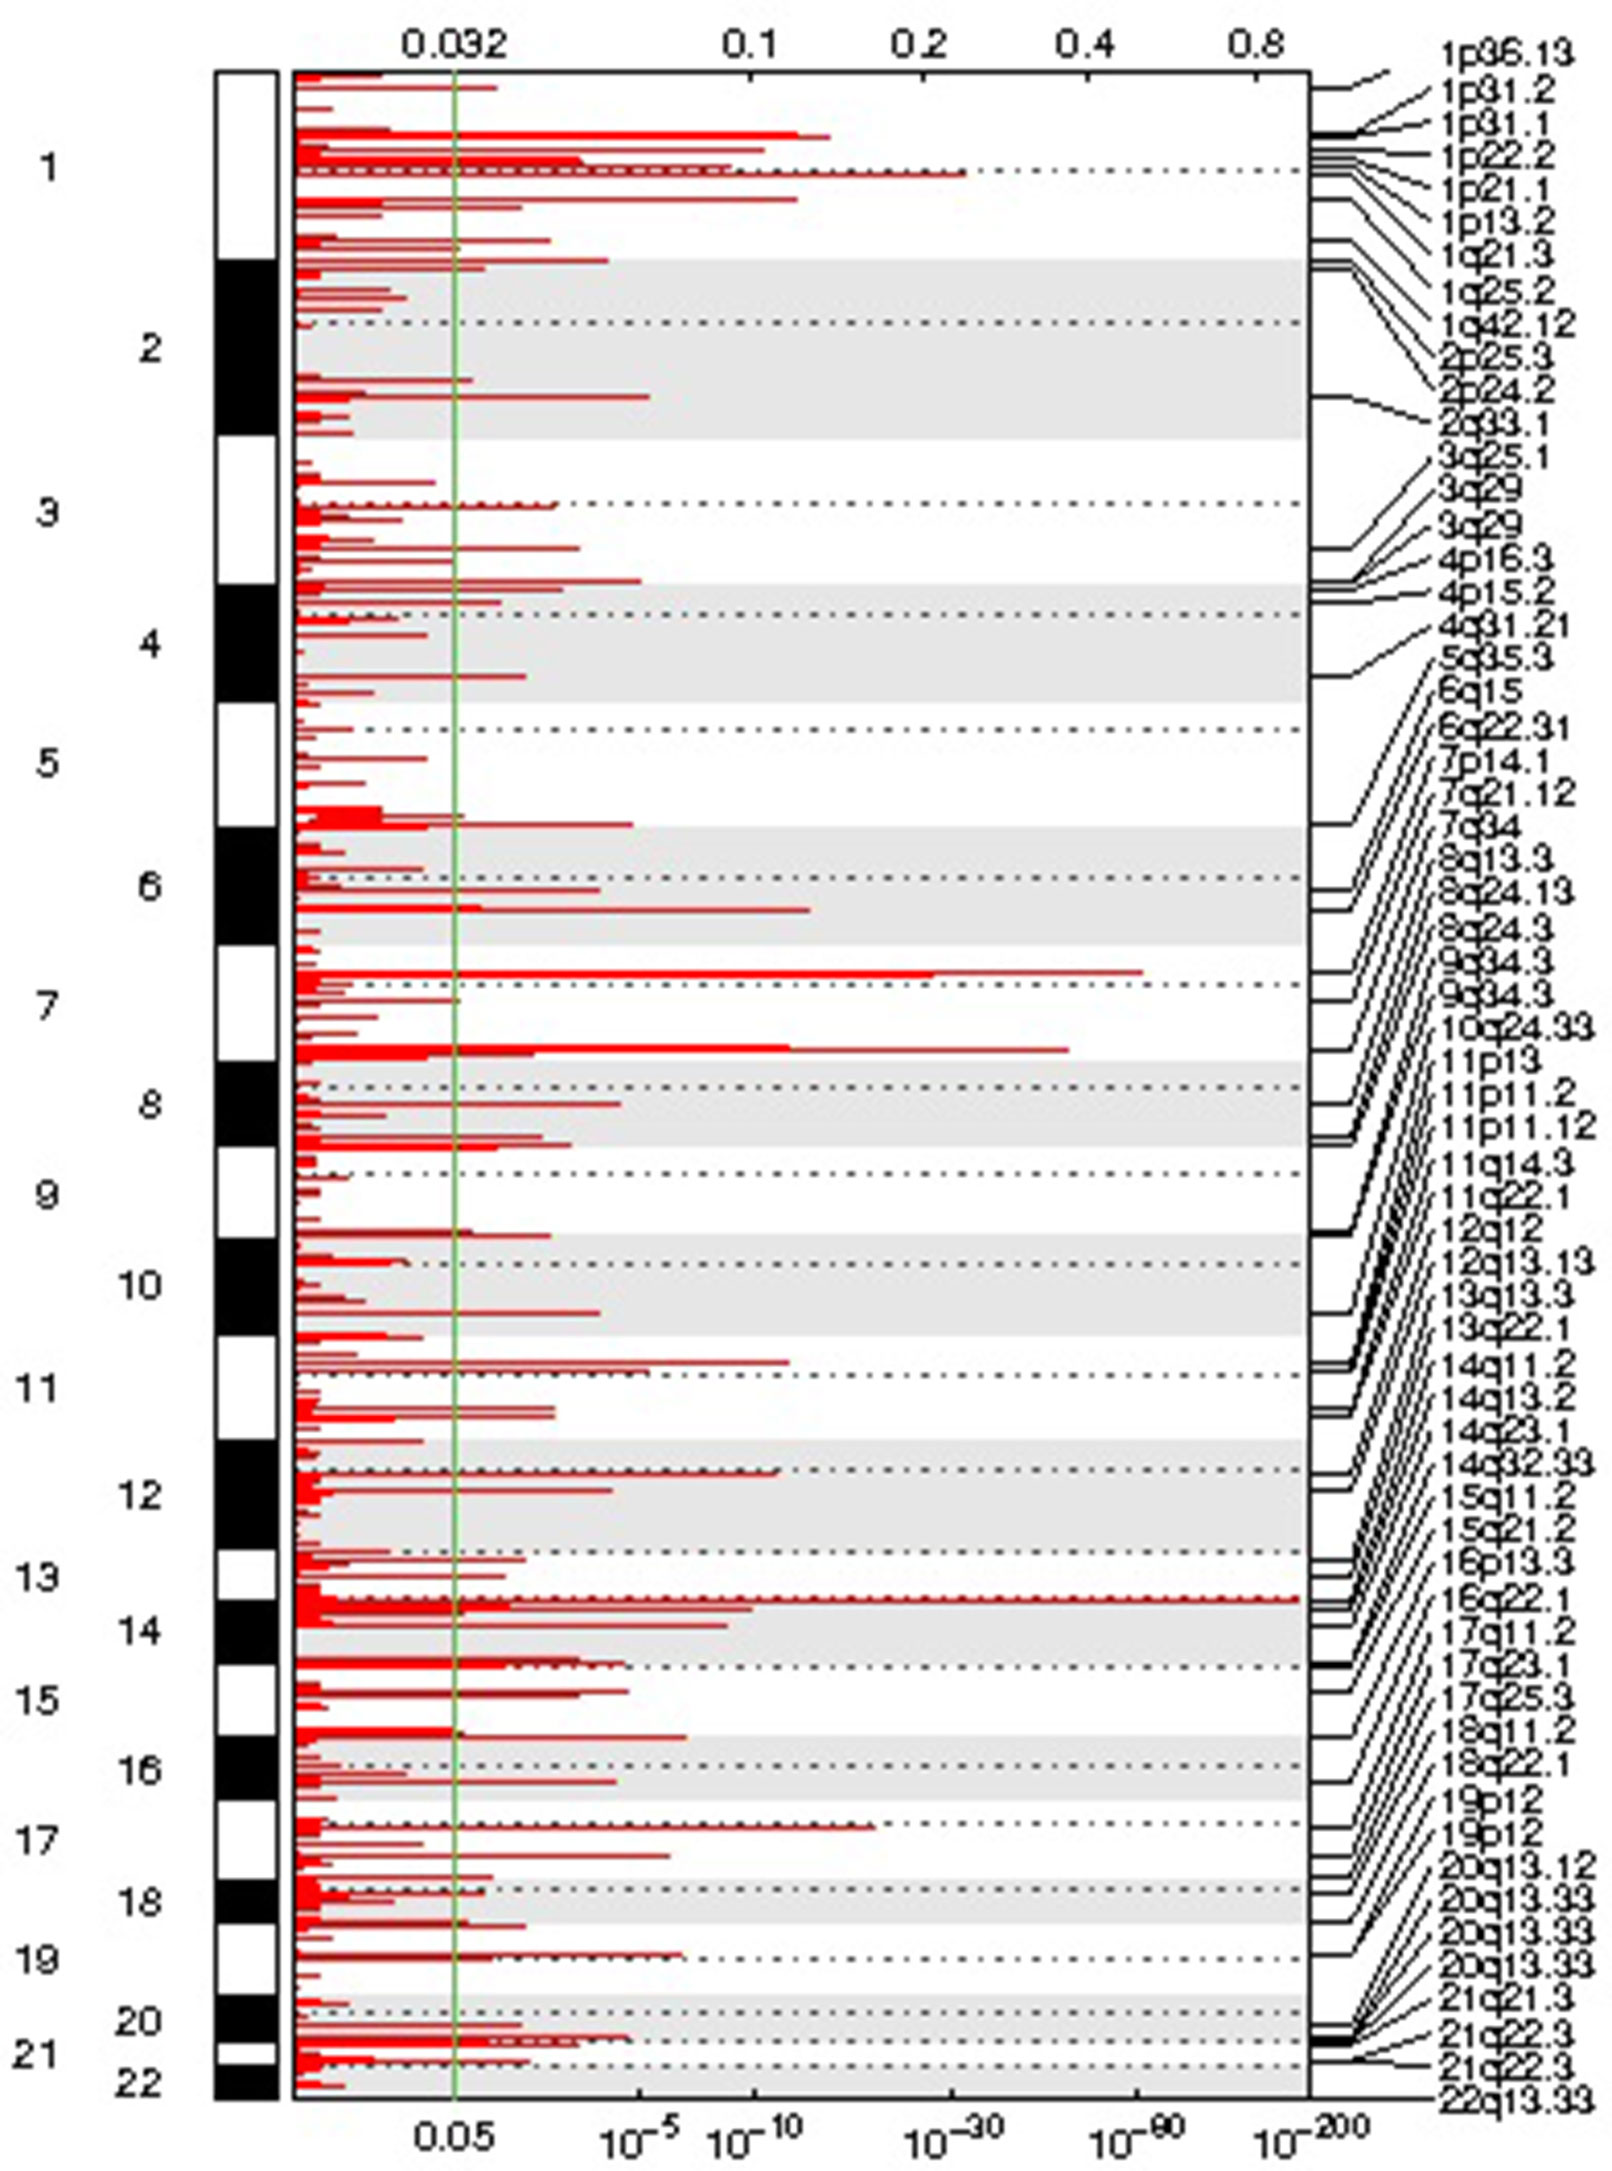
Figure 1 Representation of the focal amplifications detected in the chronic lymphocytic leukemia (CLL) genomes along with their corresponding statistical significance.
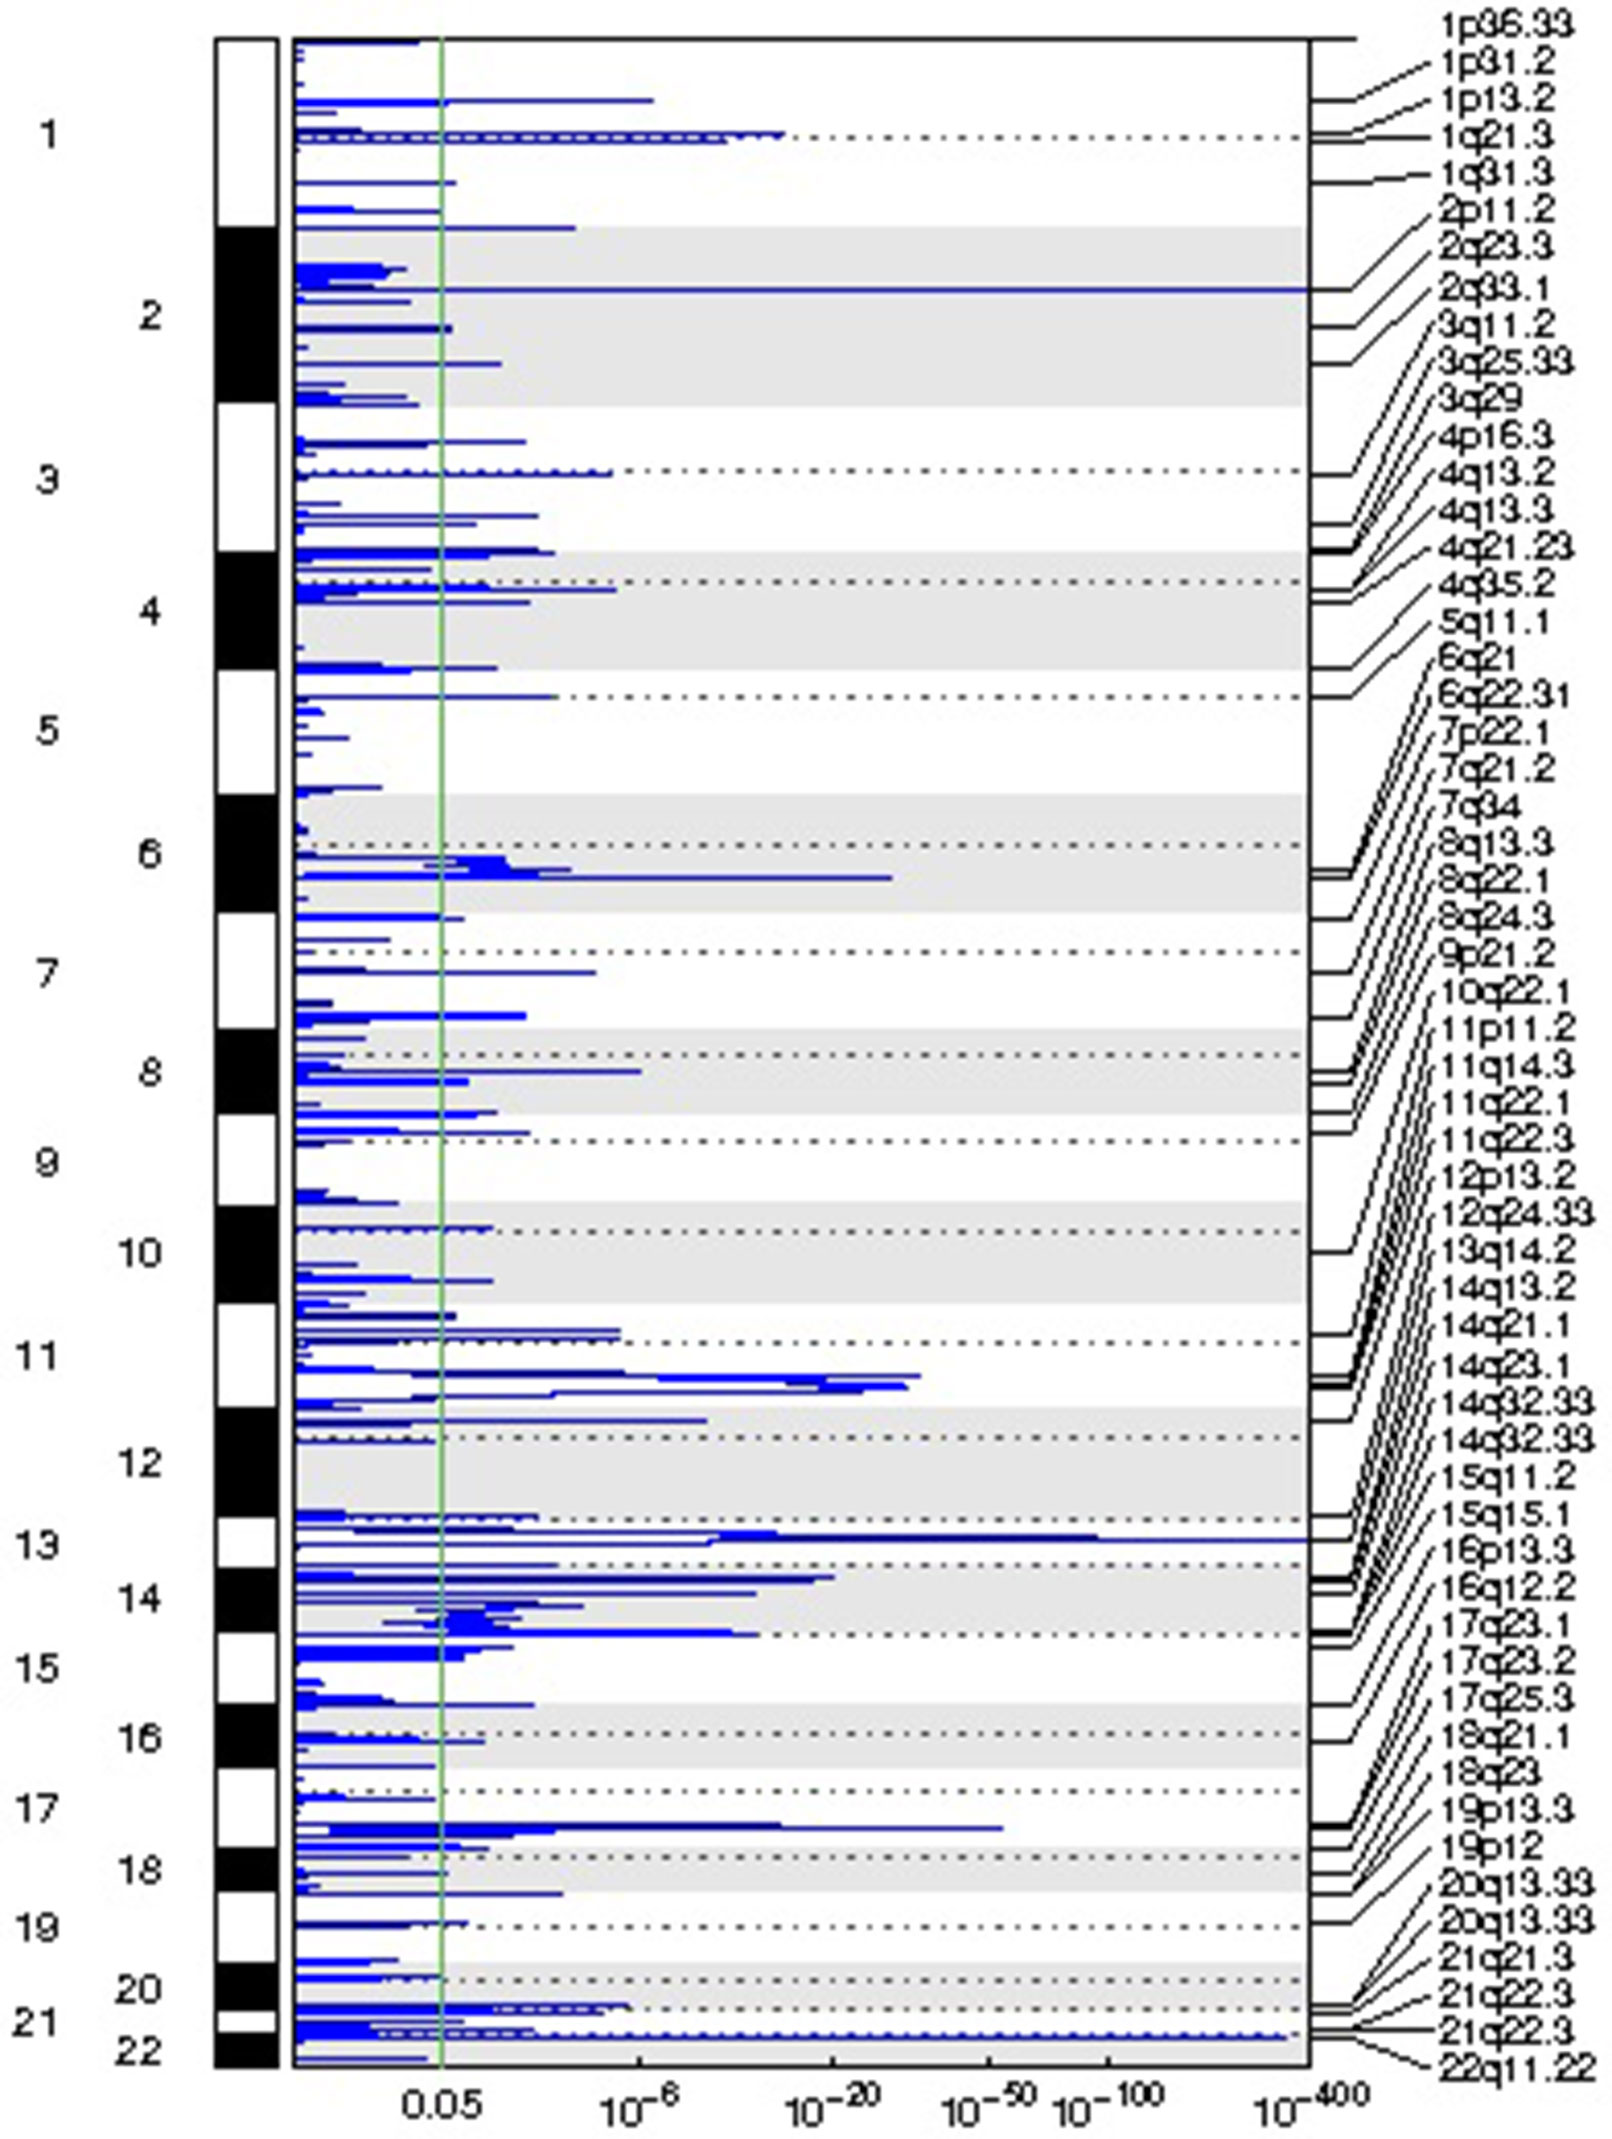
Figure 2 Representation of the focal deletions detected in the chronic lymphocytic leukemia (CLL) genomes along with their corresponding statistical significance.
The most frequently amplified regions were found in 11p13 (adjacent to the WT1 locus), 8q24.13 (FAM91A1), 3q25.1 (PFN2 and RNF13), 18q22.1 (TMX3), 3q29 (ACAP2), 17q11.2 (SUZ12), 14q32.33 (adjacent to the AKT1 locus), 13q13.3 (NBEA/BCL8B), 1q25.2 (RFWD2), 5q35.3 (FLT4), 19p13.3 (adjacent to the APC2 locus), 1p22.2 (HFM1), and 1p31.1. Similarly, the most recurrent focal deletions were detected in 13q14.2 (DLEU1 locus), 11q22.3 (ATM locus), 14q21.1 (MIA2), 11q14.3 (NOX4), 14q32.33 (IGH locus), and 4q13.2 (UGT2B15 and UGT2B17 loci). Moreover, we observed frequent deletions of immunoglobulin loci and recurrent amplified regions at TCR genes, likely reflecting deletions present in the T lymphocytes within control samples.
Three focal deletions were associated with TTT (BH q-value < 0.05): 11q22.3 (ATM locus), 14q32.33 (IGH locus), and 7q21.2 (CDK6 locus). 11q22.3 loss was associated with shorter survival too. No event was associated with TTT or OS after adjusting for IGHV status, sex, and disease stage (BH q-value < 0.05). No recurrent gain was associated with treatment-free survival or OS. The association results can be consulted in Supplementary Table 1.
Furthermore, SETD2 deletions (nine cases) and IRF4 gains (five cases) were nearly significant (GISTIC residual q-values of 0.08 and 0.06, respectively) and associated with clinical evolution. SETD2 deletion was associated with shorter treatment free survival (p-value 1.3 × 10⁻⁸) independent of IGHV status, sex, and disease stage (p-value 2.3 × 10⁻³); and it was also associated with shorter survival (p-value 9.9 × 10⁻³) but not independently of IGHV status (p-value 0.24). Amplifications in IRF4 were associated with shorter survival (p-value 6.4 × 10⁻⁵) in a partially IGHV-independent manner (p-value 0.025). Nevertheless, this finding must be interpreted with caution due to the position of IRF4 near the telomeric end of the short arm of chromosome 6.
Correlation of Focal CNAs With Gene Expression
We detected significant correlations between some recurrent CNAs and their correspondingly encoded genes (Supplementary Table 2). As expected, deletions in 11q22.3 and 13q14.2 and the expression of their respective genes (ATM, FDX1, and RDX in the first case, and DLEU1, DLEU2, and KCNRG in the second case). Deletions in 6q21 were correlated with lower expression of CDK19, and so did those in 14q21.1 with the expression of MIA2. Furthermore, we detected significant correlations between amplifications in 3q25.1 and 3q29 and expression of their target genes PFN2 and ACAP2, respectively. Surprisingly, an inverse correlation was observed between 11q14.3 deletions and FOLH1B expression.
Similarly, we detected significant correlations between 19 of these CNAs and the expression of 926 protein-coding genes (q-value < 0.01; Supplementary Table 3). The CNAs with more correlated genes were deletions in 13q14.2 (389 genes), 12q24.33 (ULK1 locus, 170 genes), 6q21 (CDK19 locus, 79 genes), 11q22.3 (ATM locus, 39 genes), and 3q25.33 (IL12A locus, 26 genes), as well as amplifications in 18q22.1 involving TMX3 (135 genes).
Nonetheless, this study is probably underpowered to detect CNA–transcript correlations due to the fact that only 50% of the exome-seq samples had matched RNAseq data of purified CLL cells.
Broad CNA Regions and Their Association With Clinical Evolution
Recurrent broad amplifications and deletions were detected in the CLL genome (Table 3, Supplementary Figure 1). Among the amplifications, the most frequent were found in chromosomes 12 (60 cases, 13.6% of patients), 2p (10 patients), 8q (6 patients), 18q (6 patients), 18p (5 patients), and 3q (5 patients). Similarly, the most recurrent large deletions were detected in 17p (8 patients), 18p (7 patients), and 8p (6 patients).
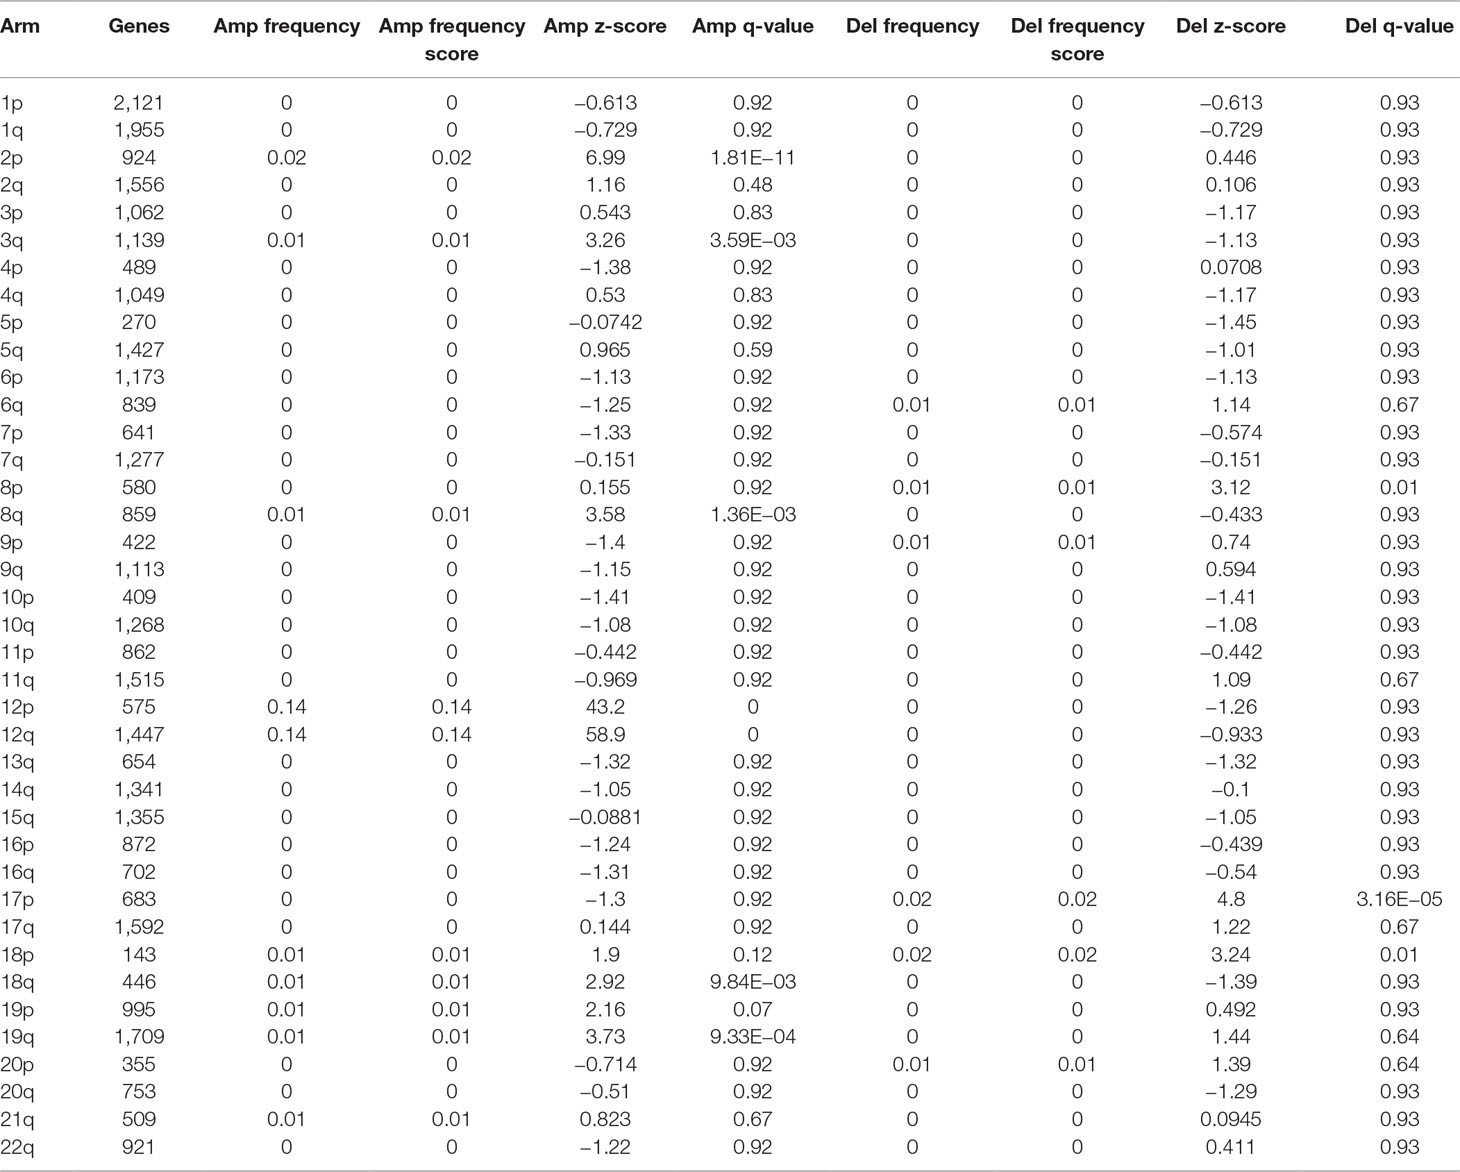
Table 3 Significantly enriched broad cytogenetic aberrations in the chronic lymphocytic leukemia (CLL) genome.
Amplifications in chromosomes 12, 2p, and 8q, as well as deletion of 17p, were significantly associated with shorter TTT (Supplementary Tables 4 and 5). Furthermore, deletion of 17p was significantly associated with TTT independently of IGHV status, sex, and Binet staging. Amplifications in chromosomes 12 and 8q were associated with shorter OS, but no event was significant after adjusting for IGHV status, age, and Binet staging. Nonetheless, we detected a significant difference in OS and TTT between IGHV-mutated cases with and with and without trisomy 12 (Figures 3A, B respectively).
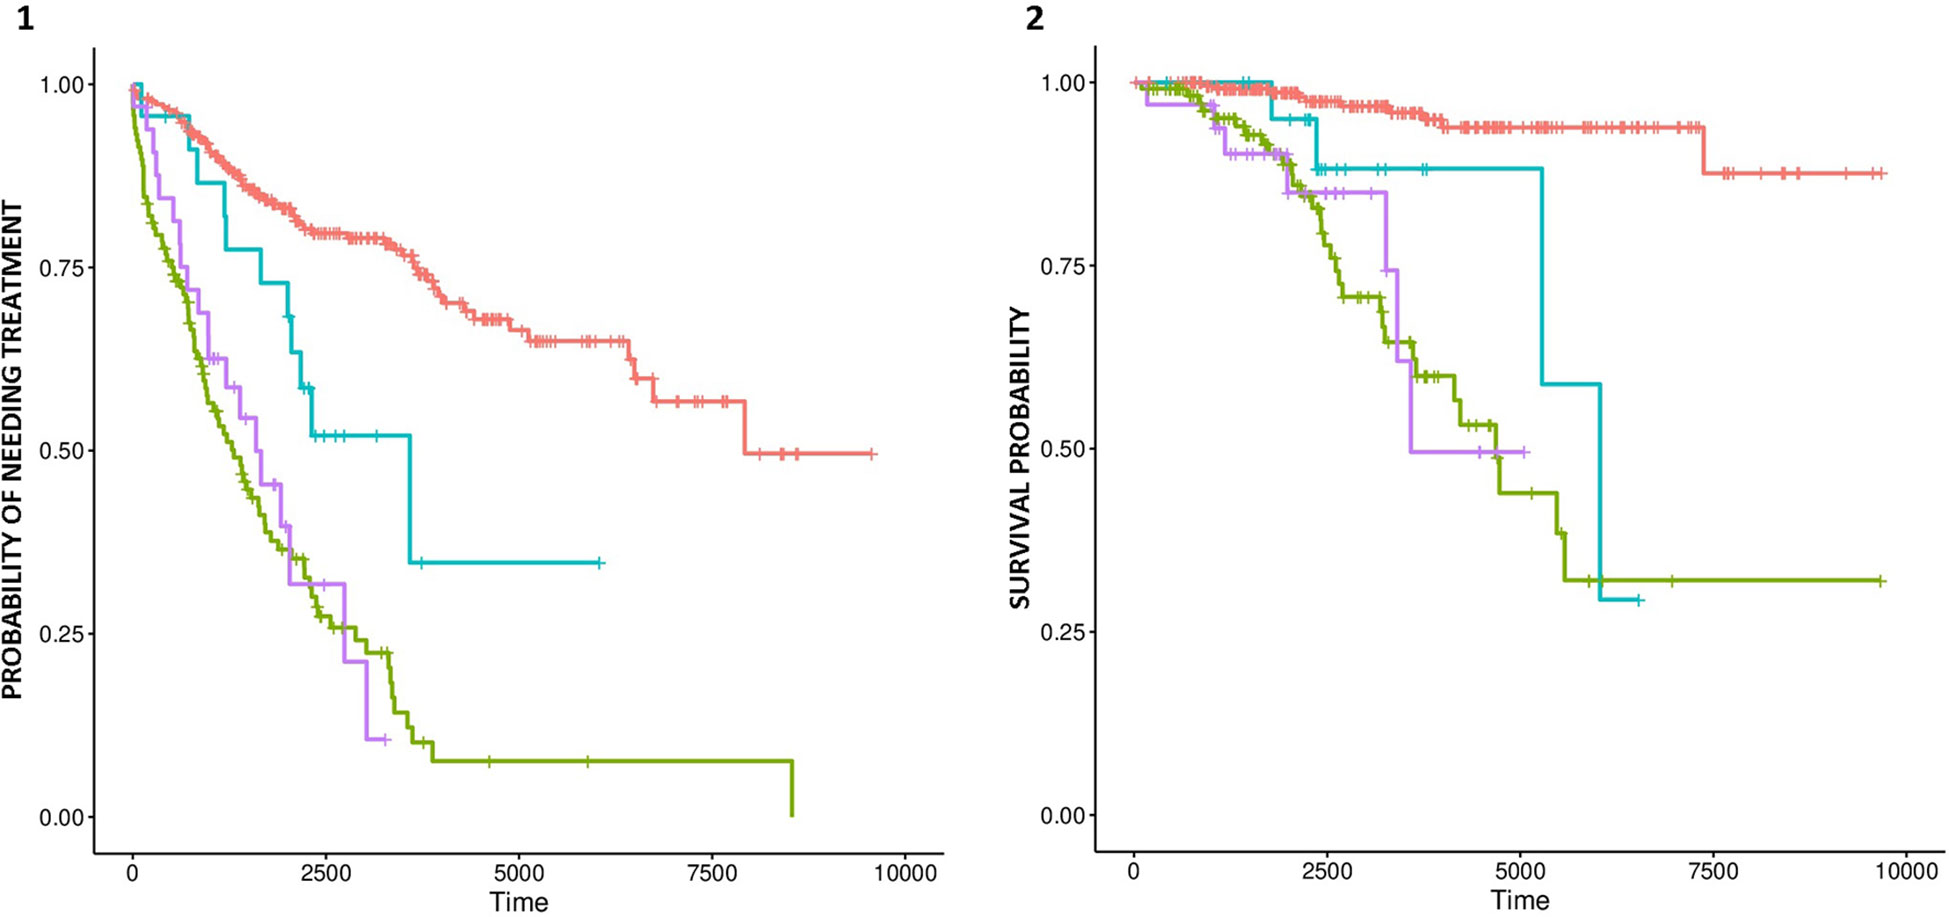
Figure 3 Probability of treatment need (A) and survival (B) for trisomy 12-negative patients with mutated IGHV (red line), trisomy 12-positive patients with mutated IGHV (blue line), trisomy 12-negative patients with unmutated IGHV (green line), and trisomy 12-positive patients with unmutated IGHV patients (purple line).
Regions of CNN-LOH
Control-FREEC identified 63 regions of CNN-LOH with a genotype uncertainty below 5% (Supplementary Table 6). Ten events were located at 1p, six of which affected ARID1A. By comparing with mutation data published by Puente et al. (2015), none of these samples bore concurrent non-synonymous mutations in ARID1A. Other three events were detected at 1q, with a minimally affected region on 1q21.3, which holds likely driver genes such as PI4KB and IL6R/CD126. Four CNN-LOH events with a minimally involved region in 9q34.13–q34.3 involved the NOTCH1 gene. One of these cases also had a frameshift deletion in NOTCH1. Three events at 11p15.5–15.4 affected the imprinted locus of IGF2 and CDKN1C. Eight CNN-LOH events affected the 11p11.2–q13.2 region. Two different samples had events at 11q involving the ATM locus, both of which also had non-synonymous ATM mutations. Three events were located in 16p13.3–p13.11, which involve the CREBBP gene. None of these had mutations in CREBBP. Ten CNN-LOH events affected chromosome 17, three of which included the TP53 locus. Among the latter, two had non-synonymous mutations in TP53. Four samples had CNN-LOH events at chromosome 20, all of which affect the ASXL1 gene but without any concurrent mutation in it. It is interesting to mention that only two of the CNN-LOH events overlapped with those reported by Puente et al. (2015) using SNP array technology.
Discussion
The detection of new cytogenetic aberrations using targeted sequencing takes advantage of the increased sensitivity of this technique in order to detect small events that would be otherwise difficult to identify using array-based techniques. CLL is characterized by large-scale cytogenetic alterations (Döhner et al., 2000), but focal rearrangements have been studied to a lower extent. Using sequencing data originally produced by Puente et al. (2015), here, we report the existence of 54 putatively recurrent focal CNAs in the CLL genome.
Recurrent focal amplifications were shorter than deletions, mostly involving one or two genes. The most significantly enriched focal gains affected the loci of SUZ12, WT1, HFM1, RFWD2, FLT4, and TTNI3K. On the contrary, focal deletions were wider and tended to span more than two genes. As expected, among the most significant deletions were those in 13q14.2 and in 11q22.3. Nevertheless, other highly significant regions involved the loci of genes such as NOX4, a component of the NADPH oxidase complex (Guo and Chen, 2015), and MIA2, a tumor suppressor gene (Hellerbrand et al., 2008). Deletions in SETD2, 11q22.3, and 14q32.33 were associated with shorter time to first treatment, and gains of IRF4 were independently associated with short survival. Furthermore, we could detect significant positive correlations between six recurrent CNAs and the expression of genes encoded in their respective loci, as well as correlations between 19 CNAs and the expression 926 protein-coding genes genome wide.
Focal recurrent gains and losses tended to target genes that participate in oncogenic pathways. For example, five amplified genes (HFM1, ANAPC10, TAF5, COBRA1, and SYCE3) and one deleted gene (FAM175A/ABRAXAS) are involved in DNA transcription, replication, and repair mechanisms. Both COBRA1 and FAM175A physically interact with the tumor suppressor BRCA1 (Castillo et al., 2014; Yun et al., 2018), whereas ANAPC10 belongs to the anaphase-promoting complex/cyclosome family of proteins that control sister chromatid segregation and cytokinesis (Chang et al., 2014). The amplified genes PHF21A, PCGF6, and SUZ12 encode epigenetic regulators with repressor activity (Iwase et al., 2006; Vizán et al., 2015; Zhao et al., 2017). Other genes targeted by recurrent events participate in important pathways. This is the case of the amplified oncogenes AKT1 (Hyman et al., 2017) and WT1 (Bergmann et al., 1997), and of the receptor tyrosine kinase gene FLT4, which regulates lymphangiogenesis and tumor metastasization to lymphatic vessels (Lee et al., 2016). Likewise, the deleted genes AMD1, TP53INP1, ULK1, and NFATC1 are also important in tumorigenesis. AMD1 and TP53INP1 participate in metabolic pathways, and both have tumor suppressor activity (Scuoppo et al., 2012; Saadi et al., 2015), whereas ULK1 plays a decisive role in autophagy initiation (Zachari and Ganley, 2017) and NFATC1 maintains an anergic phenotype in CLL cells (Märklin et al., 2017). Finally, two cyclin-dependent kinase genes were recurrently deleted: CDK6 and CDK19. Deletions in CDK6 were associated with shorter time to first treatment, whereas those in CDK19 were correlated with a reduced expression of the gene. CDK19 is a component of the mediator kinase module, which associates with the mediator complex in order to regulate diverse cellular functions (Dannappel et al., 2019), and CDK6 is a promoter of cell-cycle progression (Kollmann and Sexl, 2013). The role of both genes in the pathogenesis of CLL needs further clarification.
Finally, recurrent broad cytogenetic aberrations characteristic of CLL were identified at the expected frequency, as in the case of trisomy 12, 17p deletion, amplification of 8q, and loss of 8p (Blanco et al., 2016). Interestingly, we detected a significant adverse time to event and OS effect of trisomy 12 among IGHV-mutated cases. The importance of IGHV mutation as a predictor of disease evolution within the group of patients with trisomy 12 was previously reported by others (Bulian et al., 2017; Roos-Weil et al., 2018), but to our knowledge, this is the first report about the prognostic importance of trisomy 12 among IGHV-mutated cases. Furthermore, new CNN-LOH events affecting CLL drivers were also detected, most of which had not been described in previous array-based analysis of the CLL genome (Novak et al., 2002; Pfeifer et al., 2007). These CNN-LOH events affected the ATM, NOTCH1, TP53, ARID1A, ASXL1, CREBBP, and PI4KB/IL6R loci, as well as the telomeric region of 11p. Only part of these mutations had concurrent mutations in their corresponding driver genes, suggesting the existence of other mechanisms of pathogenicity.
Detection of copy number changes based on exome-sequencing has been proven to be prone to false positives by some studies (Rieber et al., 2017). In this analysis, we have included patient matched control samples, we applied stringent thresholds in order to minimize false detections, and we recapitulated most of the cytogenetic findings of CLL in the expected frequency. Furthermore, we could correlate the presence of this structural aberrations with changes in gene expression in a subgroup of patients, although we believe that this study may be underpowered to detect such associations.
In conclusion, our study presents proof-of-concept evidence for the existence of new focal recurrent CNAs and CNN-LOH in the genome of CLL, some of which influence clinical outcome. Furthermore, we observed that some of these novel events have significant correlations with gene expression changes. The results are concordant with the possible involvement of a set of oncogenes and tumor suppressors in the development of CLL. These results should be considered a “proof of concept,” and their existence and functionality should be validated in the future.
Author Contributions
AM, BA, and JB designed the study. AM performed the research and analyzed the data. AM, BA, JD, MG and JB analyzed the results and wrote the paper.
Funding
This research has been performed without funding. The publication costs associated with this manuscript have been partially paid by Roche Pharmaceuticals. The funder played no role in the study design, data collection, analysis, results interpretation, writing or in the decision to submit this paper for publication.
Conflict of Interest Statement
The authors declare that the research was conducted in the absence of any commercial or financial relationships that could be construed as a potential conflict of interest.
Acknowledgments
The authors gratefully thank CESGA (Supercomputing Center of Galicia) for providing the necessary resources for the development of this project, as well as the International Cancer Research Consortium and the European Bioinformatics Institute for supplying data access.
The content of this paper is part of the doctoral thesis of Adrián Mosquera Orgueira to obtain a PhD at the Department of Medicine, University of Santiago de Compostela.
Supplementary Material
The Supplementary Material for this article can be found online at: https://www.frontiersin.org/articles/10.3389/fgene.2019.00854/full#supplementary-material
Supplemental Figure 1 | Heatmap representation of genomic profiles made using segmented copy number data of the CLL genomes.
Supplementary Table 1 | Association of focal amplifications and deletions with TTT and OS. Only those events affecting at least 5 patients of this cohort were selected for the analysis.
Supplementary Table 2 | Significant correlations detected between CNA events and expression of genes encoded in their respective loci.
Supplementary Table 3 | Significant correlations detected between CNA events and any protein-coding genes genome-wide (q-value <0.01).
Supplementary Table 4 | Association of large-scale deletions with TTT and OS. Only those events affecting at least 5 patients of this cohort were selected for the analysis.
Supplementary Table 5 | Association of large-scale amplifications with TTT and OS. Only those events affecting at least 5 patients of this cohort were selected for the analysis.
Supplementary Table 6 | Summary of the detected LOH events detected, along with candidate gene annotation and its mutation status in the data published by Puente et al.
References
Bergmann, L., Miething, C., Maurer, U., Brieger, J., Karakas, T., Weidmann, E., et al. (1997). High levels of Wilms’ tumor gene (wt1) mRNA in acute myeloid leukemias are associated with a worse long-term outcome. Blood 90, 1217–1225.
Beroukhim, R., Getz, G., Nghiemphu, L., Barretina, J., Hsueh, T., Linhart, D., et al. (2007). Assessing the significance of chromosomal aberrations in cancer: methodology and application to glioma. Proc. Natl. Acad. Sci. U. S. A. 104 (50), 20007–20012. doi: 10.1073/pnas.0710052104
Blanco, G., Puiggros, A., Baliakas, P., Athanasiadou, A., García-Malo, M., Collado, R., et al. (2016). Karyotypic complexity rather than chromosome 8 abnormalities aggravates the outcome of chronic lymphocytic leukemia patients with TP53 aberrations. Oncotarget 7 (49), 80916–80924. doi: 10.18632/oncotarget.13106
Boeva, V., Popova, T., Bleakley, K., Chiche, P., Cappo, J., Schleiermacher, G., et al. (2012). Control-FREEC: a tool for assessing copy number and allelic content using next-generation sequencing data. Bioinformatics 28, 423–425. doi: 10.1093/bioinformatics/btr670
Breese, M. R., Liu, Y. (2013). NGSUtils: a software suite for analyzing and manipulating next-generation sequencing datasets. Bioinformatics 29, 494–496. doi: 10.1093/bioinformatics/bts731
Bulian, P., Bomben, R., Bo, M. D., Zucchetto, A., Rossi, F. M., Degan, M., et al. (2017). Mutational status of IGHV is the most reliable prognostic marker in trisomy 12 chronic lymphocytic leukemia. Haematologica 102 (11), e443–e446. doi: 10.3324/haematol.2017.170340
Castillo, A., Paul, A., Sun, B., Huang, T. H., Wang, Y., Yazinski, S. A., et al. (2014). The BRCA1-interacting protein Abraxas is required for genomic stability and tumor suppression. Cell Rep. 8 (3), 807–817. doi: 10.1016/j.celrep.2014.06.050
Chang, L. F., Zhang, Z., Yang, J., McLaughlin, S. H., Barford, D. (2014). Molecular architecture and mechanism of the anaphase-promoting complex. Nature 513 (7518), 388–393. doi: 10.1038/nature13543
Dannappel, M. V., Sooraj, D., Loh, J. J., Firestein, R. (2019). Molecular and in vivo functions of the CDK8 and CDK19 kinase modules. Front. Cell Dev. Biol. 6, 171. doi: 10.3389/fcell.2018.00171
Döhner, H., Stilgenbauer, S., Benner, A., Leupolt, E., Kröber, A., Bullinger, L., et al. (2000). Genomic aberrations and survival in chronic lymphocytic leukemia. N. Engl. J. Med. 343, 1910–1916. doi: 10.1056/NEJM200012283432602
Edelmann, J., Tausch, E., Landau, D. A., Robrecht, S., Bahlo, J., Fischer, K., et al., (2017). Frequent evolution of copy number alterations in CLL following first-line treatment with FC(R) is enriched with TP53 alterations: results from the CLL8 trial. Leukemia 31, 734–738. doi: 10.1038/leu.2016.317
Gruber, M., Bozic, I., Leshchiner, I., Livitz, D., Stevenson, K., Rassenti, L., et al. (2019). Growth dynamics in naturally progressing chronic lymphocytic leukaemia. Nature 570 (7762), 474–479. doi: 10.1038/s41586-019-1252-x
Guo, S., Chen, X. (2015). The human Nox4: gene, structure, physiological function and pathological significance. J. Drug Target. Dec23 (10), 888–896. doi: 10.3109/1061186X.2015.1036276
Hellerbrand, C., Amann, T., Schlegel, J., Wild, P., Bataille, F., Spruss, T., et al. (2008). The novel gene MIA2 acts as a tumour suppressor in hepatocellular carcinoma. Gut 57 (2), 243–251. doi: 10.1136/gut.2007.129544
Hernández-Sánchez, M., Rodríguez-Vicente, A. E., González-Gascón, Y, Marín, I., Quijada-Álamo, M., Hernández-Sánchez, J. M., Martín-Izquierdo, M., et al. (2019). DNA damage response-related alterations define the genetic background of patients with chronic lymphocytic leukemia and chromosomal gains. Exp. Hematol. 72, 9–13. doi: 10.1016/j.exphem.2019.02.003
Hyman, D. M., Smyth, L. M., Donoghue, M. T. A., Westin, S. N., Bedard, P. L., Dean, E. J., et al. (2017). AKT inhibition in solid tumors with AKT1 mutations. J. Clin. Oncol. 35 (20), 2251–2259. doi: 10.1200/JCO.2017.73.0143
Iwase, S., Shono, N., Honda, A., Nakanishi, T., Kashiwabara, S., Takahashi, S., et al. (2006). A component of BRAF–HDAC complex, BHC80, is required for neonatal survival in mice. FEBS Lett. 580 (13), 3129–3135. doi: 10.1016/j.febslet.2006.04.065
Kim, D., Langmead, B., Salzberg, S. L. (2015). HISAT: a fast spliced aligner with low memory requirements. Nat. Methods. 12 (4), 357–360. doi: 10.1038/nmeth.3317
Kim, H. Y., Choi, J. W., Lee, J. Y., Kong, G. (2017). Gene-based comparative analysis of tools for estimating copy number alterations using whole-exome sequencing data. Oncotarget 8 (16), 27277–27285. doi: 10.18632/oncotarget.15932
Kollmann, K., Sexl, V. (2013). CDK6 and p16INK4A in lymphoid malignancies. Oncotarget 4 (11), 1858–1859. doi: 10.18632/oncotarget.1541
Landau, D. A., Tausch, E., Taylor-Weiner, A. N., Stewart, C., Reiter, J. G., Bahlo, J., et al. (2015). Mutations driving CLL and their evolution in progression and relapse. Nature 526, 525–530. doi: 10.1038/nature15395
Lawrence, M., Huber, W., Pagès, H., Aboyoun, P., Carlson, M., Gentleman, R., et al. (2013). Software for computing and annotating genomic ranges. PLoS Comput. Biol. 9 (8), e1003118. doi: 10.1371/journal.pcbi.1003118
Lee, J. Y., Hong, S. H., Shin, M., Heo, H. R., Jang, I. H. (2016). Blockade of FLT4 suppresses metastasis of melanoma cells by impaired lymphatic vessels. Biochem. Biophys. Res. Commun. 478 (2), 733–738. doi: 10.1016/j.bbrc.2016.08.017
Leeksma, A. C., Taylor, J., Wu, B., Gardner, J. R., He, J., Nahas, M., et al. (2019). Clonal diversity predicts adverse outcome in chronic lymphocytic leukemia. Leukemia 33 (2), 390–402. doi: 10.1038/s41375-018-0215-9
Li, H., Durbin, R. (2009). Fast and accurate short read alignment with Burrows–Wheeler transform. Bioinformatics 25, 1754–1760. doi: 10.1093/bioinformatics/btp324
Li, H., Handsaker, B., Wysoker, A., Fennell, T., Ruan, J., Homer, N., et al, 1000 Genome Project Data Processing Subgroup, et al. (2009). 1000 Genome Project Data Processing Subgroup. The Sequence Alignment/Map format and SAMtools. Bioinformatics 25 (16), 2078–2079.
Ljungström, V., Cortese, D., Young, E., Pandzic, T., Mansouri, L., Plevova, K., et al. (2016). Whole-exome sequencing in relapsing chronic lymphocytic leukemia: clinical impact of recurrent RPS15 mutations. Blood 127 (8), 1007–1016. doi: 10.1182/blood-2015-10-674572
Love, M. I., Anders, S., Kim, V., Huber, W. (2015). RNA-seq workflow: gene-level exploratory analysis and differential expression. F1000Res. 14 (4), 1070. doi: 10.12688/f1000research.7035.2
Märklin, M., Heitmann, J. S., Fuchs, A. R., Truckenmüller, F. M., Gutknecht, M., Bugl, S., et al. (2017). NFAT2 is a critical regulator of the anergic phenotype in chronic lymphocytic leukaemia. Nat. Commun. 8 (1), 755. doi: 10.1038/s41467-017-00830-y
Martin, M. (2011). Cutadapt removes adapter sequences from high-throughput sequencing reads. EMBnet J. 17 (1), 10–12. doi: 10.14806/ej.17.1.200
Morgan, M., Pagès, H., Obenchain, V., Hayden, N. (2017). Rsamtools: Binary alignment (BAM), FASTA, variant call (BCF), and tabix file import. R package version 1.30.0, http://bioconductor.org/packages/release/bioc/html/Rsamtools.html.
Nadeu, F., Clot, G., Delgado, J., Martín-García, D., Baumann, T., Salaverria, I., et al. (2018). Clinical impact of the subclonal architecture and mutational complexity in chronic lymphocytic leukemia. Leukemia 32 (3), 645–653. doi: 10.1038/leu.2017.291
Nam, J. Y., Kim, N. K., Kim, S. C., Joung, J. G., Xi, R., Lee, S., et al. (2016). Evaluation of somatic copy number estimation tools for whole-exome sequencing data. Brief. Bioinformatics 17, 185–192. doi: 10.1093/bib/bbv055
Novak, U., Oppliger Leibundgut, E., Hager, J., Mühlematter, D., Jotterand, M., Besse, C., et al. (2002). A high-resolution allelotype of B-cell chronic lymphocytic leukemia (B-CLL). Blood 100, 1787–1794.
Pfeifer, D., Pantic, M., Skatulla, I., Rawluk, J., Kreutz, C., Martens, U. M., et al. (2007). Genome-wide analysis of DNA copy number changes and LOH in CLL using high-density SNP arrays. Blood 109, 1202–1210. doi: 10.1182/blood-2006-07-034256
Puente, X. S., Beàm, S., Valdés-Mas, R., Villamor, N., Gutiérrez-Abril, J., Martín-Subero, J. I., et al. (2015). Non-coding recurrent mutations in chronic lymphocytic leukaemia. Nature 526, 519–524. doi: 10.1038/nature14666
R Development Core Team (2011). R: A Language and Environment for Statistical Computing. Austria: The R Foundation for Statistical Computing: Vienna. ISBN: 3-900051-07-0. Available online at http://www.R-project.org/.
Ramsay, A. J., Martínez-Trillos, A., Jares, P., Rodríguez, D., Kwarciak, A., Quesada, V. (2013). Next-generation sequencing reveals the secrets of the chronic lymphocytic leukemia genome. Clin. Transl. Oncol. 15, 3–8. doi: 10.1007/s12094-012-0922-z
Raponi, S., Del Giudice, I., Marinelli, M., Wang, J., Cafforio, L., Ilari, C., et al. (2018). Genetic landscape of ultra-stable chronic lymphocytic leukemia patients. Ann. Oncol. 29 (4), 966–972. doi: 10.1093/annonc/mdy021
Rieber, N., Bohnert, R., Ziehm, U., Jansen, G. (2017). Reliability of algorithmic somatic copy number alteration detection from targeted capture data. Bioinformatics 33 (18), 2791–2798. doi: 10.1093/bioinformatics/btx284
Roos-Weil, D., Nguyen-Khac, F., Chevret, S., Touzeau, C., Roux, C., Lejeune, J., et al. (2018). Mutational and cytogenetic analyses of 188 CLL patients with trisomy 12: a retrospective study from the French Innovative Leukemia Organization (FILO) working group. Genes Chromosomes Cancer 57 (11), 533–540. doi: 10.1002/gcc.22650
Saadi, H., Seillier, M., Carrier, A. (2015). The stress protein TP53INP1 plays a tumor suppressive role by regulating metabolic homeostasis. Biochimie 118, 44–50. doi: 10.1016/j.biochi.2015.07.024
Scuoppo, C., Miething, C., Lindqvist, L., Reyes, J., Ruse, C., Appelmann, I., et al. (2012). A tumour suppressor network relying on the polyamine-hypusine axis. Nature 487 (7406), 244–248. doi: 10.1038/nature11126
Therneau, T. M. (2015) A Package for Survival Analysis in S. version 2.38, https://CRAN.R-project.org/package=survival.
Therneau, T. M., Grambsch, P. M., (2000). Modeling Survival Data: Extending the Cox Model. New York: Springer, ISBN: 0-387-98784-3. doi: 10.1007/978-1-4757-3294-8
Vizán, P., Beringer, M., Ballaré, C., Di Croce, L. (2015). Role of PRC2-associated factors in stem cells and disease. FEBS J. 282 (9), 1723–1735. doi: 10.1111/febs.13083
Yates, A., Akanni, W., Amode, M. R., Barrell, D., Billis, K., Carvalho-Silva, D., et al. (2016). Ensembl 2016. Nucleic Acids Res. 44 (D1), D710–6. doi: 10.1093/nar/gkv1157
Yu, L., Kim, H. T., Kasar, S., Benien, P., Du, W., Hoang, K., et al. (2017). Survival of Del17p CLL depends on genomic complexity and somatic mutation. Clin. Cancer Res. 23, 735–745. doi: 10.1158/1078-0432.CCR-16-0594
Yun, H., Bedolla, R., Horning, A., Li, R., Chiang, H. C., Huang, T. H., et al. (2018). BRCA1 interacting protein COBRA1 facilitates adaptation to castrate-resistant growth conditions. Int. J. Mol. Sci. 19 (7), Pii: E2104. doi: 10.3390/ijms19072104
Zachari, M., Ganley, I. G. (2017). The mammalian ULK1 complex and autophagy initiation. Essays Biochem. 61 (6), 585–596. doi: 10.1042/EBC20170021
Zare, F., Dow, M., Monteleone, N., Hosny, A., Nabavi, S. (2017). An evaluation of copy number variation detection tools for cancer using whole exome sequencing data. BMC Bioinformatics 18 (1), 286. doi: 10.1186/s12859-017-1705-x
Keywords: copy number aberration, chronic lymphocytic leukemia, driver, time to treatment, overall survival
Citation: Mosquera Orgueira A, Antelo Rodríguez B, Díaz Arias JÁ, González Pérez MS and Bello López JL (2019) New Recurrent Structural Aberrations in the Genome of Chronic Lymphocytic Leukemia Based on Exome-Sequencing Data. Front. Genet. 10:854. doi: 10.3389/fgene.2019.00854
Received: 15 January 2019; Accepted: 16 August 2019;
Published: 20 September 2019.
Edited by:
Shaochun Bai, GeneDx, United StatesReviewed by:
Armand Valsesia, Nestle Institute of Health Sciences (NIHS), SwitzerlandNatasa Djordjevic, University of Kragujevac, Serbia
Copyright © 2019 Mosquera Orgueira, Antelo Rodríguez, Díaz Arias, González Pérez, and Bello López. This is an open-access article distributed under the terms of the Creative Commons Attribution License (CC BY). The use, distribution or reproduction in other forums is permitted, provided the original author(s) and the copyright owner(s) are credited and that the original publication in this journal is cited, in accordance with accepted academic practice. No use, distribution or reproduction is permitted which does not comply with these terms.
*Correspondence: Adrián Mosquera Orgueira, YWRyaWFuLm1vc3F1ZXJhQGxpdmUuY29t