 Xuejuan Shen1†
 Zhiqing Pu
 Robert W. Murphy
 Yongyi Shen
- 1College of Veterinary Medicine, South China Agricultural University, Guangzhou, China
- 2Centre for Biodiversity and Conservation Biology, Royal Ontario Museum, Toronto, ON, Canada
- 3Key Laboratory of Zoonosis Prevention and Control of Guangdong Province, South China Agricultural University, Guangzhou, China
- 4Joint Influenza Research Centre (SUMC/HKU), Shantou University Medical College, Shantou, China
Deep seas have extremely harsh conditions including high hydrostatic pressure, total darkness, cold, and little food and oxygen. The adaptations of fishes to deep-sea environment apparently have occurred independently many times. The genetic basis of adaptation for obtaining their energy remains unknown. Mitochondria play a central role in aerobic respiration. Analyses of the available 2,161 complete mitochondrial genomes of 1,042 fishes, including 115 deep-sea species, detect signals of positive selection in mitochondrial genes in nine branches of deep-sea fishes. Aerobic metabolism yields much more energy per unit of source material than anaerobic metabolism. The adaptive evolution of the mtDNA may reflect that aerobic metabolism plays a more important role than anaerobic metabolism in deep-sea fishes, whose energy sources (food) are extremely limited. This strategy maximizes the usage of energy sources. Eleven mitochondrial genes have convergent/parallel amino acid changes between branches of deep-sea fishes. Thus, these amino acid sites may be functionally important in the acquisition of energy, and reflect convergent evolution during their independent invasion of the harsh deep-sea ecological niche.
Introduction
Oceans constitute the largest habitat on Earth. Most marine organisms live in the shallower, illuminated depths, and only a few live in the vast darkness of the deep seas (Randall and Farrell, 1997). Deep-sea creatures live below the photic zone and experience hundreds of atmospheres of hydrostatic pressure and constant extreme cold (Robison, 2004). Photosynthesis occurs only down to about 100–200 m, and sunlight disappears altogether at 1,000 m or less. At this depth, there is no light for photosynthesis and animals depend on very limited food floating down from the photic zone. Oxygen is also a limited resource in the deep sea (Childress and Seibel, 1998). Thus, deep-sea organisms must survive in extremely harsh conditions.
Fishes are the charismatic megafauna of the deep sea. Evolutionary adaptations to deep-sea life apparently have occurred independently in at least 22 orders of fishes (Randall and Farrell, 1997). Genetic adaptations for vision to the dark environment of the deep sea is studied well (Hunt et al., 2001; Davies et al., 2009), yet other adaptations remain largely unknown. Biomass available as energy at depths exceeding 1,000 m drops to less than 5% of that available in surface waters (Marshall, 1980). Aerobic metabolism yields much more energy per unit of source material than anaerobic metabolism. Thus, aerobic metabolism should play a greater role than anaerobic metabolism to maximize the use of limited energy sources. However, paradoxically, the level oxygen is low in the deep sea (Childress and Seibel, 1998). Furthermore, high hydrostatic pressure affects the functioning of lipid membranes, enzymes, and other macromolecules (Macdonald, 1997; Robison, 2004). Therefore, proteins involved in the aerobic metabolism of deep-sea fishes must function efficiently to obtain energy in the absence of abundant food and oxygen.
Mitochondria play the most prominent role in aerobic metabolism of the cell by producing ATP through the electron transport chain. All 13 of the mitochondrial protein-coding genes are involved in this. Functional constraints on mitochondrial DNA (mtDNA) genes have been suggested to influence the evolution of locomotion (Shen et al., 2009; Shen et al., 2010), climatic adaptation (Sun et al., 2011), high elevation adaptation (low-oxygen and cold climate) (Luo et al., 2008; Gering et al., 2009; Scott et al., 2011; Wang et al., 2011; Gu et al., 2012; Zhou et al., 2014), adaptive evolution in mammals (da Fonseca et al., 2008), and high hydrostatic pressure adaption of deep-sea animals (Siebenaller and Garrett, 2002). Considering the important role played by mtDNA in aerobic respiration, the environment of deep-sea fishes, and the independent occupation of the deep sea by lineages of fishes, herein we test the hypothesis that adaptive evolution of mitochondrial genes plays a role in deep-sea adaptation.
Materials and Methods
Source of Data and Primary Treatments
A total of 2,161 complete mitochondrial genomes of 1,042 fish species were downloaded from NCBI. Considering that human mtDNA is widely studied, we used Cambridge reference sequence for human mtDNA (NC_012920) as the reference to standardize our data. All sequences were aligned by MAFFT with option (FFT-NS-2) (Katoh and Toh, 2010). Information of the depth ranges of these fishes was collected from FishBase (http://www.fishbase.org). Deep-sea fishes often have been considered as those maximum living depth below 1,000 m (Angel, 1997; Pradillon and Gaill, 2007). The depth ranges of 115 species of 1,042 bony fishes fell below 1,000 m (Supplementary Table 1). For some orders of fishes, such as Ateleopodiformes, Lophiiformes, Myctophiformes, and Notacanthiformes, either few data was available, or all of the fishes in the orders were deep-sea dwelling without shallow water-dwelling sister taxa; herein, these fishes were not considered further. Finally, the remaining 77 deep-sea fishes were used in this study. They were classed into nine groups according their phylogenetic positions (Betancur et al., 2013): 1) Anguilliformes; 2) Beryciformes and Stephanoberyciformes; 3) Ophidiiformes; 4) Osmeriformes and Stomiiformes; 5) Perciformes; 6) Carangimorpha; 7) Scombriformes; 8) Pleuronectiformes; and 9) Scorpaeniformes.
Phylogenetic Analysis
Phylogenetic analyses were conducted from 13 concatenated protein-coding genes (ATP6, ATP8, COX1, COX2, COX3, CytB, ND1, ND2, ND3, ND4, ND4L, ND5, and ND6) for nine groups separately by ML and Bayesian inference (BI) analysis as implemented in Phyml v3.0 (Guindon et al., 2010). The best-fit models for nucleotide substitutions were selected by jModelTest v0.1.1 (Posada, 2008; Posada, 2009) (Table 1).
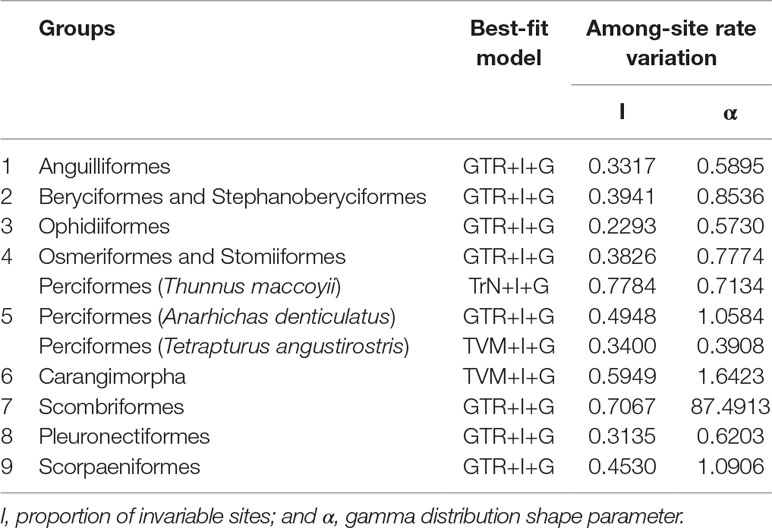
Table 1 Best-fit models for nine deep-sea groups used for phylogenetic reconstruction.
Selection Analyses
Alignments and consensus trees were used for subsequent molecular evolutionary analyses. Positive selection analyses were restricted to those branches leading to the deep-sea fishes. We used a gene-level approach based on the ratio (ω) of nonsynonymous (Ka) to synonymous (Ks) substitutions rates (ω = Ka/Ks) to identify potential positive signals of selection. This analysis employed likelihood ratio tests in the CODEML algorithm of the PAML package (Yang, 1997). Topologies based on single mitochondrial protein-coding genes did not stabilize, while phylogenetic trees that based on combined 13 mitochondrial protein-coding genes were robust. Therefore, we used the combined trees (13 mitochondrial protein-coding genes) for nine groups as guide trees for PAML analyses. The following tests were conducted for 13 genes for nine groups respectively: 1) one-ratio model, which assumes an identical ω value for all branches, was used to detect the overall ω of a gene; and 2) branch-site model was used to determine if these genes had undergone positive selection on a foreground branch. In order to detect whether the positive selection signals were significant, LRT statistics were calculated between branch-site model vs. branch-site model with fixed ω1 = 1 (null model).
Analyses of Convergent and Parallel Evolution
The sequence reconstruction of the ancestor was carried out using the CODEML program implemented in PAML (Yang, 1997). Convergent and parallel amino acid substitutions along deep-sea branches were detected. The statistical significance of the convergent/parallel evolution between two branches was tested by using the method of Zhang and Kumar (1997). Intracellular domains, TM domains, and the extracellular domains of 11 mitochondrial genes were delineated by TMHMM (Sonnhammer et al., 1998; Krogh et al., 2001). Convergent/parallel amino acid sites were mapped to the three-dimensional (3D) protein structures of ND (PDB:5LDX) (Zhu et al., 2016), CytB (PDB:1PPJ) (Huang et al., 2005), and COX (PDB:1V54) (Tsukihara et al., 2003) by using VMD v1.9.3 (Humphrey et al., 1996).
Results
Positive Selection on Nine of 13 Mitochondrial Genes in Deep-Sea Fishes
In this study, 77 of 115 deep-sea fishes, which divided into nine taxonomic groups, were selected for further analysis (Figure 1). The topologies of these nine groups were further constructed and used as the guide tree for positive selection analyses. Analyses using PAML (Yang, 1997) found significant signals of positive selection in the following nine deep-sea branches (Figure 2).
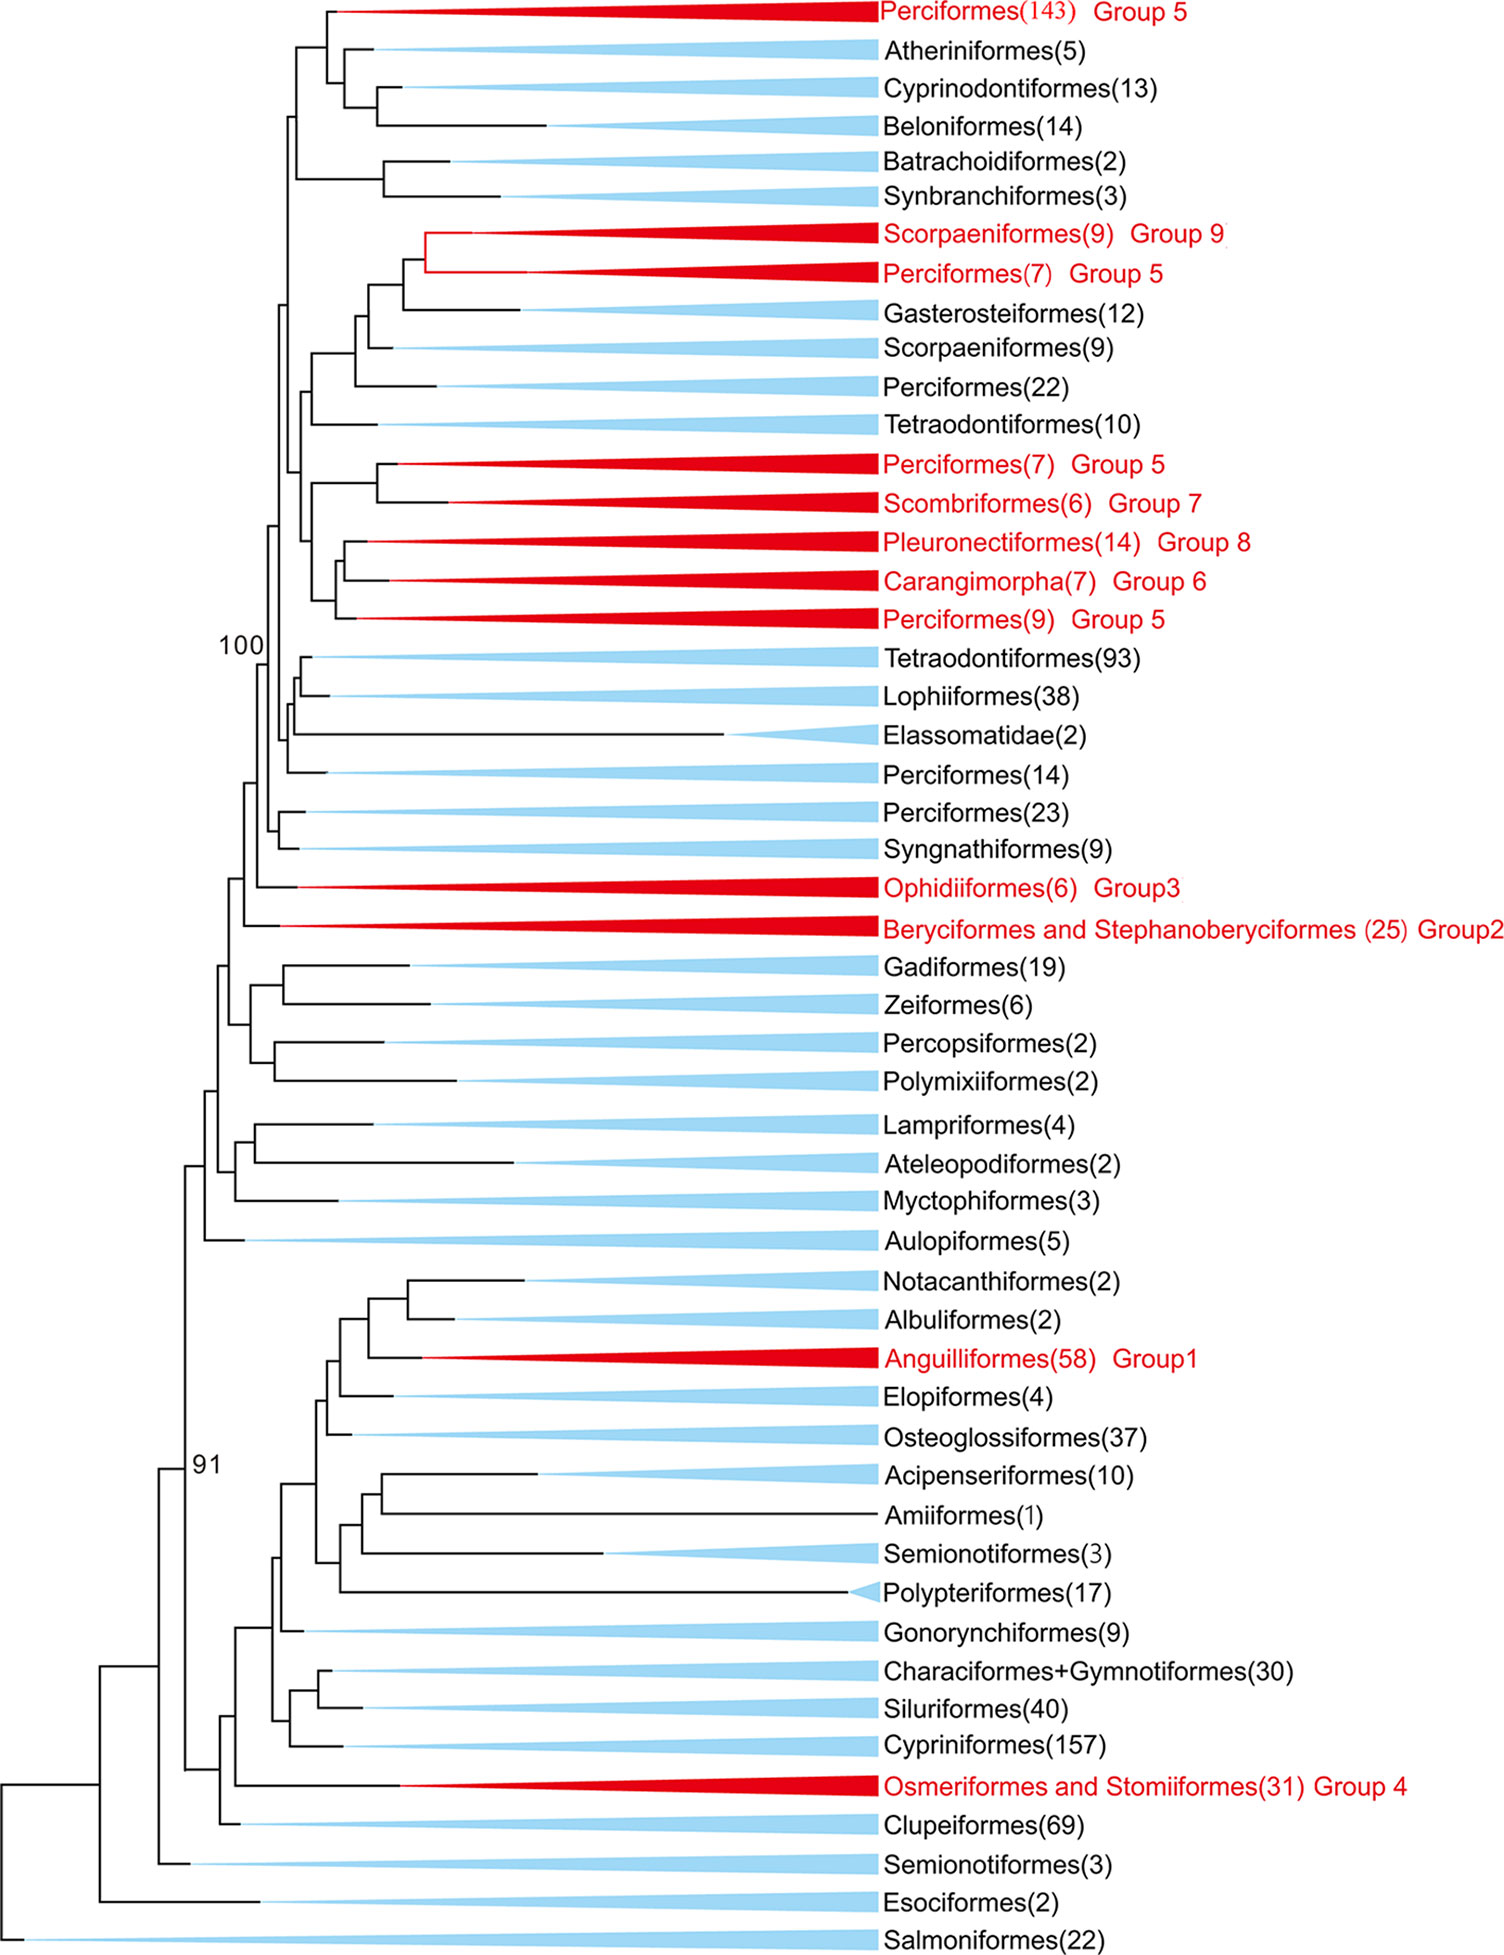
Figure 1 Maximum-likelihood (ML) phylogenetic tree of 1,042 bony fishes. The tree displays 47 orders. The nine groups studied in this study were marked in red. Numbers in the brackets denote available mitochondrial genomes.
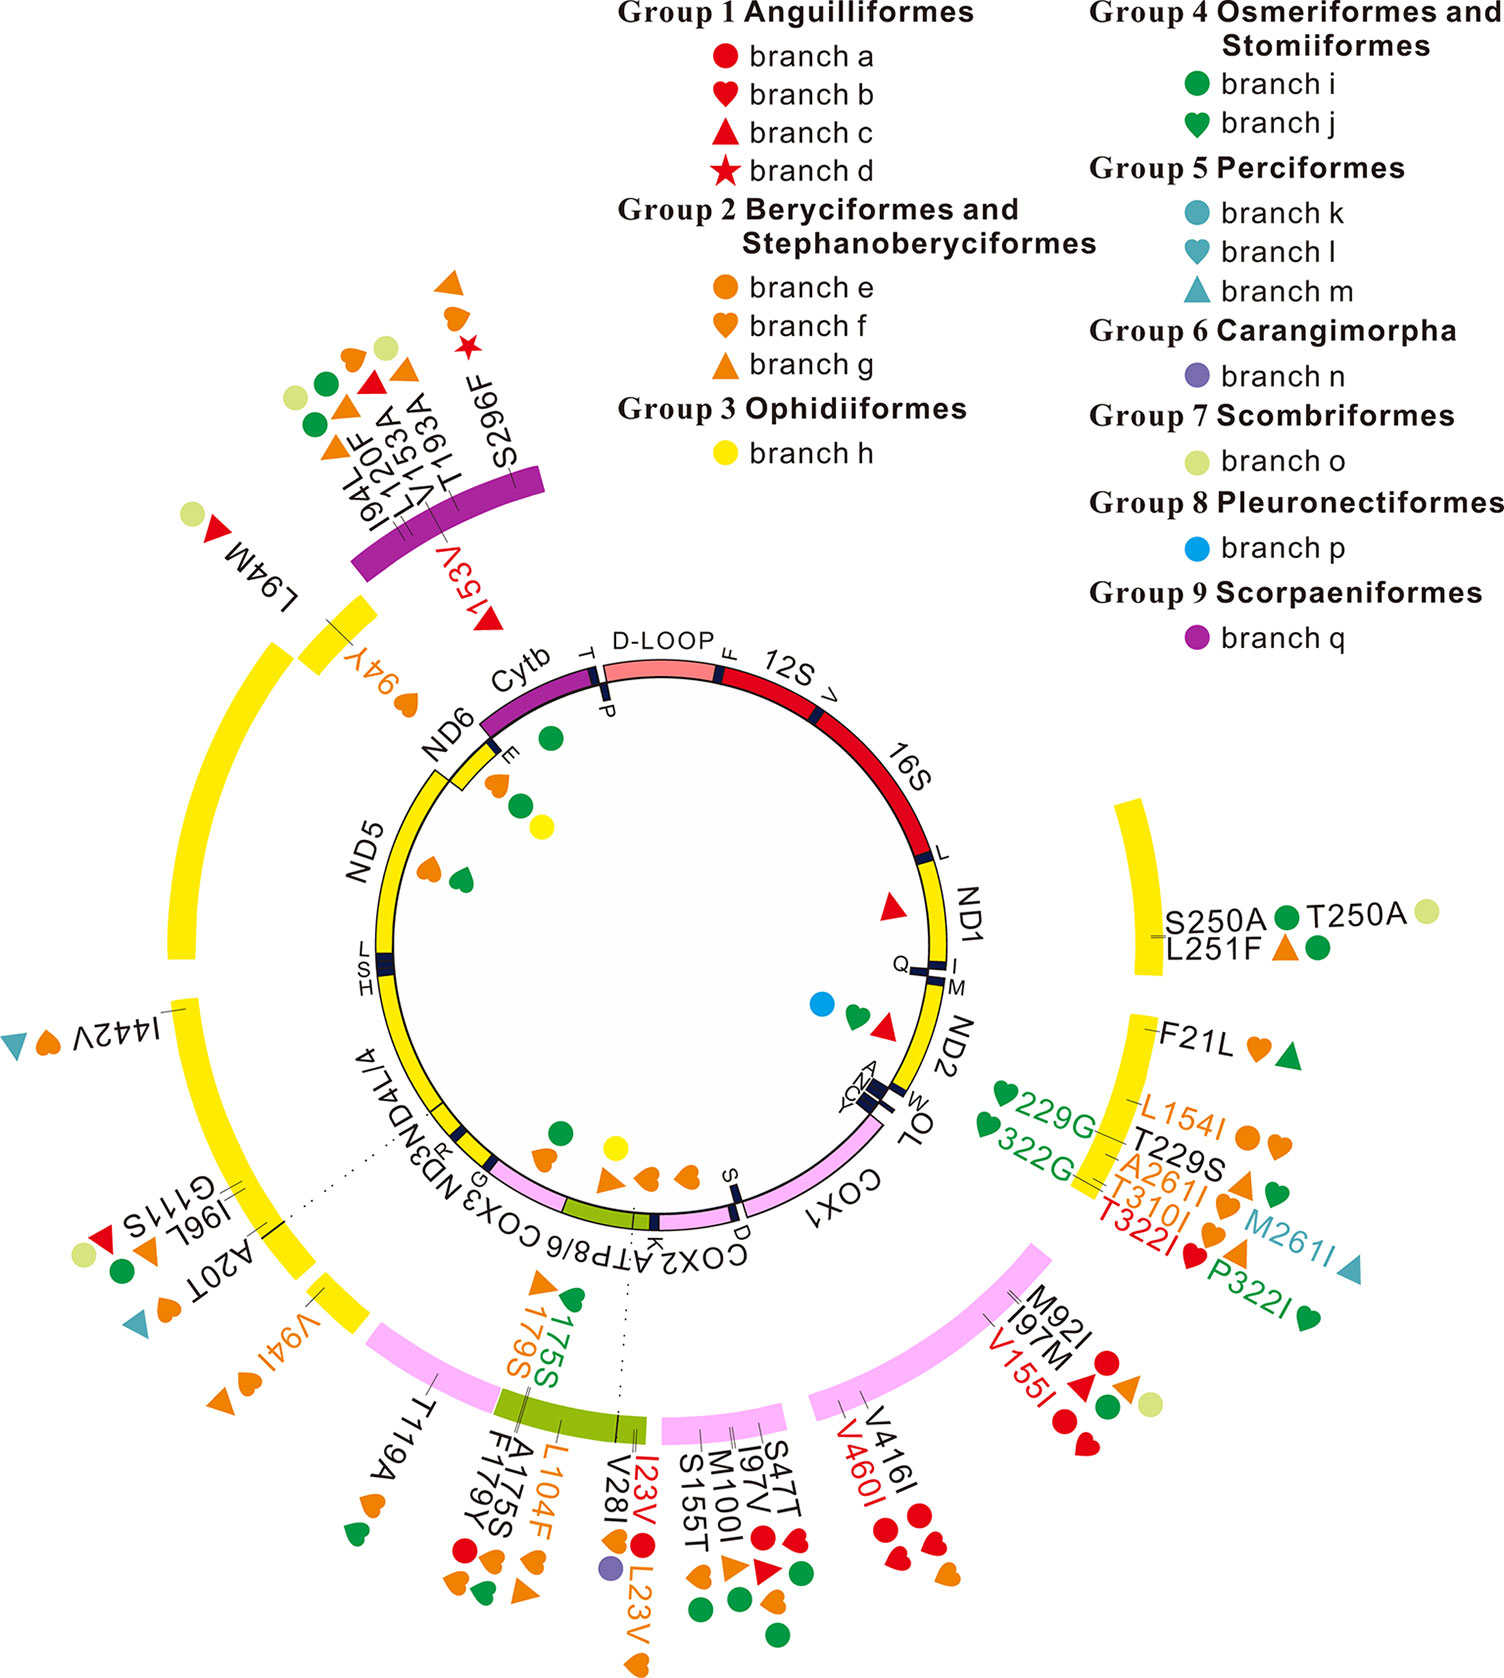
Figure 2 Positive selection and convergent/parallel evolution on 13 mitochondrial protein-coding genes in deep-sea fishes. Symbols inside the interior track denote signals of positive selection and symbols inside the outer track represent those sites that have both signals of positive selection and convergent/parallel evolution. Symbols outside the outer track show convergent/parallel amino acid sites.
Group 1, the true eels (Anguilliformes). Four independent branches of the phylogeny were suggested to have experienced deep-sea adaptation (Supplementary Figure 1). Significant signals of positive selection occurred in ND1 and ND2 in a cluster of deep-sea eels (Supplementary Table 2).
Group 2, Beryciformes and Stephanoberyciformes. At least three independent deep-sea branches were identified (Supplementary Figure 2). ATP6 on branch g (Anoplogaster cornuta) and ATP8, COX2, COX3, ND5, and ND6 on branch f (Diretmoides veriginae and Diretmus argenteus) showed significant signals of positive selection (Supplementary Table 3).
Group 3 (Ophidiiformes), which included a cluster of deep-sea fishes (Supplementary Figure 3). Selection analyses showed that ATP6 and ND6 had significant signals of positive selection on this branch (Supplementary Table 4).
Group 4 (Osmeriformes and Stomiiformes) had three branches of deep-sea fishes (Supplementary Figure 4). Branch i (Lipolagus ochotensis) had significant positive selection signals in COX3, CytB, and ND6, and branch j had significant signals in ND2 and ND5 genes (Supplementary Table 5).
Group 5 (Perciformes). This group had at least three independent events of deep-sea adaptation (Supplementary Figure 5). However, no deep-sea branch had significant signals of positive selection (Supplementary Table 6).
Group 6 (Carangimorpha). The group had one deep-sea branch (Supplementary Figure 6), but no significant signal of positive selection (Supplementary Table 7).
Group 7 (Scombriformes). As Group 6, it had one deep-sea branch (Supplementary Figure 7), but no significant signal of positive selection (Supplementary Table 8).
Group 8 (Pleuronectiformes) had a deep-sea branch p (Hippoglossus and Reinhardtius; Supplementary Figure 8). ND2 showed significant signals of positive selection in this branch (Supplementary Table 9).
Group 9 (Scorpaeniformes). No any signal of positive selection was detected on its deep-sea branch (Supplementary Figure 9, and Supplementary Table 10).
Convergent/Parallel Evolution on 11 of 13 Mitochondrial Genes in Deep-Sea Fishes
Among the 13 mitochondrial protein-genes, 11 genes had convergent/parallel amino acid sites between deep-sea fishes, including 5 convergent amino acid changes and 29 parallel amino acid changes (Figure 2; Table 2). ND1 had one statistically significant (P < 0.01) parallel amino acid change (L251F) and one convergent change (S/T250A, P < 0.001). ND2 had four significant sites of parallel evolution (L154I, T310I, T229S, and F21L), and two sites of significant convergent evolution (A/M261I and T/P322I). ND3 had one statistically significant (P < 0.05) parallel-evolved site (V94I) on branches f and g. ND4 had four parallel amino acid substitutions on deep-sea branches: A20T and I442V on branches f and m (P < 0.001); G111S on branches c and o (P < 0.01); and I96L on branches g and i (P < 0.05). For ND6, branches c and o shared statistically significant (P < 0.01) convergent mutation L/I94M.
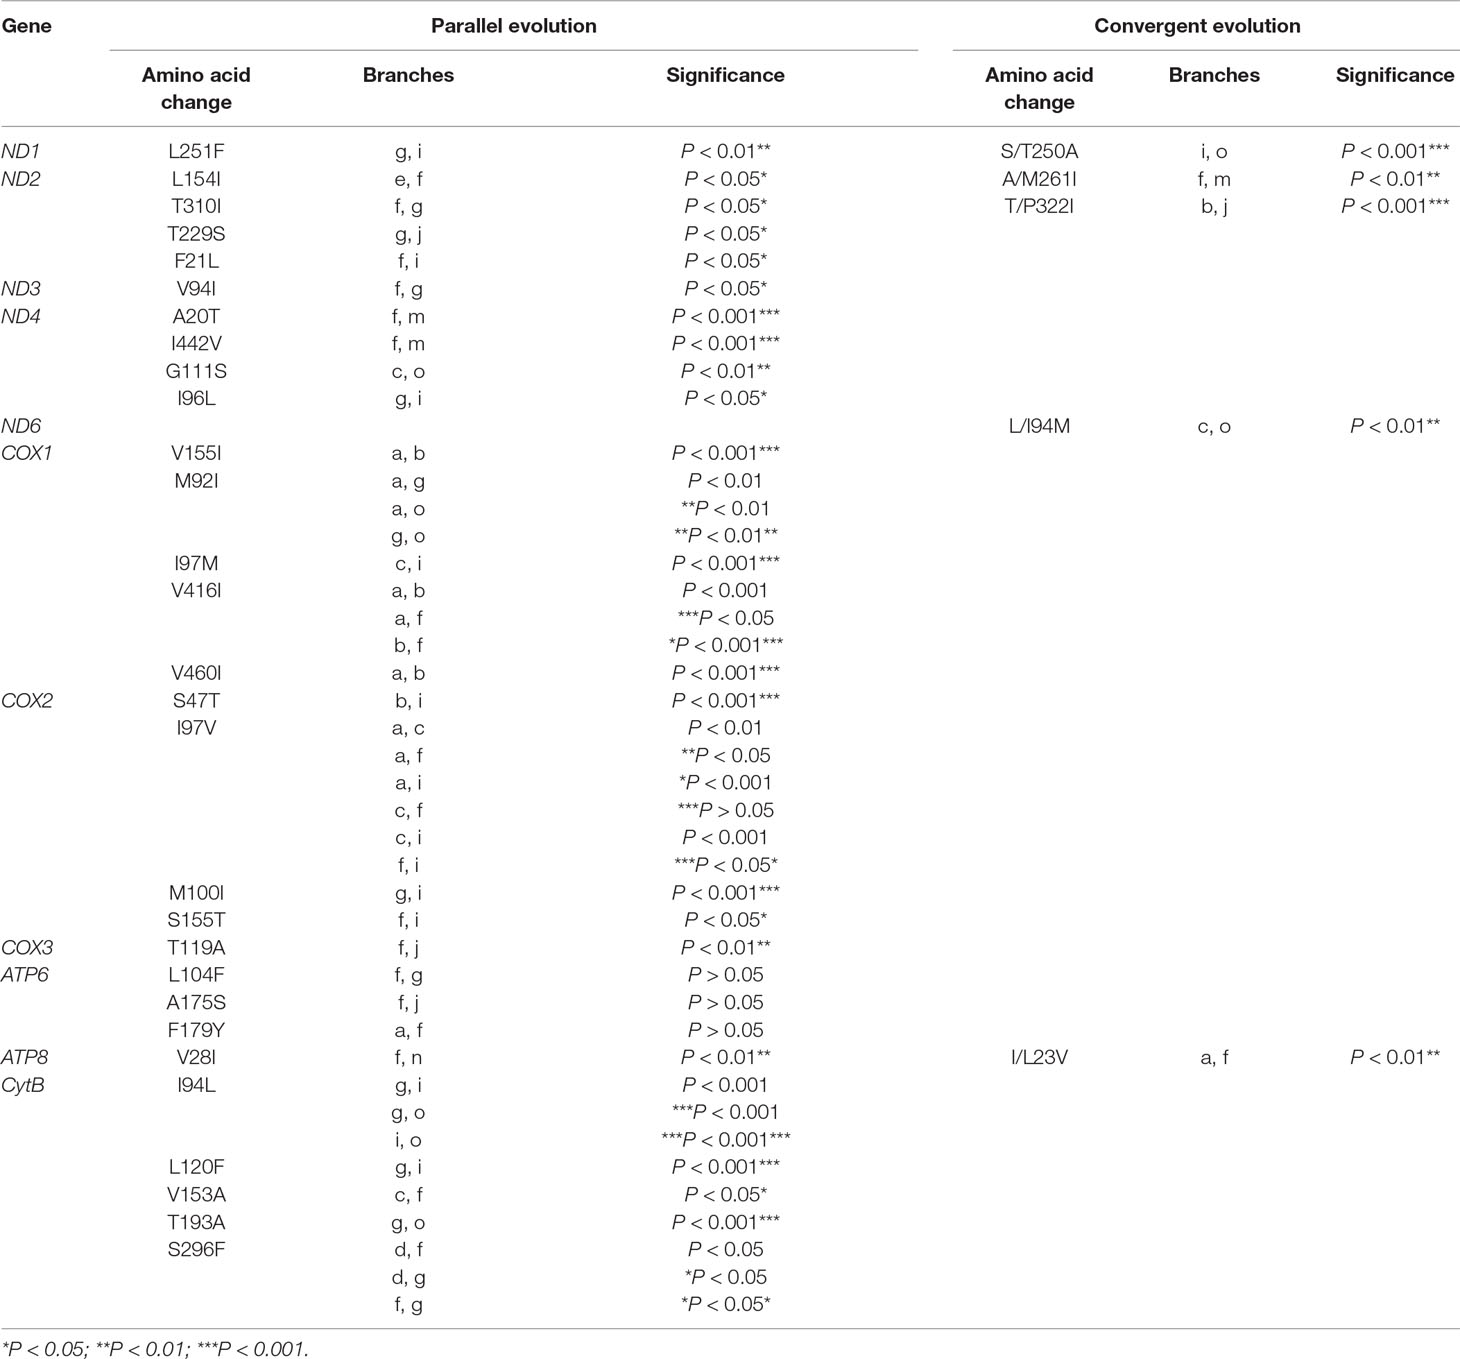
Table 2 Convergent/parallel sites in 11 of 13 mitochondrial protein-coding genes in deep-sea fishes.
COX1 had the following five parallel amino acid sites: V155I and V460I on branches a and b (P < 0.001); I97M on branches c and i (P < 0.001); V416I on branches a, b, and f; and M92I on branches a, g, and o. COX2 had four parallel amino acid changes: I97V was shared by branches a, c, f, and i; S47T on branches b and i (P < 0.001); M100I on branches g and i (P < 0.001); S155T on branches f and i (P < 0.05). COX3 had significant (P < 0.01) parallel substitution T119A on branches f and j.
ATP6 had three parallel amino acid changes (L104F, A175S, and F179Y), but they were not statistically significant (P > 0.05). ATP8 had statistically significant (P < 0.01) parallel site V28I on branches f and n, and a convergent change I/L23V on branches a and f.
CytB had five parallel amino acid changes: I94L on branches g, I, and o; S296F on branches d, f, and g; L120F on branches g and i (P < 0.001); V153A on branches c and f (P < 0.05); and T193A on branches g and o (P < 0.001).
Convergent/parallel amino acid sites in deep-sea fishes were mapped to the available 3D structure of CytB (Figure 3), ND (Supplementary Figure 10), and COX (Supplementary Figure 11) to facilitate interpretations of their positions. Eighteen convergent/parallel amino acid changes located in the transmembrane (TM) domain and the remaining 16 changes were located in other domains. However, all five parallel amino acid changes in CytB protein occurred in TM subunits; two of them (T193A and S296F) changed from neutral polarity to nonpolar amino acids, while the other three did not change their polarity.
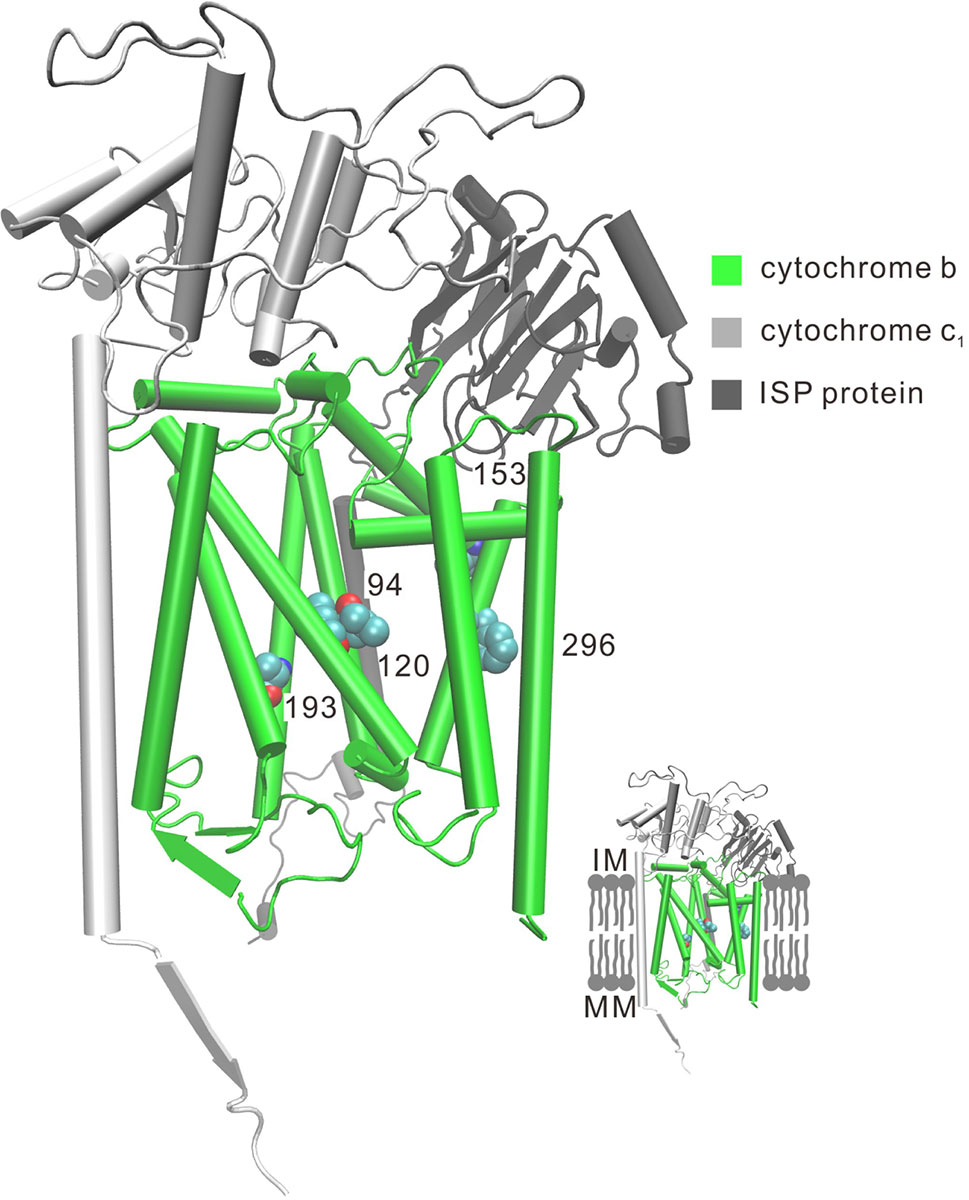
Figure 3 Three-dimensional representation of parallel amino acid sites in deep-sea fishes in cytochrome b. Five parallel amino acid sites I94L, L120F, V153A, T193A, and S296F that occur in the TM subunit in CytB were mapped to the bovine CytB structure (PDB:1PPJ). MM, mitochondria matrix; IM, intermembrane space.
Discussion
Due to the limited sources of food, deep-sea fishes appear to have maximized their usage of energy sources. Aerobic metabolism yields much more energy per unit of source material than anaerobic metabolism. Our study reveals signals of adaptive selection (positive selection and convergent/parallel evolution) in mitochondrial genes of deep-sea fishes (Figure 2). This result corresponds with our hypothesis that aerobic metabolism plays an important role in deep-sea fishes to maximize the usage of limited energy sources.
Positive selection drives the accumulation of advantageous mutations, and thus is associated with the adaptation of new environment and the evolution of new function (Nielsen, 2005; Xiang et al., 2018). During the deep-sea invasions, nine genes (ND1, ND2, ND5, ND6, COX2, COX3, ATP6, ATP8, and CytB) appear to have experienced positive selection. A previous study suggested that ND4, CytB, and ATP8 played a role in the origin of flight in bats to fit for the huge change in energy demand (Shen et al., 2010). Further, ATP6, ND2, and ND4 genes were suggested to associate with high-elevation adaptation in galliform birds (Zhou et al., 2014). All of the 13 mitochondrial genes play important roles in aerobic metabolism, and this may explain why different studies discover different adaptive genes.
Deep-sea fishes have independently invaded deep-sea habitats several times. Due to the similar environmental pressures, convergent/parallel evolution in key genes likely occurs, when similar morphological or physiological changes occur in multiple lineages (Zhang and Kumar, 1997; Shen et al., 2012). To identify genes and amino acid sites that are important for the multiple deep-sea adaptations, our analyses of convergent/parallel evolution detect 5 convergent amino acid changes and 29 parallel amino acid changes in 11 mitochondrial genes (Figure 2, Table 2). Some parallel amino acid changes occur on several branches. For example, I97V in COX2 occurs on four deep-sea branches, and V416I and M92I of COX1 and I94L and S296F of CytB occur on three. Some deep-sea branches have many parallel amino acid changes in one gene. For example, in COX1, branch a has four parallel amino acid changes and branch b has three. Previous assays revealed that convergent/parallel amino acid changes were responsible for convergent/parallel functional changes (Yokoyama and Radlwimmer, 1998; Zhang, 2006). The multiple occurrences of convergent/parallel evolution in mitochondrial proteins in deep-sea fishes suggest that mitochondria play important roles in adaptation of fishes to deep sea. This may also reflect that only a few amino acid sites are critical for mitochondrial adaptation to deep seas.
For the complex of electron transport chains, TM and other domains have approximately the same numbers of convergent/parallel amino acid changes (18 vs. 16, respectively). For the former changes, two of the five parallel amino acid changes (T193A and S296F) in CytB occur in TM subunits of the protein and they change polarity of the amino acids from polar to nonpolar (Figure 3). CytB catalyzes reversible electron transfer from ubiquinol to cytochrome c coupled to proton translocation (Trumpower, 1990). Nonpolar amino acids are mainly hydrophobic. Thus, the parallel hydrophobic changes in the TM subunits likely make the protein more stable. For deep-sea animals, the high hydrostatic pressure orders phospholipid bilayers, causing the fatty acyl chains to pack together more tightly. This property can have extremely detrimental effects on the functioning of the lipid membrane of cells, influencing membrane enzymatic processes (Siebenaller and Garrett, 2002). Proteins of the oxidative phosphorylation (OXPHOS) system are all membrane proteins. The parallel hydrophobic changes in the TM subunits are likely a better fit of the protein to the more viscous membrane fluidity due to high hydrostatic pressure.
Except for ND4L and ND5, the other 11 mitochondrial genes exhibit either positive selection or convergent/parallel signals. Six sites appear to have undergone both positive selection and convergent/parallel evolution (Figure 2). However, further investigation is necessary to determine the roles these genes and sites play in deep-sea adaptation.
Some deep-sea branches do not exhibit signals of positive selection or convergent/parallel evolution. However, adaptive evolution has other mechanisms such as increased densities of mitochondria (Mahalingam et al., 2017), larger mitochondria, changes of gene expression levels, and phenotypic plasticity.
Deep-sea creatures are among the most amazing forms of life. They survive in extremely harsh conditions, such as hundreds of atmospheres of hydrostatic pressure, small amounts of oxygen, very little food, no sunlight, and constant extreme cold. The genetic basis of their adaptation to the deep-sea ecological niche remains a mystery. Our study reveals multiple signals of adaptive evolution (positive selection and convergent/parallel evolution) on mitochondrial genes in deep-sea fishes. Positive selection on mitochondrial genes may help deep-sea fishes to maximize the usage of limited energy sources, and thus drive energetic survival in hash deep-sea environment. In addition, multiple convergent/parallel changes in mitochondrial genes may reflect that these amino acid sites are functional importance for the mitochondria to acquire energy, and reflect convergent evolution during their independently invaded harsh deep-sea habitats.
Data Availability Statement
Publicly available datasets were analyzed in this study. These data can be found here: All the accession numbers were listed in Supplementary Table 1.
Author Contributions
YS conceived and designed the research. XS, ZP, and XC collected and analyzed the data. YS and XS wrote the manuscript. RM revised the manuscript.
Funding
This work was supported by National Natural Science Foundation of China (31822056 and 41666008), Guangdong Natural Science Funds for Distinguished Young Scholar (2014A030306046), start-up funding from South China Agricultural University for YS, and a Visiting Professorship for Senior International Scientists from the Chinese Academy of Sciences to RM.
Conflict of Interest
The authors declare that the research was conducted in the absence of any commercial or financial relationships that could be construed as a potential conflict of interest.
Supplementary Material
The Supplementary Material for this article can be found online at: https://www.frontiersin.org/articles/10.3389/fgene.2019.00925/full#supplementary-material
Figure S1 | Phylogeny of Anguilliformes used for the detection of positive selection. Deep-sea species were marked in red.
Figure S2 | Phylogeny of Beryciformes and Stephanoberyciformes used for detection of positive selection. Deep-sea species were marked in red.
Figure S3 | Phylogeny of Ophidiiformes used for detection of positive selection. Deep-sea species were marked in red.
Figure S4 | Phylogeny of Osmeriformes and Stomiiformes used for detection of positive selection. Deep-sea species were marked in red.
Figure S5 | Phylogeny of Perciformes used for detection of positive selection. Deep-sea species were marked in red.
Figure S6 | Phylogeny of Carangimorpha used for detection of positive selection. Deep-sea species were marked in red.
Figure S7 | Phylogeny of Scombriformes used for detection of positive selection. Deep-sea species were marked in red.
Figure S8 | Phylogeny of Pleuronectiformes used for detection of positive selection. Deep-sea species were marked in red.
Figure S9 | Phylogeny of Scorpaeniformes used for detection of positive selection. Deep-sea species were marked in red.
Figure S10 | Three-dimensional representation of convergent/parallel amino acid sites in deep-sea fishes in the NADH-ubiquinone oxidoreductase chain 1, 2, 3, 4, 4L, 5 and 6. Convergent/parallel amino acid sites within NADH subunits are mapped to the bovine ND structure [PDB:5LDX]. Parallel amino acid sites S250A and L251F occur in ND1; Parallel amino acid sites F21L, L154I, T229S and T310I and convergent amino acid sites A/M261I and T/P322I occur in ND2. ND3 has one parallel amino acid site V94I. Parallel amino acid sites A20T, I96L, G111S and I442V occur in ND4 and parallel amino acid site L94M is in ND6. Red indicates mutations located in intracellular domain, TM subunit sites are in black, and blue shows extracellular domain sites. MM: mitochondrial matrix; IM: intermembrane space.
Figure S11 | Three-dimensional representation of parallel amino acid sites in deep-sea fishes in cytochrome c oxidase subunits I, II and III. Ten parallel amino acid sites map to the bovine COX structure [PDB:1V54]. Sites M92I, I97M, V155I, V416I and V460I occur in COX1, sites S47T, I97V, M100I and S155T are in COX2, and site T119A is in COX3. Mutation sites located in the intracellular domain are shown in red while TM subunit sites are shown in black. MM: mitochondria matrix; IM: intermembrane space.
Table S1 | The depth-range of 115 species of 1,042 bony fishes.
Table S2 | Selective pressure analyses for the 13 genes in Anguilliformes.
Table S3 | Selective pressure analyses for the 13 genes in Beryciformes and Stephanoberyciformes.
Table S4 | Selective pressure analyses for the 13 genes in Ophidiiformes.
Table S5 | Selective pressure analyses for the 13 genes in Osmeriformes and Stomiiformes.
Table S6 | Selective pressure analyses for the 13 genes in Perciformes.
Table S7 | Selective pressure analyses for the 13 genes in Carangimorpha.
Table S8 | Selective pressure analyses for the 13 genes in Scombriformes.
Table S9 | Selective pressure analyses for the 13 genes in Pleuronectiformes.
Table S10 | Selective pressure analyses for the 13 genes in Scorpaeniformes.
References
Angel, M. V. (1997). What is the deep sea? Fish Physiol. 16, 1–14. doi: 10.1016/S1546-5098(08)60226-5
Betancur, R. R., Broughton, R. E., Wiley, E. O., Carpenter, K., Lopez, J. A., Li, C., et al. (2013). The tree of life and a new classification of bony fishes. PLoS Curr. 5 (1), e1001550–e1001550. doi: 10.1371/currents.tol.53ba26640df0ccaee75bb165c8c26288
Childress, J. J., Seibel, B. A. (1998). Life at stable low oxygen levels: adaptations of animals to oceanic oxygen minimum layers. J. Exp. Biol. 201 (8), 1223–1232.
da Fonseca, R. R., Johnson, W. E., O'Brien, S. J., Ramos, M. J., Antunes, A. (2008). The adaptive evolution of the mammalian mitochondrial genome. BMC Genomics 9, 119. doi: 10.1186/1471-2164-9-119
Davies, W. L., Carvalho, L. S., Tay, B. H., Brenner, S., Hunt, D. M., Venkatesh, B. (2009). Into the blue: gene duplication and loss underlie color vision adaptations in a deep-sea chimaera, the elephant shark Callorhinchus milii. Genome Res. 19 (3), 415–426. doi: 10.1101/gr.084509.108
Gering, E. J., Opazo, J. C., Storz, J. F. (2009). Molecular evolution of cytochrome b in high- and low-altitude deer mice (genus Peromyscus). Heredity 102 (3), 226–235. doi: 10.1038/hdy.2008.124
Gu, M., Dong, X., Shi, L., Shi, L., Lin, K., Huang, X., et al. (2012). Differences in mtDNA whole sequence between Tibetan and Han populations suggesting adaptive selection to high altitude. Gene 496 (1), 37–44. doi: 10.1016/j.gene.2011.12.016
Guindon, S., Dufayard, J. F., Lefort, V., Anisimova, M., Hordijk, W., Gascuel, O. (2010). New algorithms and methods to estimate maximum-likelihood phylogenies: assessing the performance of PhyML 3.0. Syst. Biol. 59 (3), 307–321. doi: 10.1093/sysbio/syq010
Huang, L. S., Cobessi, D., Tung, E. Y., Berry, E. A. (2005). Binding of the respiratory chain inhibitor antimycin to the mitochondrial bc1 complex: a new crystal structure reveals an altered intramolecular hydrogen-bonding pattern. J. Mol. Biol. 351 (3), 573–597. doi: 10.1016/j.jmb.2005.05.053
Humphrey, W., Dalke, A., Schulten, K. (1996). VMD: visual molecular dynamics. J. Mol. Graph. 14 (1), 33–38. doi: 10.1016/0263-7855(96)00018-5
Hunt, D. M., Dulai, K. S., Partridge, J. C., Cottrill, P., Bowmaker, J. K. (2001). The molecular basis for spectral tuning of rod visual pigments in deep-sea fish. J. Exp. Biol. 204 (19), 3333–3344.
Katoh, K., Toh, H. (2010). Parallelization of the MAFFT multiple sequence alignment program. Bioinformatics 26 (15), 1899–1900. doi: 10.1093/bioinformatics/btq224
Krogh, A., Larsson, B., von Heijne, G., Sonnhammer, E. L. L. (2001). Predicting transmembrane protein topology with a hidden markov model: application to complete genomes. J. Mol. Biol. 305 (3), 567–580. doi: 10.1006/jmbi.2000.4315
Luo, Y., Gao, W., Gao, Y., Tang, S., Huang, Q., Tan, X., et al. (2008). Mitochondrial genome analysis of Ochotona curzoniae and implication of cytochrome c oxidase in hypoxic adaptation. Mitochondrion 8 (5-6), 352–357. doi: 10.1016/j.mito.2008.07.005
Macdonald, A. G. (1997). Hydrostatic pressure as an environmental factor in life processes. Comp. Biochem. Physiol. A Comp. Physiol. 116 (4), 291–297. doi: 10.1016/S0300-9629(96)00354-4
Mahalingam, S., McClelland, G. B., Scott, G. R. (2017). Evolved changes in the intracellular distribution and physiology of muscle mitochondria in high-altitude native deer mice. J. Physiol. 595 (14), 4785–4801. doi: 10.1113/JP274130
Nielsen, R. (2005). Molecular signatures of natural selection. Annu. Rev. Genet. 39, 197–218. doi: 10.1146/annurev.genet.39.073003.112420
Posada, D. (2008). jModelTest: phylogenetic model averaging. Mol. Biol. Evol. 25 (7), 1253–1256. doi: 10.1093/molbev/msn083
Posada, D. (2009). Selection of models of DNA evolution with jModelTest. Methods Mol. Biol. 537, 93–112. doi: 10.1007/978-1-59745-251-9_5
Pradillon, F., Gaill, F. (2007). Pressure and life: some biological strategies. Rev. Environ. Sci. Biotechnol. 6, 181–195. doi: 10.1007/s11157-006-9111-2
Robison, B. H. (2004). Deep pelagic biology. J. Exp. Mar. Bio. Ecol. 300 (1), 253–272. doi: 10.1016/j.jembe.2004.01.012
Scott, G. R., Schulte, P. M., Egginton, S., Scott, A. L., Richards, J. G., Milsom, W. K. (2011). Molecular evolution of cytochrome C oxidase underlies high-altitude adaptation in the bar-headed goose. Mol. Biol. Evol. 28 (1), 351–363. doi: 10.1093/molbev/msq205
Shen, Y. Y., Liang, L., Li, G. S., Murphy, R. W., Zhang, Y. P. (2012). Parallel evolution of auditory genes for echolocation in bats and toothed whales. PLoS Genet. 8 (6), e1002788. doi: 10.1371/journal.pgen.1002788
Shen, Y. Y., Liang, L., Zhu, Z. H., Zhou, W. P., Irwin, D. M., Zhang, Y. P. (2010). Adaptive evolution of energy metabolism genes and the origin of flight in bats. Proc. Natl. Acad. Sci. U.S.A. 107 (19), 8666–8671. doi: 10.1073/pnas.0912613107
Shen, Y. Y., Shi, P., Sun, Y. B., Zhang, Y. P. (2009). Relaxation of selective constraint on avian mitochondrial DNA following the degeneration of flight ability. Genome Res. 19, 1760–1765. doi: 10.1101/gr.093138.109
Siebenaller, J. F., Garrett, D. J. (2002). The effects of the deep-sea environment on transmembrane signaling. Comp. Biochem. Physiol. B Biochem. Mol. Biol. 131 (4), 675–694. doi: 10.1016/S1096-4959(02)00027-1
Sonnhammer, E. L., Von, H. G., Krogh, A. (1998). A hidden markov model for predicting transmembrane helices in protein sequences. Proc. Int. Conf. Intell. Syst. Mol. Biol. 6, 175–182.
Sun, Y. B., Shen, Y. Y., Irwin, D. M., Zhang, Y. P. (2011). Evaluating the roles of energetic functional constraints on teleost mitochondrial-encoded protein evolution. Mol. Biol. Evol. 28, 39–44. doi: 10.1093/molbev/msq256
Trumpower, B. L. (1990). The protonmotive Q cycle. Energy transduction by coupling of proton translocation to electron transfer by the cytochrome bc1 complex. J. Biol. Chem. 265 (20), 11409–11412.
Tsukihara, T., Shimokata, K., Katayama, Y., Shimada, H., Muramoto, K., Aoyama, H., et al. (2003). The low-spin heme of cytochrome c oxidase as the driving element of the proton-pumping process. Proc. Natl. Acad. Sci. U.S.A. 100 (100), 15304–15309. doi: 10.1073/pnas.2635097100
Wang, Z., Yonezawa, T., Liu, B., Ma, T., Shen, X., Su, J., et al. (2011). Domestication relaxed selective constraints on the yak mitochondrial genome. Mol. Biol. Evol. 28 (5), 1553–1556. doi: 10.1093/molbev/msq336
Xiang, D., Shen, X., Pu, Z., Irwin, D. M., Liao, M., Shen, Y. (2018). Convergent evolution of human-isolated H7N9 avian influenza a viruses. J. Infect Dis. 217, 1699–1707. doi: 10.1093/infdis/jiy082
Yang, Z. (1997). PAML: a program package for phylogenetic analysis by maximum likelihood. Comput. Appl. Biosci. 13, 555–556. doi: 10.1093/bioinformatics/13.5.555
Yokoyama, S., Radlwimmer, F. B. (1998). The "five-sites" rule and the evolution of red and green color vision in mammals. Mol. Biol. Evol. 15 (5), 560–567. doi: 10.1093/oxfordjournals.molbev.a025956
Zhang, J. (2006). Parallel adaptive origins of digestive RNases in Asian and African leaf monkeys. Nat. Genet. 38 (7), 819–823. doi: 10.1038/ng1812
Zhang, J., Kumar, S. (1997). Detection of convergent and parallel evolution at the amino acid sequence level. Mol. Biol. Evol. 14 (5), 527–536. doi: 10.1093/oxfordjournals.molbev.a025789
Zhou, T., Shen, X., Irwin, D. M., Shen, Y., Zhang, Y. (2014). Mitogenomic analyses propose positive selection in mitochondrial genes for high-altitude adaptation in galliform birds. Mitochondrion 18, 70–75. doi: 10.1016/j.mito.2014.07.012
Keywords: deep-sea adaptation, mtDNA, adaptive evolution, positive selection, convergent evolution
Citation: Shen X, Pu Z, Chen X, Murphy RW and Shen Y (2019) Convergent Evolution of Mitochondrial Genes in Deep-Sea Fishes. Front. Genet. 10:925. doi: 10.3389/fgene.2019.00925
Received: 08 May 2019; Accepted: 04 September 2019;
Published: 03 October 2019.
Edited by:
Fulvio Cruciani, Sapienza University of Rome, ItalyReviewed by:
Joana Isabel Robalo, University Institute of Psychological, Social and Life Sciences, PortugalLenin Arias Rodriguez, Universidad Juárez Autónoma, de Tabasco, Mexico
Copyright © 2019 Shen, Pu, Chen, Murphy and Shen. This is an open-access article distributed under the terms of the Creative Commons Attribution License (CC BY). The use, distribution or reproduction in other forums is permitted, provided the original author(s) and the copyright owner(s) are credited and that the original publication in this journal is cited, in accordance with accepted academic practice. No use, distribution or reproduction is permitted which does not comply with these terms.
*Correspondence: Yongyi Shen, c2hlbnl5QHNjYXUuZWR1LmNu
†These authors have contributed equally to this work