 Aurélien Quillet1
 Chadi Saad1†
 Gaëtan Ferry2†
 Youssef Anouar1
 Nicolas Vergne3
 Thierry Lecroq2
 Christophe Dubessy1*
- 1Normandie Univ, UNIROUEN, INSERM, Laboratoire Différenciation et Communication Neuronale et Neuroendocrine, Rouen, France
- 2Normandie Univ, UNIROUEN, UNIHAVRE, INSA Rouen, Laboratoire d'Informatique du Traitement de l'Information et des Systèmes, Rouen, France
- 3Normandie Univ, UNIROUEN, CNRS, Laboratoire de Mathématiques Raphaël Salem, Rouen, France
microRNAs are noncoding RNAs which downregulate a large number of target mRNAs and modulate cell activity. Despite continued progress, bioinformatics prediction of microRNA targets remains a challenge since available software still suffer from a lack of accuracy and sensitivity. Moreover, these tools show fairly inconsistent results from one another. Thus, in an attempt to circumvent these difficulties, we aggregated all human results of four important prediction algorithms (miRanda, PITA, SVmicrO, and TargetScan) showing additional characteristics in order to rerank them into a single list. Instead of deciding which prediction tool to use, our method clearly helps biologists getting the best microRNA target predictions from all aggregated databases. The resulting database is freely available through a webtool called miRabel1 which can take either a list of miRNAs, genes, or signaling pathways as search inputs. Receiver operating characteristic curves and precision-recall curves analysis carried out using experimentally validated data and very large data sets show that miRabel significantly improves the prediction of miRNA targets compared to the four algorithms used separately. Moreover, using the same analytical methods, miRabel shows significantly better predictions than other popular algorithms such as MBSTAR, miRWalk, ExprTarget and miRMap. Interestingly, an F-score analysis revealed that miRabel also significantly improves the relevance of the top results. The aggregation of results from different databases is therefore a powerful and generalizable approach to many other species to improve miRNA target predictions. Thus, miRabel is an efficient tool to guide biologists in their search for miRNA targets and integrate them into a biological context.
Introduction
Mature microRNAs (miRNAs) are small endogenous noncoding single strand RNAs. They regulate gene expression in eukaryotic organisms at the posttranscriptional level. Since their discovery in 1993 (Lee et al., 1993), it has been clearly established that miRNAs act as key regulators of several cell processes such as proliferation, differentiation, metabolism, and apoptosis (Krol et al., 2010; Shenoy and Blelloch, 2014); it is therefore not surprising to find them involved in numerous pathophysiological processes (Qu et al., 2014; Hommers et al., 2015; Reddy, 2015). To date, 2,654 mature human miRNAs are referenced in miRBase2 but several recent studies suggest that there may be a larger number (Friedlander et al., 2014; Jha et al., 2015; Londin et al., 2015; McCall et al., 2017). Each of them has the ability to potentially regulate several hundred of mRNAs and each targeted mRNA can be regulated by tens of miRNAs (Selbach et al., 2008; Friedman et al., 2009), thus creating a large and complex regulation network of gene expression unsuspected before. The bioinformatics identification of miRNA targets remains a challenge because mammalian miRNAs are characterized by a poor homology toward their target sequence except in the conserved “seed” region that comprises nucleotides 2–7 of the miRNA (Shin et al., 2010; Bartel, 2018). Nevertheless, several algorithms have been developed to include a set of features known to modulate the interaction between miRNA and their cognate mRNA in addition to the essential Watson-Crick pairings (Peterson et al., 2014). Among them, the most relevant are the free energy of the miRNA::mRNA system (Yue et al., 2009), the conservation of sequences among species (Brennecke et al., 2005) and the accessibility of binding sites (Long et al., 2007). This resulted in the creation of more than 187 target prediction tools (as of September 2019, from OMICtools' database (Henry et al., 2014)), all of which have their strengths and weaknesses (Marbach et al., 2012; Le et al., 2015). These tools are useful to reduce the number of potential targets in order to streamline the experimental validations (Witkos et al., 2011). However, their predictions suffer from a poor accuracy and sensitivity as revealed by experimental data (Thomas et al., 2010; Pinzon et al., 2017) and are very divergent from one tool to another (Min and Yoon, 2010). So far, no single method consistently outperforms others, thus supporting the idea that databases content combination is an efficient way to improve prediction relevance. Assuming that an interaction predicted by more than one algorithm is more likely to be functional, databases such as miRWalk (Dweep et al., 2011; Dweep and Gretz, 2015; Sticht et al., 2018), miRSystem (Lu et al., 2012), miRGator (Nam et al., 2008) or, more recently, Tools4miRs (Lukasik et al., 2016), store and/or compare results predicted by several popular tools using statistics and mRNA/protein expression data. Interestingly, it has been demonstrated that targets resulting from the intersection of two lists of predictions are not more likely to be present in the intersection of two other lists (Ritchie et al., 2009). Therefore, intersecting results does not increase the probability of retaining true positives and it may lead to decreased sensitivity because of possibly omitting valid interactions (Sethupathy et al., 2006; Oliveira et al., 2017). In order to circumvent these limitations, we computed a new score based on the aggregation of the interaction ranks taken from other well-known prediction algorithms. The goal being to give all available predicted interaction to the biologist for a given miRNA while highlighting the most relevant ones. To test our hypothesis, we aggregated four prediction algorithm results which enabled us to show that this new score significantly improves miRNA targets prediction compared to other prediction tools. To allow a more comprehensive analysis, the results of this aggregation were eventually linked to their respective cellular pathways using KEGG database, and implemented in a web tool named miRabel.
Materials and Methods
Aggregated Databases
Computationally predicted human miRNA::mRNA interaction databases generated by miRanda (Betel et al., 2010), PITA (Kertesz et al., 2007), SVMicrO (Liu et al., 2010) and TargetScan (Agarwal et al., 2015) were used. These publicly available online algorithms have been chosen because each of them uses different and complementary features of miRNA::mRNA interactions such as seed match, interspecies conservation, free energy, site accessibility and target-site abundance (Table S1) (Peterson et al., 2014). Only precomputed data were used since this is what is mostly accessible online to biologists. The ranks of each predicted interaction retrieved from one or more of these databases have been aggregated using the R package RobustRankAggreg (RRA, v1.1) (Kolde et al., 2012) with R (v3.2.0). Briefly, this method normalizes ranks with the maximal value of 1. The selected function (Mean, Default, Geometric mean, Median, Min, Stuart) is then used for lists aggregation. Finally, a probabilistic model is used to makes the algorithm parameter free and robust to outliers, noise, and errors. Missing values are replaced by the maximum relative rank value. The new score resulting from the aggregation is used to rerank each interaction and indicates the significativity of the proposed rank in miRabel.
Testing Data Sets
Two types of testing data sets were used for each of the comparisons described in this paper. First, to compare the different aggregation methods, we used one million randomly selected interactions within aggregated data. Validated interactions accounted for 5% of the testing data set. The use of all common interactions between compared databases resulted in extremely large data sets (>500,000 interactions) which reduced the amount of possible analysis due to computation time (several weeks). This led us to design a second type of data sets of 50,000 interactions randomly picked from the corresponding larger data set. For each large data set, 10 smaller ones were created (Figure 1). The amount of experimentally validated interactions within these randomly picked ones was set so as to remain close in proportion to the main, larger data set. These smaller data sets allowed us to increase the relevance and statistical significance of performance results.
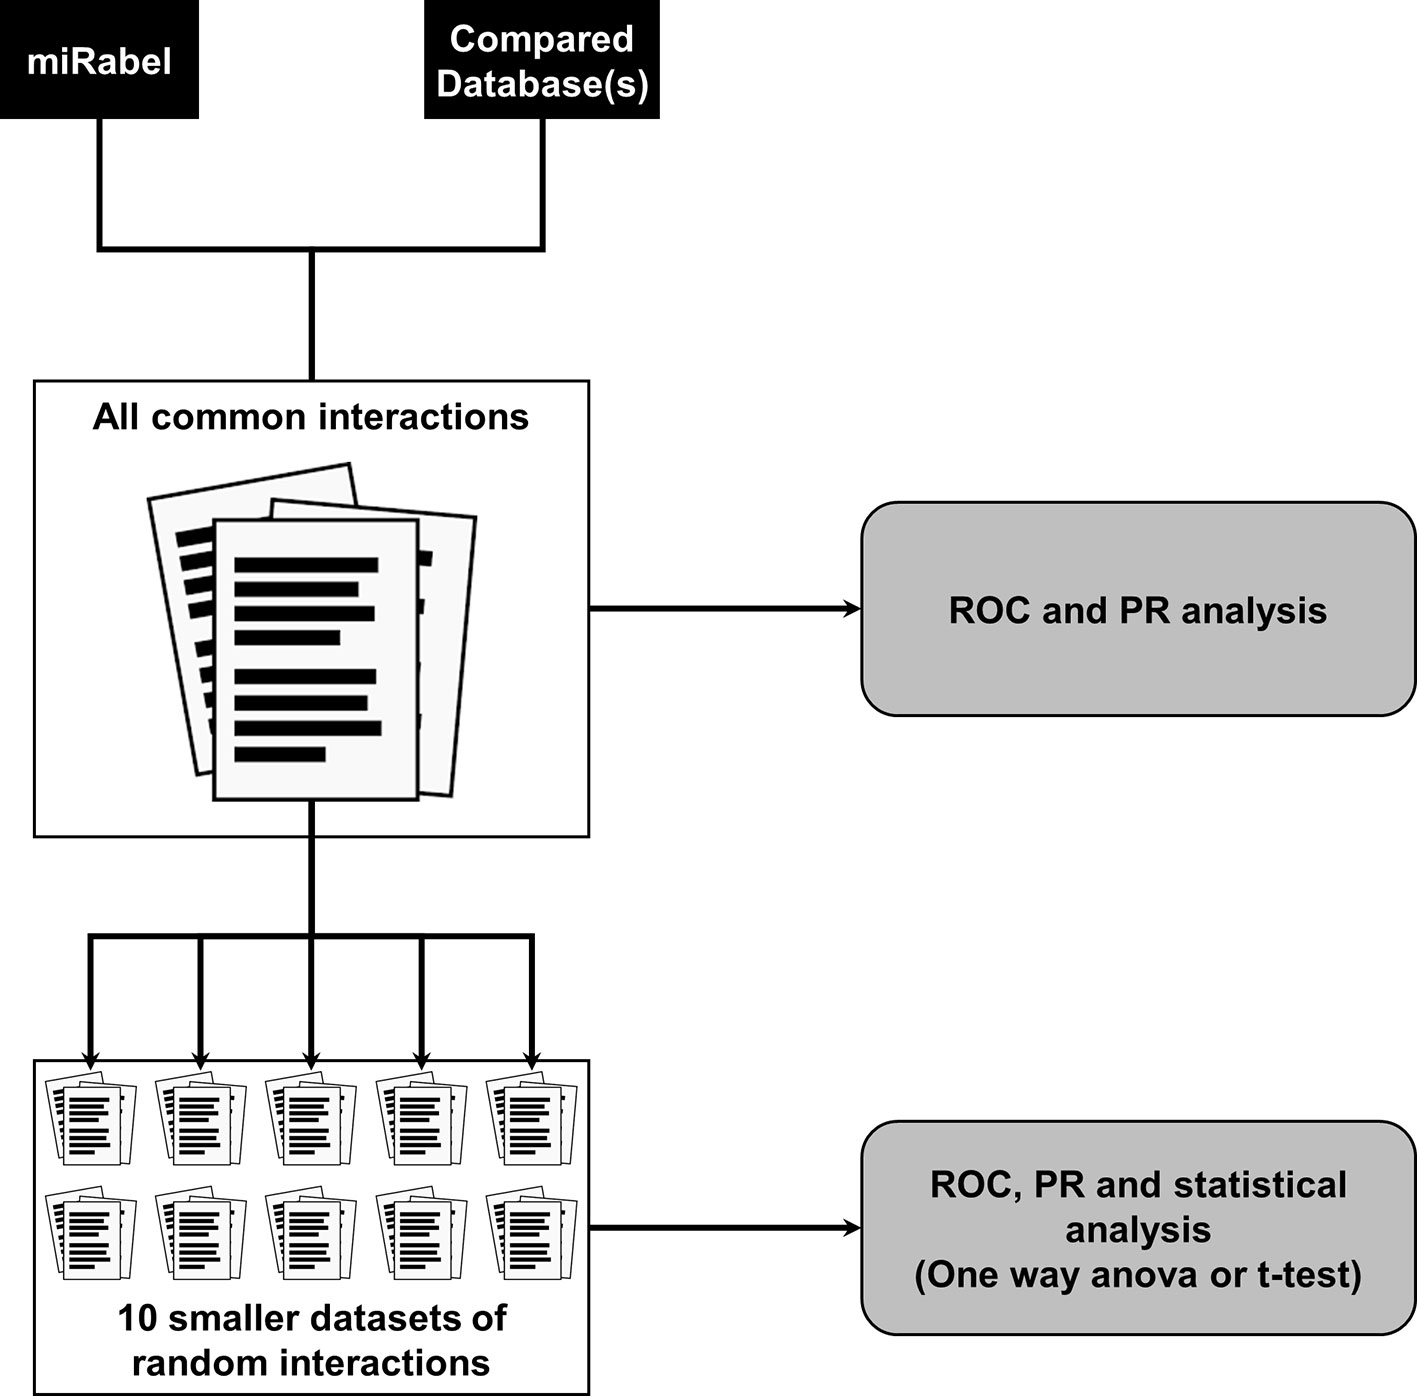
Figure 1 Testing data sets design and databases performance analysis methodology. A large data set containing all common interactions between compared databases is created. For ease of use, 10 smaller data sets of 50,000 interactions were randomly picked from all common ones. Predictions performance are then compared using receiver operating characteristic (ROC) and a precision and recall (PR) analysis on all data sets.
Performance Analysis Methods
On each data set, a receiver operating characteristic (ROC) analysis was done using the area under curve (ROC_AUC) as implemented in the R package pROC (Robin et al., 2011). To analyze top prediction results, a specificity of 90% was set as a threshold in order to compute partial ROC (pROC90%) and the corresponding AUC (ROC_pAUC90%) and sensitivity. To focus on which classifier better identifies true positive interactions, data sets were further compared with precision and recall (PR) curves using R programming as well. For the same purpose as with the pAUC of the ROC analysis, we calculated the harmonic mean between the precision and the recall (F-score) for different percentages of the top interactions.
Statistics
Statistical analysis of results obtained with ten random data sets containing 50,000 interactions were done with R (version 3.4.0) using either a Repeated Measures One Way ANOVA with Dunnett's post-test or a Student t-test depending on the number of compared groups. Adjusted p-values are considered significant when <0.05.
Results
Mirabel Overview
miRabel: A Database for Microrna Target Predictions
The database was designed with MySQL3 using InnoDB motor and includes predictions from miRanda (Betel et al., 2010), PITA (v.6.0) (Kertesz et al., 2007), SVMicrO (Liu et al., 2010), and TargetScan (Agarwal et al., 2015). It contains tables for 2,587 human miRNAs which have target mRNAs, 19,799 genes and 275 pathways. This represents more than 14.7 million predicted interactions from which 351,298 are experimentally established. These experimentally validated interactions are annoted using miRTarBase (v.6.0) (Hsu et al., 2011) and miRecords (Xiao et al., 2009), whereas 5'UTR and CDS predictions were identified with miRWalk database (v.2.0) (Dweep et al., 2011). Genes and pathways information as well as their relationships were retrieved from KEGG's database while miRNA data were from miRBase (release 22.1) and linked with miRNA target predictions. Since the annotation of miRNAs has changed over the years, a tool was developed to convert the names of miRNA queries in the latest version used by miRBase. In order to standardize gene names from the different tools, they were converted to the NCBI gene ID and a table containing their synonyms has been built. Potential interactions between miRNAs and genes were obtained with our prediction method represented as shown in Figure 2A. Pathways linked to the resulting interactions can be retrieved and ranked according to the proportion of its interactions regulated by a given miRNA. For each pathway, the number of validated interactions for this miRNA is also indicated.
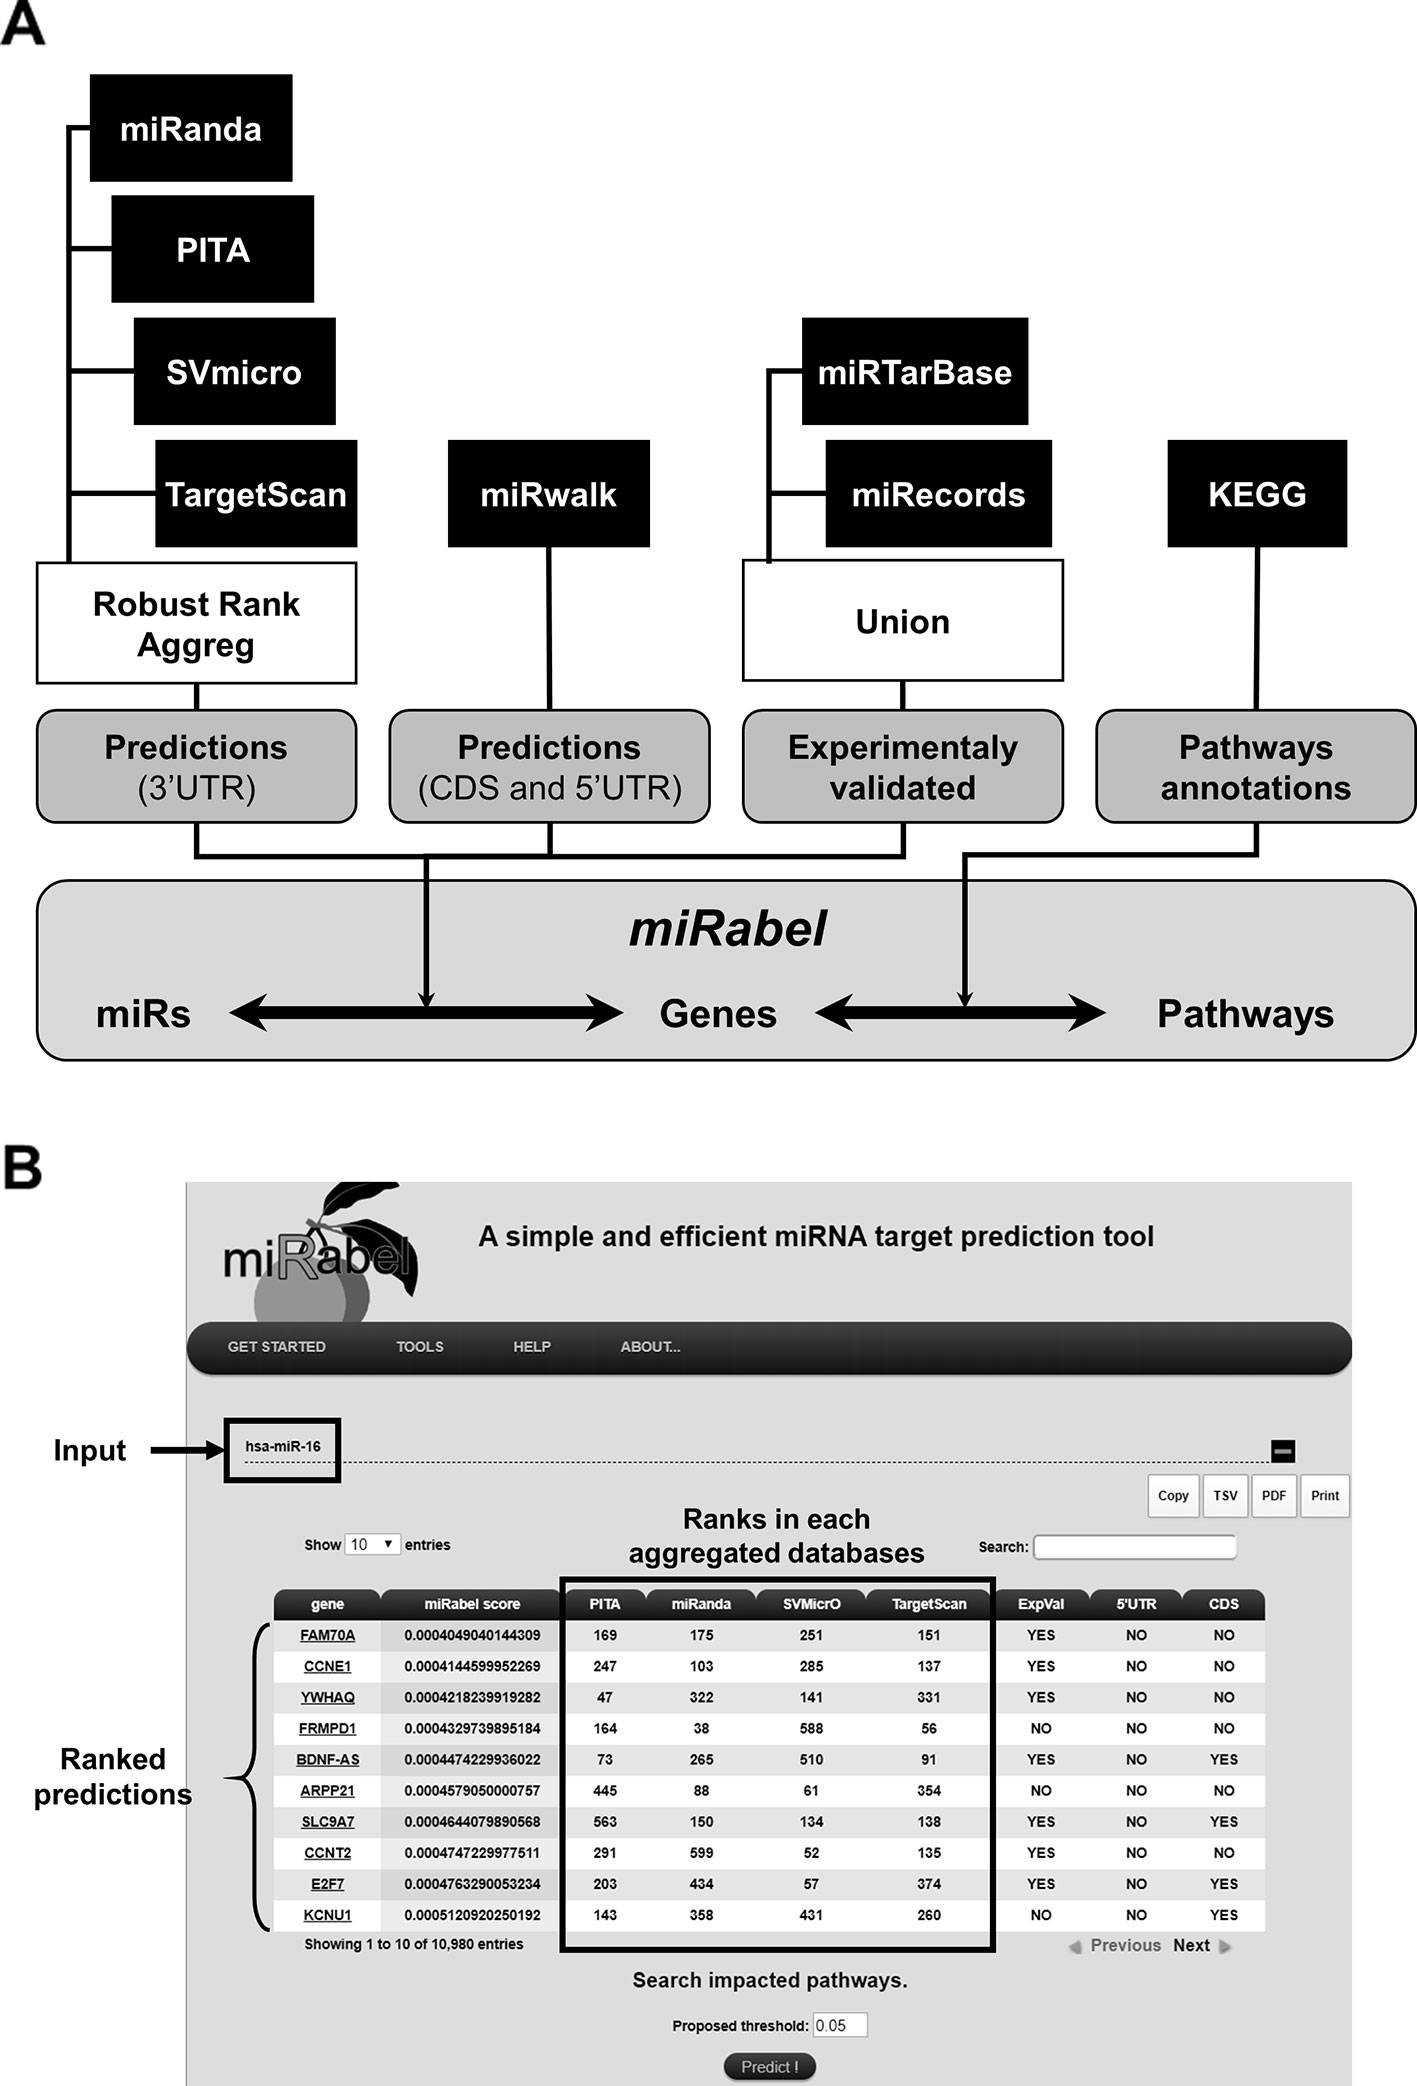
Figure 2 Overview of miRabel. Predictions results from miRanda, PITA, SVMicrO, and TargetScan for 3'UTR are aggregated using Robust Rank Aggreg. 5'UTR and CDS predictions are retrieved from miRWalk database. Experimentally validated interactions are identified using miRTarBase and miRecords. Links between predictions and pathways are established based on KEGG information (A). An example of miRabel web interface is shown using predictions for hsa-miR-16. Predicted targets are ranked according to miRabel's score. Rank found for this interaction in each database are indicated as well as its experimental validation status and sub-localization in the mRNA (5'UTR and CDS) (B).
The Web Interface
The web interface was designed with PHP4 and CSS5. It enables users to query the system directly by miRNA, gene or pathway name (Figure 2B). Multiple queries are allowed in order to identify common prediction results. Queries by pathways are easily made thanks to asynchronous database queries and name completion. The results are visualized by using the DataTable plugin of the JQuery framework which allows to create tables that can be easily filtered and sorted. Results can be copied, printed or exported in tabulated-separated or pdf formats. An online documentation is also provided. miRabel is freely available6.
Evaluating Aggregation Methods
The performances of the aggregation methods (Mean, Default, Geometric mean, Median, Min, Stuart) provided by RRA have been compared to each other (except for the Stuart method due to extensive computation time). ROC and PR analysis show that the mean of the ranks provides the best result (ROC_AUCMean = 0.6888 ± 0.0030, PR_AUCMean = 0.0289 ± 0.0006) (Figures 3A–D). Interestingly, the F-score for all interactions (F-score = 0.0585 ± 0.0010) indicates that the mean method is also the most consistent in promoting validated interactions (Figures 3E, F). When looking at top predictions only, the mean method remains significantly better than other compared methods (Table S2). These results led us to use the mean method to aggregate the ranks of miRanda, PITA, SVMicrO, and TargetScan which has been subsequently implemented in miRabel.
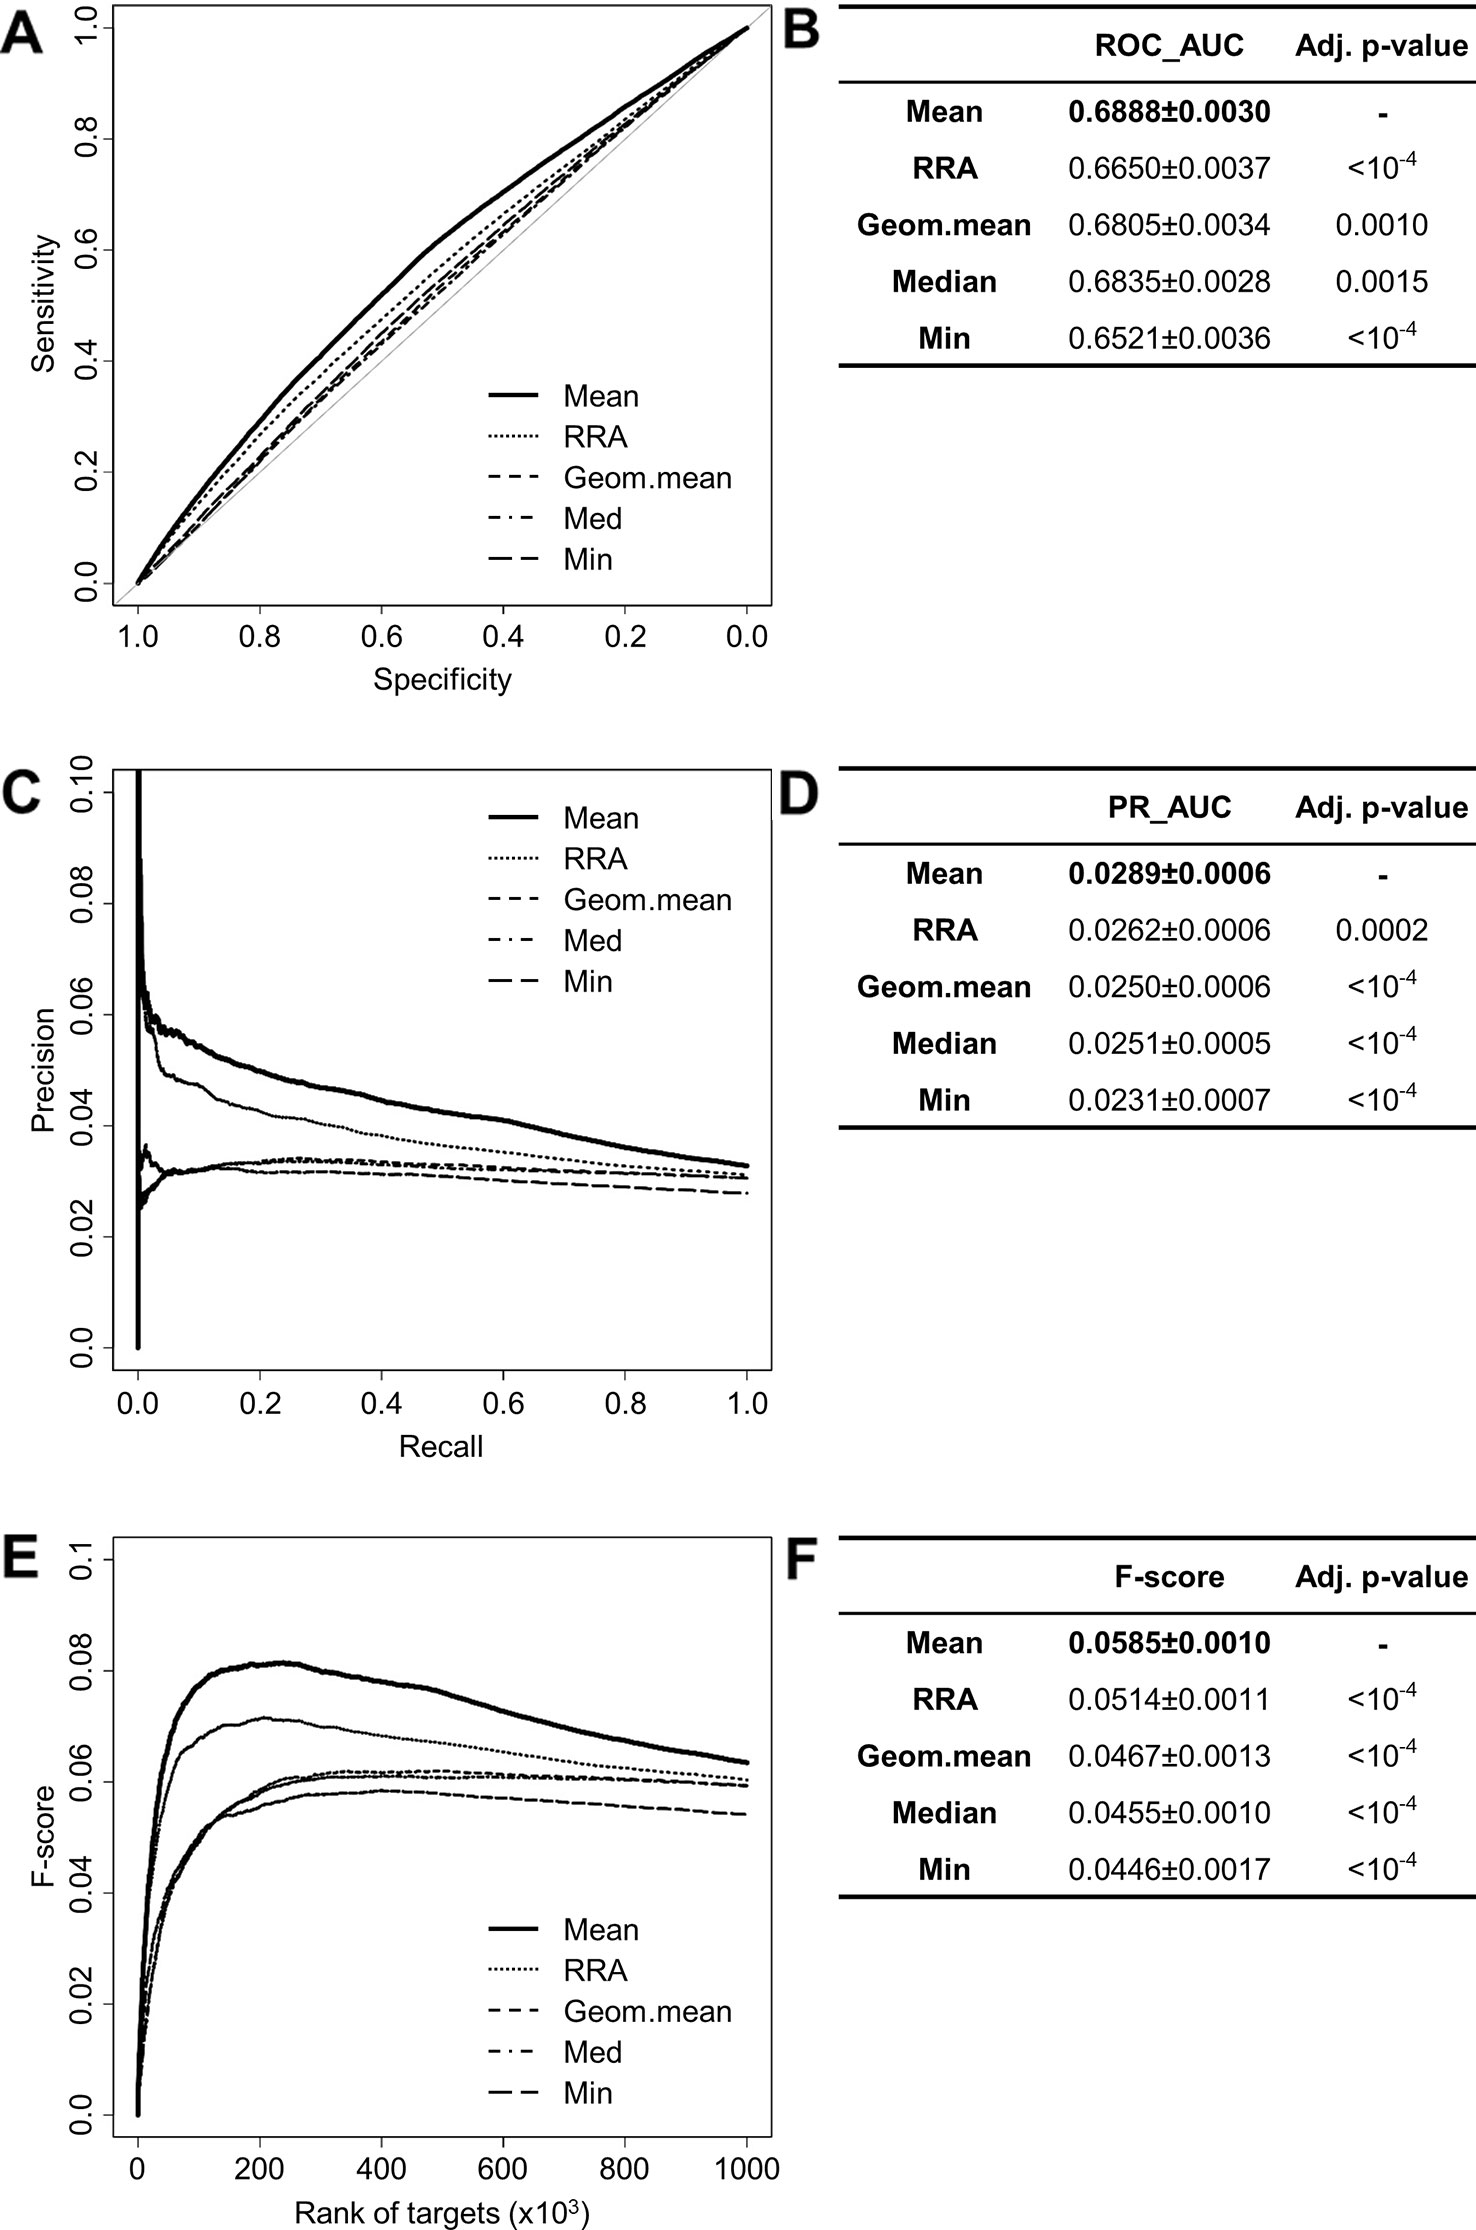
Figure 3 Performances comparison of aggregation methods. Receiver operating characteristic (ROC) curve analysis (A), showing the sensitivity and the specificity for five aggregation methods from the RobustRankAggreg (RRA) R package, and their respective area under curves (AUC, B) have been calculated using the pROC R package on ten random data sets containing 50,000 interactions. Using the same data set, PR analysis (C) with PR_AUC (D) has been carried out. The cumulative harmonic mean between precision and recall (F-score) was also plotted (E) for each ranked interaction of this data set. The average F-score is reported for all interactions (F). The higher are the ROC_AUC, PR_AUC and F-score, the better are the performances of the tested method. Highest values are in bold font.
Comparison to Aggregated Methods
In order to test whether any improvement was gained with our aggregation method, the performances of each aggregated algorithms were compared to miRabel using ROC and PR analysis as well. These comparisons were done with 1,204,591 predicted interactions that are common to miRanda, PITA, SVMicrO, and TargetScan. Within these predictions, 59,743 are experimentally validated ones (Figure 1). ROC curve analysis shows that miRabel significantly improves the prediction of validated miRNA::mRNA interactions (ROC_AUC = 0.5842 ± 0.0019) compared to miRanda, PITA, SVMicrO, and TargetScan (Figures 4A, B). This improvement is even visuable with the PR analysis (PR_AUC = 0.0652 ± 0.0005) (Figures 4C, D) and the consistency of miRabel superior F-score throughout the data set (Figures 4E, F). A significant improvement was also manifest for the aggregated predictions for the top ranked interactions (ROC_pAUC90% = 0.0096 ± 0.0001; F-score20% = 0.1006±0.004) compared to PITA, SVMicrO and TargetScan (Table S3).
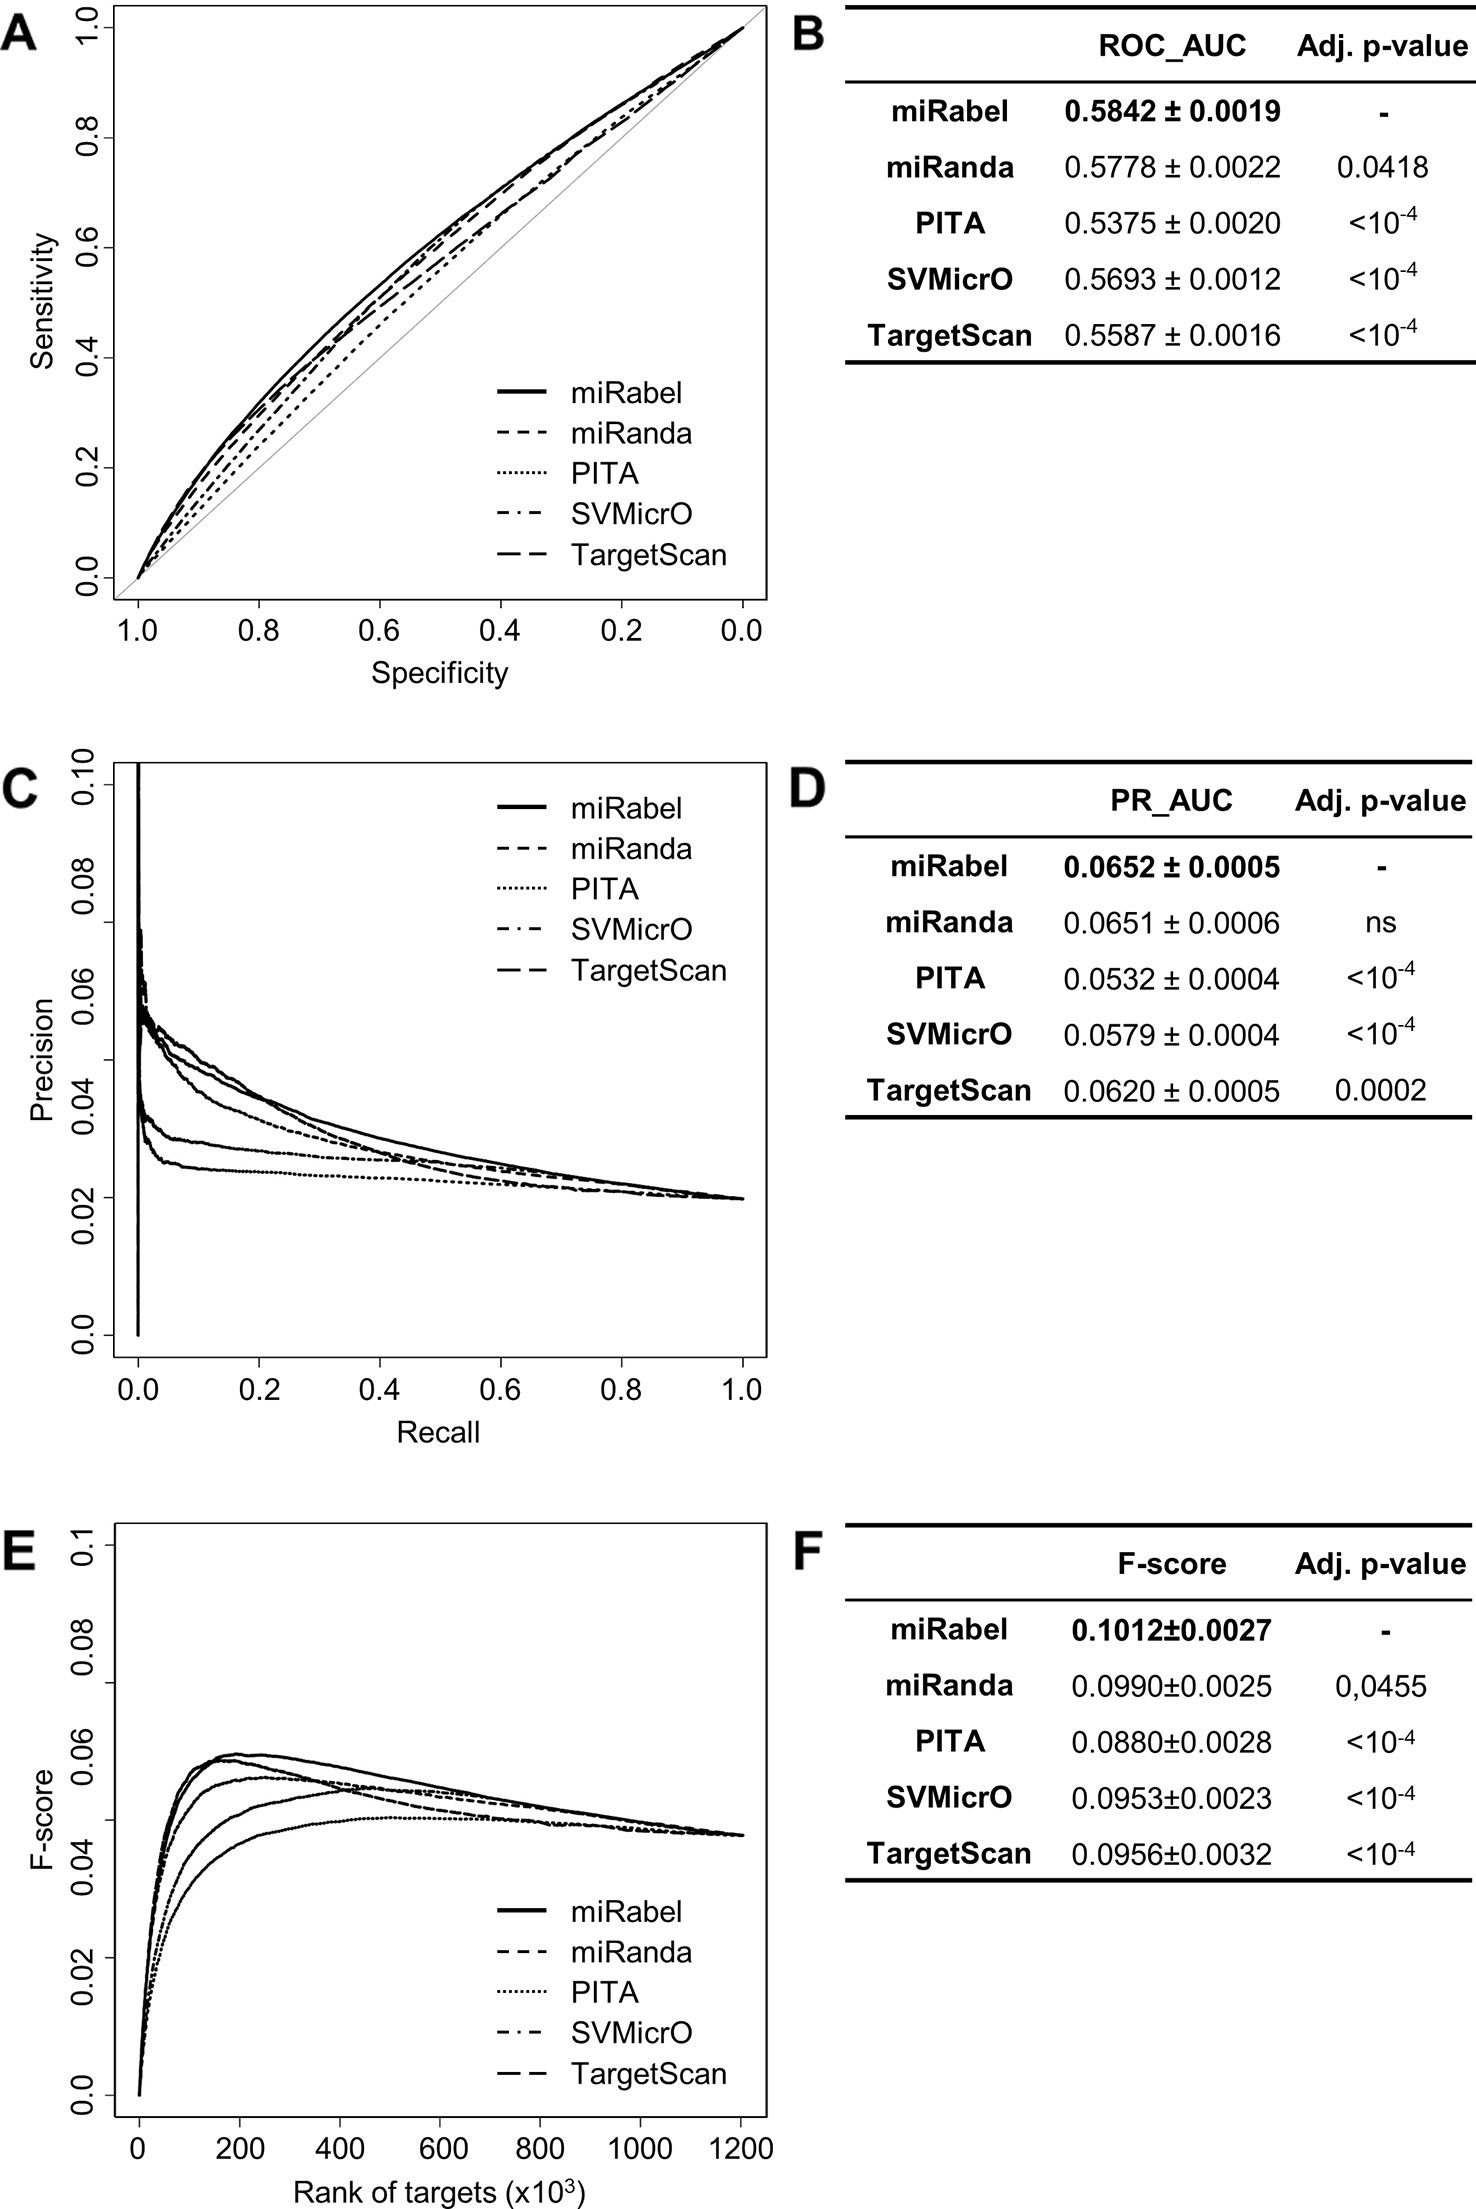
Figure 4 Performances comparison of aggregated prediction algorithms. Receiver operating characteristic (ROC) curve analysis (A), showing the sensitivity and the specificity for miRabel, miRanda, PITA, SVMicrO, and TargetScan, and their respective AUC (B) have been calculated using the pROC R package on 1,204,591 common interactions. Using the same data set, a precision and recall (PR) analysis (C) with PR_AUC (D) has been carried. The cumulative harmonic mean between precision and recall (F-score) was also plotted (E) for each ranked interaction of this data set. The average F-score is reported for all interactions (F). The higher are the ROC_AUC, PR_AUC and F-score, the better are the performances of the tested algorithm. Highest values are in bold font.
Comparison to Other Prediction Tools
Even though they are not aggregation methods, we also compared miRabel to four efficient, up-to-date and/or widely used prediction web tools (Fan and Kurgan, 2015): MBSTAR (Bandyopadhyay et al., 2015), miRWalk (v.2.0) (Dweep et al., 2011), miRmap (Vejnar and Zdobnov, 2012), and ExprTarget (Gamazon et al., 2010). ROC and PR curves analysis shows that our prediction data significantly improves the overall prediction of miRNA targets when compared to MBSTAR (Figure 5 and Table S4) and miRWalk (Figure 6 and Table S5). However, even though miRabel performs slightly better than miRmap (Figures 7A, B) and ExprTarget (Figures 8A, B), they seem fairly equal for true positives identification (Figures 7C–F and 8C–F). Partial specificity and sensitivity (ROC_pAUC90%) of our aggregated data are also higher than those of MBSTAR (Table S4) and miRWalk (Table S5) whereas these parameters are significantly better for miRmap and ExprTarget (Tables S6 and S7).
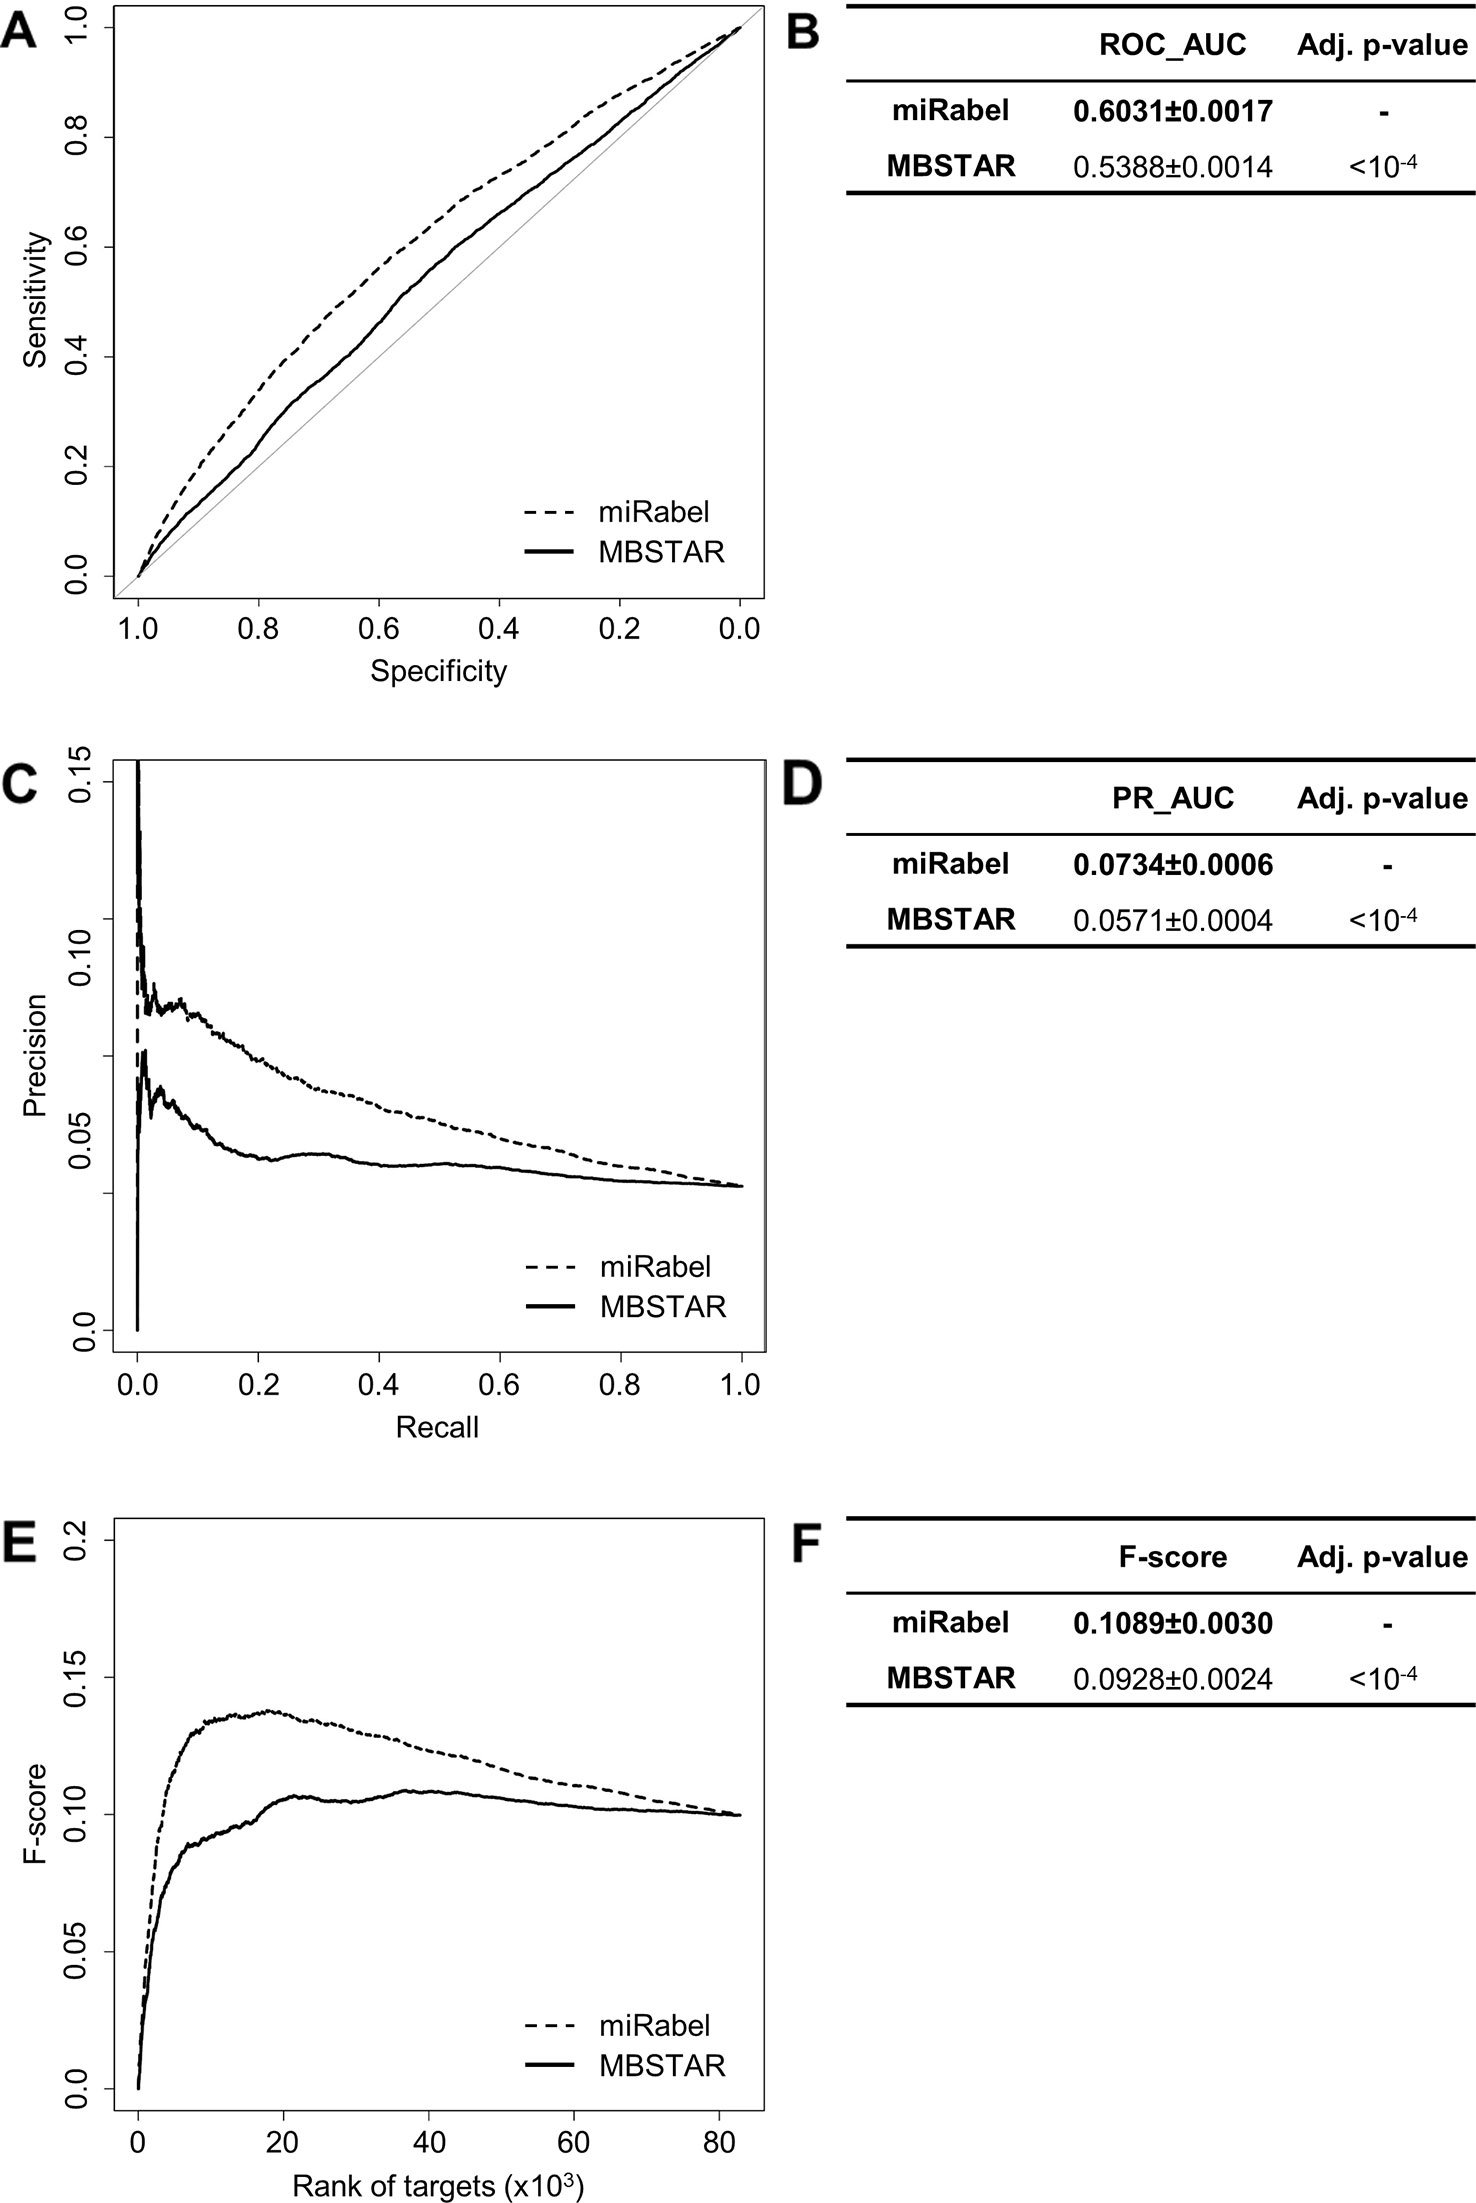
Figure 5 Performances comparison of miRabel and MBSTAR. Receiver operating characteristic (ROC) curve analysis (A), showing the sensitivity and the specificity for miRabel and MBSTAR, and their respective area under curves (AUC) (B) have been calculated using the pROC R package on 82,867 common interactions. Using the same data set, a precision and recall (PR) analysis (C) with PR_AUC (D) has been carried out. The cumulative harmonic mean between precision and recall (F-score) was also plotted (E) for each ranked interaction of this data set. The average F-score is reported for all interactions (F). The higher are the ROC_AUC, PR_AUC, and F-score, the better are the performances of the tested algorithm. Highest values are in bold font.
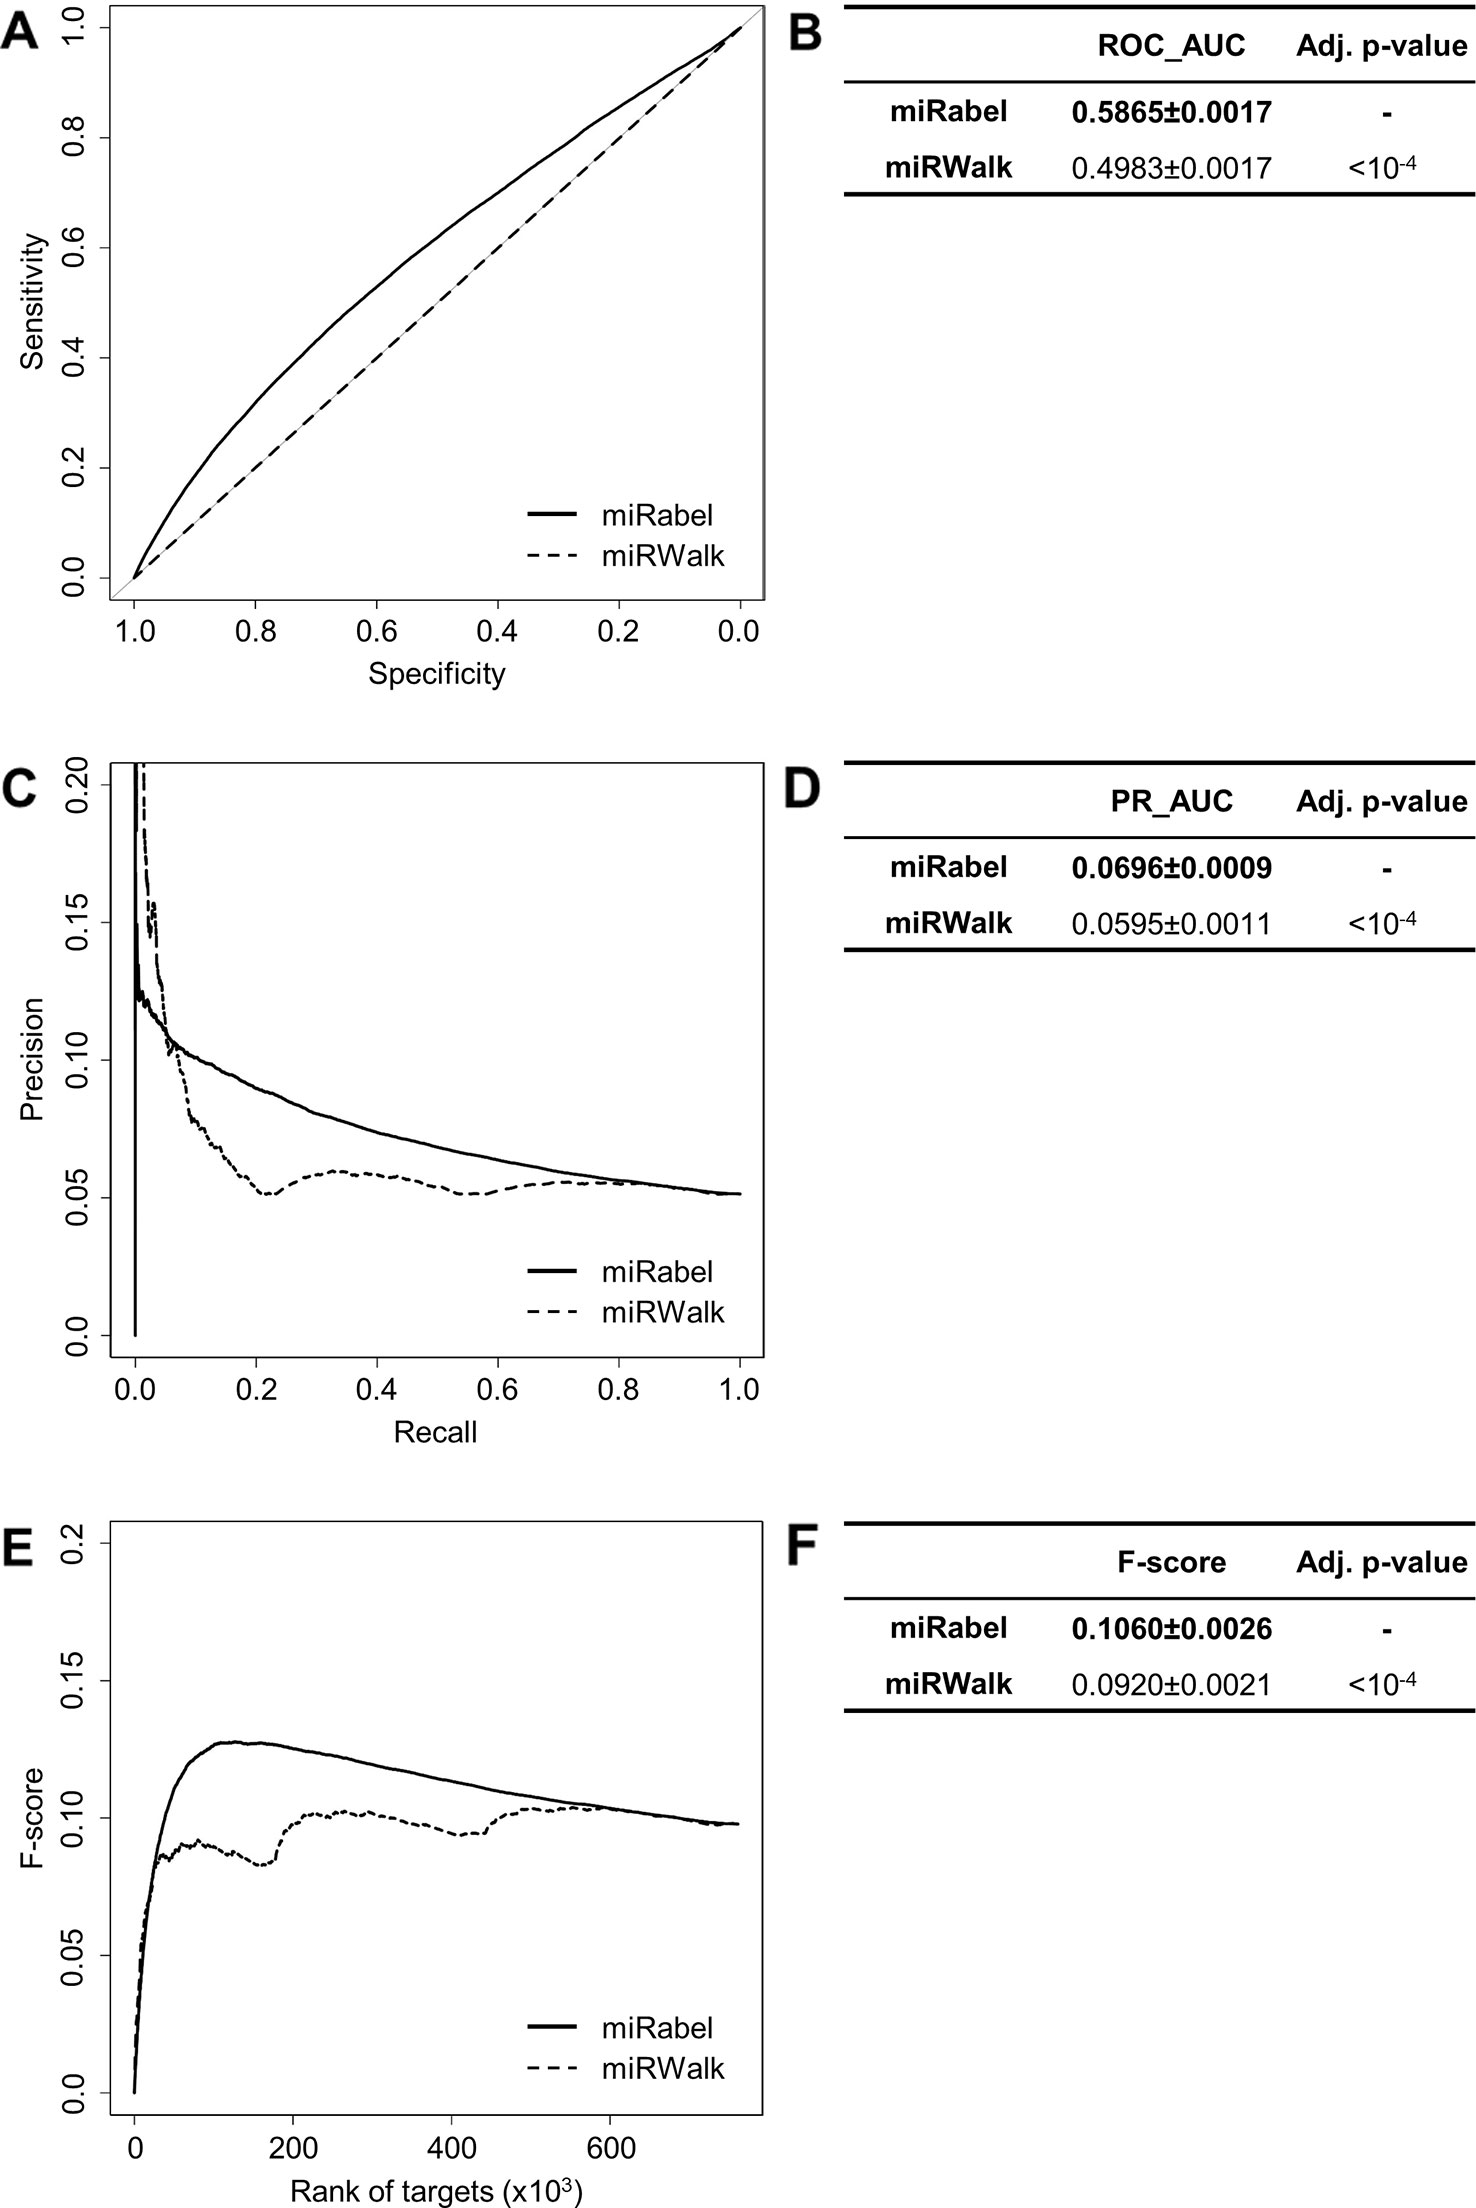
Figure 6 Performances comparison of miRabel and miRWalk. Receiver operating characteristic (ROC) curve analysis (A), showing the sensitivity and the specificity for miRabel and miRWalk, and their respective area under curves (AUC) (B) have been calculated using the pROC R package on 761,354 common interactions. Using the same data set, a precision and recall (PR) analysis (C) with PR_AUC (D) has been carried out. The cumulative harmonic mean between precision and recall (F-score) was also plotted (E) for each ranked interaction of this data set. The average F-score is reported for all interactions (F). The higher are the ROC_AUC, PR_AUC and F-score, the better are the performances of the tested algorithm. Highest values are in bold font.
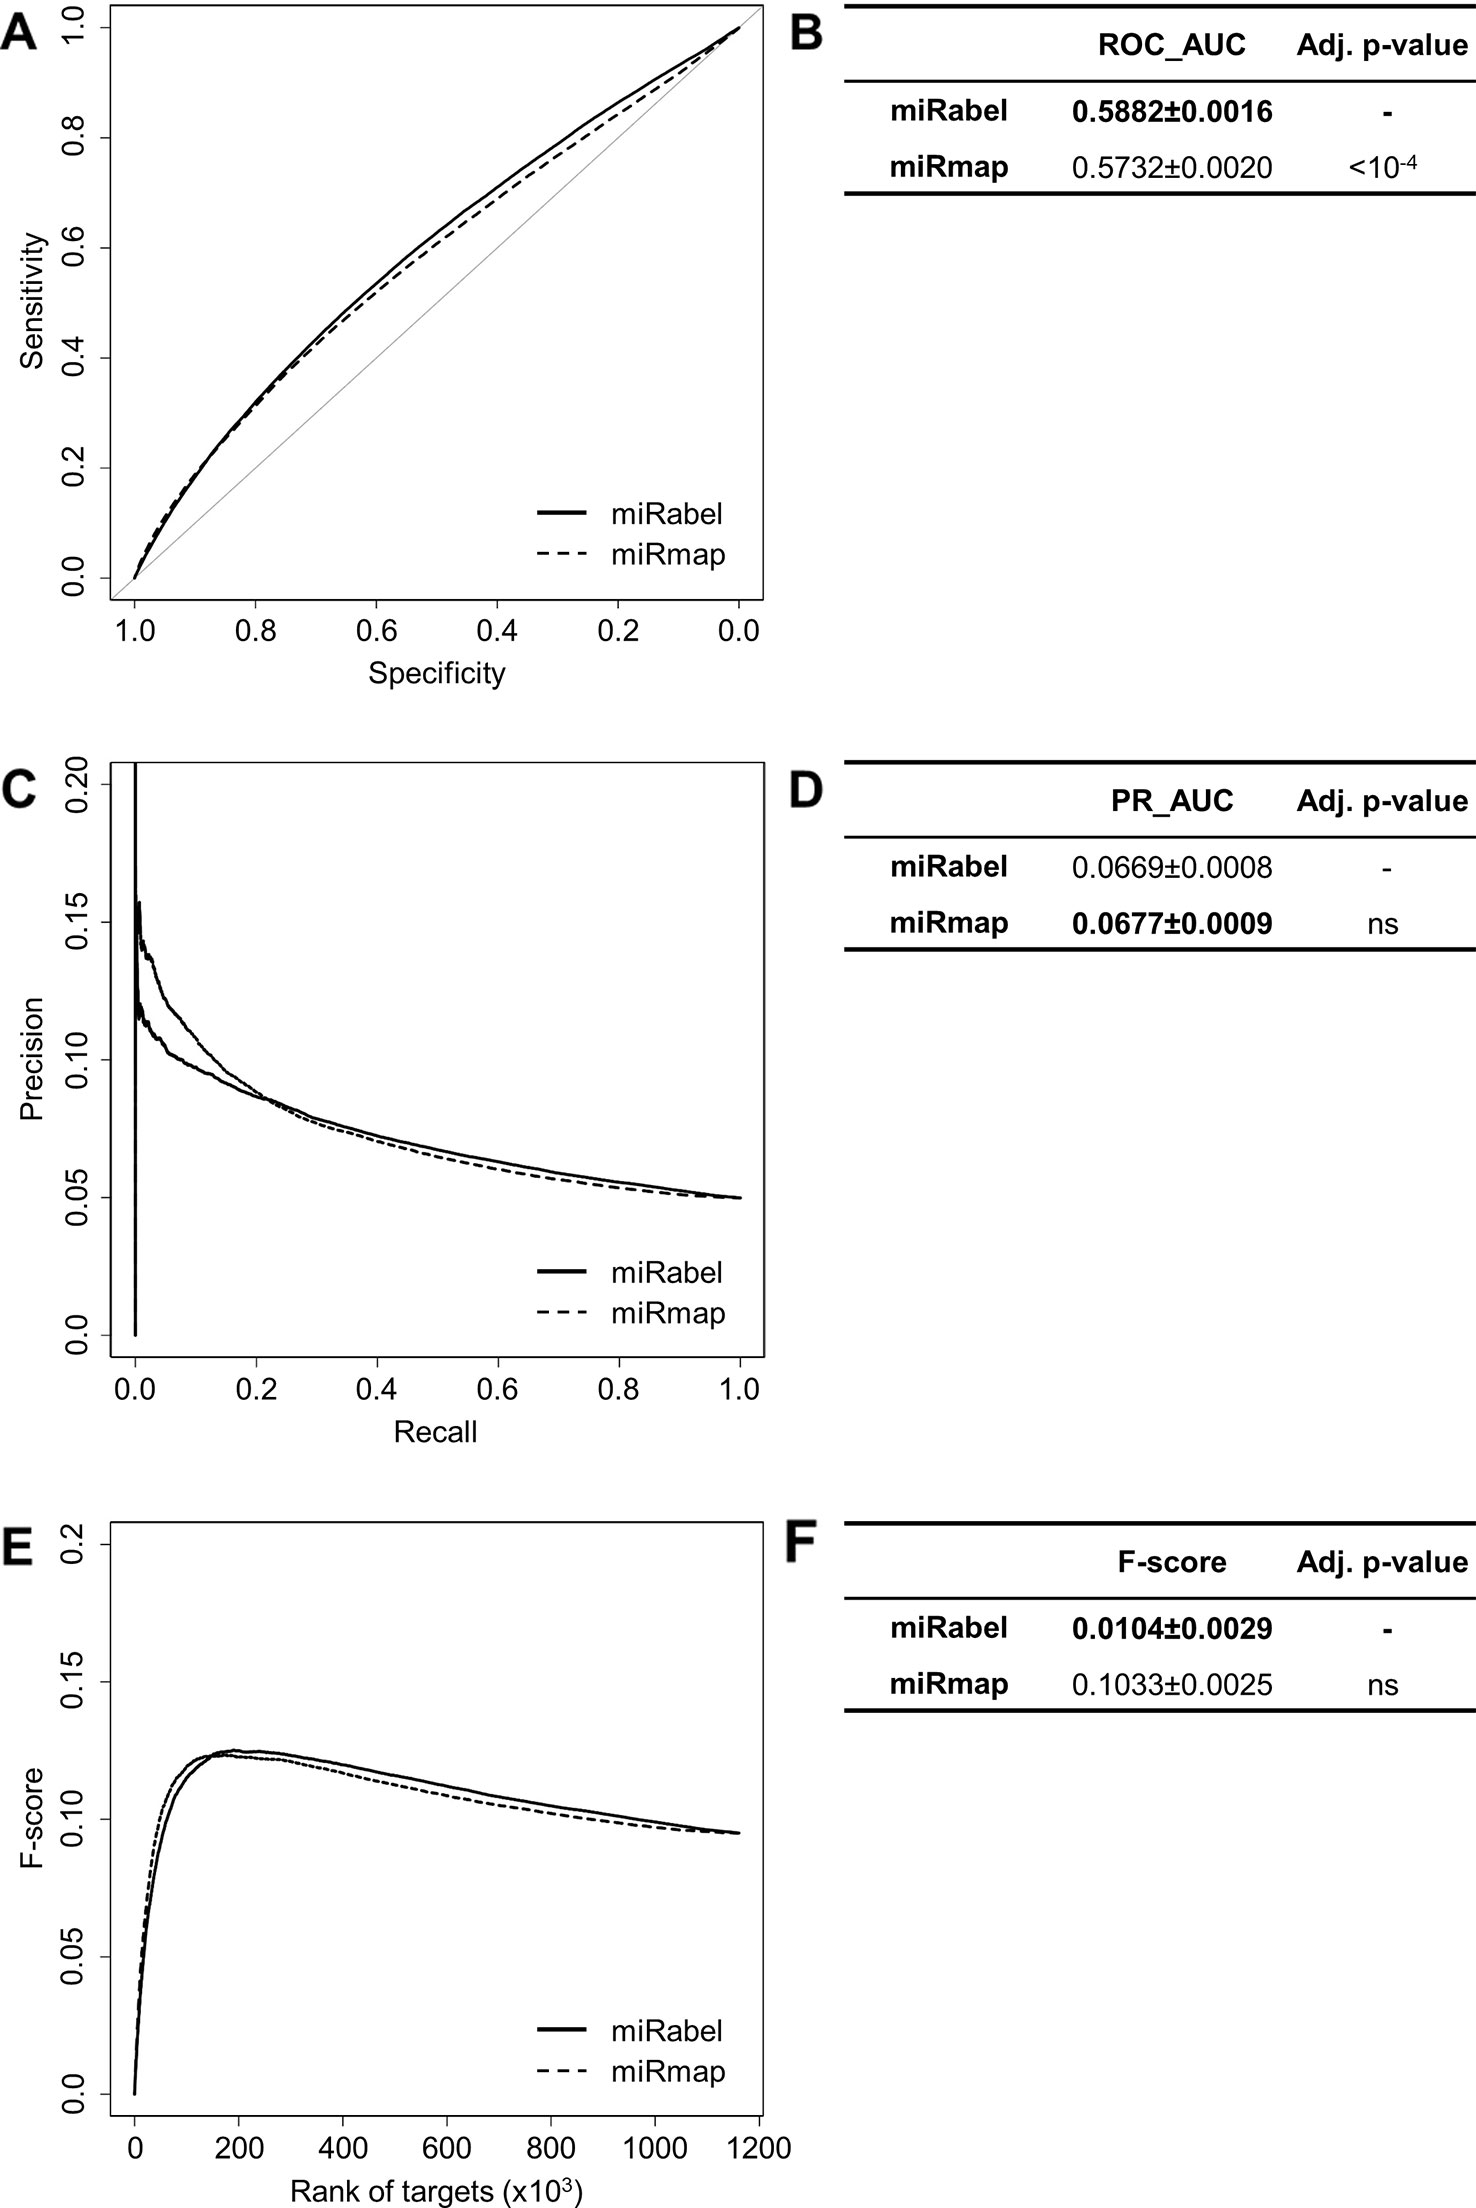
Figure 7 Performances comparison of miRabel and miRmap. Receiver operating characteristic (ROC) curve analysis (A), showing the sensitivity and the specificity for miRabel and miRmap, and their respective area under curves (AUC) (B) have been calculated using the pROC R package on 1,160,781 common interactions. Using the same data set, a precision and recall (PR) analysis (C) with PR_AUC (D) has been carried out. The cumulative harmonic mean between precision and recall (F-score) was also plotted (E) for each ranked interaction of this data set. The average F-score is reported for all interactions (F). The higher are the ROC_AUC, PR_AUC and F-score, the better are the performances of the tested algorithm. Highest values are in bold font.
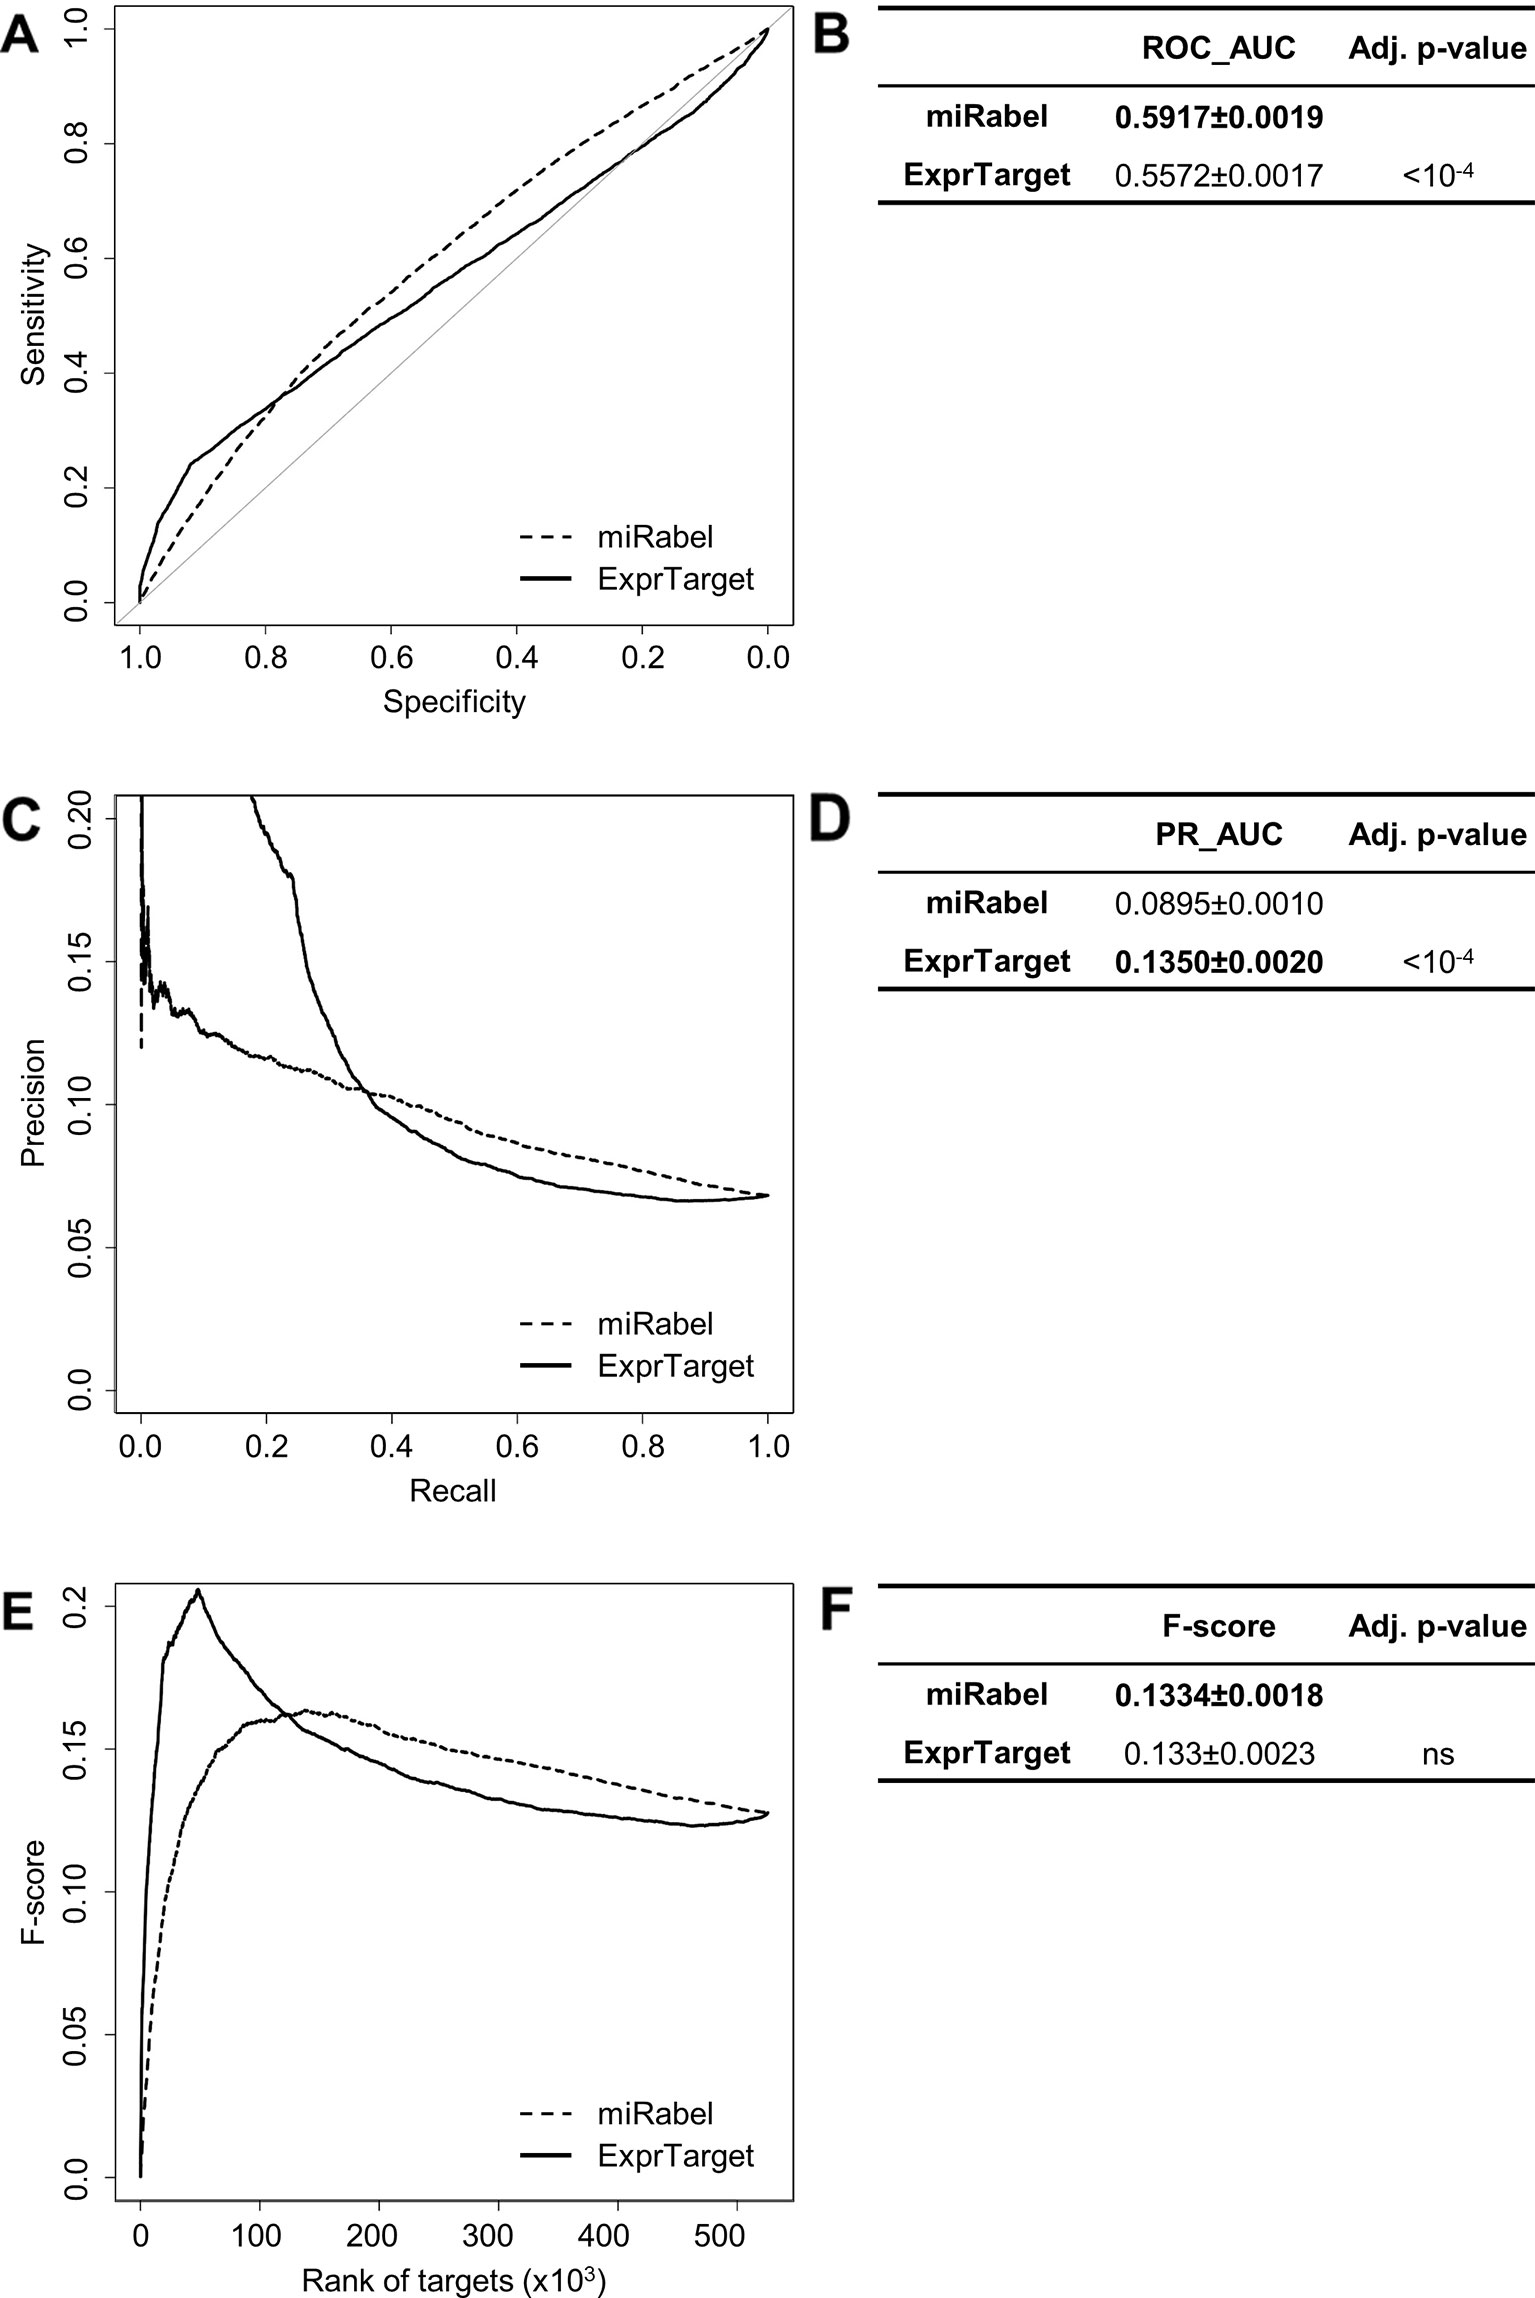
Figure 8 Performances comparison of miRabel and ExprTarget. Receiver operating characteristic (ROC) curve analysis (A), showing the sensitivity and the specificity for miRabel and ExprTarget, and their respective area under curves (AUC) (B) have been calculated using the pROC R package on 105,122 common interactions. Using the same data set, a precision and recall (PR) analysis (C) with PR_AUC (D) has been carried out. The cumulative harmonic mean between precision and recall (F-score) was also plotted (E) for each ranked interaction of this data set. The average F-score is reported for all interactions (F). The higher are the ROC_AUC, PR_AUC and F-score, the better are the performances of the tested algorithm. Highest values are in bold font.
Discussion
The prediction of miRNA targets is a bioinformatic challenge. Actually, each algorithm incorporates its own characteristics and the comparison of their results highlights important contradictions in their respective predictions (Shirdel et al., 2011; Fan and Kurgan, 2015). We therefore hypothesized that the aggregation of the predictions of several algorithms would improve the relevance and the robustness of the prediction of miRNA targets.
In order to validate this concept, we aggregated the predictions of four algorithms, miRanda, PITA, SVMicrO, and TargetScan, because they use different but complementary information. The results they provide are different both in terms of probability of interaction (i.e., their ranking) and of number of targets (Fan and Kurgan, 2015). Thus, only 8.1% of total interactions (1,204,591 / 14.7 million) are common to each other. The example of hsa-miR-16 (Figure 2B) also illustrates very well these divergences of predictions. Moreover, because some of these algorithms have not been updated recently, some more refined features found in recent prediction approaches such as TarPmiR (Ding et al., 2016), are not emphasized in our aggregated results if not at all present. Only human miRNAs were used initially to limit the amount of data as well as the associated computation times, but our approach is generalizable to miRNAs of all origins. Although there is so far a high prevalence of miRNA interaction sites found in the 3'UTR, recent papers have shown that some miRNAs can also regulate mRNAs by binding with the 5'UTR and CDS region of their targets (Moretti et al., 2010; Qu et al., 2016). Even though the value of these sites is not yet clearly established in the literature, this information remains important to get an integrated view of the predicted miRNA interaction sites on the mRNA. Since the score generated by the RRA package is also representative of the significativity of the ranking (the lower the score, the better) for a given interaction, we suggest to use miRabel with a threshold of 0.05. However, further analyses are required to really define an optimal threshold for miRabel. Finally, the choice of algorithms is also limited by the free availability of their database. To further improve predictions, it would therefore be interesting to include promising tools such as ComiR (Coronnello and Benos, 2013) whose prediction algorithm have been shown to perform well (Fan and Kurgan, 2015). RNAHybrid (Rehmsmeier et al., 2004) and rna22 (Miranda et al., 2006) are also of particular interest because they allow the prediction of targets in CDS and 5'UTRs and have been used successfully in predicting targets that were later validated experimentally.
We chose the RRA package for its ability to handle incomplete rankings and its robustness to noise due to divergent lists (Kolde et al., 2012). Comparing five of the aggregation methods included in the RRA package shows that the “mean” method is best for aggregating miRNA prediction lists (Figure 3, Table S2). However, although statistically significant, these values are relatively close to one another. These results are similar to those obtained in studies designed to compare the performance of several rank aggregation methods (Burkovski et al., 2012; Wald et al., 2012; Dittman et al., 2013). Among other aggregation methods, Cross Entropy Monte-Carlo has been found to be inadequate for our study due to too extensive computation times with large lists of items (Lin, 2010). Another method that could be evaluated is the Borda count algorithm (Dwork et al., 2001) which has already been used to aggregate cancer expression microarrays and proteomics data sets into a single optimal list (Jurman et al., 2008).
MiRabel performs better than each of the individual aggregated algorithms (Figure 4). Prediction improvement is also visible in the top ranked interactions (Table S3), thus showing that our aggregation moves validated interactions up in ranking. This is in line with multiple studies that combine data to obtain the most relevant interactions (Shirdel et al., 2011; Marbach et al., 2012; Friedman et al., 2014; Andres-Leon et al., 2015; Sedaghat et al., 2018). A recent study in particular shows that the union of the predictions of three tools among four (TargetScan, miRanda-mirSVR, RNA22) increases the performance of the analyses (Oliveira et al., 2017). However, our work goes further since prediction lists were aggregated and reranked in a unique list. The performance of their method was evaluated using only ten miRNAs and 1,400 genes but not the entire database. In order to avoid selection bias of the data sets, we analyzed all 1,204,591 interactions common to miRabel and the four aggregated algorithms, which represent 514 miRNAs and 15,343 genes. Furthermore, even though miRabel aggregates mostly older databases, it shows equal (vs. miRmap) or better (vs. MBSTAR and miRWalk) performances than up-to-date algorithms, thus clearly establishing that our method, even though simple, has a great potential. Interestingly, from all evaluations done with our data sets and methodology, we found other algorithm performances to be quite different from what was originally described in their respective original publications. This is in agreement with previous studies that highlighted the importance of testing prediction results on multiple, independent data sets and with a standardized evaluation protocol (Fan and Kurgan, 2015; Sedaghat et al., 2018). This is also one of the strengths of our study. Indeed, throughout all comparisons, miRabel was tested on 66 different data sets, which gives more robustness to the performance values calculated for our method.
As a conclusion, miRabel is a new efficient tool for the prediction of miRNA target mRNAs and their associated biological functions. Using an aggregation method, we improved the relevance of the predictions of three available algorithms. This promising approach can easily be extended to all publicly available databases or to other species. Moreover, the integrated biological pathways provide a more comprehensive view into the complex regulatory network of miRNAs. Eventually, there is no doubt that this method will greatly contribute in helping biologists gather all available predictions for a given miRNA and to highlight the most relevant potential interactions.
Data Availability Statement
The datasets analyzed for this study can be found in the miRabel's database (http://bioinfo.univ-rouen.fr/mirabel/).
Author Contributions
In this study, CD conceived the concept of the work and designed the study. AQ, CS, GF, and TL collected the data, developped the database and the miRabel's website. AQ and NV performed the data and the statistical analyses. AQ, NV, TL, and CD interpreted data. AQ and CD drafted the manuscript. AQ, TL, YA, and CD revised and finalized the manuscript. All authors read and approved the final manuscript.
Funding
This work was supported by Ligue Contre le Cancer de Haute-Normandie (AAP2008 to YA and CD, AAP2017 to CD); Institut de Recherche et d'Innovation Biomédicale de Normandie (AAP2012 to YA and CD); Conseil Régional de Haute-Normandie, Institut National de la Santé et de la Recherche Médicale (UMRS1239); and the University of Rouen Normandy.
Conflict of Interest
The authors declare that the research was conducted in the absence of any commercial or financial relationships that could be construed as a potential conflict of interest.
The reviewer RM and handling Editor declared their shared affiliation.
Acknowledgments
We are grateful to the CRIANN (Centre Régional Informatique et d'Applications Numériques de Normandie) for allowing us to use their computing facility and University of Rouen Normandy to host the miRabel's website.
Footnotes
- ^ http://bioinfo.univ-rouen.fr/mirabel/
- ^ http://www.mirbase.org/, release 22.1
- ^ http://www.mysql.com/
- ^ http://www.php.net
- ^ http://www.cssflow.com/
- ^ http://bioinfo.univ-rouen.fr/mirabel/
Abbreviations
AUC, area under curve; PR, precision and recall; ROC, receiver operating characeristic.
Supplementary Material
The Supplementary Material for this article can be found online at: https://www.frontiersin.org/articles/10.3389/fgene.2019.01330/full#supplementary-material
References
Agarwal, V., Bell, G. W., Nam, J. W., Bartel, D. P. (2015). Predicting effective microRNA target sites in mammalian mRNAs. Elife 4. doi: 10.7554/eLife.05005
Andres-Leon, E., Gonzalez Pena, D., Gomez-Lopez, G., Pisano, D. G. (2015). miRGate: a curated database of human, mouse and rat miRNA-mRNA targets. Database (Oxford) 2015, bav035. doi: 10.1093/database/bav035
Bandyopadhyay, S., Ghosh, D., Mitra, R., Zhao, Z. (2015). MBSTAR: multiple instance learning for predicting specific functional binding sites in microRNA targets. Sci. Rep. 5, 8004. doi: 10.1038/srep08004
Betel, D., Koppal, A., Agius, P., Sander, C., Leslie, C. (2010). Comprehensive modeling of microRNA targets predicts functional non-conserved and non-canonical sites. Genome Biol. 11 (8), R90. doi: 10.1186/gb-2010-11-8-r90
Brennecke, J., Stark, A., Russell, R. B., Cohen, S. M. (2005). Principles of microRNA-target recognition. PloS Biol. 3 (3), e85. doi: 10.1371/journal.pbio.0030085
Burkovski, A., Lausser, L., Kraus, J., Kestler, H. (2012). “Rank Aggregation for Candidate Gene Identification,” in 36th Annual Conference (GfKl 2012) of the German Classification Society. Eds. Spiliopoulou, M., Schmidt-Thieme, L., Janning, R. (Heidelberg: Springer International Publishing), 285–293.
Coronnello, C., Benos, P. V. (2013). ComiR: Combinatorial microRNA target prediction tool. Nucleic Acids Res. 41 (Web Server issue), W159–W164. doi: 10.1093/nar/gkt379
Ding, J., Li, X., Hu, H. (2016). TarPmiR: a new approach for microRNA target site prediction. Bioinformatics 32 (18), 2768–2775. doi: 10.1093/bioinformatics/btw318
Dittman, D., Khoshgoftaar, T., Wald, R., Napolitano, A. (2013). “Classification Performance of Rank Aggregation Techniques for Ensemble Gene Selection,” in Proceedings of the Twenty-Sixth International Florida Artificial Intelligence Research Society Conference. Eds. Boonthum-Denecke, C., Youngblood, G. (Palo Alto: Association for the Advancement of Artificial Intelligence), 420–425.
Dweep, H., Gretz, N. (2015). miRWalk2.0: a comprehensive atlas of microRNA-target interactions. Nat. Methods 12 (8), 697. doi: 10.1038/nmeth.3485
Dweep, H., Sticht, C., Pandey, P., Gretz, N. (2011). miRWalk–database: prediction of possible miRNA binding sites by “walking” the genes of three genomes. J. BioMed. Inform. 44 (5), 839–847. doi: 10.1016/j.jbi.2011.05.002
Dwork, C., Kumar, R., Naor, M., Sivakumar, D. (2001). Rank Aggregation Revisited. Syst. Res. 13 (2), 86–93. doi: 10.1.1.23.5118
Fan, X., Kurgan, L. (2015). Comprehensive overview and assessment of computational prediction of microRNA targets in animals. Brief Bioinform. 16 (5), 780–794. doi: 10.1093/bib/bbu044
Friedlander, M. R., Lizano, E., Houben, A. J., Bezdan, D., Banez-Coronel, M., Kudla, G., et al. (2014). Evidence for the biogenesis of more than 1,000 novel human microRNAs. Genome Biol. 15 (4), R57. doi: 10.1186/gb-2014-15-4-r57
Friedman, R. C., Farh, K. K., Burge, C. B., Bartel, D. P. (2009). Most mammalian mRNAs are conserved targets of microRNAs. Genome Res. 19 (1), 92–105. doi: 10.1101/gr.082701.108
Friedman, Y., Karsenty, S., Linial, M. (2014). miRror-Suite: decoding coordinated regulation by microRNAs. Database (Oxford) 2014. doi: 10.1093/database/bau043
Gamazon, E. R., Im, H. K., Duan, S., Lussier, Y. A., Cox, N. J., Dolan, M. E., et al. (2010). Exprtarget: an integrative approach to predicting human microRNA targets. PloS One 5 (10), e13534. doi: 10.1371/journal.pone.0013534
Henry, V. J., Bandrowski, A. E., Pepin, A. S., Gonzalez, B. J., Desfeux, A. (2014). OMICtools: an informative directory for multi-omic data analysis. Database (Oxford) 2014. doi: 10.1093/database/bau069
Hommers, L. G., Domschke, K., Deckert, J. (2015). Heterogeneity and individuality: microRNAs in mental disorders. J. Neural Transm. (Vienna) 122 (1), 79–97. doi: 10.1007/s00702-014-1338-4
Hsu, S. D., Lin, F. M., Wu, W. Y., Liang, C., Huang, W. C., Chan, W. L., et al. (2011). miRTarBase: a database curates experimentally validated microRNA-target interactions. Nucleic Acids Res. 39 (Database issue), D163–D169. doi: 10.1093/nar/gkq1107
Jha, A., Panzade, G., Pandey, R., Shankar, R. (2015). A legion of potential regulatory sRNAs exists beyond the typical microRNAs microcosm. Nucleic Acids Res. 43 (18), 8713–8724. doi: 10.1093/nar/gkv871
Jurman, G., Merler, S., Barla, A., Paoli, S., Galea, A., Furlanello, C. (2008). Algebraic stability indicators for ranked lists in molecular profiling. Bioinformatics 24 (2), 258–264. doi: 10.1093/bioinformatics/btm550
Kertesz, M., Iovino, N., Unnerstall, U., Gaul, U., Segal, E. (2007). The role of site accessibility in microRNA target recognition. Nat. Genet. 39 (10), 1278–1284. doi: 10.1038/ng2135
Kolde, R., Laur, S., Adler, P., Vilo, J. (2012). Robust rank aggregation for gene list integration and meta-analysis. Bioinformatics 28 (4), 573–580. doi: 10.1093/bioinformatics/btr709
Krol, J., Loedige, I., Filipowicz, W. (2010). The widespread regulation of microRNA biogenesis, function and decay. Nat. Rev. Genet. 11 (9), 597–610. doi: 10.1038/nrg2843
Le, T. D., Zhang, J., Liu, L., Li, J. (2015). Ensemble Methods for MiRNA Target Prediction from Expression Data. PloS One 10 (6), e0131627. doi: 10.1371/journal.pone.0131627
Lee, R. C., Feinbaum, R. L., Ambros, V. (1993). The C. elegans heterochronic gene lin-4 encodes small RNAs with antisense complementarity to lin-14. Cell 75 (5), 843–854. doi: 10.1016/0092-8674(93)90529-y
Lin, S. (2010). Rank aggregation methods. Wiley Interdiscip. Rev.: Comput. Stat 2 (5), 555–570. doi: 10.1002/wics.111
Liu, H., Yue, D., Chen, Y., Gao, S. J., Huang, Y. (2010). Improving performance of mammalian microRNA target prediction. BMC Bioinf. 11, 476–491. doi: 10.1186/1471-2105-11-476
Londin, E., Loher, P., Telonis, A. G., Quann, K., Clark, P., Jing, Y., et al. (2015). Analysis of 13 cell types reveals evidence for the expression of numerous novel primate- and tissue-specific microRNAs. Proc. Natl. Acad. Sci. U.S.A. 112 (10), E1106–E1115. doi: 10.1073/pnas.1420955112
Long, D., Lee, R., Williams, P., Chan, C. Y., Ambros, V., Ding, Y. (2007). Potent effect of target structure on microRNA function. Nat. Struct. Mol. Biol. 14 (4), 287–294. doi: 10.1038/nsmb1226
Lu, T. P., Lee, C. Y., Tsai, M. H., Chiu, Y. C., Hsiao, C. K., Lai, L. C., et al. (2012). miRSystem: an integrated system for characterizing enriched functions and pathways of microRNA targets. PloS One 7 (8), e42390. doi: 10.1371/journal.pone.0042390
Lukasik, A., Wojcikowski, M., Zielenkiewicz, P. (2016). Tools4miRs - one place to gather all the tools for miRNA analysis. Bioinformatics 32 (17), 2722–2724. doi: 10.1093/bioinformatics/btw189
Marbach, D., Costello, J. C., Kuffner, R., Vega, N. M., Prill, R. J., Camacho, D. M., et al. (2012). Wisdom of crowds for robust gene network inference. Nat. Methods 9 (8), 796–804. doi: 10.1038/nmeth.2016
McCall, M. N., Kim, M. S., Adil, M., Patil, A. H., Lu, Y., Mitchell, C. J., et al. (2017). Toward the human cellular microRNAome. Genome Res. 27 (10), 1769–1781. doi: 10.1101/gr.222067.117
Min, H., Yoon, S. (2010). Got target? Computational methods for microRNA target prediction and their extension. Exp. Mol. Med. 42 (4), 233–244. doi: 10.3858/emm.2010.42.4.032
Miranda, K. C., Huynh, T., Tay, Y., Ang, Y. S., Tam, W. L., Thomson, A. M., et al. (2006). A pattern-based method for the identification of MicroRNA binding sites and their corresponding heteroduplexes. Cell 126 (6), 1203–1217. doi: 10.1016/j.cell.2006.07.031
Moretti, F., Thermann, R., Hentze, M. W. (2010). Mechanism of translational regulation by miR-2 from sites in the 5' untranslated region or the open reading frame. RNA 16 (12), 2493–2502. doi: 10.1261/rna.2384610
Nam, S., Kim, B., Shin, S., Lee, S. (2008). miRGator: an integrated system for functional annotation of microRNAs. Nucleic Acids Res. 36 (Database issue), D159–D164. doi: 10.1093/nar/gkm829
Oliveira, A. C., Bovolenta, L. A., Nachtigall, P. G., Herkenhoff, M. E., Lemke, N., Pinhal, D. (2017). Combining Results from Distinct MicroRNA Target Prediction Tools Enhances the Performance of Analyses. Front. Genet. 8, 59. doi: 10.3389/fgene.2017.00059
Peterson, S. M., Thompson, J. A., Ufkin, M. L., Sathyanarayana, P., Liaw, L., Congdon, C. B. (2014). Common features of microRNA target prediction tools. Front. Genet. 5, 23. doi: 10.3389/fgene.2014.00023
Pinzon, N., Li, B., Martinez, L., Sergeeva, A., Presumey, J., Apparailly, F., et al. (2017). microRNA target prediction programs predict many false positives. Genome Res. 27 (2), 234–245. doi: 10.1101/gr.205146.116
Qu, Z., Li, W., Fu, B. (2014). MicroRNAs in autoimmune diseases. BioMed. Res. Int. 2014, 527895. doi: 10.1155/2014/527895
Qu, H., Zheng, L., Song, H., Jiao, W., Li, D., Fang, E., et al. (2016). microRNA-558 facilitates the expression of hypoxia-inducible factor 2 alpha through binding to 5'-untranslated region in neuroblastoma. Oncotarget 7 (26), 40657–40673. doi: 10.18632/oncotarget.9813
Reddy, K. B. (2015). MicroRNA (miRNA) in cancer. Cancer Cell Int. 15, 38. doi: 10.1186/s12935-015-0185-1
Rehmsmeier, M., Steffen, P., Hochsmann, M., Giegerich, R. (2004). Fast and effective prediction of microRNA/target duplexes. RNA 10 (10), 1507–1517. doi: 10.1261/rna.5248604
Ritchie, W., Flamant, S., Rasko, J. E. (2009). Predicting microRNA targets and functions: traps for the unwary. Nat. Methods 6 (6), 397–398. doi: 10.1038/nmeth0609-397
Robin, X., Turck, N., Hainard, A., Tiberti, N., Lisacek, F., Sanchez, J. C., et al. (2011). pROC: an open-source package for R and S+ to analyze and compare ROC curves. BMC Bioinf. 12, 77. doi: 10.1186/1471-2105-12-77
Sedaghat, N., Fathy, M., Modarressi, M. H., Shojaie, A. (2018). Combination of Supervised and Unsupervised Approaches for miRNA Target Prediction. IEEE/ACM Trans. Comput. Biol. Bioinform. 15 (5), 1594–1604. doi: 10.1109/TCBB.2017.2727042
Selbach, M., Schwanhausser, B., Thierfelder, N., Fang, Z., Khanin, R., Rajewsky, N. (2008). Widespread changes in protein synthesis induced by microRNAs. Nature 455 (7209), 58–63. doi: 10.1038/nature07228
Sethupathy, P., Megraw, M., Hatzigeorgiou, A. G. (2006). A guide through present computational approaches for the identification of mammalian microRNA targets. Nat. Methods 3 (11), 881–886. doi: 10.1038/nmeth954
Shenoy, A., Blelloch, R. H. (2014). Regulation of microRNA function in somatic stem cell proliferation and differentiation. Nat. Rev. Mol. Cell Biol. 15 (9), 565–576. doi: 10.1038/nrm3854
Shin, C., Nam, J. W., Farh, K. K., Chiang, H. R., Shkumatava, A., Bartel, D. P. (2010). Expanding the microRNA targeting code: functional sites with centered pairing. Mol. Cell 38 (6), 789–802. doi: 10.1016/j.molcel.2010.06.005
Shirdel, E. A., Xie, W., Mak, T. W., Jurisica, I. (2011). NAViGaTing the micronome–using multiple microRNA prediction databases to identify signalling pathway-associated microRNAs. PloS One 6 (2), e17429. doi: 10.1371/journal.pone.0017429
Sticht, C., De La Torre, C., Parveen, A., Gretz, N. (2018). miRWalk: An online resource for prediction of microRNA binding sites. PloS One 13 (10), e0206239. doi: 10.1371/journal.pone.0206239
Thomas, M., Lieberman, J., Lal, A. (2010). Desperately seeking microRNA targets. Nat. Struct. Mol. Biol. 17 (10), 1169–1174. doi: 10.1038/nsmb.1921
Vejnar, C. E., Zdobnov, E. M. (2012). MiRmap: comprehensive prediction of microRNA target repression strength. Nucleic Acids Res. 40 (22), 11673–11683. doi: 10.1093/nar/gks901
Wald, R., Khoshgoftaar, T., Dittman, D. (2012). “Mean Aggregation Versus Robust Rank Aggregation For Ensemble Gene Selection,” in 11th International Conference on Machine Learning and Applications (Boca Raton, Florida, USA: IEEE).
Witkos, T. M., Koscianska, E., Krzyzosiak, W. J. (2011). Practical Aspects of microRNA Target Prediction. Curr. Mol. Med. 11 (2), 93–109. doi: 10.2174/156652411794859250
Xiao, F., Zuo, Z., Cai, G., Kang, S., Gao, X., Li, T. (2009). miRecords: an integrated resource for microRNA-target interactions. Nucleic Acids Res. 37 (Database issue), D105–D110. doi: 10.1093/nar/gkn851
Keywords: microRNA, prediction, target mRNA, aggregation, database, receiver operating characteristic, precision and recall, F-score
Citation: Quillet A, Saad C, Ferry G, Anouar Y, Vergne N, Lecroq T and Dubessy C (2020) Improving Bioinformatics Prediction of microRNA Targets by Ranks Aggregation. Front. Genet. 10:1330. doi: 10.3389/fgene.2019.01330
Received: 13 February 2019; Accepted: 05 December 2019;
Published: 28 January 2020.
Edited by:
Isidore Rigoutsos, Thomas Jefferson University, United StatesReviewed by:
Ramkrishna Mitra, Thomas Jefferson University, United StatesJing Gong, Huazhong Agricultural University, China
Copyright © 2020 Quillet, Saad, Ferry, Anouar, Vergne, Lecroq and Dubessy. This is an open-access article distributed under the terms of the Creative Commons Attribution License (CC BY). The use, distribution or reproduction in other forums is permitted, provided the original author(s) and the copyright owner(s) are credited and that the original publication in this journal is cited, in accordance with accepted academic practice. No use, distribution or reproduction is permitted which does not comply with these terms.
*Correspondence: Christophe Dubessy, Y2hyaXN0b3BoZS5kdWJlc3N5QHVuaXYtcm91ZW4uZnI=
†These authors have contributed equally to this work