 Huan Dong1†
 Qiang Wang1†
 Ning Li1
 Jiajia Lv1Linna Ge1Mengsi Yang1
 Guosen Zhang1
 Yang An1Fengling Wang1
 Longxiang Xie1
 Yongqiang Li1
 Wan Zhu2Haiyu Zhang3Minghang Zhang4
 Xiangqian Guo1*
- 1Department of Predictive Medicine, Institute of Biomedical Informatics, Cell Signal Transduction Laboratory, Bioinformatics Center, Henan Provincial Engineering Center for Tumor Molecular Medicine, School of Software, School of Basic Medical Sciences, Henan University, Kaifeng, China
- 2Department of Anesthesia, Stanford University School of Medicine, Stanford, CA, United States
- 3Department of Pathology, Stanford University School of Medicine, Stanford, CA, United States
- 4Nanjing Jiliang Biotechnology Co., Ltd., Nanjing, China
Glioblastoma (GBM) is the most common malignant tumor of the central nervous system. GBM causes poor clinical outcome and high mortality rate, mainly due to the lack of effective targeted therapy and prognostic biomarkers. Here, we developed a user-friendly Online Survival analysis web server for GlioBlastoMa, abbreviated OSgbm, to assess the prognostic value of candidate genes. Currently, OSgbm contains 684 samples with transcriptome profiles and clinical information from The Cancer Genome Atlas (TCGA), Gene Expression Omnibus (GEO) and Chinese Glioma Genome Atlas (CGGA). The survival analysis results can be graphically presented by Kaplan-Meier (KM) plot with Hazard ratio (HR) and log-rank p value. As demonstration, the prognostic value of 51 previously reported survival associated biomarkers, such as PROM1 (HR = 2.4120, p = 0.0071) and CXCR4 (HR = 1.5578, p < 0.001), were confirmed in OSgbm. In summary, OSgbm allows users to evaluate and develop prognostic biomarkers of GBM. The web server of OSgbm is available at http://bioinfo.henu.edu.cn/GBM/GBMList.jsp.
Introduction
Glioblastoma (GBM) is the most common malignant tumor of the central nervous system (CNS) and causes a high mortality rate (Nikiforova and Hamilton, 2011; Stoyanov et al., 2018). Although many new therapies have improved the clinical outcome and more clinical trials have demonstrated the high efficacy in treating GBM, the survival rate of GBM patients is still low. GBM is a complex disease to tackle with a median survival period of approximately 14 months, and a 5-year survival rate of 5% (Stupp et al., 2005; Johnson and O'Neill, 2012; Polivka et al., 2017). Prognostic biomarkers have been showing great roles in cancer patient management and may guide targeted therapies. Therefore, it is greatly needed to investigate prognostic biomarkers in GBM.
Previous studies have reported some prognostic biomarkers in GBM, such as gene mutation of gene IDH and PTEN, and expression variation of gene CD133 (Yang et al., 2016; Cai and Sughrue, 2017; Nguyen et al., 2018). However, these biomarkers have not been translated to clinical applications due to the lack of independent validation. In addition, due to the molecular heterogeneity among GBMs and limited patient samples (Nathanson et al., 2014; Aldape et al., 2015; Brown et al., 2017), the prognostic behavior of a certain biomarker may be inconsistent or even contradictory between different reports. In other words, cross population validation in a larger patient cohort is critical for evaluating the prognostic biomarker.
In current work, we collected the gene expression profiles and clinical information of 684 GBM patients from seven independent cohorts obtained from TCGA, GEO and CGGA. We developed a user-friendly web server, OSgbm, to analyze the prognostic value of genes of interests. With this web server, it would facilitate researchers and clinicians to screen, develop and validate new prognostic biomarkers in GBM.
Methods
Datasets Collection
GBM datasets are from three major data sources. First, level-3 gene expression profiling data (HiSeqV2) and clinical information of GBM samples were downloaded from TCGA on April 2018 (https://portal.gdc.cancer.gov/). Second, four cohorts (≥30 cases) with available gene expression profiles and clinical survival information were collected from GEO database (http://www.ncbi.nlm.nih.gov/geo/). Third, two GBM cohorts were gathered from CGGA (http://www.cgga.org.cn/). After an initial filtration and quality check (with available gene expression profiling data and clinical survival information), 153 samples from TCGA, 276 samples from GEO, and 255 samples from CGGA were included for the following database and web server construction. The histology of recurrent GBM (rGBM) were included in GSE7696 (10 samples), GSE42669 (11 samples), CGGAarray (9 samples) and CGGAseq (22 samples) datasets. Two CGGA datasets also included 20 samples of secondary GBM (sGBM).
System Implementation and Server Set-Up
OSgbm is a web-based tool which uses J2EE (Java 2 Platform Enterprise Edition) architecture as we previously described (Wang et al., 2019; Wang et al., 2019; Xie et al., 2019a; Zhang et al., 2019). The gene expression and clinical data were integrated in the background database, which was handled by a MySQL server. Dynamic web interfaces were written in HTML 5.0 and hosted by Tomcat on Windows Server. Using OSgbm requires a HTML 5.0-compliant browser with JavaScript enabled, but does not require any particular visual plug-in tool. Since the web server was designed for users with no specialized bioinformatics skills, we propose ‘out-of-the-box’ data. The input of OSgbm web server is official gene symbol. For the “Data Source: Combined” option, as all the datasets used in OSgbm already have been published, processed and normalized well, in order to avoid of the batch effect and platform biases among these datasets, we first stratify the patients into high- and low-expression group for the input gene in each dataset, and then merged relative patients from high- and low-expression group from each dataset into a combined high-expression group (Upper group in the Kaplan–Meier plot) and a combined low-expression group (Lower group in the Kaplan–Meier plot) for the analysis of Kaplan–Meier plot and log-rank test. The statistical analyses of input were performed with R package: KM curves with Hazard ratio (HR, 95% confidence interval) and log-rank p value were calculated by R package ‘survival’. OSgbm is available at http://bioinfo.henu.edu.cn/GBM/GBMList.jsp.
Validation of Previously Reported Prognostic Biomarkers
A PubMed search was performed to identify previously reported GBM prognostic biomarkers, using keywords ‘glioblastoma’, ‘survival’ and ‘biomarker’. Totally, 53 prognostic biomarkers were identified from 2013 publications. The flow chart of biomarker collection was showed in Figure S1. The prognostic values of these published biomarkers were analyzed in either a form of combined cohorts of all GBM patients or in a single cohort in our database.
Results
The Clinical Characteristics of GBM Datasets Used in OSgbm
In OSgbm, we included a total of 684 unique GBM samples from seven datasets, including one TCGA cohort, four GEO cohorts and two CGGA cohorts. The survival information includes overall survival (OS), disease specific survival (DSS), disease free interval (DFI) and progression free interval (PFI) (Liu et al., 2018). The confounding clinical factors, such as age, grade, gender, histology and treatment regimens were included as well. Clinical characteristics of these datasets in the OSgbm were presented in Table 1. All of the 684 patients have OS data, and the median OS time was 13.44 months, while 153 GBM patients from TCGA cohort have four above mentioned survival terms (OS, DSS, DFI and PFI). The median age of all the patients is 50 years. The death rate is 78.49%. A large proportion of the patients are in grade IV, especially in the two CGGA datasets (99.28% and 100%, respectively).
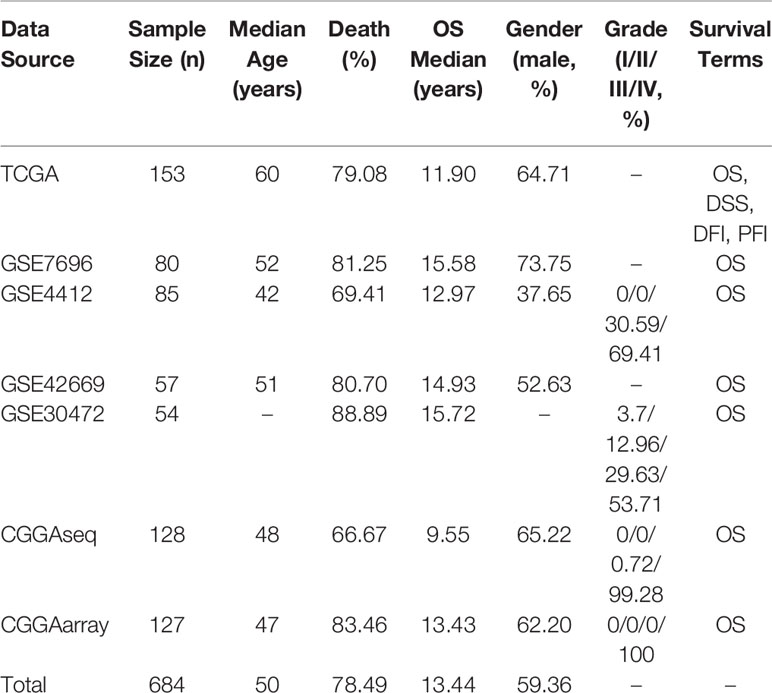
Table 1 Clinical characteristics of each GBM dataset used in OSgbm.
Set-Up of OSgbm Web Server
The main function of OSgbm web server is to evaluate and determine the prognostic value of the quested genes. The users start by typing the gene symbol and choosing one dataset of interest or the combined dataset with pooling all the datasets together. To measure the association between a quested gene and survival, GBM samples are categorized according to the median (or other appropriate cutoff value, such as Trichotomy, Quartile) of the selected gene, and KM analysis is used to compare the outcomes between groups (Xie et al., 2019b). The user could limit the analysis in a subgroup of the patients by setting the age range, grade, gender and so on. Once the gene symbol is input and clinical characters are chosen, OS, DSS, DFI or PFI of each stratified group can be measured and analysis results will be available on the output web page. The prognostic value of each given gene is determined by HR (95% CI) and log-rank p value.
Validation of Previously Reported GBM Prognostic Biomarkers
To determine the performance of this online tool, 53 previously published GBM prognostic factors collected as the procedure shown in Figure S1 and then they were evaluated in OSgbm (Table 2, Figure 1) (Sano et al., 1999; Hung and Howng, 2003; Heimberger et al., 2005; Aaberg-Jessen et al., 2009; Shirai et al., 2009; Pu et al., 2011; Cui et al., 2013; De Tayrac et al., 2013; Lee et al., 2013; Rosati et al., 2013; Wang et al., 2013; Wu et al., 2013; Bai et al., 2014; Han et al., 2014; Meng et al., 2014; Olmez et al., 2014; Zupancic et al., 2014; Maris et al., 2015; Moutal et al., 2015; Yan et al., 2015; Zhao et al., 2015; Chaurasia et al., 2016; Nduom et al., 2016; Steponaitis et al., 2016; Steponaitis et al., 2016; Zhang et al., 2016a; Zhang et al., 2016b; Deng et al., 2017; Dong et al., 2017; Ge et al., 2017; Han et al., 2017; Haynes et al., 2017; Huang et al., 2017; Li et al., 2017; Luo and Zhuang, 2017; Ma et al., 2017; Mu et al., 2017; Roy et al., 2017; Wu et al., 2017; Zhang et al., 2017; Cai et al., 2018; Cetin et al., 2018; Cheng et al., 2018; Chou et al., 2018; Dahlrot et al., 2018; Gonçalves et al., 2018; Hayashi et al., 2018; Lv et al., 2018; Qian et al., 2018; Vasaikar et al., 2018; Hallal et al., 2019). OS was selected as the survival term. Among these prognostic genes, 51 of them showed significant prognostic ability in a large-scale combined cohort (33 genes) or in single cohort (18 genes), which were consistent with the prognostic value reported in the literature. The remaining two genes (IGF1R and PCBP2) display significant prognostic values in OSgbm, but is contradictory to what was reported in the literatures. Both of them were shown as favorable prognostic biomarkers in OSgbm but were reported to be unfavorable GBM prognostic biomarkers in previous reports (Table 2) (Maris et al., 2015; Luo and Zhuang, 2017).
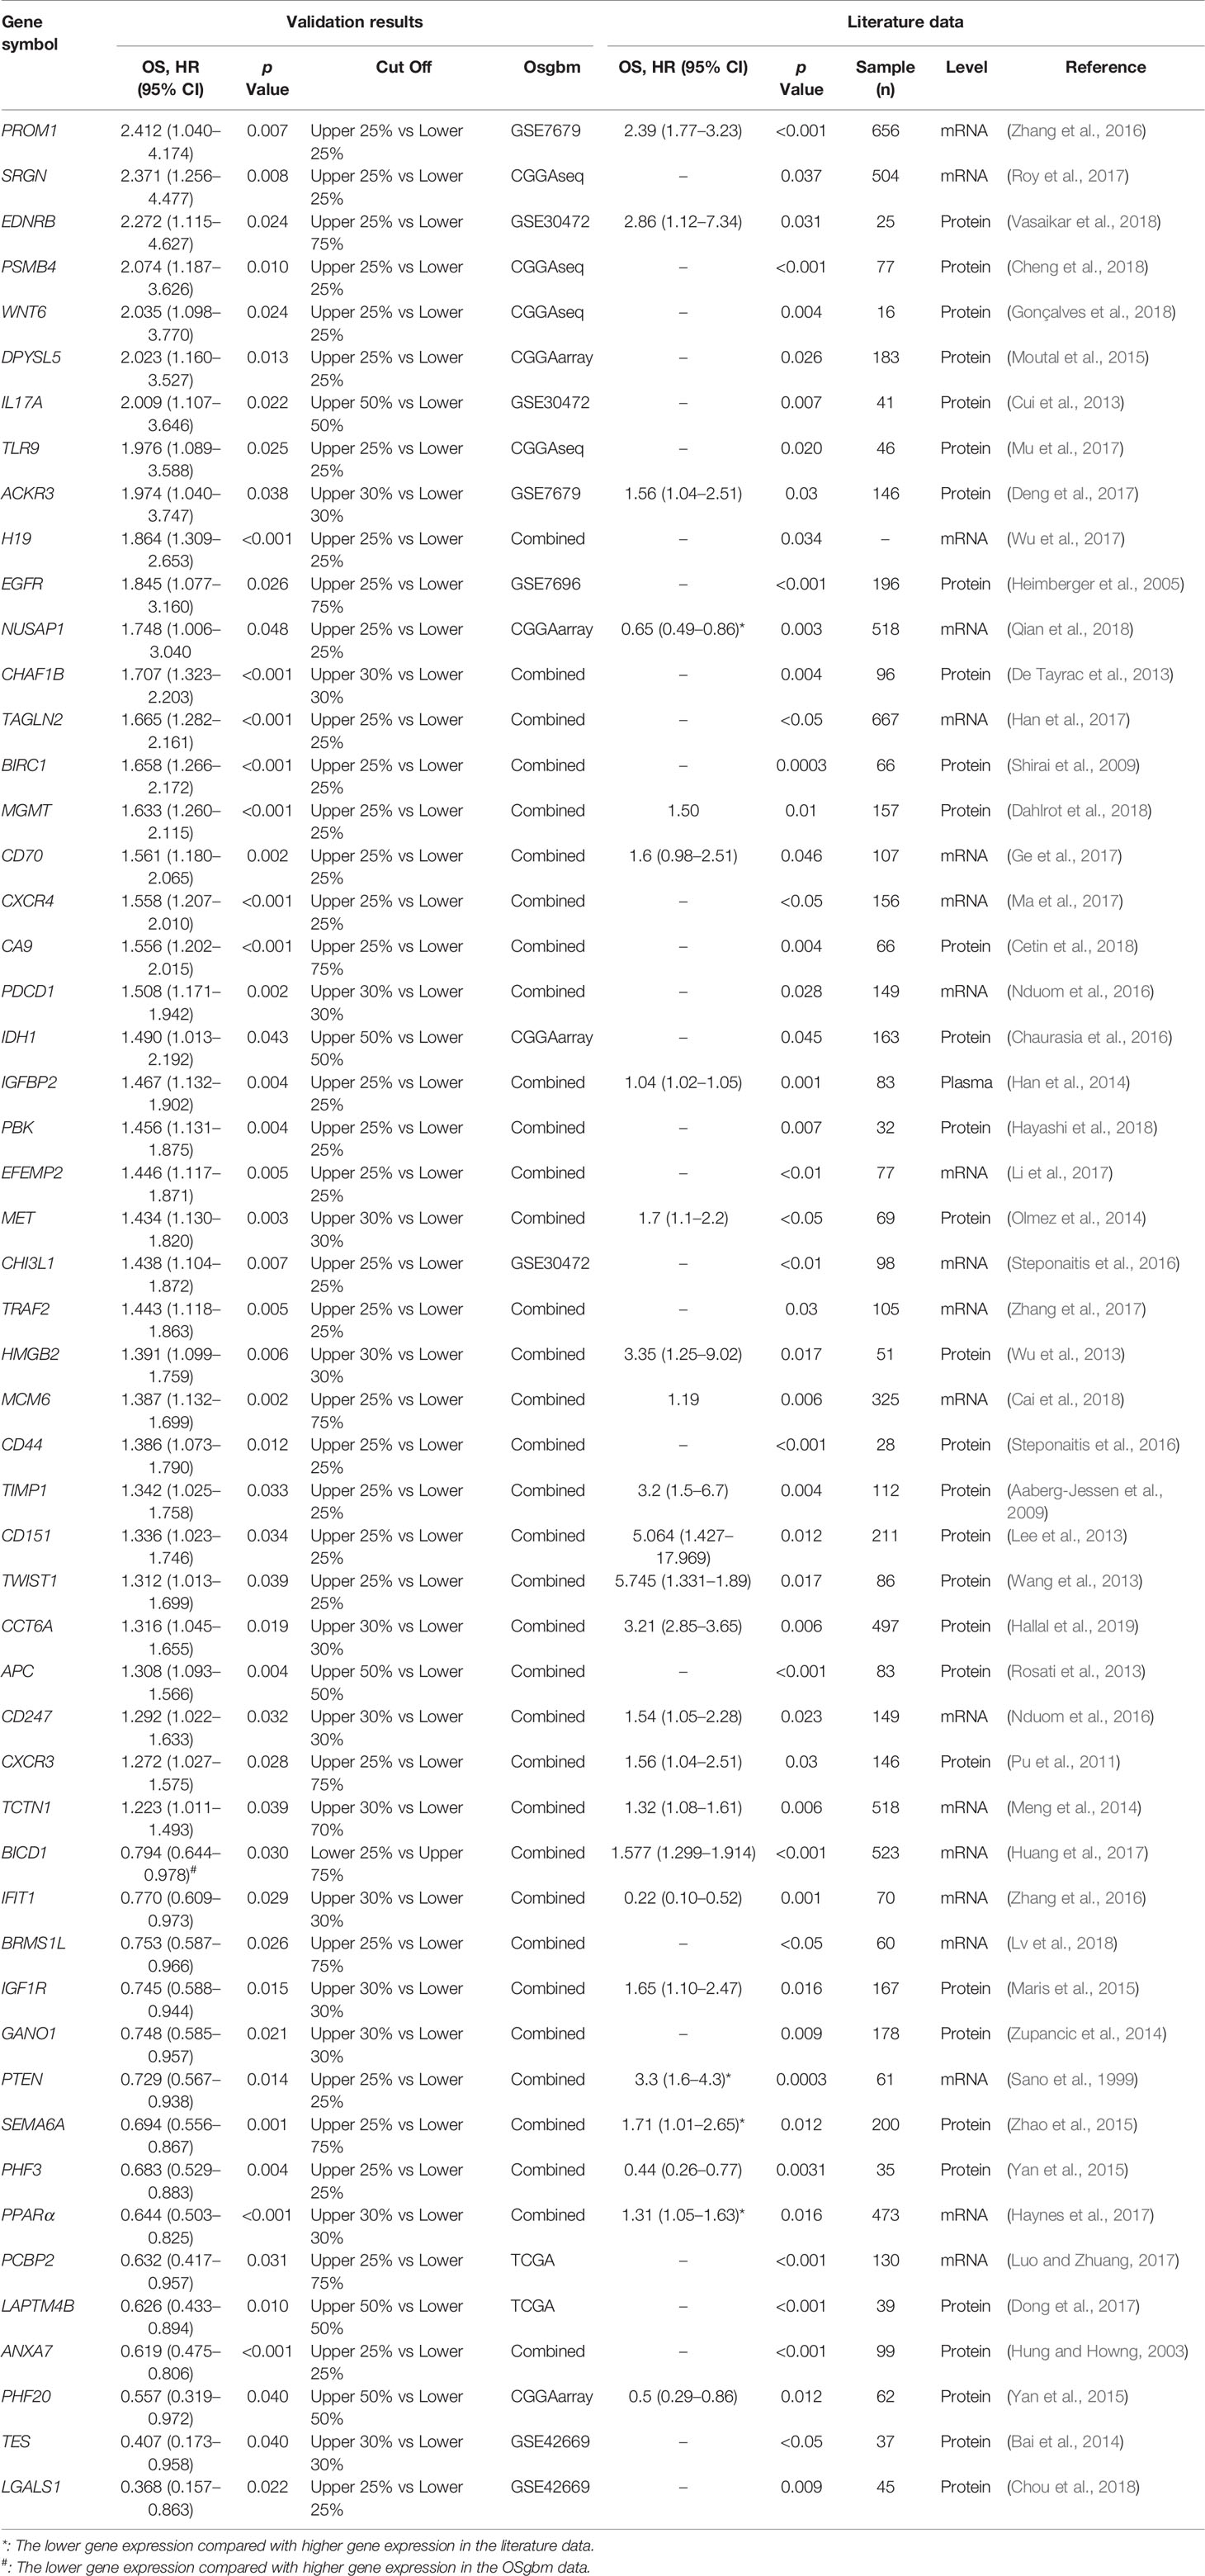
Table 2 Validation of previously reported prognostic biomarkers in OSgbm.
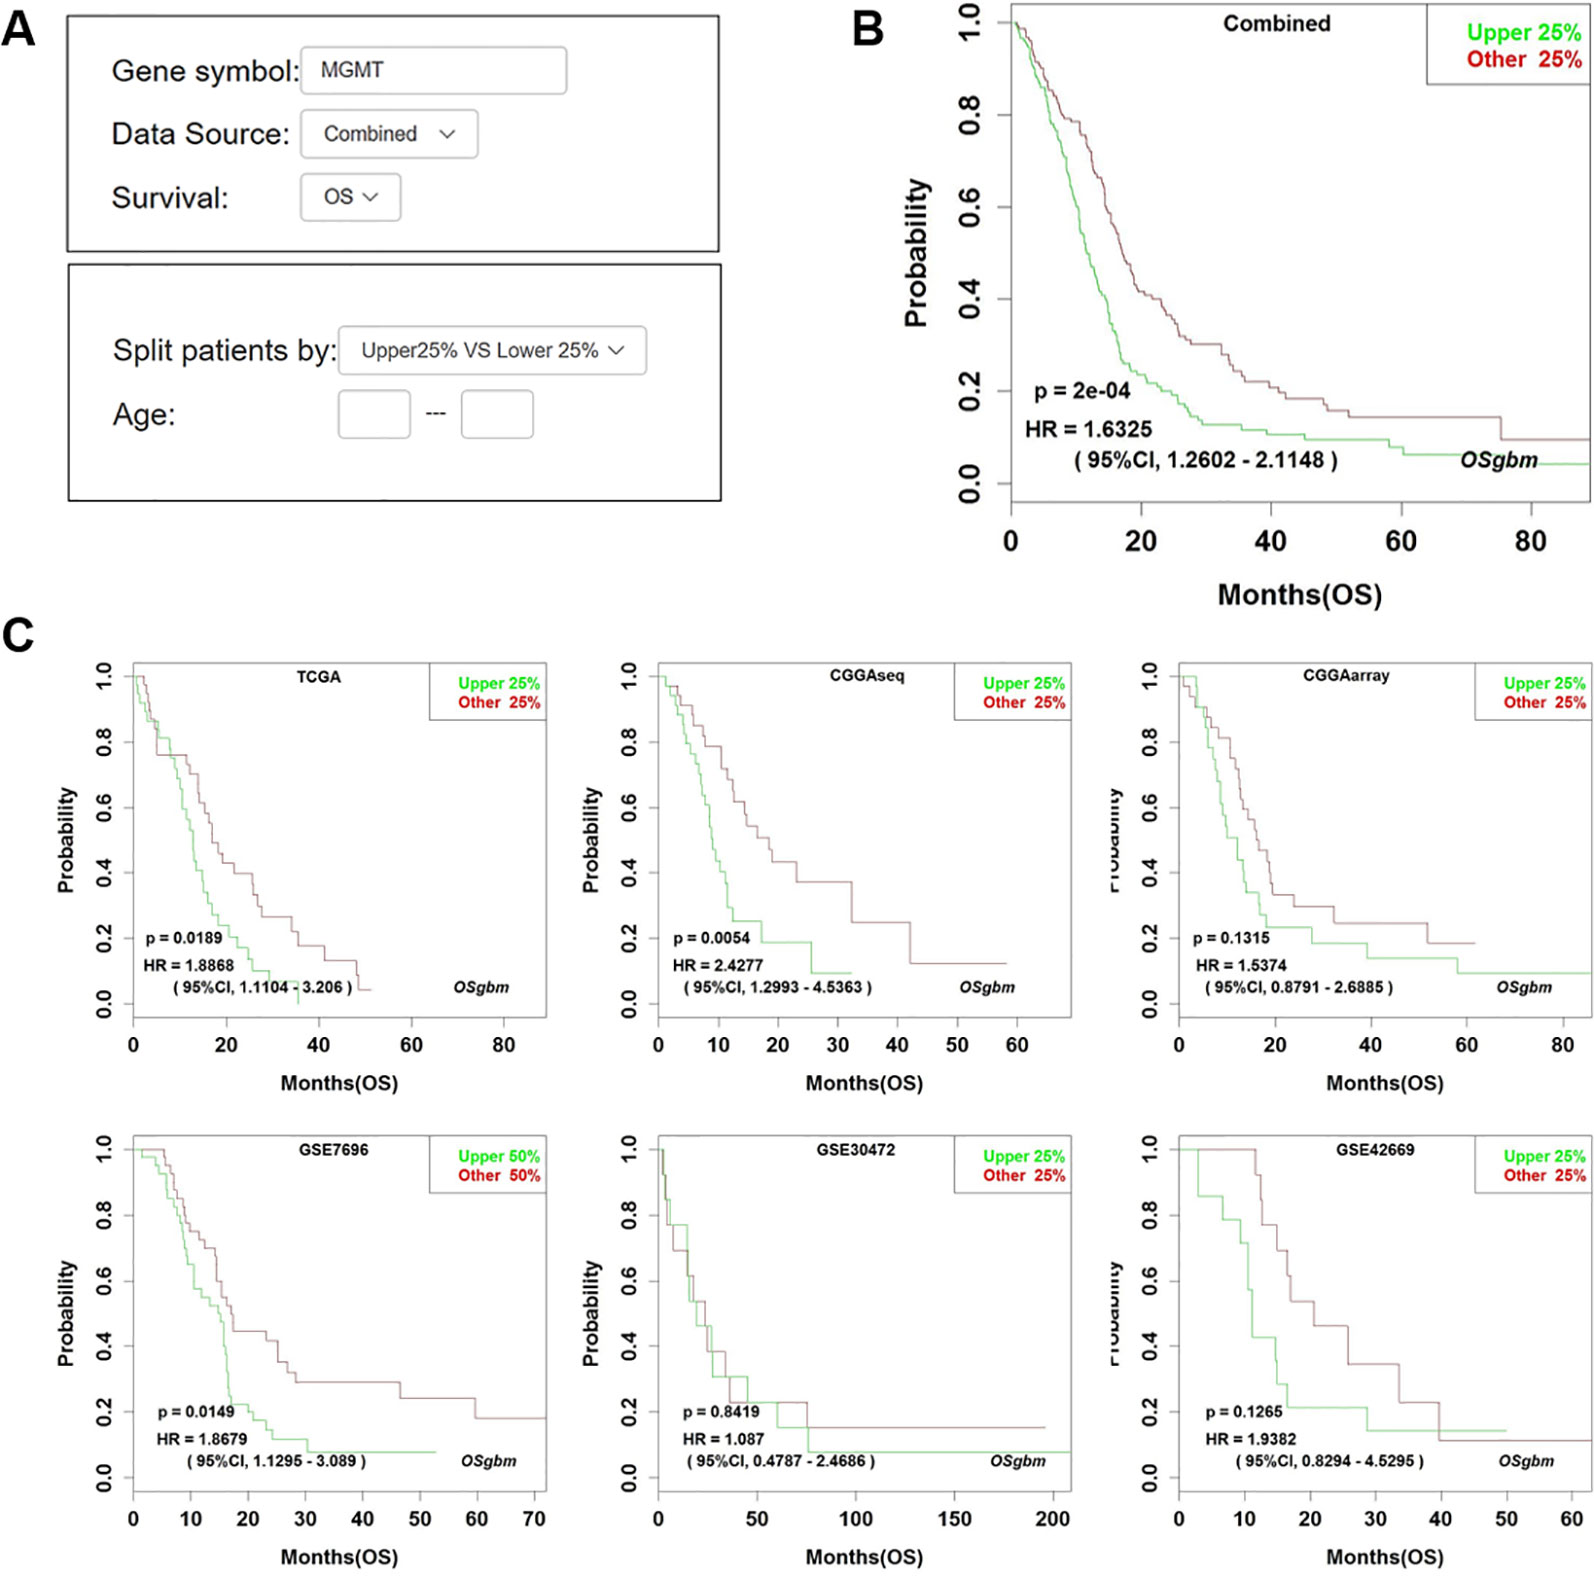
Figure 1 Analysis of the prognostic value of MGMT in OSgbm. (A) The options of input parameters used in the prognostic analysis of MGMT in OSgbm. (B) The output web page of prognosis analysis of MGMT using a combined cohort with pooling all datasets together in OSgbm. (C) The OSgbm output of gene MGMT in single cohort.
Discussion
The development of prognostic biomarkers is important for guiding the treatments especially for therapy-resistant GBM patients. In our work, we developed a new web server, OSgbm, to help researchers to evaluate the prognostic value of a given gene for GBM patients. OSgbm is easy to use and requires no special skills (such as bioinformatics training). With filtering by one or several clinical confounding factors provided in OSgbm, users can also evaluate the prognostic value of their interested genes according to their special needs. The function and performance tests of OSgbm web server showed that 96% (51 out of 53) of previously reported prognostic biomarkers could be confirmed in OSgbm, which indicates that these biomarkers validated in independent cohorts have the potency of translating to clinical applications, and also indicates the well performance of OSgbm. Nevertheless, there are two genes including IGF1R and PCBP2 which showed different prognostic values to the literatures, the discrepancy of prognostic performance of IGF1R and PCBP2 between OSgbm and literatures may be caused by race, different cohort size, or analysis level and methods (mRNA vs. protein, gene microarray vs. immunohistochemistry) (Maris et al., 2015; Luo and Zhuang, 2017). For example, the race reported in literatures for PCBP2 is Asian, while that in validated cohort of OSgbm is mostly White. The mRNA level was analyzed in OSgbm for IGF1R, while IGF1R was determined by immunohistochemistry in literature. In addition, the race analyzed in OSgbm for IGF1R is Asian (Korea for GSE42669 and Chinese for CGGA), while the race reported in literature for IGF1R is European. As a result, it will be necessary to validate the prognostic performance of IGF1R and PCBP2 in a larger independent cohort of glioblastoma.
In conclusion, OSgbm is a user-friendly web server to help researchers and clinicians to identify suitable prognostic biomarkers in GBM. Furthermore, we will keep update the database of OSgbm to collect more and more GBM datasets when new GBM dataset is available, and will implement the multivariate cox proportional hazards model into OSgbm for the purpose of adjustment for the confounding clinical factors, and we also encourage users to contact us to upload their own data into OSgbm.
Data Availability Statement
All datasets for this study are included in the article/Supplementary Material.
Author Contributions
XG conceived and directed the project. HD and QW collected data and developed the web server. HD, NL, JL, LG, MY, GZ, YA, FW, LX, and YL performed data analysis. WZ, HZ, and MZ contributed to data analysis and paper writing. XG and HD wrote the manuscript with the assistance and approval of all authors.
Conflict of Interest
Author MZ is employed by company of Nanjing Jiliang Biotechnology Co., Ltd.
The remaining authors declare that the research was conducted in the absence of any commercial or financial relationships that could be construed as a potential conflict of interest.
Acknowledgments
This work was supported by the National Natural Science Foundation of China (No. 81602362), the program for Science and Technology Development in Henan Province (No. 162102310391), the supporting grants of Henan University (No. 2015YBZR048; No. B2015151), the program for Innovative Talents of Science and Technology in Henan Province (No. 18HASTIT048), and Yellow River Scholar Program (No. H2016012), Kaifeng Science and Technology Major Project (No. 18ZD008).
Supplementary Material
The Supplementary Material for this article can be found online at: https://www.frontiersin.org/articles/10.3389/fgene.2019.01378/full#supplementary-material
References
Aaberg-Jessen, C., Christensen, K., Offenberg, H., Bartels, A., Dreehsen, T., Hansen, S., et al. (2009). Low expression of tissue inhibitor of metalloproteinases-1 (TIMP-1) in glioblastoma predicts longer patient survival. J. Neurooncol. 95, 117–128. doi: 10.1007/s11060-009-9910-8
Aldape, K., Zadeh, G., Mansouri, S., Reifenberger, G., von Deimling, A. (2015). Glioblastoma: pathology, molecular mechanisms and markers. Acta Neuropathol. 129, 829–848. doi: 10.1007/s00401-015-1432-1
Bai, Y., Zhang, Q., Wang, X. (2014). Downregulation of TES by hypermethylation in glioblastoma reduces cell apoptosis and predicts poor clinical outcome. Eur. J. Med. Res. 19, 66. doi: 10.1186/s40001-014-0066-4
Brown, D. V., Filiz, G., Daniel, P. M., Hollande, F., Dworkin, S., Amiridis, S., et al. (2017). Expression of CD133 and CD44 in glioblastoma stem cells correlates with cell proliferation, phenotype stability and intra-tumor heterogeneity. PloS One 12, e0172791. doi: 10.1371/journal.pone.0172791
Cai, X., Sughrue, M. E. (2017). Glioblastoma: new therapeutic strategies to address cellular and genomic complexity. Oncotarget 20, 9540–9554. doi: 10.18632/oncotarget.23476
Cai, H., Cheng, Z., Zhang, H., Wang, P., Zhang, Y., Hao, J., et al. (2018). Overexpression of MCM6 predicts poor survival in patients with glioma. Hum. Pathol. 78, 182–187. doi: 10.1016/j.humpath.2018.04.024
Cetin, B., Gonul, I. I., Gumusay, O., Bilgetekin, I., Algin, E., Ozet, A., et al. (2018). Carbonic anhydrase IX is a prognostic biomarker in glioblastoma multiforme. Neuropathology 38, 457–462. doi: 10.1111/neup.12485.
Chaurasia, A., Park, S. H., Seo, J. W., Park, C. K. (2016). Immunohistochemical analysis of ATRX, IDH1 and p53 in glioblastoma and their correlations with patient survival. J. Korean Med. Sci. 31, 1208–1214. doi: 10.3346/jkms.2016.31.8.1208
Cheng, Y., Tsai, W., Sung, Y., Chang, H., Chen, Y. (2018). Interference with PSMB4 expression exerts an anti-tumor effect by decreasing the invasion and proliferation of human glioblastoma cells. Cell Physiol. Biochem. 45, 819–831. doi: 10.1159/000487174
Chou, S., Yen, S., Huang, C., Huang, E. (2018). Galectin-1 is a poor prognostic factor in patients with glioblastoma multiforme after radiotherapy. BMC Cancer 18, 105. doi: 10.1186/s12885-018-4025-2
Cui, X., Xu, Z., Zhao, Z., Sui, D., Ren, X., Huang, Q., et al. (2013). Analysis of CD137L and IL-17 expression in tumor tissue as prognostic indicators for gliblastoma. Int. J. Biol. Sci. 9, 134–141. doi: 10.7150/ijbs.4891
Dahlrot, R. H., Dowsett, J., Fosmark, S., Malmström, A., Henriksson, R., Boldt, H., et al. (2018). Prognostic value of O-6-methylguanine-DNA methyltransferase (MGMT) protein expression in glioblastoma excluding nontumour cells from the analysis. Neuropathol. Appl. Neurobiol. 44, 172–184. doi: 10.1111/nan.12415
De Tayrac, M., Saikali, S., Aubry, M., Bellaud, P., Boniface, R., Quillien, V., et al. (2013). Prognostic significance of EDN/RB, HJURP, p60/CAF-1 and PDLI4, four new markers in high-grade gliomas. PloS One 8, e73332. doi: 10.1371/journal.pone.0073332
Deng, L., Zheng, W., Dong, X., Liu, J., Zhu, C., Lu, D., et al. (2017). Chemokine receptor CXCR7 is an independent prognostic biomarker in glioblastoma. Cancer Biomark. 20, 1–6. doi: 10.3233/CBM-151430
Dong, X., Tamura, K., Kobayashi, D., Ando, N., Sumita, K., Maehara, T. (2017). LAPTM4B-35 is a novel prognostic factor for glioblastoma. J. Neurooncol. 132, 295–303. doi: 10.1007/s11060-017-2369-0
Ge, H., Mu, L., Jin, L., Yang, C., Chang, Y., Long, Y., et al. (2017). Tumor associated CD70 expression is involved in promoting tumor migration and macrophage infiltration in GBM. Int. J. Cancer 141, 1434–1444. doi: 10.1002/ijc.30830
Gonçalves, C. S., Vieira de Castro, J., Pojo, M., Martins, E. P., Queirós, S., Chautard, E., et al. (2018). WNT6 is a novel oncogenic prognostic biomarker in human glioblastoma. Theranostics 8, 4805–4823. doi: 10.7150/thno.25025
Hallal, S., Russell, B. P., Wei, H., Lee, M. Y. T., Toon, C. W., Sy, J., et al. (2019). Extracellular Vesicles from neurosurgical aspirates identifies chaperonin containing TCP1 subunit 6A as a potential glioblastoma biomarker with prognostic significance. Proteomics 19, e1800157. doi: 10.1002/pmic.201800157
Han, S., Meng, L., Han, S., Wang, Y., Wu, A. (2014). Plasma IGFBP-2 levels after postoperative combined radiotherapy and chemotherapy predict prognosis in elderly glioblastoma patients. PloS One 9, e93791. doi: 10.1371/journal.pone.0093791
Han, M., Xu, R., Xu, Y., Zhang, X., Ni, S., Huang, B., et al. (2017). TAGLN2 is a candidate prognostic biomarker promoting tumorigenesis in human gliomas. J. Exp. Clin. Cancer Res. 36, 155. doi: 10.1186/s13046-017-0619-9
Hayashi, T., Hayakawa, Y., Koh, M., Tomita, T., Nagai, S., Kashiwazaki, D., et al. (2018). Impact of a novel biomarker, T-LAK cell-originating protein kinase (TOPK) expression on outcome in malignant glioma. Neuropathology 38, 144–153. doi: 10.1111/neup.12446
Haynes, H. R., White, P., Hares, K. M., Redondo, J., Kemp, K. C., Singleton, W. G. B., et al. (2017). The transcription factor PPARα is overexpressed and is associated with a favourable prognosis in IDH-wildtype primary glioblastoma. Histopathology 70, 1030–1043. doi: 10.1111/his.13142
Heimberger, A. B., Hlatky, R., Suki, D., Yang, D., Weinberg, J., Gilbert, M., et al. (2005). Prognostic effect of epidermal growth factor receptor and EGFRvIII in glioblastoma multiforme patients. Clin. Cancer Res. 11, 1462–1466. doi: 10.1158/1078-0432.CCR-04-1737
Huang, S. P., Chang, Y. C., Low, Q. H., Wu, A. T. H., Chen, C. L., Lin, Y. F., et al. (2017). BICD1 expression, as a potential biomarker for prognosis and predicting response to therapy in patients with glioblastomas. Oncotarget 8, 113766–113791. doi: 10.18632/oncotarget.22667
Hung, K. S., Howng, S. L. (2003). Prognostic significance of annexin VII expression in glioblastomas multiforme in humans. J. Neurosurg. 99, 886–892. doi: 10.3171/jns.2003.99.5.0886
Johnson, D. R., O'Neill, B. P. (2012). Glioblastoma survival in the United States before and during the temozolomide era. J. Neurooncol. 107, 359–364. doi: 10.1002/cncr.26494
Lee, D., Suh, Y. L., Park, T. I., Do, I. G., Seol, H. J., Nam, D. H., et al. (2013). Prognostic significance of tetraspanin CD151 in newly diagnosed glioblastomas. J. Surg. Oncol. 107, 646–652. doi: 10.1002/jso.23249
Li, F., Li, Y., Zhang, K., Li, Y., He, P., Liu, Y., et al. (2017). FBLN4 as candidate gene associated with long-term and short-term survival with primary glioblastoma. Onco. Targets Ther. 10, 387–395. doi: 10.2147/OTT.S117165
Liu, J., Lichtenberg, T., Hoadley, K. A., Poisson, L. M., Lazar, A. J., Cherniack, A. D., et al. (2018). An integrated tcga pan-cancer clinical data resource to drive high-quality survival outcome analytics. Cell 173, 400–416. doi: 10.1016/j.cell.2018.02.052
Luo, K., Zhuang, K. (2017). High expression of PCBP2 is associated with progression and poor prognosis in patients with glioblastoma. BioMed. Pharmacother. 94, 659–665. doi: 10.1016/j.biopha.2017.07.103
Lv, J., Yang, H., Wang, X., He, R., Ding, L., Sun, X. (2018). Decreased BRMS1L expression is correlated with glioma grade and predicts poor survival in glioblastoma via an invasive phenotype. Cancer Biomark. 22, 311–316. doi: 10.3233/CBM-171019
Ma, X., Shang, F., Zhu, W., Lin, Q. (2017). CXCR4 expression varies significantly among different subtypes of glioblastoma multiforme (GBM) and its low expression or hypermethylation might predict favorable overall survival. Expert Rev. Neurother 7, 941–946. doi: 10.1080/14737175.2017.1351299
Maris, C., D'Haene, N., Trépant, A. L., Le Mercier, M., Sauvage, S., Allard, J. (2015). IGF-IR: a new prognostic biomarker for human glioblastoma. Br. J. Cancer 113, 729–737. doi: 10.1038/bjc.2015.242
Meng, D., Chen, Y., Zhao, Y., Wang, J., Yun, D., Yang, S., et al. (2014). Expression and prognostic significance of TCTN1 in human glioblastoma. J. Transl. Med. 12, 288. doi: 10.1186/s12967-014-0288-9
Moutal, A., Honnorat, J., Massoma, P., Désormeaux, P., Bertrand, C., Malleval, C., et al. (2015). CRMP5 controls glioblastoma cell proliferation and survival through notch-dependent signaling. Cancer Res. 75, 3519–3528. doi: 10.1158/0008-5472.CAN-14-0631
Mu, L., Wang, Y., Wang, Y., Zhang, H., Shang, D., Tan, F., et al. (2017). Tumor location and survival outcomes in adult patients with supratentorial glioblastoma by levels of toll-like receptor 9 expression. World Neurosurg. 97, 279–283. doi: 10.1016/j.wneu.2016.10.015
Nathanson, D. A., Gini, B., Mottahedeh, J., Visnyei, K., Koga, T., Gomez, G., et al. (2014). Targeted therapy resistance mediated by dynamic regulation of extrachromosomal mutant EGFR DNA. Science 343, 72–76. doi: 10.1126/science.1241328
Nduom, E. K., Wei, J., Yaghi, N. K., Huang, N., Kong, L. Y., Gabrusiewicz, K., et al. (2016). PD-L1 expression and prognostic impact in glioblastoma. Neuro Oncol. 18, 195–205. doi: 10.1093/neuonc/nov172
Nguyen, H. S., Shabani, S., Awad, A. J., Kaushal, M., Doan, N. (2018). Molecular markers of therapy-resistant glioblastoma and potential strategy to combat resistance. Int. J. Mol. Sci. 19. doi: 10.3390/ijms19061765
Nikiforova, M. N., Hamilton, R. L. (2011). Molecular diagnostics of gliomas. Arch. Pathol. Lab. Med. 135, 558–568. doi: 10.1043/2010-0649-RAIR.1
Olmez, O. F., Cubukcu, E., Evrensel, T., Kurt, M., Avci, N., Tolunay, S., et al. (2014). The immunohistochemical expression of c-Met is an independent predictor of survival in patients with glioblastoma multiforme. Clin. Transl. Oncol. 16, 173–177. doi: 10.1007/s12094-013-1059-4
Polivka, J, Jr, Polivka, J., Holubec, L., Kubikova, T., Priban, V., Hes, O., et al. (2017). Advances in experimental targeted therapy and immunotherapy for patients with glioblastoma multiforme. Anticancer Res. 37, 21–33. doi: 10.21873/anticanres.11285
Pu, Y., Li, S., Zhang, C., Bao, Z., Yang, Z., Sun, L. (2011). High expression of CXCR3 is an independent prognostic factor in glioblastoma patients that promotes an invasive phenotype. J. Neurooncol. 122, 43–51. doi: 10.1007/s11060-014-1692-y
Qian, Z., Li, Y., Ma, J., Xue, Y., Xi, Y., et al. (2018). Prognostic value of NUSAP1 in progression and expansion of glioblastoma multiforme. J. Neurooncol. 140, 199–208. doi: 10.1007/s11060-018-2942-1
Rosati, A., Poliani, P. L., Todeschini, A., Cominelli, M., Medicina, D., Cenzato, M., et al. (2013). Glutamine synthetase expression as a valuable marker of epilepsy and longer survival in newly diagnosed glioblastoma multiforme. Neuro Oncol. 15, 618–625. doi: 10.1093/neuonc/nos338.
Roy, A., Attarha, S., Weishaupt, H., Edqvist, P. H., Swartling, F. J., Bergqvist, M., et al. (2017). Serglycin as a potential biomarker for glioma: association of serglycin expression, extent of mast cell recruitment and glioblastoma progression. Oncotarget 11, 24815–24827. doi: 10.18632/oncotarget.15820
Sano, T., Lin, H., Chen, X., Langford, L. A., Koul, D., Bondy, M. L., et al. (1999). Differential expression of MMAC/PTEN in glioblastoma multiforme: relationship to localization and prognosis. Cancer Res. 59, 1820–1824.
Shirai, K., Suzuki, Y., Oka, K., Noda, S. E., Katoh, H., Suzuki, Y., et al. (2009). Nuclear survivin expression predicts poorer prognosis in glioblastoma. J. Neurooncol. 91, 353–358. doi: 10.1007/s11060-008-9720-4
Steponaitis, G., Skiriutė, D., Kazlauskas, A., Golubickaitė, I., Stakaitis, R., Tamašauskas, A., et al. (2016). High CHI3L1 expression is associated with glioma patient survival. Diagn. Pathol. 11, 42. doi: 10.1186/s13000-016-0492-4
Stoyanov, G. S., Dzhenkov, D., Ghenev, P., Iliev, B., Enchev, Y., Tonchev, A. B. (2018). Cell biology of glioblastoma multiforme: from basic science to diagnosis and treatment. Med. Oncol. 35, 27. doi: 10.1007/s12032-018-1083-x
Stupp, R., Mason, W. P., van den Bent, M. J., Weller, M., Fisher, B., Taphoorn, M. J., et al. (2005). Radiotherapy plus concomitant and adjuvant temozolomide for glioblastoma. N Engl. J. Med. 352, 987–996. doi: 10.1056/NEJMoa043330
Vasaikar, S., Tsipras, G., Landázuri, N., Costa, H., Wilhelmi, V., Scicluna, P., et al. (2018). Overexpression of endothelin B receptor in glioblastoma: a prognostic marker and therapeutic target? BMC Cancer 18, 154. doi: 10.1074/jbc.M110.178012
Wang, S., Ke, Y., Lu, G., Song, Z., Yu, L., Xiao, S., et al. (2013). Vasculogenic mimicry is a prognostic factor for postoperative survival in patients with glioblastoma. J. Neurooncol. 112, 339–345. doi: 10.1007/s11060-013-1077-7
Wang, Q., Xie, L., Dang, Y., Sun, X., Xie, T., Guo, J., et al. (2019). OSlms: A web server to evaluate the prognostic value of genes in Leiomyosarcoma. Front. Oncol. 9, 190. doi: 10.3389/fonc.2019.00190
Wang, Q., Wang, F., Lv, J., Xin, J., Xie, L., Zhu, W., et al. (2019). Interactive online consensus survival tool for esophageal squamous cell carcinoma prognosis analysis. Oncol. Lett. 18, 1199–1206. doi: 10.3892/ol.2019.10440
Wu, Z., Cai, L., Lin, S., Xiong, Z., Lu, J., Mao, Y., et al. (2013). High-mobility group box 2 is associated with prognosis of glioblastoma by promoting cell viability, invasion, and chemotherapeutic resistance. Neuro Oncol. 15, 1264–1275. doi: 10.1093/neuonc/not078
Wu, W., Hu, Q., Nie, E., Yu, T., Wu, Y., Zhi, T., et al. (2017). Hypoxia induces H19 expression through direct and indirect Hif-1α activity, promoting oncogenic effects in glioblastoma. Sci. Rep. 7, 45029. doi: 10.1038/srep45029
Xie, L., Wang, Q., Dang, Y., Ge, L., Sun, X., Li, N., et al. (2019a). OSkirc: a web tool for identifying prognostic biomarkers in kidney renal clear cell carcinoma. Future Oncol 15, 3103–3110. doi: 10.2217/fon-2019-0296
Xie, L., Dang, Y., Guo, J., Sun, X., Xie, T., Zhang, L., et al. (2019b). High KRT8 expression independently predicts poor prognosis for lung adenocarcinoma patients. Genes (Basel) 10. doi: 10.3390/genes10010036
Yan, J., Kong, L. Y., Hu, J., Gabrusiewicz, K., Dibra, D., Xia, X., et al. (2015). Autoantibodies against GLEA2 and PHF3 in glioblastoma: tumor-associated autoantibodies correlated with prolonged survival. J. Natl. Cancer Inst. 107 (8). doi: 10.1002/ijc.20929
Yang, P., Cai, J., Yan, W., Zhang, W., Wang, Y., Chen, B., et al. (2016). Classification based on mutations of TERT promoter and IDH characterizes subtypes in grade II/III gliomas. Neuro Oncol. 18, 1099–1108. doi: 10.1093/neuonc/now021
Zhang, W., Chen, H., Lv, S., Yang, H. (2016a). High CD133 expression is associated with worse prognosis in patients with glioblastoma. Mol. Neurobiol. 53, 2354–2360. doi: 10.1007/s12035-015-9187-1
Zhang, J., Chen, Y., Lin, G., Zhang, J., Tang, W., Huang, J., et al. (2016b). High IFIT1 expression predicts improved clinical outcome, and IFIT1 along with MGMT more accurately predicts prognosis in newly diagnosed glioblastoma. Hum. Pathol. 52, 136–144. doi: 10.1016/j.humpath.2016.01.013
Zhang, W., Sun, Y., Liu, L., Li, Z. (2017). Prognostic significance of TNFR-associated factor 1 and 2 (TRAF1 and TRAF2) in glioblastoma23,4506–4512. Med. Sci. Monit. 23, 4506–4512. doi: 10.12659/msm.903397
Zhang, G., Wang, Q., Yang, M., Yuan, Q., Dang, Y., Sun, X., et al. (2019). OSblca: A web server for investigating prognostic biomarkers of bladder cancer patients. Front. Oncol. 9, 466. doi: 10.3389/fonc.2019.00466
Zhao, J., Tang, H., Zhao, H., Che, W., Zhang, L., Liang, P. (2015). SEMA6A is a prognostic biomarker in glioblastoma. Tumour Biol. 36, 8333–8340. doi: 10.1007/s13277-015-3584-y
Keywords: glioblastoma, survival analysis, prognostic biomarker, OSgbm, transcriptome profiles, clinical information
Citation: Dong H, Wang Q, Li N, Lv J, Ge L, Yang M, Zhang G, An Y, Wang F, Xie L, Li Y, Zhu W, Zhang H, Zhang M and Guo X (2020) OSgbm: An Online Consensus Survival Analysis Web Server for Glioblastoma. Front. Genet. 10:1378. doi: 10.3389/fgene.2019.01378
Received: 08 May 2019; Accepted: 17 December 2019;
Published: 21 February 2020.
Edited by:
Meng Zhou, Wenzhou Medical University, ChinaReviewed by:
Zhixiang Zuo, Sun Yat-sen University, ChinaXuexin Yu, UT Southwestern Medical Center, United States
Copyright © 2020 Dong, Wang, Li, Lv, Ge, Yang, Zhang, An, Wang, Xie, Li, Zhu, Zhang, Zhang and Guo. This is an open-access article distributed under the terms of the Creative Commons Attribution License (CC BY). The use, distribution or reproduction in other forums is permitted, provided the original author(s) and the copyright owner(s) are credited and that the original publication in this journal is cited, in accordance with accepted academic practice. No use, distribution or reproduction is permitted which does not comply with these terms.
*Correspondence: Xiangqian Guo, eHFndW9AaGVudS5lZHUuY24=
†These authors have contributed equally to this work