 Shu Chen1,2
 Tao Wang
- 1Department of Respiratory and Critical Care Medicine, Tongji Hospital, Tongji Medical College, Huazhong University of Science and Technology, Wuhan, China
- 2Department of Cardiovascular Surgery, Union Hospital, Tongji Medical College, Huazhong University of Science and Technology, Wuhan, China
Background: The proliferation of human pulmonary artery smooth muscle cells (HPASMCs) induced by hypoxia was considered as the main cause of pulmonary arterial hypertension (PAH). This study aimed to explore potential genes and long non-coding RNAs (lncRNAs) involved in the mechanism of hypoxia-induced PAH.
Methods: CoCl2 was utilized to induce hypoxia in HPASMCs, and then cell proliferation, apoptosis, and expression of hypoxia-inducible factors (HIF)-1α were determined. Meanwhile, the RNA isolated from CoCl2-treated cells and control cells were sequenced and differentially expressed genes/lncRNA (DEGs/DELs) were screened, followed by protein-protein interaction (PPI) construction, functional enrichment analyses, and lncRNA-target prediction. Finally, the expression of key genes and lncRNAs were validated using quantitative real-time PCR and western blotting.
Results: CoCl2 treatment could significantly increase the expression of HIF-1α and the proliferation of HPASMCs. A total of 360 DEGs and 57 DELs were identified between CoCl2 treated and control cells. Functional enrichment analysis showed that up-regulated DEGs and DELs’ targets, including LDHA, PFKP, and VEGFA, were significantly enriched in biological processes related to hypoxia or oxygen levels, and the downregulated DEGs and DELs’ targets were significantly enriched in extracellular-matrix-related biological processes. In addition, LDHA, PFKP, and VEGFA exhibited a strong relationship with miR-100HG and TSPEAR-AS2 in lncRNA-target network. The protein level of LDHA, PFKP, and VEGFA were all increased.
Conclusion: LDHA, PFKP, VEGFA, and lncRNA miR-100HG and TSPEAR-AS2 probably played crucial roles in the pathogenesis of CoCl2 hypoxia-induced-HAP, which might serve as promising therapeutic targets for PAH.
Introduction
Pulmonary hypertension (PH) is a common complicated disorder characterized by a rest mean pulmonary artery pressure of >25 mm Hg. The World Health Organization (WHO) categorized PH into 5 categories according to common clinical parameters, potential pathology, pathophysiology, etiology, and therapies. Specifically, pulmonary arterial hypertension (PAH) belongs to the WHO Group I characterized by an increased vasomotor tone, vascular resistance from abnormal narrowing, and precapillary vasculature remolding associated with abnormalities of proliferation and apoptosis (Simonneau et al., 2013; Ramchandran et al., 2014; Yun et al., 2016). Although available therapies for PAH are commonly designed to revise the elevated vascular tone and vascular remodeling, the outcomes of these therapies are still not satisfied in clinic (Michelakis et al., 2008). Therefore, a better understanding of the pathology of PAH is necessary to develop some useful therapies to manage this syndrome (Lau et al., 2015).
Hypoxia is one of the most important causes for vascular remodeling during the parthenogenesis of PAH (Montani et al., 2013; Xia et al., 2014). Chronic alveolar hypoxia is likely to promote pulmonary vasoconstriction and vessel remolding (Shimoda et al., 2000; Kuriyama et al., 2014). Hypoxia inducible factors (HIFs) are a class of transcriptional factors that respond to hypoxia (Veith et al., 2016). Among these, HIF-1α has been identified to play a critical role in the regulation of PAH (Yue et al., 2013). Roger A et al. have demonstrated that HIF-1α is crucial for the hypoxia-induced mitogenic factor induced PH (Johns et al., 2016). Li et al. (2015) have documented that KLF5 mediates hypoxia-induced vascular remodeling via HIF-1α. Meanwhile, inhibiting the expression of HIF-1α alleviates hypoxia-induced PH (Ying et al., 2016). Moreover, Pyk2 contributes to hypoxia-induced PH via activating HIF-1α (Kuniyoshi et al., 2015). Jiang et al. (2015) have also reported that SUMO-1 can interact with HIF-1α to regulate sumoylation of HIF-1α responding to hypoxia. Despite these findings, the mechanism of HIF-1α in PH is still not clearly understood.
Long non-coding RNAs (lncRNA) are a class of transcriptomes with non-protein coding ability and length ≥200 nt (Tian and Xu, 2015), and have been identified as playing critical roles in the regulation of cell activities, including metabolism, proliferation, apoptosis, metastasis, and invasion (Liu et al., 2016; Sun et al., 2016; Gasri-Plotnitsky et al., 2017; Peng et al., 2017). Recently, Brock et al. (2016) have reported that lncRNA MEGs serves as an emerging factor in hypoxia-induced PH. Zhuo et al. (2016) have observed that polymorphism re619586A >G in lncRNA MALAT1 contributes to PAH susceptibility in Chinese people. Zhang et al. (2016) have identified that lncRNA BCYRN1 promotes the proliferation and migration of rat airway smooth muscle cells in asthma via elevating the expression of TRPC1. All of these findings indicate that lncRNAs also play critical roles in the regulation of PAH, but evidence in this area is still rarely reported.
To further reveal the pathogenesis of PAH, the effect of HIF-1α on PAH was identified. Meanwhile, CoCl2 treated cells and their corresponding controls were sequenced and analyzed using a bioinformatics method in pulmonary artery smooth muscle cells to further explore the genes and lncRNAs involved in hypoxia-induced PAH pathogenesis, providing some new insights in the understanding and treatment of PAH.
Materials and Methods
Ethics Approval and Consent to Participate
This article does not contain any studies with human participants or animals performed by any of the authors.
Cell Culture and Treatment
In the current study, two cell lines, human pulmonary artery smooth muscle cells (HPASMCs), and human embryonic kidney cells 293T, were used for the following investigations. 293T cell lines were maintained in Dulbecco’s modified eagle medium (DMEM, Gibco, Grand Island, NY, United States) supplemented with 10% of fetal bovine serum (FBS) and Penicillin/Streptomycin at 37°C with 5% CO2. HPASMCs were maintained in DMEM supplemented with 15% of FBS at 37°C with 5% CO2 (Li et al., 2014).
CCK-8 Assay
The proliferation of cells treated with different concentrations of CoCl2 were determined using a CCK-8 kit (DOJINDO, Japan). Briefly, HPASMCs were seeded in 96-well plate with 2 × 10⁴ for each well overnight. After adherence, cells were separately treated with 50, 100, or 200 μM CoCl2 for 24 and 48 h. Then, 10 μl CCK-8 solution was added in each well and the cells were cultured at 37°C for 2 h. Following this, the optical density (OD) of each well at 450 nm was measured using an Enzyme-linked immunoassay instrument (TECAN Infinite M100 PRO, CA, United States). Each treatment was repeated six times, and the mean value of OD was calculated as the final result.
5-Bromo-Deoxyuridine (BrdU) Assay
The BrdU assay was performed according to the protocol of the BrdU Cell Proliferation Assay Kit (Frdbio, China). Briefly, BrdU labeling solution was added to each well for 4 h. After cells were fixed and DNA denatured, 100 μl BrdU detection antibody were added under a condition of mild vibrating at room temperature for 1 h. Then, the anti- BrdU HRP conjugated antibody was added to the cultures and incubated for 1 h at room temperature. After three washing steps the bound peroxidase was detected by subsequent substrate reaction. This reaction was stopped by adding 100 μl stop buffer and quantified by measuring the optical density (OD) at a wavelength of 450 nm on a microplate reader (BioTek, United States).
Apoptosis
Apoptosis for HPASMCs with CoCl2 treatment was also determined in the present study. Briefly, HPASMCs were seeded in six-well plate with 4 × 10⁵ for each well overnight followed by the treatment with 200 μM CoCl2 and DMSO for 48 h. After that, cells were trypsinized and centrifuged at 1500 rpm for 6 min. The cell sediment was washed with phosphate buffer solution and re-suspended with 1 × Binding Buffer. Then, 100 μl cell-binding buffer was collected, and incubated with 5 μl FITC-Annexin V (BD, United States) and 5 μl PI (50 μg/ml) at room temperature in a dark place. Meanwhile, unstaining, single Annexin-V staining, and single PI staining were also performed to minimize error during these procedures. After incubation, solution was mixed with 400 μl 1 × Binding Buffer and measured using a flow cytometry. Each experiment was performed three times, and the mean value was computed.
Sequencing and Bioinformatics Analysis
With a confluency of 70∼80%, HPASMCs were treated with 200 μM CoCl2 for 48 h, and DMSO were used as the control treatment. Each treatment was performed three times. Then, total RNA of cell samples was isolated and sequenced on the Hiseq4000 sequencing platform (Illumina). Based on the recorded data, lower quality of reads and beads were filtered out, and the clean reads were calculated. Following this, clean reads were mapped to human reference genome 19 using tophat (Trapnell et al., 2009). According to the known genes and lncRNA annotation provided by gencode v24 (Harrow et al., 2012), fpkm and read count of sequencing genes were obtained using stringtie (Pertea et al., 2015), and differentially expressed genes (DEGs) and differentially expressed lncRNAs (DELs) were screened using LIMMA in R (Ritchie et al., 2015) with the thresholds of |log2 Fold change (FC)| >1 and false discovery rate (FDR) <0.05. Based on the Spearman rank correlation coefficient, targets of lncRNAs were screened from DEGs with the thresholds of P < 0.05 and coefficient >0.8, and the lncRNA-target regulatory network was visualized using Cytoscape (Shannon et al., 2003). Furthermore, Gene ontology (GO) and Kyoto Encyclopedia of Genes and Genomes (KEGG) enrichment analyses of DEGs, as well as the targets of lncRNAs, were also carried out using clusterprofile package in R (Yu et al., 2012). Finally, protein-protein interactions (PPIs) among DEGs were predicted using STRING (Franceschini et al., 2012), and PPI network was visualized using Cytoscape.
Quantitative Real-Time PCR (RT-PCR)
Total RNA was isolated using Trizol Regent (Invitrogen, Carlsbad, CA, United States), according to the manufacture’s protocol. Then, RNA concentration was quantified using NanoDrop 2000 (Thermo, Wilmington, DE, United States), and 0.5 μg total RNA was reversed to cDNA using 5 × primeScript RT Master Mix (Takara, Dalian, China), according to its instructions. Subsequently, gene expression was measured using SYBR Premix EX Taq (2 ×) with the following procedure: 50°C for 3 min, 95°C for 3 min, and 40 cycles of 95°C for 10 s and 60°C for 30 s. The relevant target gene expression levels were calculated with the 2-ΔΔCT method (Livak and Schmittgen, 2001). Primers of genes were tabulated in Table 1.
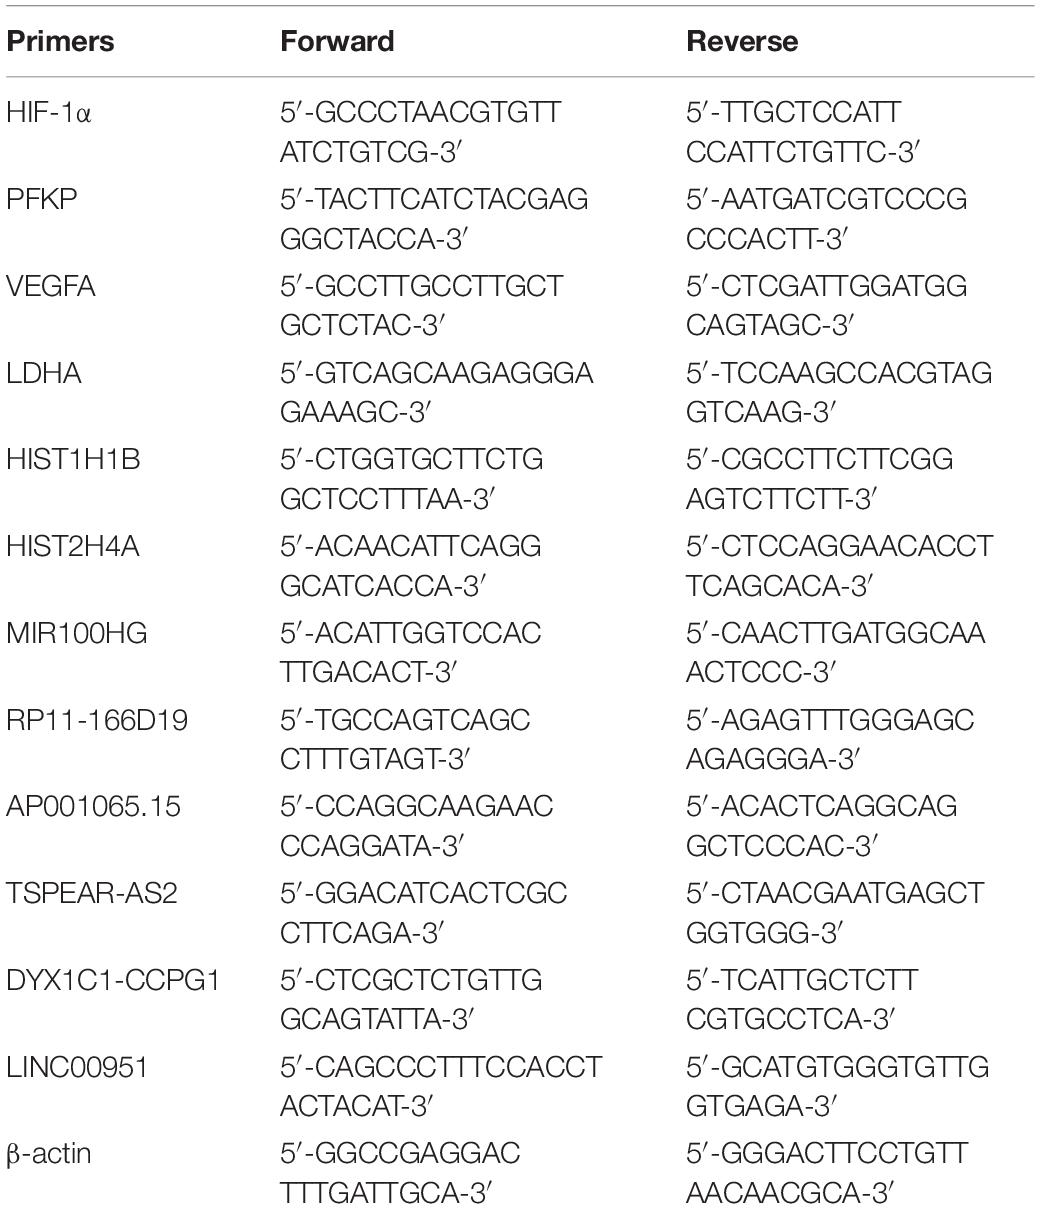
Table 1. Primers for real-time PCR.
Western Blotting
Cells were lysed in RIPA lysis buffer (Beyotime, China) coupled with PMSF (Beyotime) at a final concentration of 1 mM, followed by the determination of protein concentration using the BCA Protein Assay Kit (Thermo). Protein from each sample was separated by 10% SDS-polyacrylamide gel and transferred onto polyvinylidene difluoride (PVDF) membranes (Millipore). Five percent of skim milk (BD) was used to block the non-specific binding for 1–2 h at 37°C, and then incubated with anti-LDHA (1:5000, Abcam), anti-VEGFA (1:10000, Abcam), and anti-PFKP (1:2000, Abcam) primary antibody at 4°C overnight. The membrane was washed with PBST buffer and then incubated with Goat Anti-Rabbit IgG (H + L) (1:10000, Jackson) for 2 h at 37°C. After washing with PBST buffer for six times, the membrane was exposed to enhanced chemiluminescence (ECL) reagents (Share-bio) and the Millipore ECL system, and then gray scanning was performed using TanonImage (4600, Tanon).
Statistical Methods
In the current study, statistical analyses were performed using GraphPad prism (GraphPad software, San Diego, CA, United States). Continuous variables were presented with mean ± standard error of mean. Comparisons between groups were estimated using t-test, and P < 0.05 was considered statistically significant.
Results
CoCl2 Increased the Proliferation of HPASMC
After being treated with CoCl2, the expression of HIF-1α in HPASMCs was determined using RT-PCR, and the results showed that the expression levels of HIF-1α were significantly increased in HPASMCs with a dose-dependent manner at 24 and 48 h (Figure 1A). Then, 200 μM CoCl2 treatment for 48 h was utilized for the following investigation. Subsequently, the proliferation and apoptosis of HPASMCs were measured. The results showed that the proliferation of HPASMCs was significantly increased after treatment with 200 μM CoCl2 both determined by CCK-8 assay (Figure 1B) and by BrdU assay (Figure 1C), but no significant variation was identified in apoptosis after being treated with CoCl2, compared with the control group (Figure 1D).
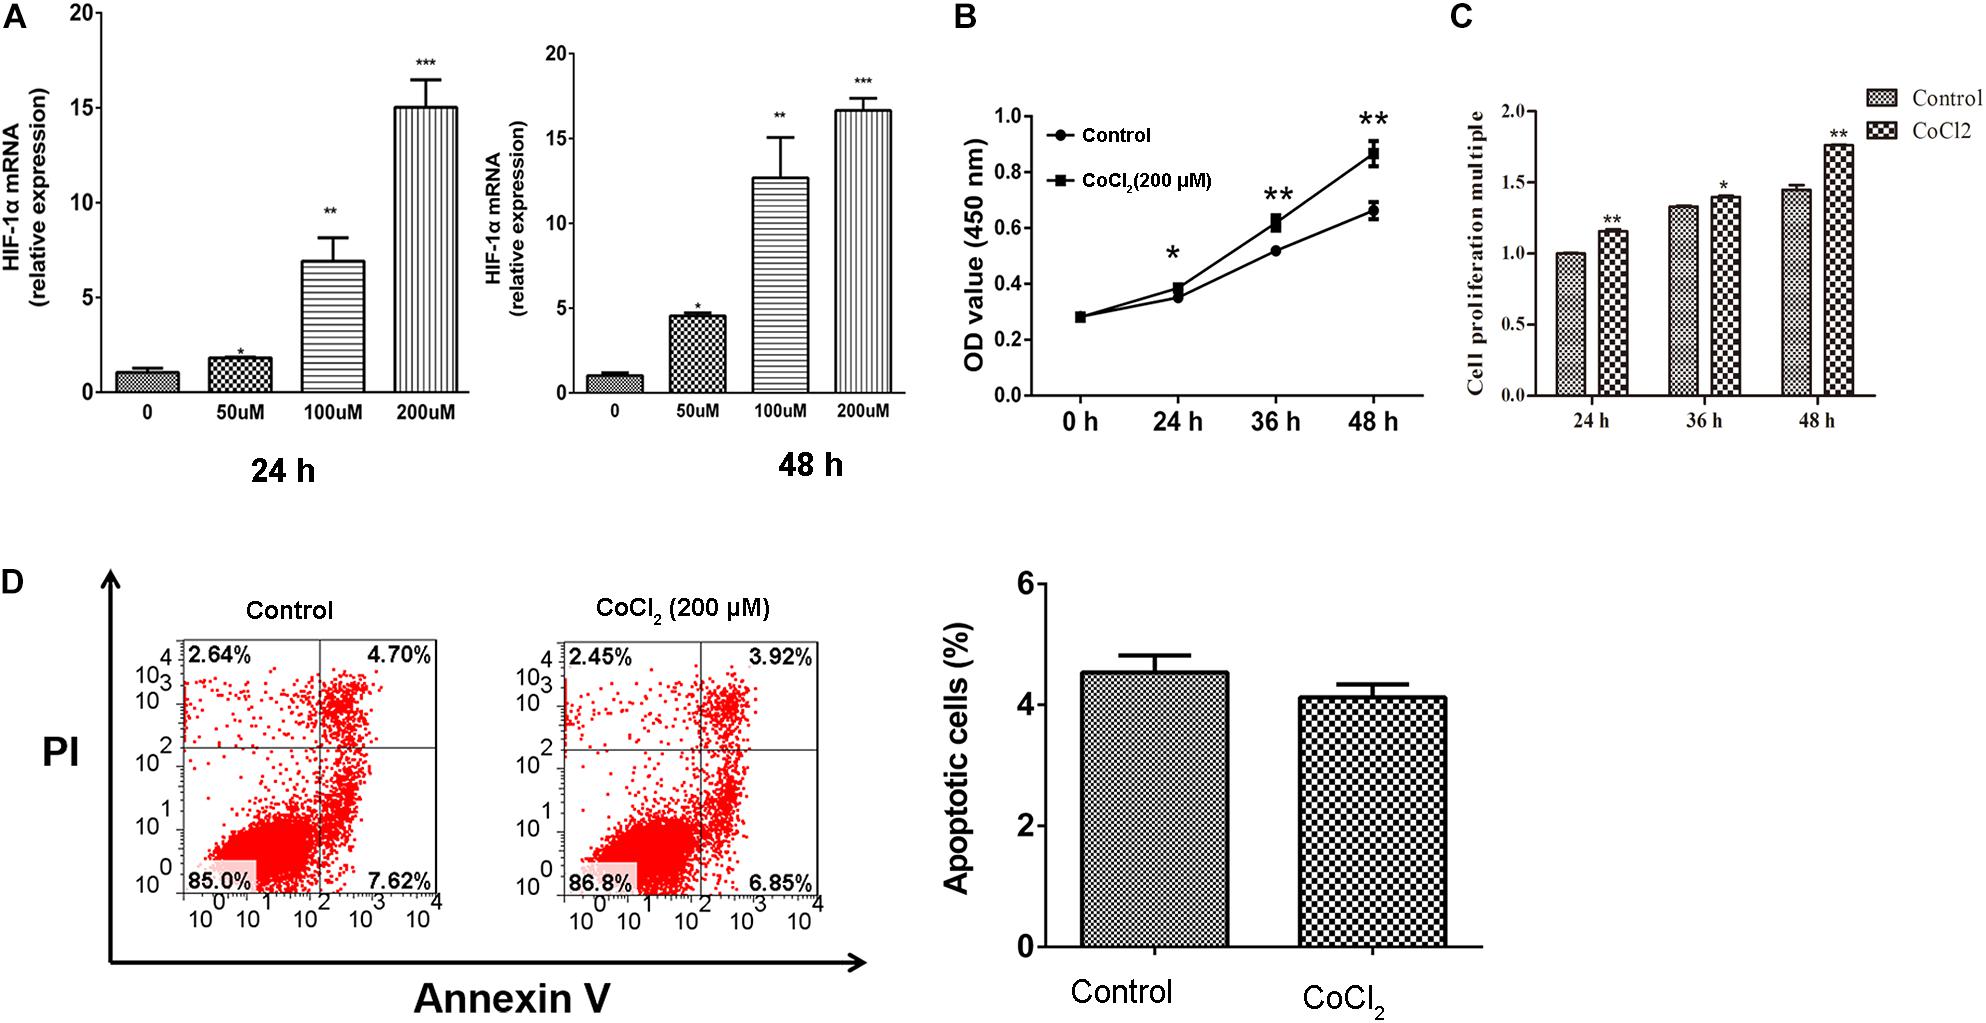
Figure 1. Effect of CoCl2 on HPASMCs. (A), expression of HIF-1α in HPASMCs after being treated with CoCl2 at 24 h and 48 h; (B), proliferation of HPASMCs after treatment with CoCl2 determined by CCK-8 assay; (C), proliferation of HPASMCs after being treated with CoCl2 determined by CCK-8 assay BrdU assay, and (D), apoptosis of HPASMCs after being treated with CoCl2. *P < 0.05 indicates that there is significantly different when compared with control groups. **P < 0.01 and ***P < 0.001.
DEGs/lncRNA Screening and Functional Enrichment Analyses
In total, 360 DEGs (178 up-regulated genes and 182 down-regulated genes) and 57 DELs (21 up-regulated lncRNAs and 36 down-regulated lncRNAs) were identified in CoCl2-treated HPASMCs compared with the controls. Heatmaps of DEGs and DELs are presented in Figures 2A,B. Moreover, GO enrichment analysis showed that the up-regulated DEGs were significantly enriched in the biological process (BP) terms of cellular response to hypoxia (P = 3.78 × 10–09), monosaccharide metabolic process (P = 4.61 × 10–09), cellular response to oxygen levels (P = 4.61 × 10–09), glycolytic process (P = 6.50 × 10–09), and pyruvate metabolic process (P = 8.32 × 10–09); and the down-regulated DEGs were closely associated with the BP terms of extracellular matrix organization (P = 2.42 × 10–06), collagen catabolic process (P = 3.30 × 10–05), multicellular organismal catabolic process (P = 3.79 × 10–05), extracellular matrix disassembly (P = 3.79 × 10–05), and single-substrate adhesion (P = 1.45 × 10–04) (Table 2). Meanwhile, KEGG enrichment analysis indicated that the up-regulated DEGs were primarily enriched in the pathways of Glycolysis/Gluconeogenesis (P = 6.98 × 10–07), Fructose and mannose metabolism (P = 2.16 × 10–07), and metabolic pathways (P = 2.28 × 10–03); the down-regulated DEGs played essential roles in the pathways of systemic lupus erythematosus (P = 1.06 × 10⁻¹⁵), ECM-receptor interaction (P = 3.82 × 10–06), Amoebiasis (P = 1.13 × 10–05), and focal adhesion (P = 4.91 × 10–04) (Table 2).
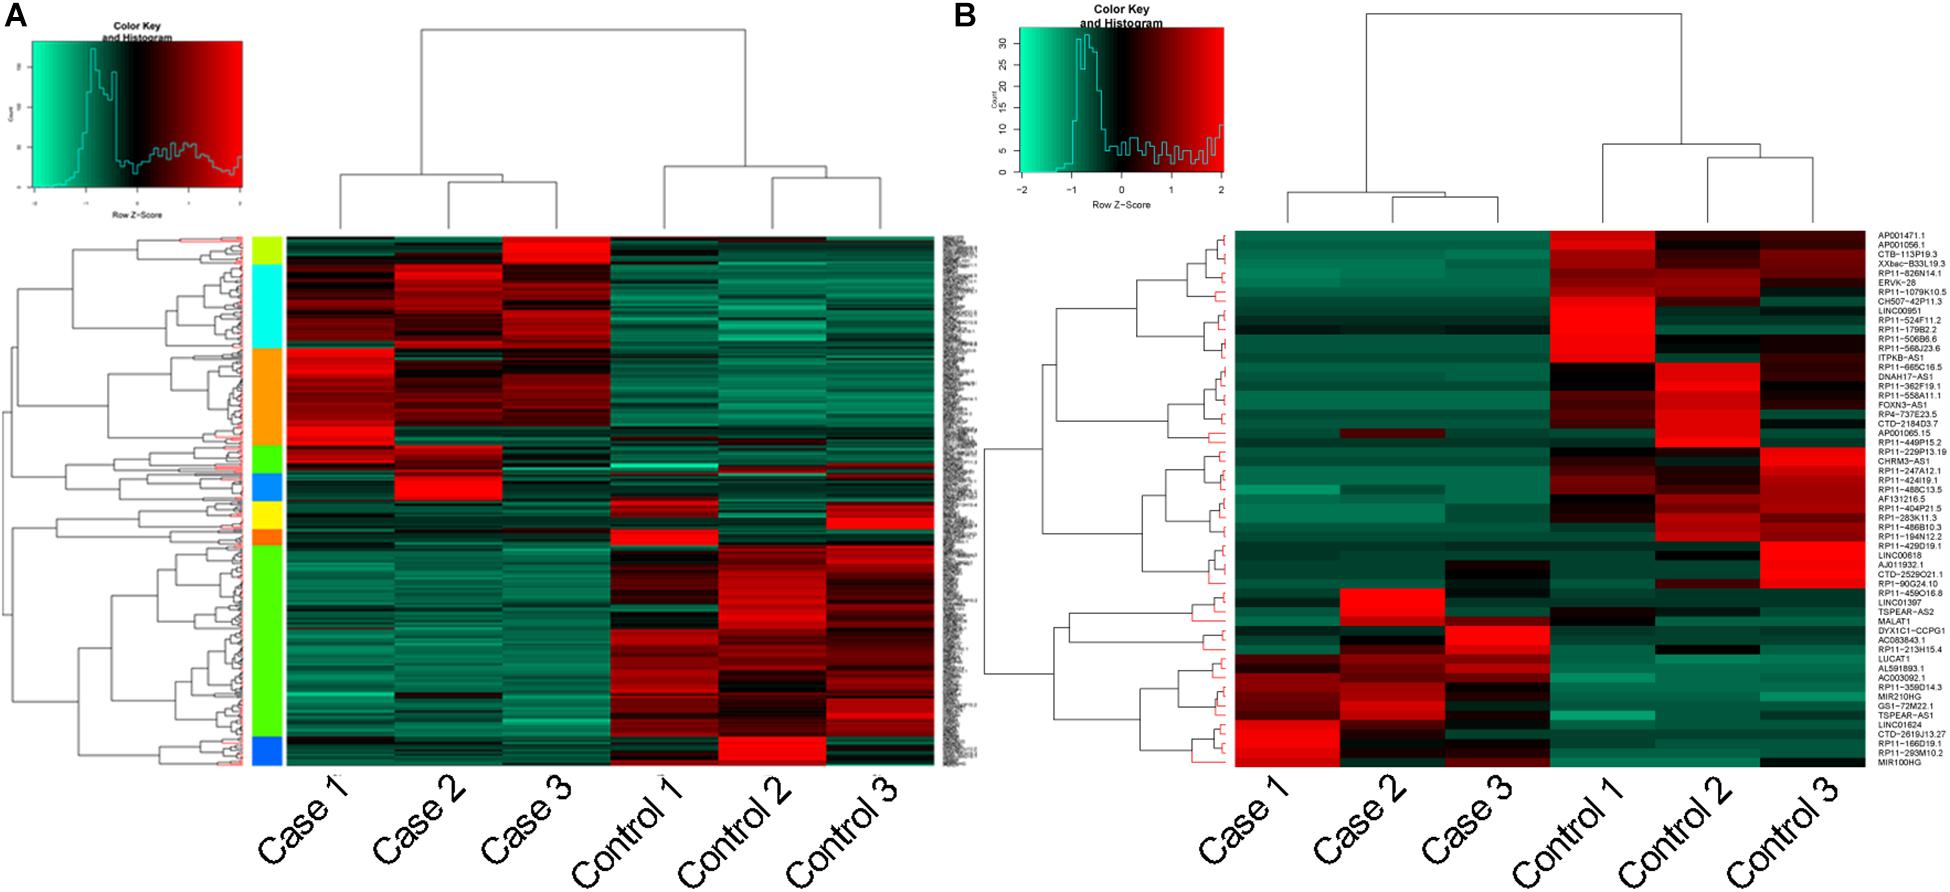
Figure 2. Heatmaps for DEGs and DELs. (A), heatmap for DEGs; and (B), heatmap for DELs. DEGs, differentially expressed genes; and DELs, differentially expressed long non-coding RNAs.
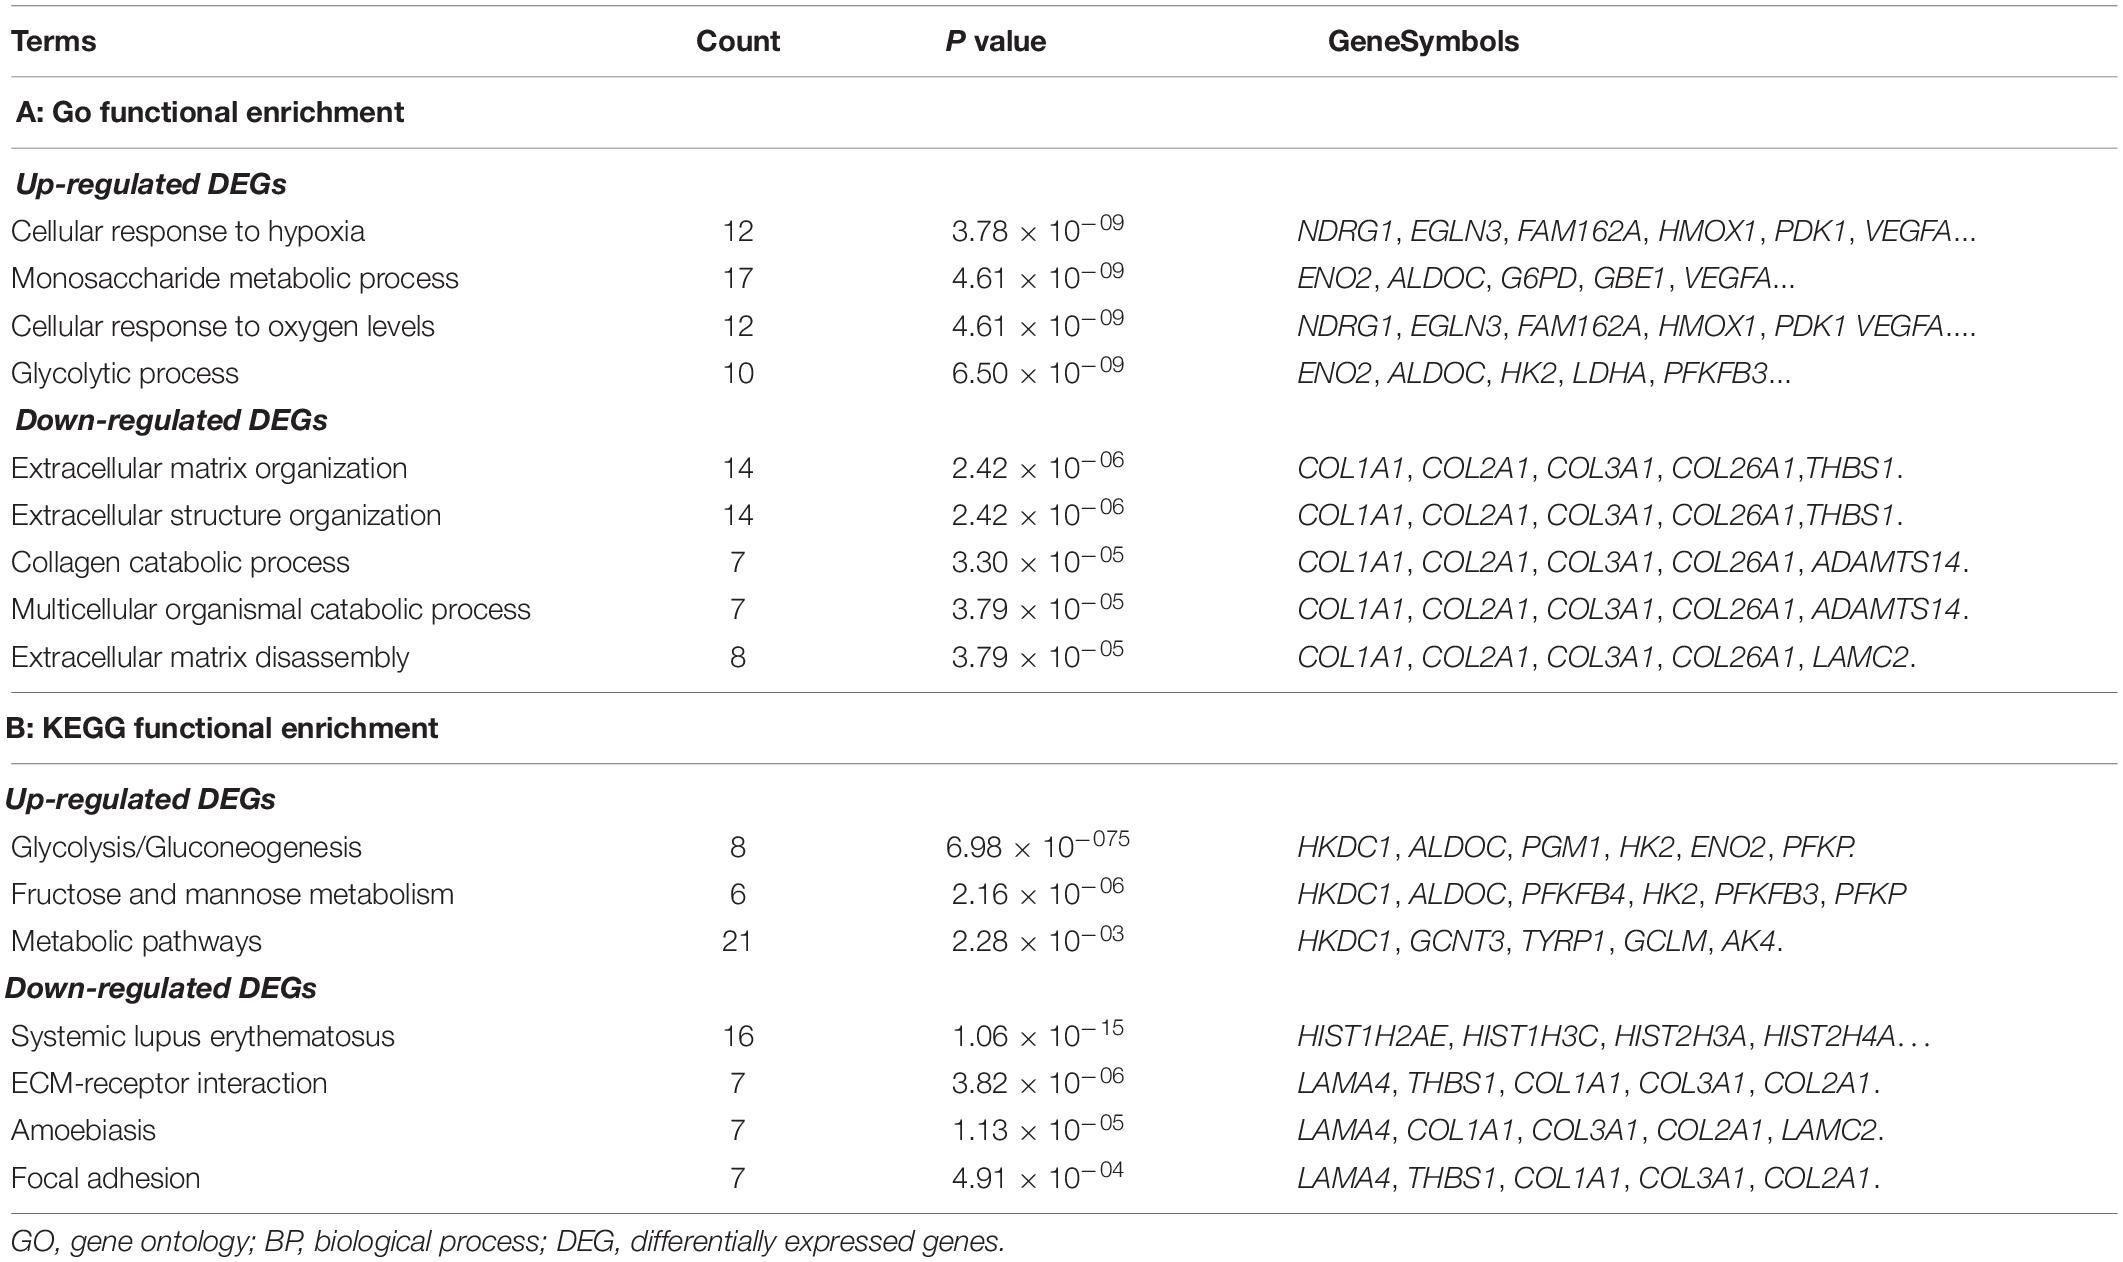
Table 2. Top 5 GO-BP terms enriched by the up- and down-regulated DEGs.
Constructions of PPI Network and lncRNA-Target Network
Based on the selection criteria, PPI among DEGs encoded proteins were predicted and visualized using Cytoscape (Figure 3). The top 10 nodes involved in this network were: VEGFA (degree = 21), LDHA (degree = 20), HIST1H1B (degree = 17), HIST2H4B (degree = 16), HIST2H4A (degree = 16), HK2 (degree = 15), HIST1H2AI (degree = 15), HIST1H2AE (degree = 15), PFKP (degree = 14), and HIST3H2BB (degree = 14).
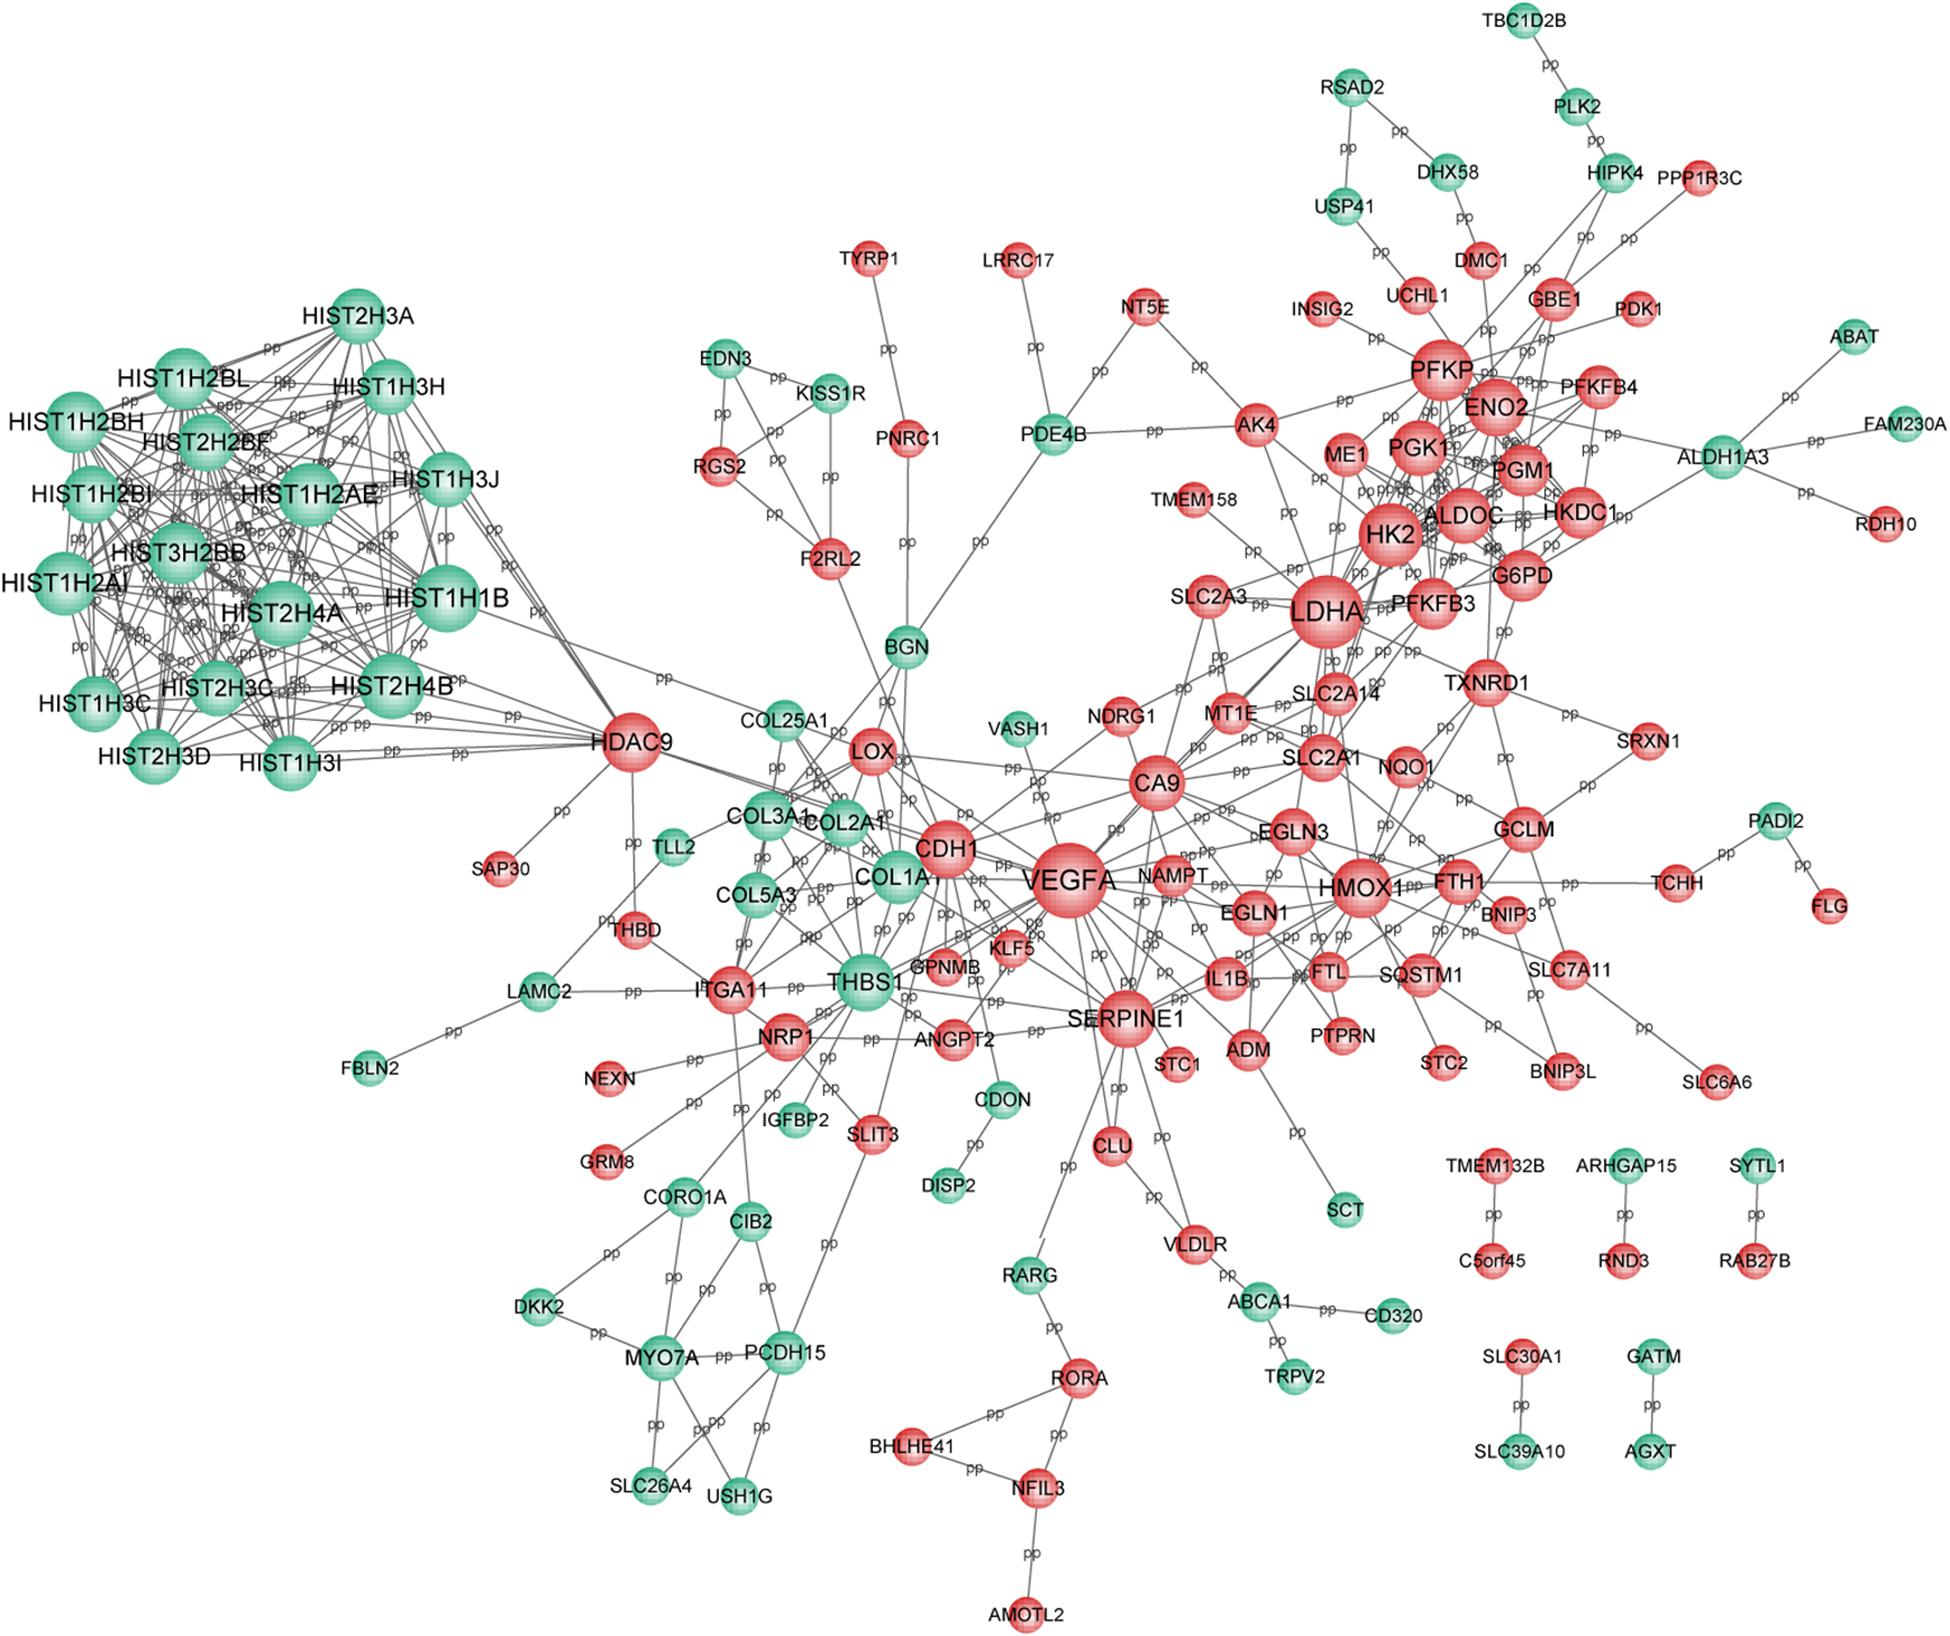
Figure 3. PPI network for DEGs. Red circle represents the up-regulated DEGs and green circle represents the down-regulated DEGs. Nodes size was positively correlated with node degree. PPI, protein-protein interaction network; and DEGs, differentially expressed genes.
Meanwhile, 286 targets by 57 lncRNAs were also selected from DEGs, and the lncRNA-target network was constructed with 343 nodes (proteins) and 2855 edges (PPI pairs) (Figure 4). The top 10 nodes with highest degrees were: RP11-486B10.3 (degree = 127), RP11-449P15.2 (degree = 97), RP11-229P13.19 (degree = 93), AF131216.5 (degree = 93), LINC00618 (degree = 93), RP11-429D19.1 (degree = 93), CHRM3-AS1 (degree = 93), CH507-42P11.3 (degree = 88), AP001056.1 (degree = 88), and RP11-488C13.5 (degree = 85). Notably, LDHA, PFKP, and VEGFA as hub genes in PPI network presented a close correlation with miR-100HG and TSPEA-AS2 in lncRNA-target network (Table 3).
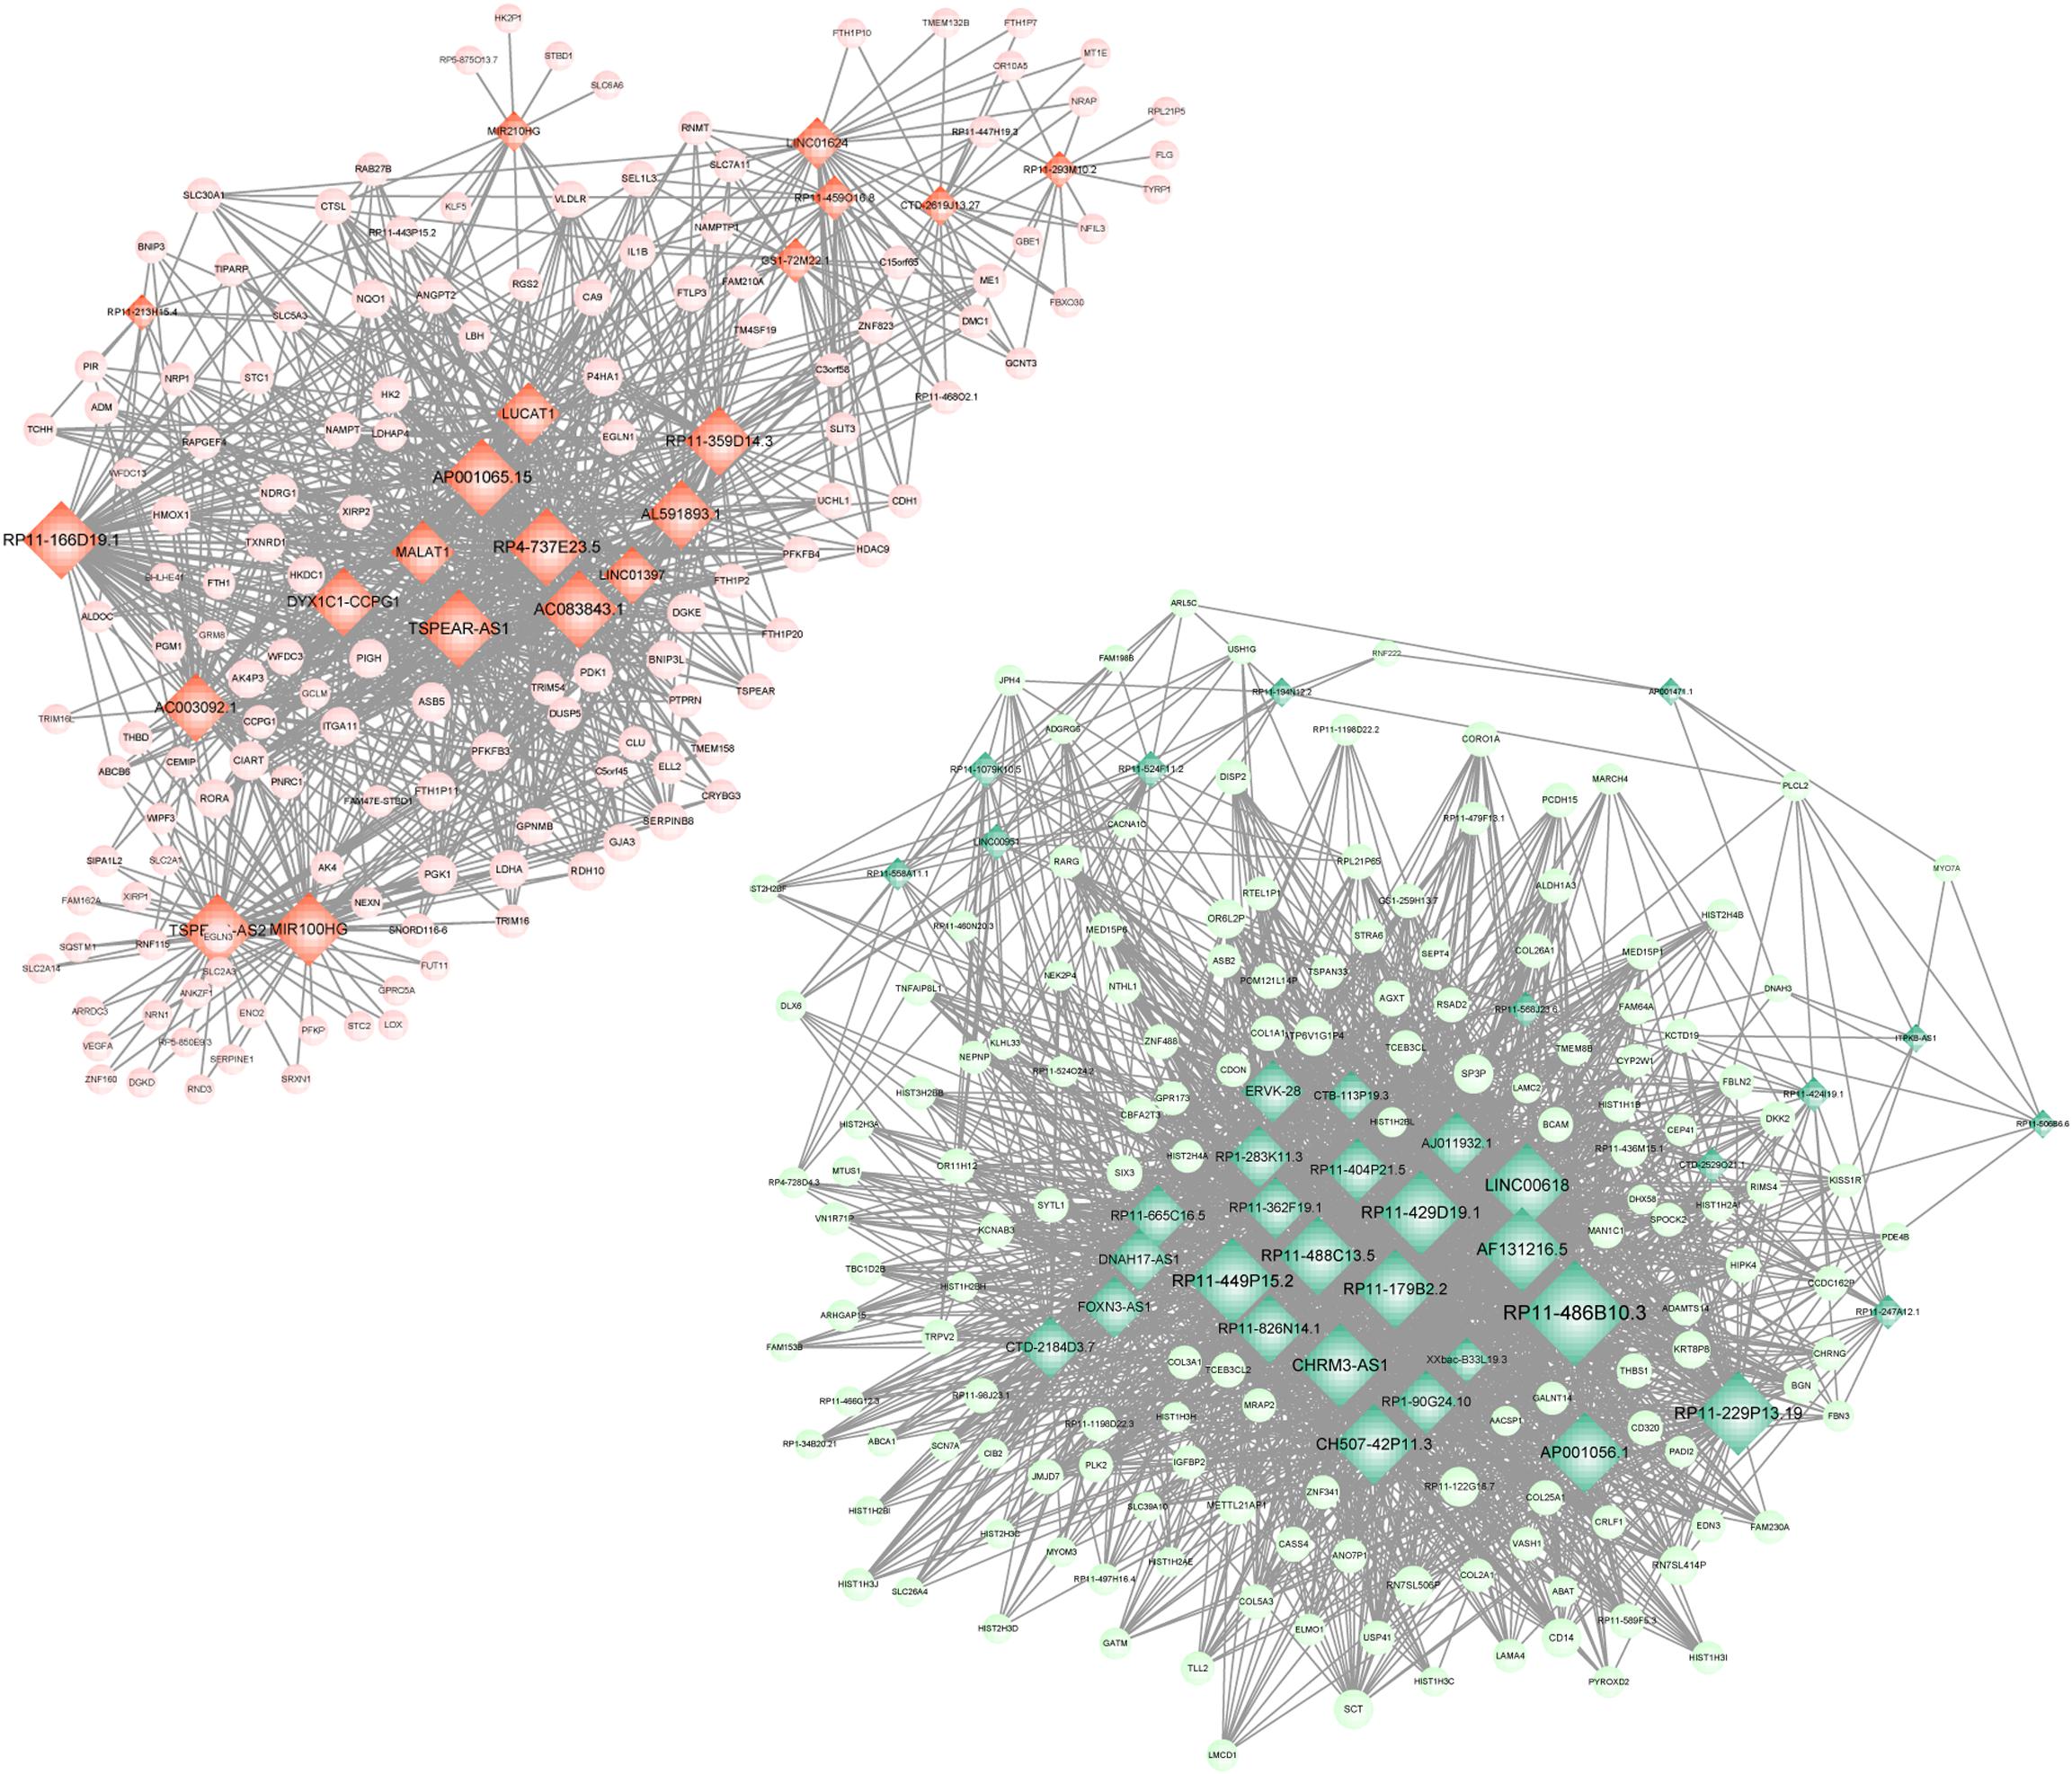
Figure 4. lncRNA-target network. Red circle represents the up-regulated DEGs, green circle represents the down-regulated DEGs, and diamond represents lncRNA. lncRNA, long non-coding RNA; and DEGs, differentially expressed genes.
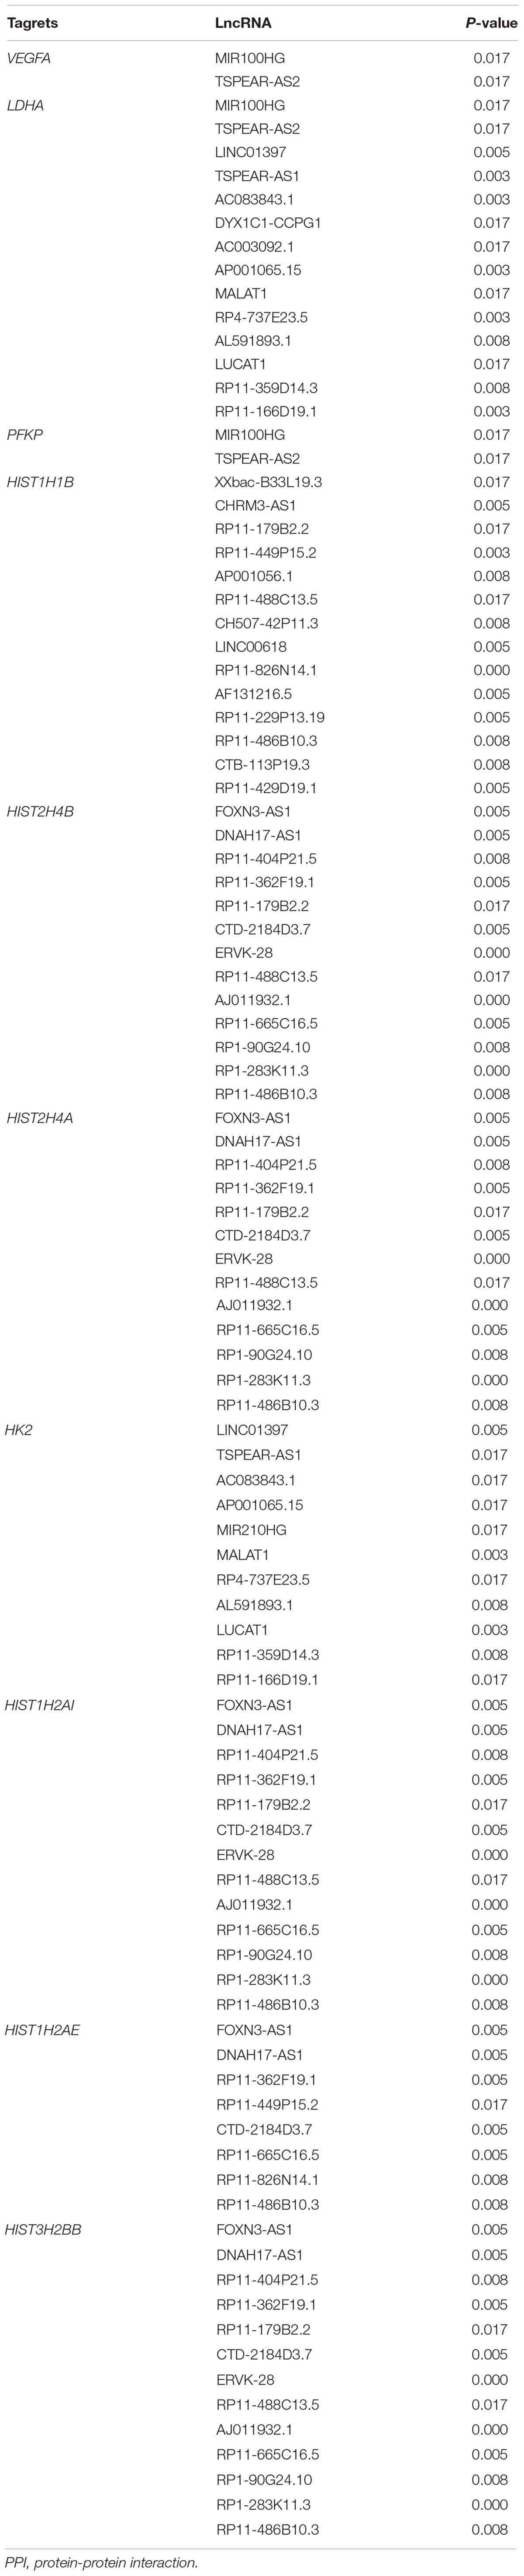
Table 3. The interaction pairs of top 10 hub genes in PPI network and lncRNAs.
Enrichment Analyses for Targets of lncRNA Isolated From DEGs
To further reveal the regulatory role of lncRNA, functional enrichment analyses for the targets of lncRNAs were also performed. The up-regulated targets were significantly enriched in the GO-BP terms of cell response to hypoxia (P = 9.60 × 10⁻¹⁰), cellular response to decreased oxygen levels (P = 9.60 × 10⁻¹⁰), cellular response to oxygen levels (P = 1.57 × 10–09), glycolytic process (P = 2.56 × 10–09), and pyruvate metabolic process (P = 2.84 × 10–09); the down-regulated targets were predominately associated with the GO-BP terms of extracellular matrix organization (P = 2.79 × 10–06), extracellular structure organization (2.79 × 10–06), collagen catabolic process (P = 3.56 × 10–05), multicellular organismal catabolic process (P = 4.13 × 10–05), and extracellular matrix disassembly (P = 4.13 × 10–05) (Table 4). The KEGG enrichment results showed that the up-regulated DEGs were significantly enriched in the pathways of glycolysis/gluconeogenesis (P = 1.85 × 10–07), fructose and mannose metabolism (P = 7.44 × 10–07), and metabolic pathways (P = 0.0019); the down-regulated targets were significantly enriched in the pathways of systemic lupus erythematosus (P = 1.06 × 10⁻¹⁵), ECM-receptor interaction (P = 3.82 × 10–06), amoebiasis (P = 1.13 × 10–05), and focal adhesion (P = 4.91 × 10–04) (Table 4).
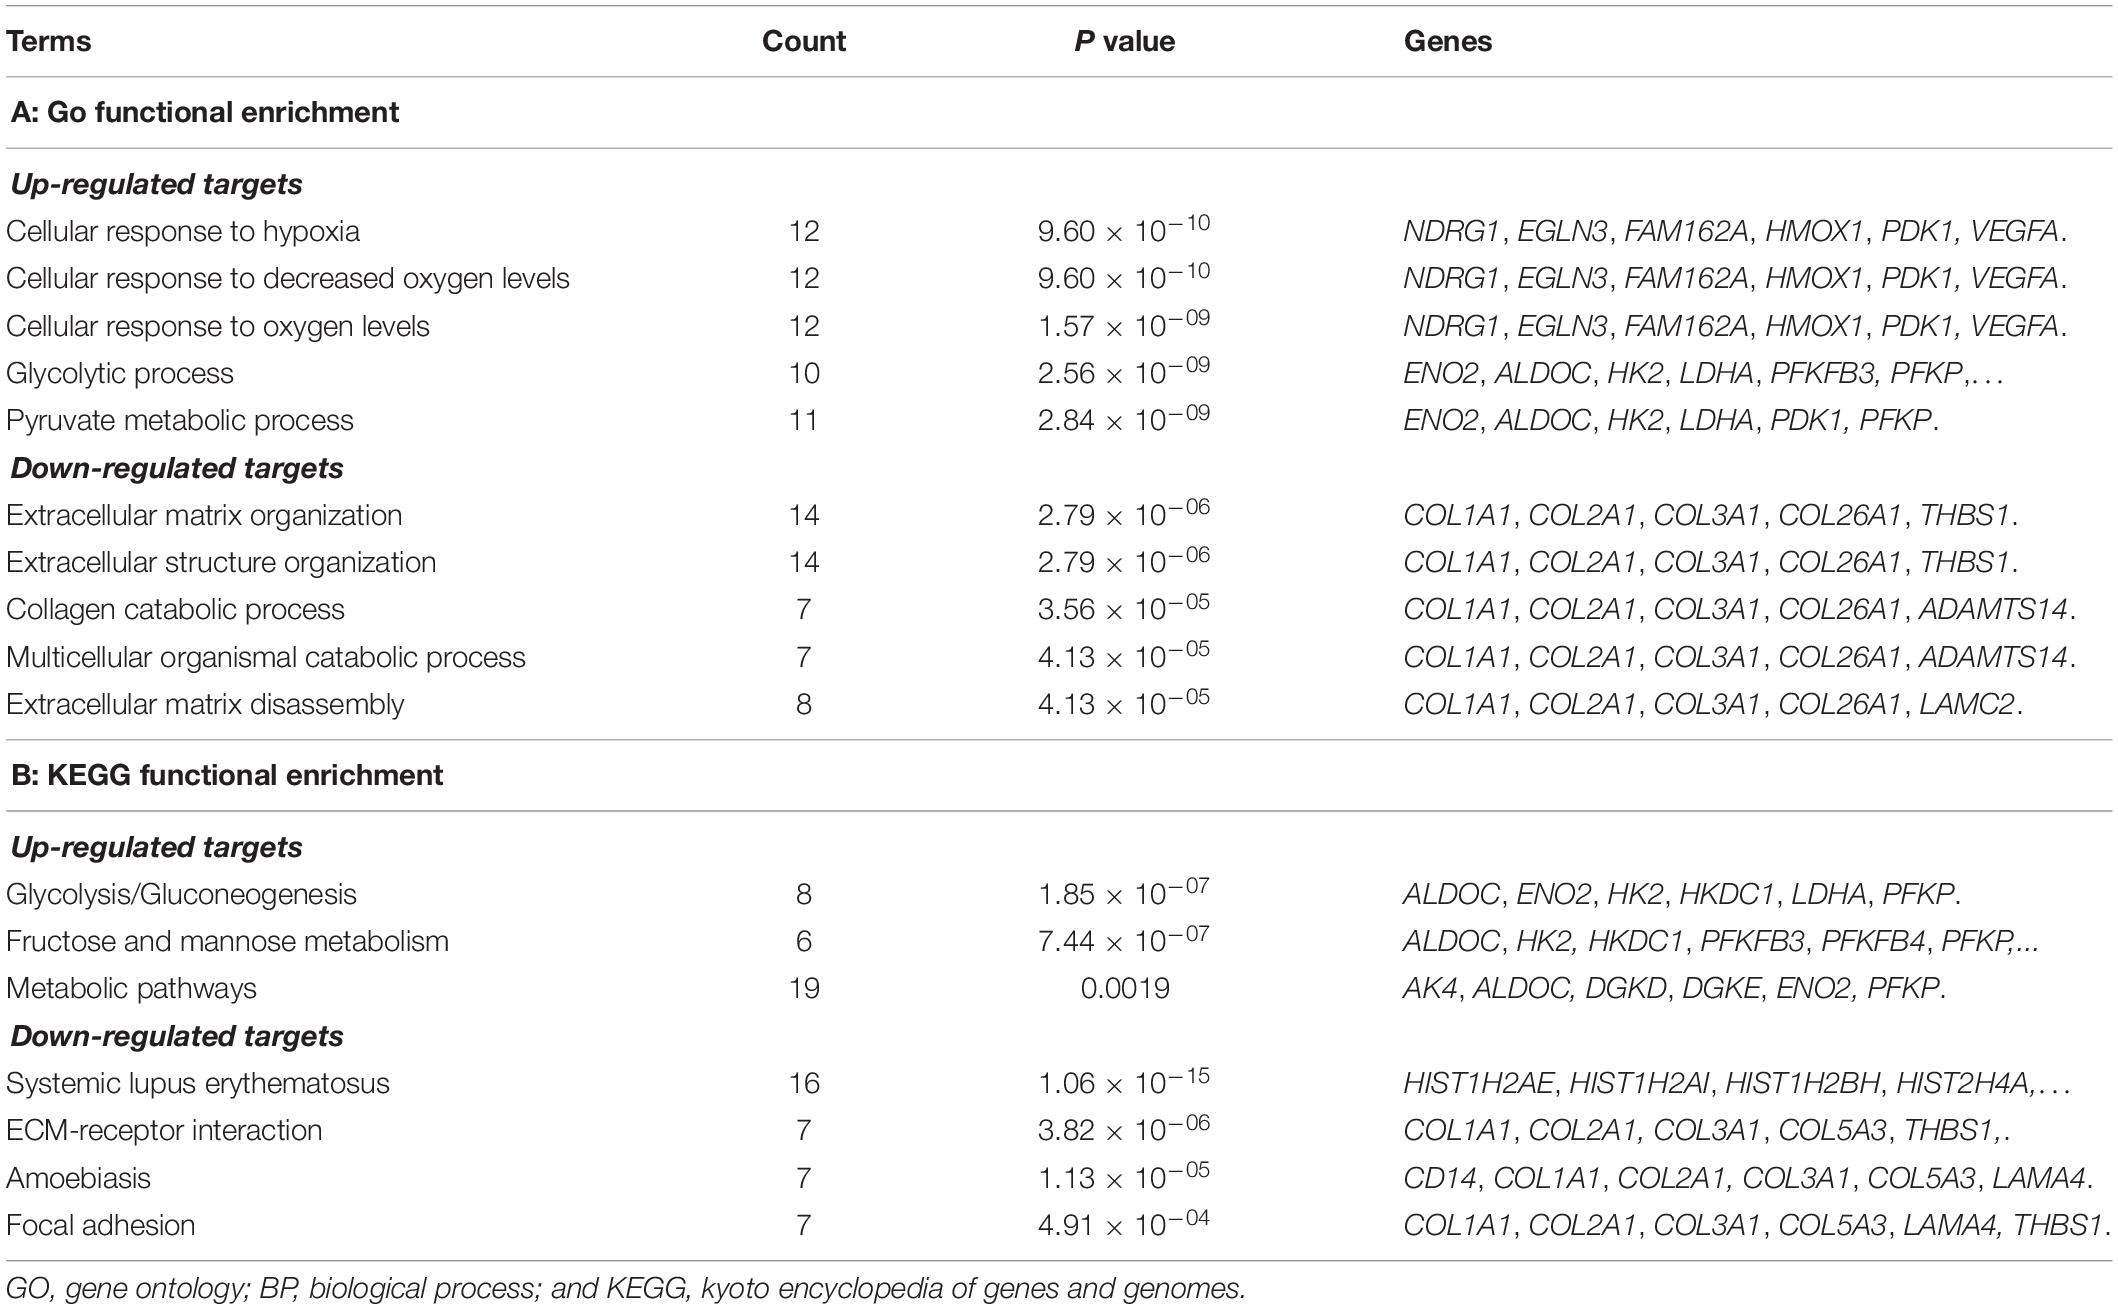
Table 4. Functional enrichment analytical results for targets of lncRNAs.
The mRNA Expression of DEGs/DELs
According to the bio-informatics results, expression changes of several DEGs and DELs were validated using RT-PCR in HPASMCs. The validated results showed that expression levels of PFKP, miR-100HG, RP11-166d19, VEGFA, LDHA, and AP001065.15 were significantly up-regulated, while expression levels of RP11-568J2, HIST1H1B, HIST2H4A, TSPEAR-AS2, DYX1C1-CCPG1, and LINC00951 were significantly decreased in CoCl2-treated HPASMCs compared with the control groups, which were consistent with the findings based on the bioinformatics analyses (Figure 5).
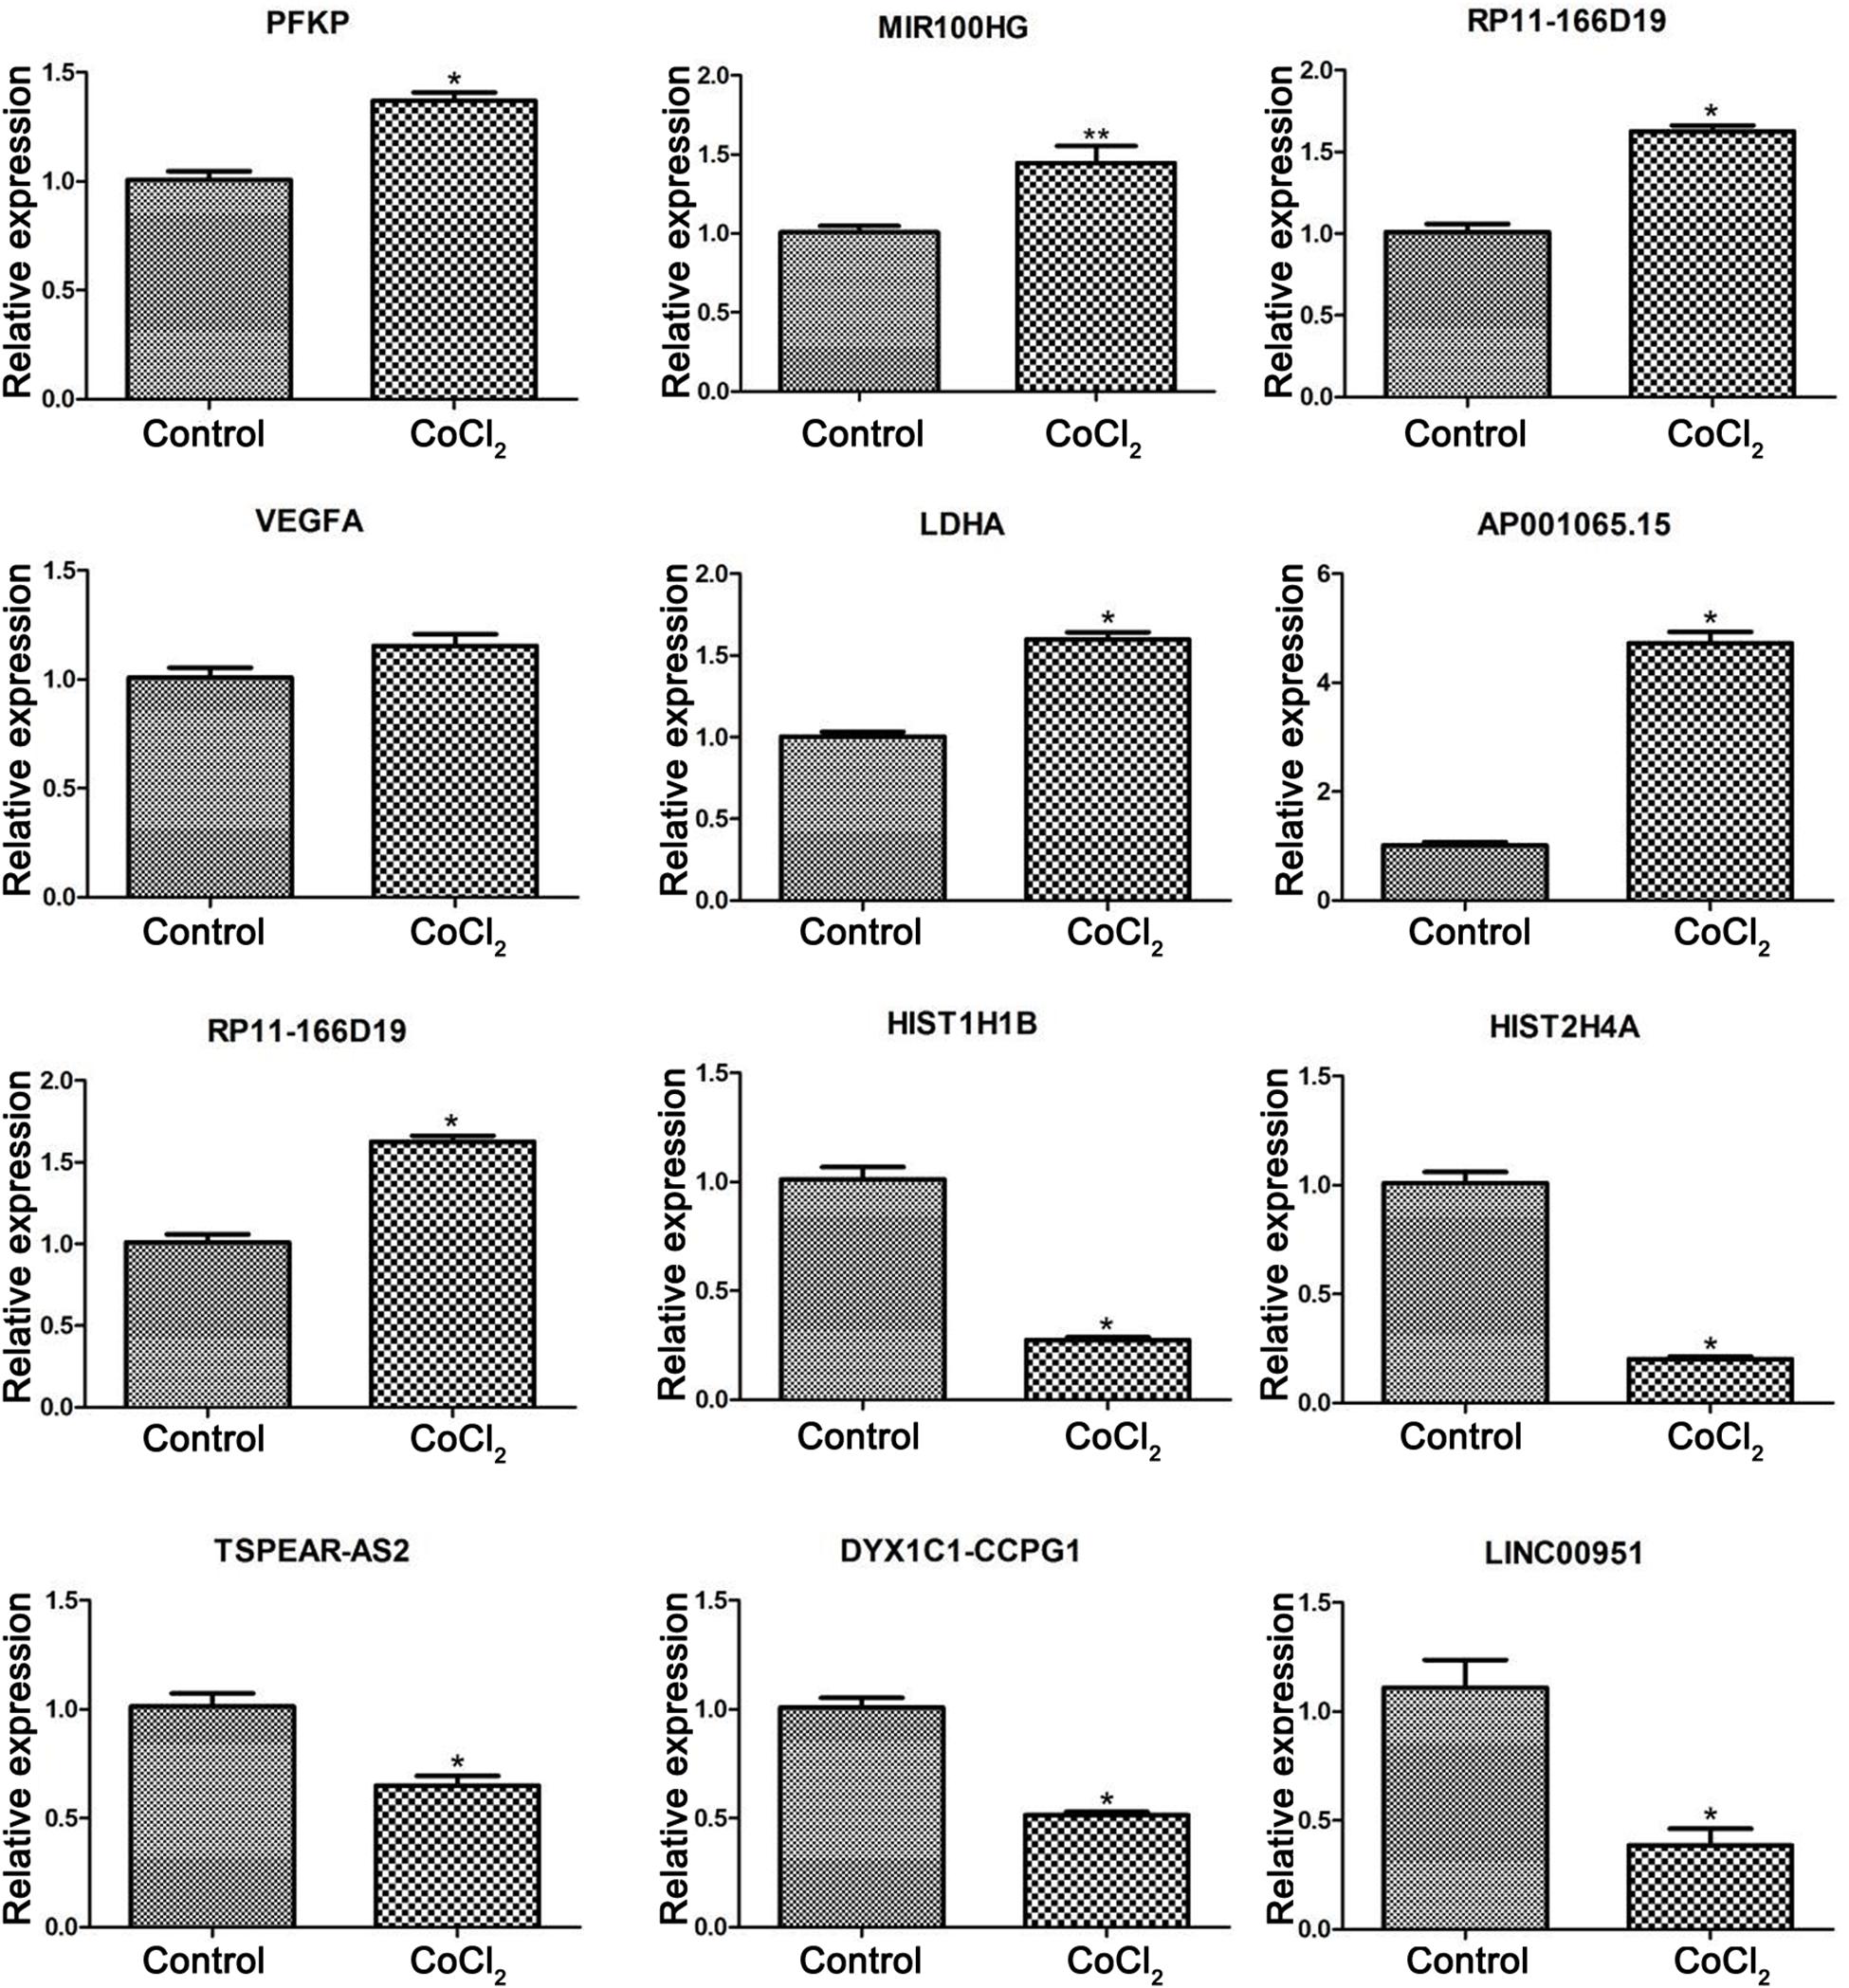
Figure 5. Validation of differentially expressed genes using real-time PCR. Compared with the control group, *P < 0.05, **P < 0.01.
The Protein Expression of PFKP, VEGFA, LDHA
The expression changes of PFKP, VEGFA, and LDHA at protein level were also determined by western blotting in HPASMCs (Figure 6). The results showed that the protein expression of PFKP, VEGFA, and LDHA were significantly increased in HPASMCs after COCl2 treatment. The results were consistent with the bioinformatics analyses.
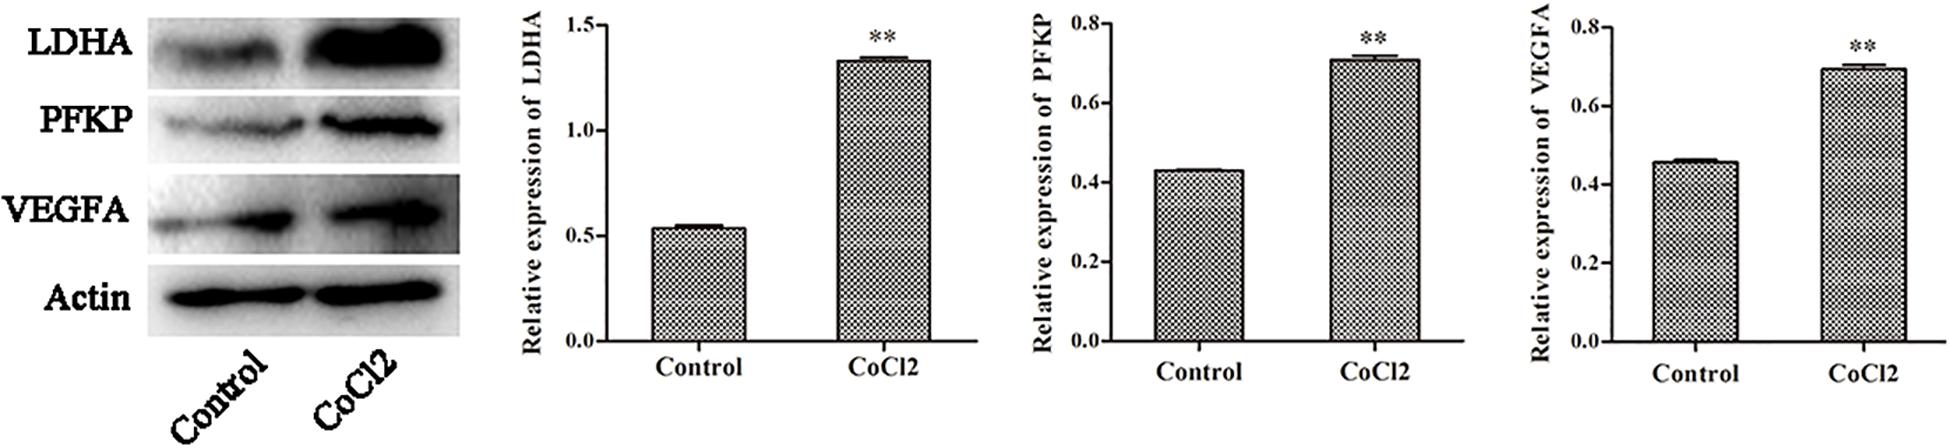
Figure 6. The protein expression of PFKP, VEGFA, and LDHA determined by western blotting. Compared with the control group, ∗∗P < 0.01.
Discussion
Pulmonary arterial hypertension is considered a sub-population of PH, characterized by sustained pulmonary vascular resistance elevation that results in right heart failure and death (Pulido et al., 2013; Ball et al., 2014). Overwhelming evidence has demonstrated that chronic hypoxia serves as a potential trigger for pulmonary vascular remodeling, and HIF-1α is reported to play a critical role during this process (Ball et al., 2014). Although numerous achievements have been acquired in exploring the underlying pathogenesis of PAH, the corresponding molecular mechanisms have not been deciphered. In this study, CoCl2 could significantly increase the expression of HIF-1α and proliferation of HPASMCs and decrease the apoptosis of HPASMCs even though there was no statistical difference. Moreover, 360 DEGs (178 up-regulated and 185 down-regulated genes) and 57 DELs (21 up-regulated and 36 lncRNAs) were screened in HPASMCs treated with CoCl2 compared with the control group. Interestingly, we found that LDHA, PFKP, and VEGFA, which were regarded as hub genes in PPI network, exhibited a strong relationship with miR-100HG and TSPEAR-AS2 in lncRNA-target network. Additionally, the functional enrichment analysis of these three genes revealed that they probably played pivotal roles in the cellular response to hypoxia and the regulation of glycolysis.
LDHA, lactate dehydrogenase A (Cui et al., 2017) has been reported to be a crucial regulator in glycolytic metabolism. Two earlier studies illuminated that an energy shift from mitochondrial oxidative phosphorylation to glycolytic metabolism was strongly associated with the progression of PH, which basically induced cell hyper-proliferation and inhibited apoptosis (Koppenol et al., 2011; Cottrill and Chan, 2013). Consistently, our results implied that there was a significant increase for the proliferation of HPASMCs after 200 μM CoCl2 treatment but not in apoptosis. Later, Paulin and Michelakis (2014) elaborated the metabolic mechanisms of PAH and also emphasized that glycolysis was primarily responsible for the PAH occurrence and development. Zhang et al. (2018) argued that LDHA could dramatically enhance the activity of glycolysis in proliferating cells while LDHA knockdown retarded the glucose metabolism. In this work, we found that LDHA was significantly up-regulated in CoCl2-treated cells and remarkably enriched in glycolytic process, pyruvate metabolic process, and carbohydrate catabolic process. More notably, Zhang et al. (2014) investigated the expression of LDHA in monocrotaline-induced PHA rats and pointed out that LDHA was up-regulated, which was similar to our finding. Therefore, we speculated that LDHA might be involved in the PHA progression, presumably via mediating cell energy metabolism.
A huge amount of research has found that the vascular endothelial growth factor A (VEGFA) was closely correlated with the development of PH (Partovian et al., 2000; Papaioannou et al., 2009; Giannakoulas et al., 2014). Tiede et al. (2015) previously found that there was a higher level of VEGFA plasma compared with the controls based on the enzyme immunoassays, and stated that VEGFA could be regarded as a promising diagnostic maker for PH. Recently, Liu et al. (2018) revealed that the expression levels of HIF-1α and VEGFA were significantly elevated in human pulmonary arterial endothelia cells (HPAECs) with hypoxia and the activation of HIF-1α/VEGFA axis acted as a potential driver for vascular remodeling contributing to PH, which was consistent with our results that HIF-1α and VEGFA levels were dramatically increased in hypoxia-induced HPASMCs. Additionally, our functional enrichment analysis indicated that VEGFA played essential roles in cellular response to oxygen levels. Taken together, our results provided support for the hypothesis that the initiation of HIF-1α/VEGFA axis was implicated with HAP under hypoxia exposure.
Phosphofructokinase (PFKP) gene was involved with various cell activities and glucose metabolism by targeting to multiple cell receptors and was reported to be another prominent regulator in the progression of HP (Ameshima et al., 2003). Here, we found that this gene was up-regulated in HPASMCs and mainly participated in energy metabolism pathways such as fructose and mannose metabolism. Calvier et al. (2017) suggested that the expression of PFKP was increased in human PAH cells, which was in accordance with our finding. And they underscored that peroxisome proliferator-activated receptor gamma (PPARγ) could bind to PFKP to regulate the proliferation and metabolism of PH cells. Interestingly, LDHA, PFKP, and VEGFA all had a close correlation with miR-100HG and TSPEAR-AS2 in our analysis. Unfortunately, few relevant investigations have been undertaken to explore the effect of the interaction between these genes and corresponding mRNAs on PAH occurrence and development. Therefore, the precise underlying mechanisms still need to be further elucidated.
In the current work, although we have identified several crucial gene signatures in PAH progression on the basis of bioinformatics methods, there are still limitations in our investigation. Firstly, the purity of HPASMCs should be determined before CoCl2 treatment to obtain more comprehensive results. Secondly, related animal experiments are required to confirm our findings even though we have verified significant genes by qPCR. Meanwhile, the exhaustive examinations containing a larger sample size was also needed, and the HPASMC RNA-seq data under different treatment should be further investigated. In addition, the detailed regulatory mechanisms associated with our confirmed genes remains to be deciphered.
Conclusion
In conclusion, CoCl2-induced hypoxia could significantly increase HIF-1α level and the proliferation of HPASMCs but decrease the apoptosis. Meanwhile, the expression levels of VEGFA, LDHA, and PFKP were dramatically enhanced in hypoxia-induced HPASMCs, preferentially associated with glycolytic process and exhibited a close correlation with miR-100HG and TSPEAR-AS2, which were considered as pivotal players in PAH development. However, animal experimental verification and a comprehensive bioinformatics analysis will need to be performed in future.
Data Availability Statement
The raw data was available at NCBI Sequence Read Archive (SRA) repository with Accession Number SRP081057.
Author Contributions
TW: conception and design of the research, obtaining funding, and revision of manuscript for important intellectual content. HX: acquisition of data and analysis and interpretation of data. FH: statistical analysis. SC: drafting the manuscript. All authors read and approved the final manuscript.
Funding
This work was supported by the National Natural Science Foundation of China (Program Nos. 81570325, 81470252, and 81170049).
Conflict of Interest
The authors declare that the research was conducted in the absence of any commercial or financial relationships that could be construed as a potential conflict of interest.
References
Ameshima, S., Golpon, H., Cool, C. D., Chan, D., Vandivier, R. W., Gardai, S. J., et al. (2003). Peroxisome proliferator-activated receptor gamma (PPARgamma) expression is decreased in pulmonary hypertension and affects endothelial cell growth. Circ. Res. 92, 1162–1169. doi: 10.1161/01.res.0000073585.50092.14
Ball, M. K., Waypa, G. B., Mungai, P. T., Nielsen, J. M., Czech, L., Dudley, V. J., et al. (2014). Regulation of hypoxia-induced pulmonary hypertension by vascular smooth muscle hypoxia-inducible factor-1α. Am. J. Respir. Crit. Care Med. 189, 314–324.
Brock, M., Schuoler, C., Ulrich, S., Speich, R., Gassmann, M., Kohler, M., et al. (2016). The long noncoding RNA MEG3 is an emerging factor in hypoxia-induced pulmonary hypertension. J. Heart Lung Transplant. 35:S358.
Calvier, L., Chouvarine, P., Legchenko, E., Hoffmann, N., Geldner, J., Borchert, P., et al. (2017). PPARgamma links BMP2 and TGFbeta1 pathways in vascular smooth muscle cells, regulating cell proliferation and glucose metabolism. Cell Metab. 25, 1118–1134. doi: 10.1016/j.cmet.2017.03.011
Cottrill, K. A., and Chan, S. Y. (2013). Metabolic dysfunction in pulmonary hypertension: the expanding relevance of the Warburg effect. Eur. J. Clin. Invest. 43, 855–865. doi: 10.1111/eci.12104
Cui, X. G., Han, Z. T., He, S. H., Wu, X. D., Chen, T. R., Shao, C. H., et al. (2017). HIF1/2α mediates hypoxia-induced LDHA expression in human pancreatic cancer cells. Oncotarget 8, 24840–24852.
Franceschini, A., Szklarczyk, D., Frankild, S., Kuhn, M., Simonovic, M., Roth, A., et al. (2012). STRING v9. 1: protein-protein interaction networks, with increased coverage and integration. Nucleic Acids Res. 41, D808–D815. doi: 10.1093/nar/gks1094
Gasri-Plotnitsky, L., Ovadia, A., Shamalov, K., Nizri-Megnaji, T., Meir, S., Zurer, I., et al. (2017). A novel lncRNA, GASL1, inhibits cell proliferation and restricts E2F1 activity. Oncotarget 8, 23775–23786. doi: 10.18632/oncotarget.15864
Giannakoulas, G., Mouratoglou, S., Gatzoulis, M., and Karvounis, H. (2014). Blood biomarkers and their potential role in pulmonary arterial hypertension associated with congenital heart disease. a systematic review. Int. J. Cardiol. 174, 618–623. doi: 10.1016/j.ijcard.2014.04.156
Harrow, J., Frankish, A., Gonzalez, J. M., Tapanari, E., Diekhans, M., Kokocinski, F., et al. (2012). GENCODE: the reference human genome annotation for The ENCODE Project. Genome Res. 22, 1760–1774. doi: 10.1101/gr.135350.111
Jiang, Y., Wang, J., Tian, H., Li, G., Zhu, H., Liu, L., et al. (2015). Increased SUMO-1 expression in response to hypoxia: interaction with HIF-1α in hypoxic pulmonary hypertension. Int. J. Mol. Med. 36, 271–281. doi: 10.3892/ijmm.2015.2209
Johns, R. A., Takimoto, E., Meuchel, L. W., Elsaigh, E., Zhang, A., Heller, N. M., et al. (2016). Hypoxia-inducible factor 1α is a critical downstream mediator for hypoxia-induced mitogenic factor (FIZZ1/RELMα)-induced pulmonary hypertension. Arterioscler. Thromb. Vasc. Biol. 36, 134–144. doi: 10.1161/atvbaha.115.306710
Koppenol, W. H., Bounds, P. L., and Dang, C. V. (2011). Otto Warburg’s contributions to current concepts of cancer metabolism. Nat. Rev. Cancer 11, 325–337. doi: 10.1038/nrc3038
Kuniyoshi, F., Akihiro, N., Atsushi, H., Naohiko, N., Yoshifumi, O., Makoto, A., et al. (2015). Pyk2 aggravates hypoxia-induced pulmonary hypertension by activating HIF-1α. Am. J. Physiol. Heart Circ. Physiol. 308, 951–959.
Kuriyama, S., Morio, Y., Toba, M., Nagaoka, T., Takahashi, F., Iwakami, S., et al. (2014). Genistein attenuates hypoxic pulmonary hypertension via enhanced nitric oxide signaling and the erythropoietin system. Am. J. Physiol. Lung Cell. Mol. Physiol. 306, L996–L1005. doi: 10.1152/ajplung.00276.2013
Lau, E. M., Tamura, Y., Mcgoon, M. D., and Sitbon, O. (2015). The 2015 ESC/ERS guidelines for the diagnosis and treatment of pulmonary hypertension: a practical chronicle of progress. Eur. Respir. J. 46, 879–882. doi: 10.1183/13993003.01177-2015
Li, X., He, Y., Xu, Y., Huang, X., Liu, J., Xie, M., et al. (2015). KLF5 mediates vascular remodeling via HIF-1α in hypoxic pulmonary hypertension. Am. J. Physiol. Lung Cell. Mol. Physiol. 310, L299–L310.
Li, Y., Liu, G., Cai, D., Pan, B., Lin, Y., Li, X., et al. (2014). H2S inhibition of chemical hypoxia-induced proliferation of HPASMCs is mediated by the upregulation of COX-2/PGI2. Int. J. Mol. Med. 33, 359–366. doi: 10.3892/ijmm.2013.1579
Liu, J., Wang, W., Wang, L., Chen, S., Tian, B., Huang, K., et al. (2018). IL-33 initiates vascular remodelling in hypoxic pulmonary hypertension by up-Regulating HIF-1alpha and VEGF expression in vascular endothelial cells. EBiomedicine 33, 196–210. doi: 10.1016/j.ebiom.2018.06.003
Liu, X., Xiao, Z.-D., Han, L., Zhang, J., Lee, S.-W., Wang, W., et al. (2016). LncRNA NBR2 engages a metabolic checkpoint by regulating AMPK under energy stress. Nat. Cell Biol. 18, 431–442. doi: 10.1038/ncb3328
Livak, K., and Schmittgen, T. (2001). Analysis of relative gene expression data using real-time quantitative PCR and the 2(-Delta Delta C(T)) method. Methods 25, 402–408. doi: 10.1006/meth.2001.1262
Michelakis, E. D., Wilkins, M. R., and Rabinovitch, M. (2008). Emerging concepts and translational priorities in pulmonary arterial hypertension. Circulation 118, 1486–1495. doi: 10.1161/circulationaha.106.673988
Montani, D., Günther, S., Dorfmüller, P., Perros, F., Girerd, B., Garcia, G., et al. (2013). Pulmonary arterial hypertension. Orphanet J. Rare Dis. 8:97. doi: 10.1186/1750-1172-8-97
Papaioannou, A. I, Zakynthinos, E., Kostikas, K., Kiropoulos, T., Koutsokera, A., Ziogas, A., et al. (2009). Serum VEGF levels are related to the presence of pulmonary arterial hypertension in systemic sclerosis. BMC Pulm. Med. 9:18. doi: 10.1186/1471-2466-9-18
Partovian, C., Adnot, S., Raffestin, B., Louzier, V., Levame, M., Mavier, I. M., et al. (2000). Adenovirus-mediated lung vascular endothelial growth factor overexpression protects against hypoxic pulmonary hypertension in rats. Am. J. Respir. Cell Mol. Biol. 23, 762–771. doi: 10.1165/ajrcmb.23.6.4106
Paulin, R., and Michelakis, E. (2014). The metabolic theory of pulmonary arterial hypertension. Circ. Res. 115, 148–164. doi: 10.1161/CIRCRESAHA.115.301130
Peng, W., Koirala, P., and Mo, Y. (2017). LncRNA-mediated regulation of cell signaling in cancer. Oncogene 36, 5661–5667. doi: 10.1038/onc.2017.184
Pertea, M., Pertea, G. M., Antonescu, C. M., Chang, T. C., Mendell, J. T., and Salzberg, S. L. (2015). StringTie enables improved reconstruction of a transcriptome from RNA-seq reads. Nat. Biotechnol. 33, 290–295. doi: 10.1038/nbt.3122
Pulido, T., Adzerikho, I., Channick, R. N., Delcroix, M., Galiè, N., Ghofrani, H. A., et al. (2013). Macitentan and morbidity and mortality in pulmonary arterial hypertension. N. Engl. J. Med. 369, 809–818.
Ramchandran, R., Raghavan, A., Geenen, D., Sun, M., Bach, L., Yang, Q., et al. (2014). PKG-1α leucine zipper domain defect increases pulmonary vascular tone: implications in hypoxic pulmonary hypertension. Am. J. Physiol. Lung Cell. Mol. Physiol. 307, L537–L544. doi: 10.1152/ajplung.00093.2014
Ritchie, M. E., Phipson, B., Wu, D., Hu, Y., Law, C. W., Shi, W., et al. (2015). limma powers differential expression analyses for RNA-sequencing and microarray studies. Nucleic Acids Res. 43:e47. doi: 10.1093/nar/gkv007
Shannon, P., Markiel, A., Ozier, O., Baliga, N. S., Wang, J. T., Ramage, D., et al. (2003). Cytoscape: a software environment for integrated models of biomolecular interaction networks. Genome Res. 13, 2498–2504. doi: 10.1101/gr.1239303
Shimoda, L. A., Sham, J. S., and Sylvester, J. T. (2000). Altered pulmonary vasoreactivity in the chronically hypoxic lung. Physiol. Res. 49, 549–560.
Simonneau, G., Gatzoulis, M. A., Adatia, I., Celermajer, D., Denton, C., Ghofrani, A., et al. (2013). Updated clinical classification of pulmonary hypertension. J. Am. Coll. Cardiol. 62, D34–D41. doi: 10.1016/j.jacc.2013.10.029
Sun, M., Nie, F., Wang, Y., Zhang, Z., Hou, J., He, D., et al. (2016). LncRNA HOXA11-AS promotes proliferation and invasion of gastric cancer by scaffolding the chromatin modification factors PRC2, LSD1, and DNMT1. Cancer Res. 76, 6299–6310. doi: 10.1158/0008-5472.can-16-0356
Tian, X., and Xu, G. (2015). Clinical value of lncRNA MALAT1 as a prognostic marker in human cancer: systematic review and meta-analysis. BMJ Open 5:e008653. doi: 10.1136/bmjopen-2015-008653
Tiede, S. L., Gall, H., Dorr, O., dos Santos Guilherme, M., Liebetrau, C., Voss, S., et al. (2015). New potential diagnostic biomarkers for pulmonary hypertension. Eur. Respir. J. 46, 1390–1396. doi: 10.1183/13993003.00187-2015
Trapnell, C., Pachter, L., and Salzberg, S. L. (2009). TopHat: discovering splice junctions with RNA-Seq. Bioinformatics 25, 1105–1111. doi: 10.1093/bioinformatics/btp120
Veith, C., Schermuly, R. T., Brandes, R. P., and Weissmann, N. (2016). Molecular mechanisms of hypoxia-inducible factor-induced pulmonary arterial smooth muscle cell alterations in pulmonary hypertension. J. Physiol. 594, 1167–1177. doi: 10.1113/jp270689
Xia, Y., Yang, X. R., Fu, Z., Paudel, O., Abramowitz, J., Birnbaumer, L., et al. (2014). Classical transient receptor potential 1 and 6 contribute to hypoxic pulmonary hypertension through differential regulation of pulmonary vascular functions. Hypertension 63, 173–180. doi: 10.1161/HYPERTENSIONAHA.113.01902
Ying, L., Bo, S., Huang, L., Xin, W., Yu, X., Guo, B., et al. (2016). Suppression of the expression of hypoxia-inducible factor-1α by RNA interference alleviates hypoxia-induced pulmonary hypertension in adult rats. Int. J. Mol. Med. 38, 1786–1794. doi: 10.3892/ijmm.2016.2773
Yu, G., Wang, L. G., Han, Y., and He, Q. Y. (2012). clusterProfiler: an R package for comparing biological themes among gene clusters. OMICS 16, 284–287. doi: 10.1089/omi.2011.0118
Yue, J., Guan, J., Wang, X., Zhang, L., Yang, Z., Ao, Q., et al. (2013). MicroRNA-206 is involved in hypoxia-induced pulmonary hypertension through targeting of the HIF-1| [alpha]| | [sol]| Fhl-1 pathway. Lab. Invest. 93, 748–759. doi: 10.1038/labinvest.2013.63
Yun, L., Cao, Y., Sun, S., Zhu, J., Shan, G., Jie, P., et al. (2016). Transforming growth factor-beta1 upregulation triggers pulmonary artery smooth muscle cell proliferation and apoptosis imbalance in rats with hypoxic pulmonary hypertension via the PTEN/AKT pathways. Int. J. Biochem. Cell Biol. 77, 141–154. doi: 10.1016/j.biocel.2016.06.006
Zhang, H., Li, L., Chen, Q., Li, M., Feng, J., Sun, Y., et al. (2018). PGC1beta regulates multiple myeloma tumor growth through LDHA-mediated glycolytic metabolism. Mol. Oncol. 12, 1579–1595. doi: 10.1002/1878-0261.12363
Zhang, W., Qiu, M., Wang, X., Sun, K., Zheng, Y., and Jing, Z. (2014). Up-regulation of hexokinase1 in the right ventricle of monocrotaline induced pulmonary hypertension. Respir. Res. 15:119. doi: 10.1186/s12931-014-0119-9
Zhang, X. Y., Zhang, L. X., Tian, C. J., Tang, X. Y., Zhao, L. M., Guo, Y. L., et al. (2016). LncRNAs BCYRN1 promoted the proliferation and migration of rat airway smooth muscle cells in asthma via upregulating the expression of transient receptor potential 1. Am. J. Trans. Res. 8, 3409–3418.
Keywords: pulmonary artery hypertension, hypoxia, long non-coding RNA, transcriptome sequence, functional enrichment analyses
Citation: Chen S, Xu H, Hu F and Wang T (2020) Identification of Key Players Involved in CoCl2 Hypoxia Induced Pulmonary Artery Hypertension in vitro. Front. Genet. 11:232. doi: 10.3389/fgene.2020.00232
Received: 08 August 2019; Accepted: 26 February 2020;
Published: 24 April 2020.
Edited by:
Zhixiang Lu, Harvard Medical School, United StatesReviewed by:
Liming Tao, Broad Institute, United StatesYi Peng, Northwestern Medicine, United States
Copyright © 2020 Chen, Xu, Hu and Wang. This is an open-access article distributed under the terms of the Creative Commons Attribution License (CC BY). The use, distribution or reproduction in other forums is permitted, provided the original author(s) and the copyright owner(s) are credited and that the original publication in this journal is cited, in accordance with accepted academic practice. No use, distribution or reproduction is permitted which does not comply with these terms.
*Correspondence: Tao Wang, VG9td2FuZ18xMDk1QDE2My5jb20=