 Jihye Ryu
 Chaeyoung Lee
- School of Systems Biomedical Science, Soongsil University, Seoul, South Korea
Ribosomal proteins (RPs) are essential components that translate genetic information from mRNA templates into proteins. Their expressional dysregulation adversely affects the survival and growth of human cells. Nevertheless, little is known about the nucleotide sequences regulating the expression of RPs. Genome-wide associations for expression level of 70 RP genes were conducted across expression stages. Eighteen expression regulatory quantitative trait loci (erQTLs) were identified for protein abundances of 21 RPs (P < 1 × 10⁻⁵), but not for their mRNA expression and ribosome occupancy (P > 1 × 10⁻⁵). These erQTLs for protein abundance (pQTLs) were all trans-acting. Three of the pQTLs were associated with the expression of long noncoding RNAs (lncRNAs). Target genes of these lncRNAs may produce ribosomal components or may control the metabolic cues for ribosome synthesis. mRNAs of the RP genes extensively interact with miRNAs. The protein-specific erQTLs may become engendered by intensive miRNA controls at the translational stage, which in turn can produce RPs efficient in handling instantaneous cell requirements. This study suggests that the expression levels of RPs may be greatly influenced by trans-acting regulation, presumably via interference of miRNAs and target genes of lncRNAs. Further studies are warranted to examine the molecular functions of pQTLs presented in this study and to understand the underlying regulatory mechanisms of gene expression of RPs.
Introduction
Ribosome is a complex organelle required for translating the genetic information of mRNA templates into proteins, and ribosomal proteins (RPs) are primary components of the ribosome in conjunction with ribosomal RNAs (rRNAs). In humans, 80 RPs are assembled into a ribosome together with four rRNAs (Anger et al., 2013), and over 200 factors are involved in the assembly (Thomson et al., 2013). Thus, expression of the RP genes should be exquisitely regulated throughout all stages of gene expression, considering that the RP genes are scattered over the entire human genome. For example, mammalian target of rapamycin (mTOR) signaling controls ribosome biogenesis via expressional regulation of RPs and rRNAs. Under sufficient nutrient condition and presence of growth factors, mTOR signaling increased both transcription and translation of RP genes (Mayer and Grummt, 2006). During transcription, mTOR-dependent transcription factors (e.g., SFP1 and FHL1) bind to the promoters of RP genes (Jorgensen et al., 2004). Moreover, mTOR signaling can activate chromatin state of the RP genes by recruiting histone acetyltransferase ESA1 (Reid et al., 2000), and phosphorylate p70 RP S6 kinase 1 (S6K1; Holz et al., 2005). In particular, S6K1 is a well-known coordinator of ribosome biogenesis and promotes transcription of numerous genes encoding nucleolar factors for ribosome biosynthesis such as rRNA synthesis and RP assembly/transport (Gao and Roux, 2015). During translation, the mTOR signaling promotes translation of the mRNAs with a 5′-terminal oligopyrimidine (5′TOP) sequence (Gentilella and Thomas, 2012). All RP genes include the 5′TOP sequence at their transcriptional start sites (Gentilella and Thomas, 2012), thereby leading to the coordination of ribosome biogenesis regulation in a cell.
For ribosome biogenesis, the cells control RP gene expression, thus ensuring stoichiometric production of RPs (Gupta and Warner, 2014). In general, certain RPs are excessively expressed beyond the cell requirement, and those that fail to assemble into ribosomal subunits are rapidly degraded by the nuclear ubiquitin–proteasome system; however, dysregulation of RP expression or perturbation of ribosome biosynthesis can lead to accumulation of unassembled RPs in the insoluble aggregates in the nucleolus (Sung et al., 2016). Such aggregation can provoke nucleolar stress and activate the MDM2–p53 tumor suppress pathway (Deisenroth and Zhang, 2010).
Although regulating the gene expression of RPs is crucial in maintaining cell growth and survival, the mechanism by which genetic factors regulate their gene expression remains unclear. The present study aimed to identify the expression regulatory quantitative trait loci (erQTLs) for RPs across expressional stages.
Materials and Methods
Expression Data
This study examined erQTLs for expression of RP genes at three different stages: mRNA transcription, ribosome occupancy, and protein abundance. We used expression data obtained from studies that assessed three kinds of expression levels using lymphoblastoid cell lines (LCLs) derived from unrelated Yoruba individuals of Ibadan in Nigeria (Pickrell et al., 2010; Battle et al., 2015). The mRNA transcript levels of 75 individuals were obtained by polyadenylated fractions of RNAs using the Illumina GA2 platform (Pickrell et al., 2010). The quantity was estimated with the median of 8.6 M reads per individual uniquely mapped to the Ensemble genes. Read counts were normalized by the total number of mapped reads and gene length and were recorded as reads per kilobase per million mapped reads (RPKM) of each gene for every individual. The ribosome occupancy levels of 72 individuals were produced by sequencing ribosome-protected fragments (RPFs) of mRNA isolated using Illumina HiSeq 2500 with ARTseq Ribosome Profiling kit (Epicenter, RPHMR12126; Battle et al., 2015). The median was 12.1 M reads per individual, and the read counts were also normalized. Protein abundance levels were obtained as ratios to the stable isotope labeling by amino acids in cell culture (SILAC) internal standard sample for the gene using protein mass spectrometry (Battle et al., 2015). Individuals lacking SILAC internal standard sample were excluded.
Expression regulatory quantitative trait loci were identified with the data centered and scaled to mean 0 and variance 1 and were then quantile-normalized to fit a standardized normal distribution. A principal component (PC) analysis was conducted to eliminate the unmeasured potential confounding effects. The PC count was determined by maximizing the number of identified erQTLs for each of three kinds of expression data. Six PCs were regressed out from mRNA expression, nine PCs from ribosomal occupancy, and seven PCs from protein abundance. Expression data of RPs used in the present study included mRNA expression of 70 RP genes (43 for large subunit and 27 for small subunit), ribosome occupancy of 69 RP genes (42 and 27), and protein abundance of 66 RP genes (39 and 27).
Genotype Data
We used autosomal genotypic data of Yoruba individuals in a variant calling format produced from the 1000 Genomes Project Phase 31. The sequence variants were excluded following the criteria of Hardy–Weinberg disequilibrium (P < 1 × 10⁻⁶) and the minor allele frequency (MAF) < 0.1. After the quality control, genotypic data for 5,594,467 nucleotide variants on 64 YRI individuals were retained for analyzing the erQTL association. Only individuals with both genotype and expression data were used for the present erQTL analysis. As a result, 63 individuals for eQTL analysis, 62 for rQTL, and 51 for pQTL were included.
Additional Data
We further investigated erQTLs using various expression data to specify the regulatory mechanism of identified erQTLs. Initially, we identified cis-eGenes to understand the potential regulatory mechanism of trans-erQTL. The cis-eGene was defined as a protein-coding or noncoding gene within 1 Mb from erQTL. The erQTLs for protein-coding genes and lncRNAs were determined by transcriptomic data resulting from the Genotype-Tissue Expression Consortium (GTEx)2. The erQTLs for miRNA were examined for their expression in LCL of Yoruba individuals from the 1000 Genomes project (Lappalainen et al., 2013).
To discover the putative mRNA targets of lncRNAs identified as cis-eGenes, the lncRNA–RNA interaction was predicted based on the energy of intermolecular base-pairing interactions. These predictions were made with a cutoff value of 16 kcal/mol reduction in the interaction energy using Rtools3 (Terai et al., 2016).
The human miRNA interactome data produced by cross-linking, ligation, and sequencing of hybrids (CLASH) were used to evaluate the posttranscriptional regulation of RP genes. A total of 18,514 miRNA–target RNA interactions were available as chimeric sequencing reads between 6,959 genes and 399 miRNAs (Helwak et al., 2013). All the miRNAs paired with human RP genes were selected to examine whether miRNA–RP RNA interactions were enriched.
Statistical Analysis
The erQTLs for RPs at mRNA transcription, ribosome occupancy, and protein abundance were identified using a mixed linear model. The analytical model for genome-wide erQTL included polygenic effects with a genomic similarity matrix (GSM) to avoid population stratification (Lee, 2018) as follows:
where y is the vector of expression levels for RP genes, μ is the overall mean, 1 is the vector of 1′s, β presents the fixed effects for the minor allele of the nucleotide variant to be tested for association, and X is the design matrix with elements of 0, 1, and 2 for the homozygote of the major allele, heterozygote of the minor allele, and homozygote of the minor allele, respectively. Vector g presents the random polygenic effects with , where A is the GSM with elements of pairwise genomic similarity coefficients estimated using sequence variants and is the polygenic variance component. The genomic similarity coefficient between individuals j and k can be calculated (Yang et al., 2011) as follows:
where nν is the number of nucleotide variants that contribute to the genomic similarity, τij, and τik represent the number (0, 1, or 2) of minor alleles for the nucleotide variant i, and fi is the frequency of the minor allele. Vector ε is the random residuals with , where is the environmental variance component and I is the identity matrix. The variance components for polygenic effects and residuals were estimated using restricted maximum likelihood (REML). The REML estimates were initially obtained by expectation–maximization algorithm and were then used as initial values to obtain their average information-based REML estimates. All the association analyses for erQTL were carried out using GCTA (v1.26)4. For genome-wide identification of erQLT, multiple testing was applied with a conservative significance threshold of P = 1.0 × 10⁻⁵ using permutation. The erQTL identification process was repeated for the three types of levels across the expression stages.
Results
Genome-wide analysis of erQTL for RPs revealed associations of 132 nucleotide variants with protein abundance (P < 1.0 × 10⁻⁵), but any associations were not found with mRNA expression or with ribosome occupancy (P > 1.0 × 10⁻⁵). Linkage analysis showed that the 132 variants were included in 18 independent linkage disequilibrium blocks. The 18 pQTLs are presented with a representative variant at each association signal in Table 1. The signals except for rs10986456, rs10792421, and rs7323301 were shared by two or more RPs. Significances for the pQTLs across 21 RPs are presented in Figure 1. None of the 18 pQTLs was located within the corresponding eGene. Nine intragenic pQTLs were found within genes encoding five proteins (CACNA1A, TGFBR2, ATP11B, BMP6, and KIR2DS4) and four lncRNAs (RP11-483P21.3, AC083864.3, RP4-705D16.3, and AC07371.1). Five pQTLs in the protein-coding genes were not associated with expression of the corresponding gene or genes in the same chromosome regardless of their expressional stages (P > 0.05). In contrast, two pQTLs (rs462331 and rs2710804) in lncRNA genes were associated with the corresponding lncRNAs (RP11-483P21.3 and AC083864.3, respectively) in numerous human tissues (P < 1.0 × 10⁻⁴, Table 2). Moreover, rs462331 and rs10986456 were associated with their nearby lncRNAs, RP11-483P21.2 and RP3-377H17.2, respectively.
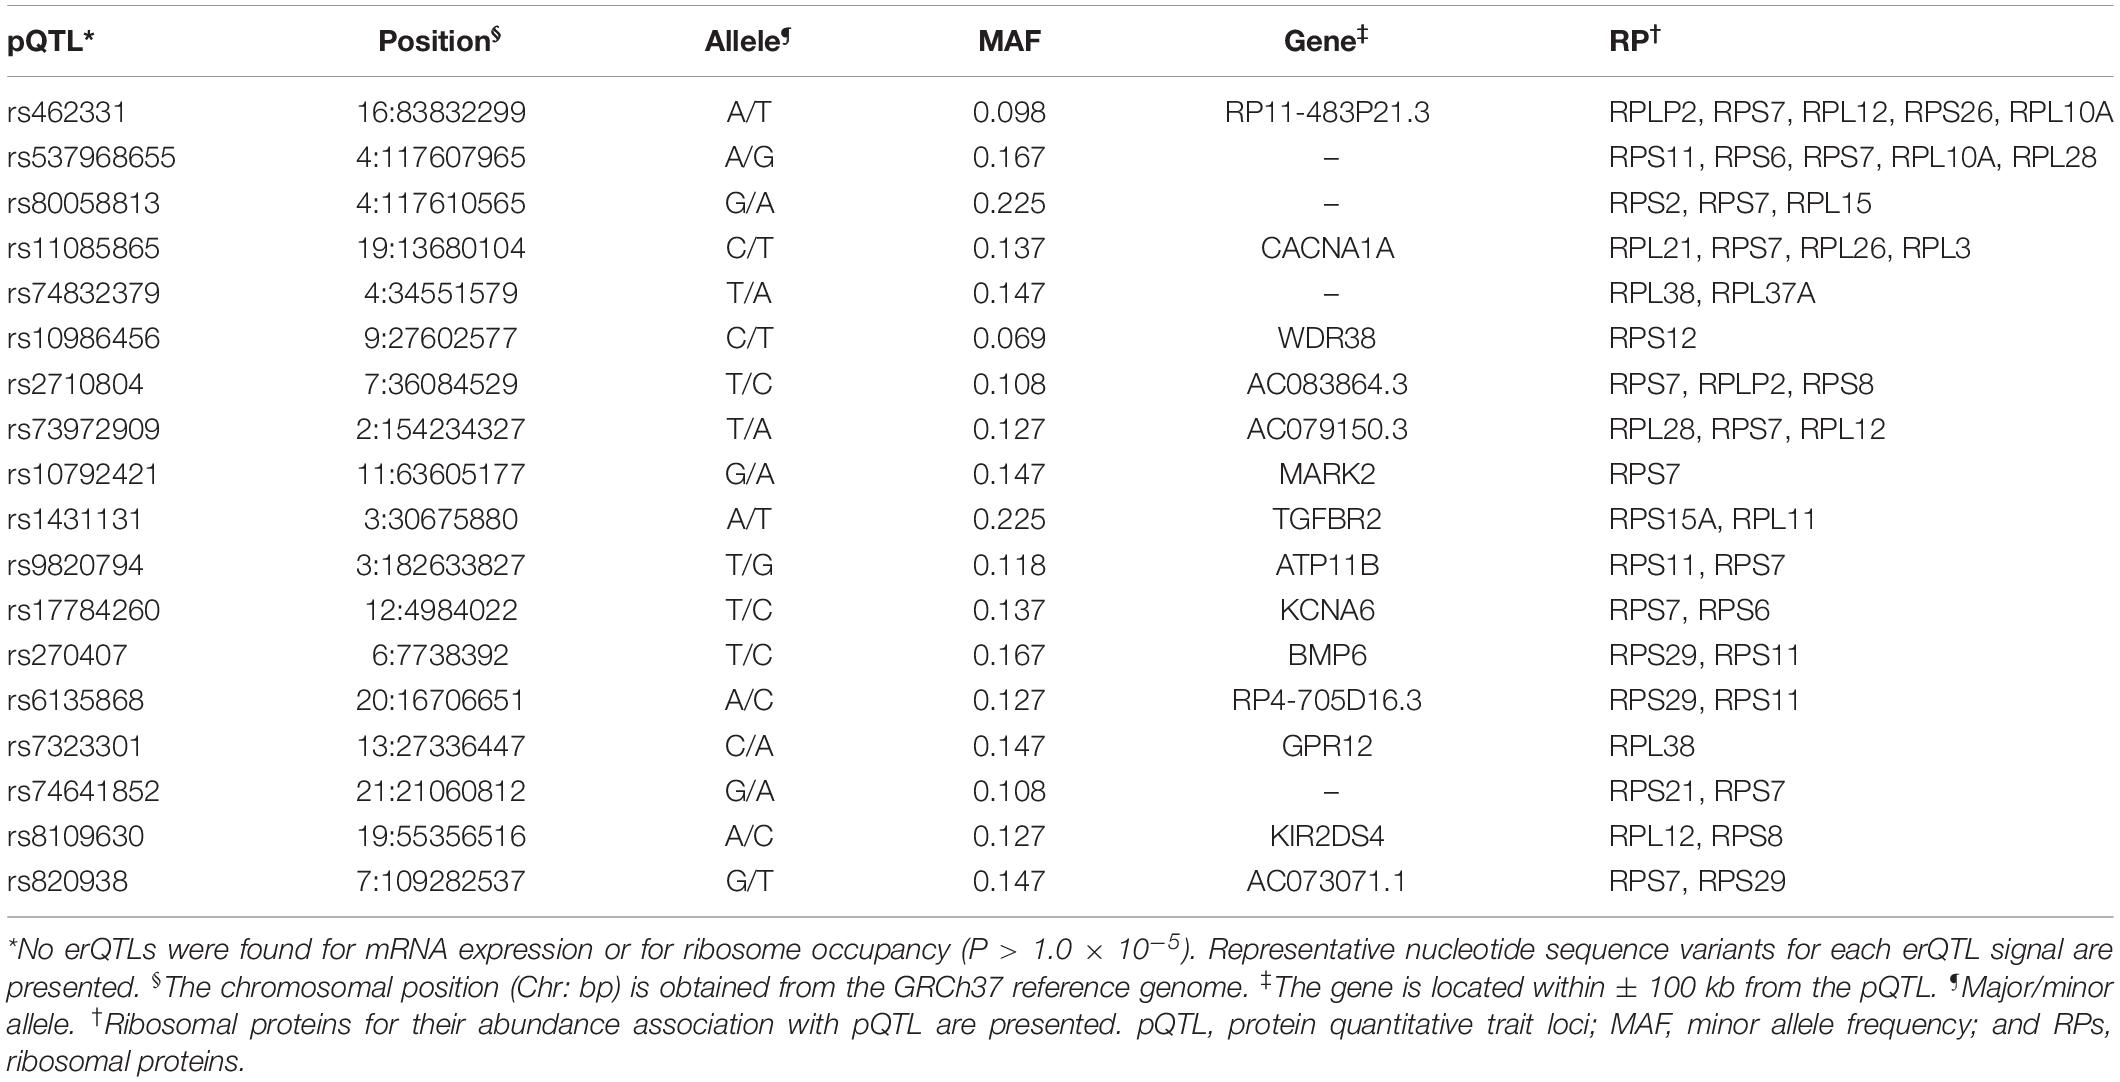
Table 1. Genome-wide association of genetic variants with abundance of ribosomal protein*.
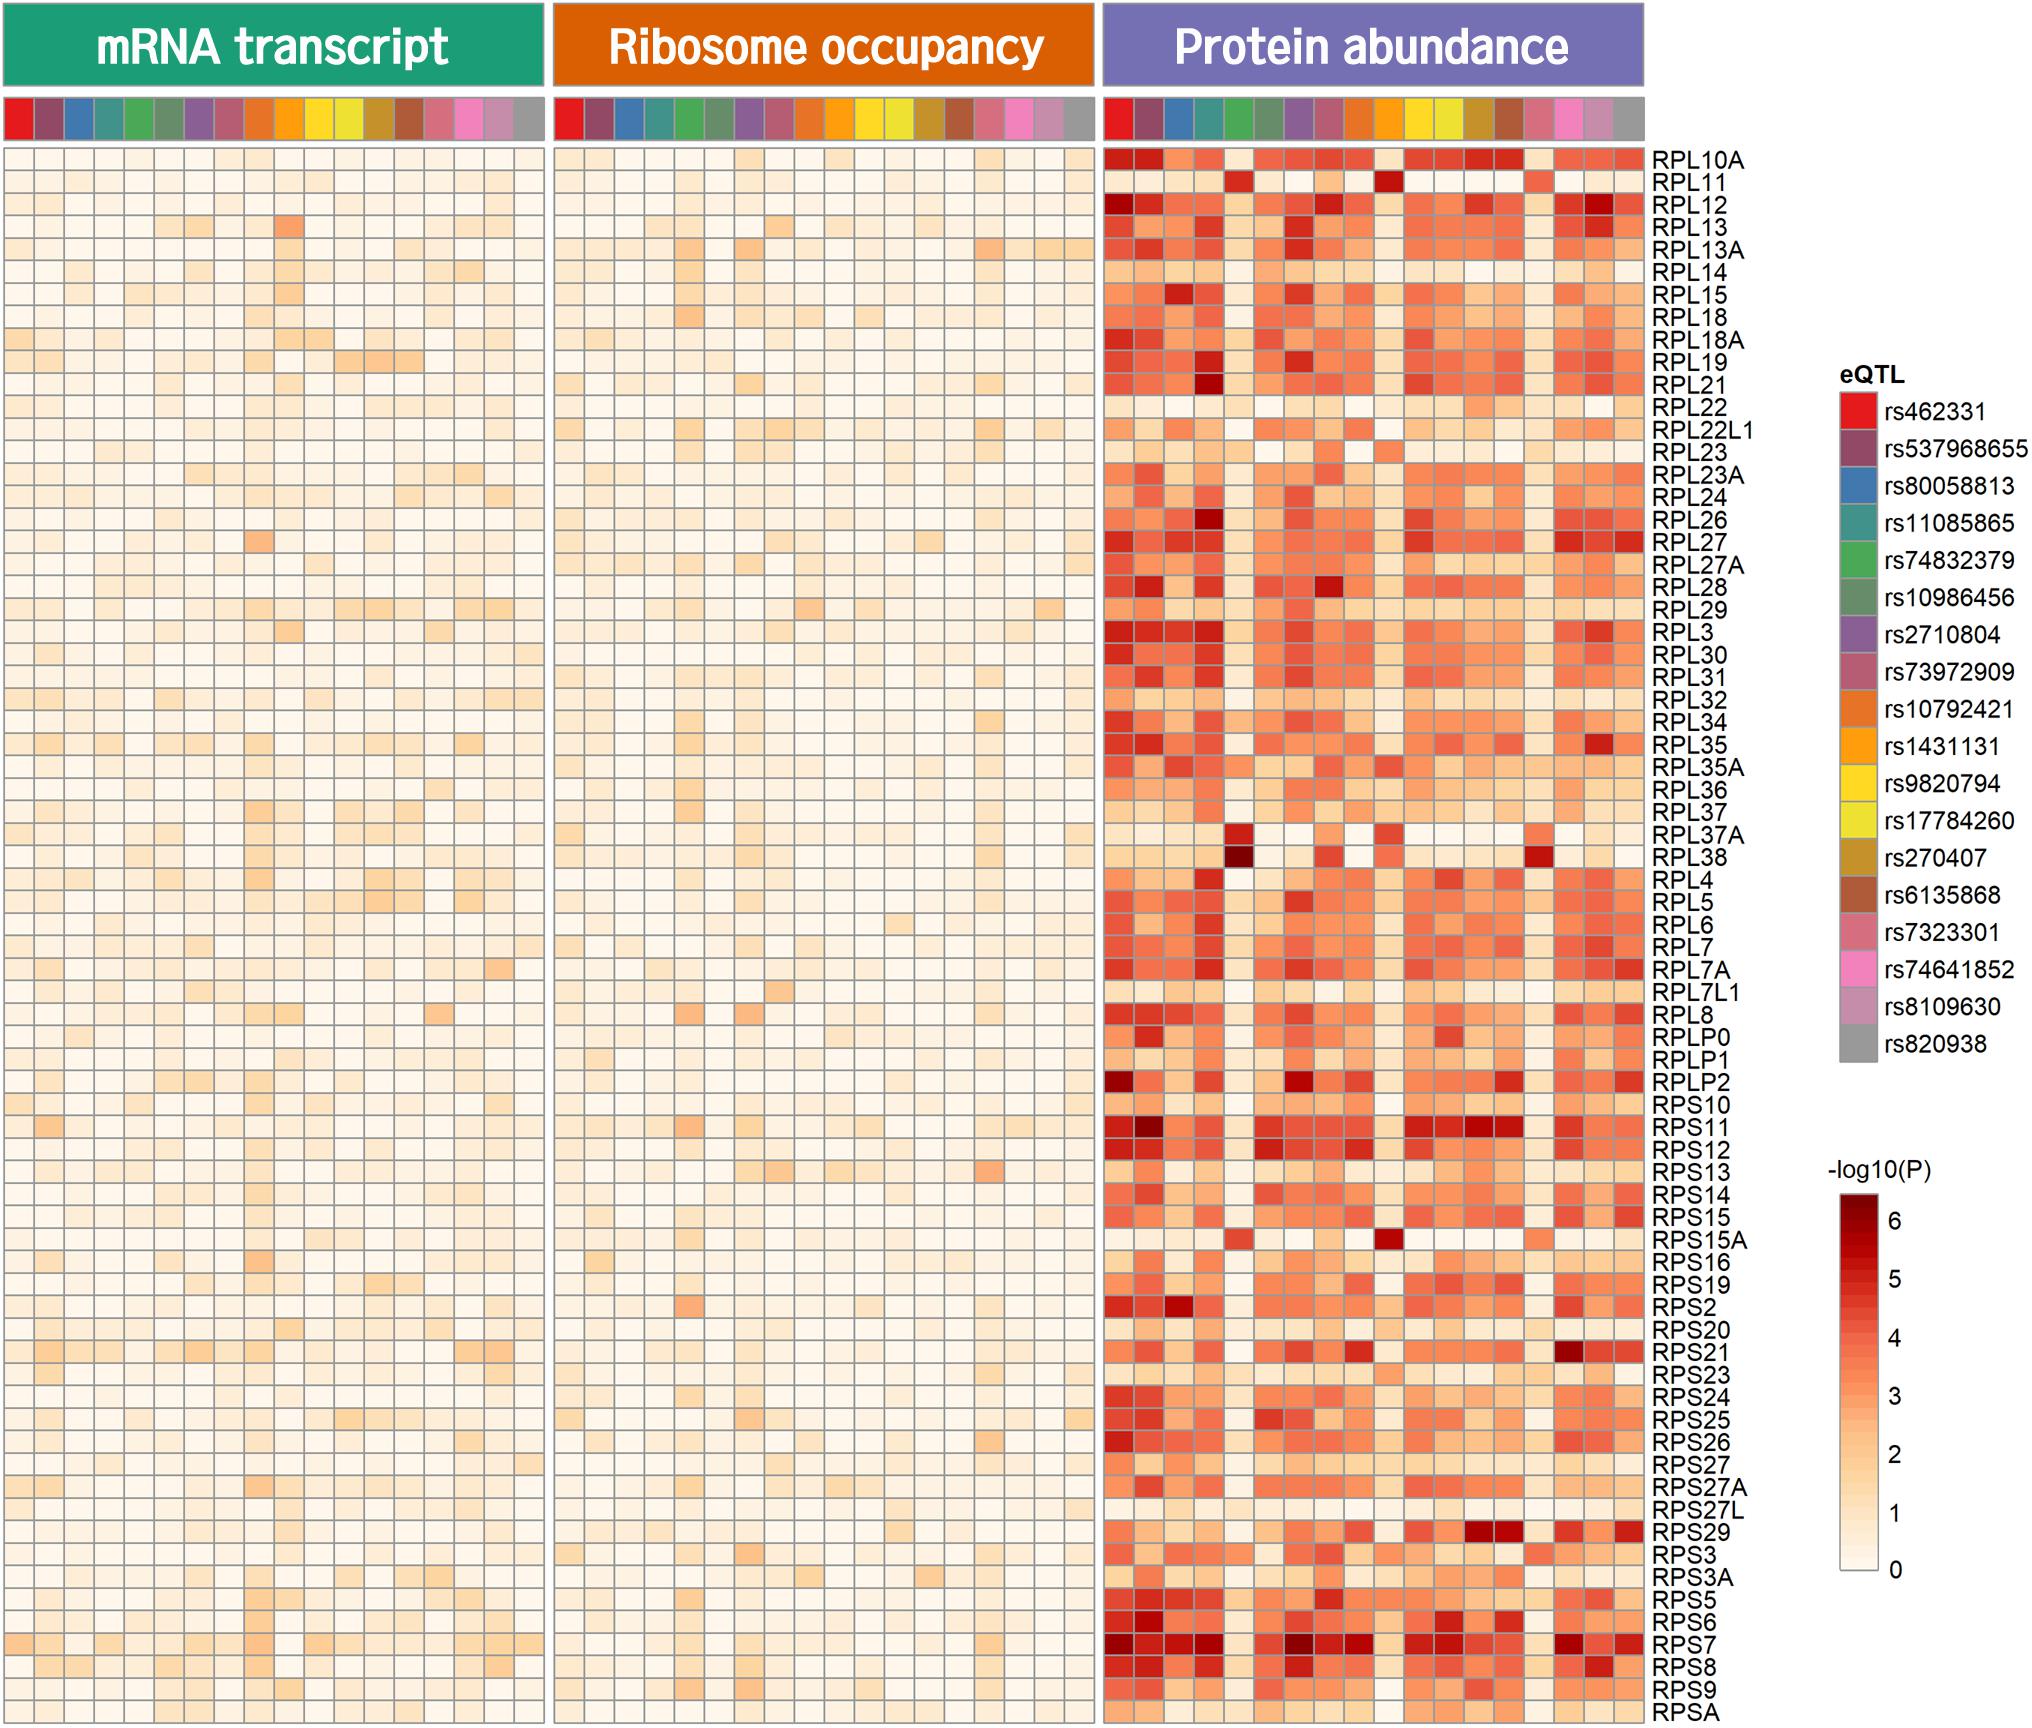
Figure 1. Heatmap of pQTL significance for ribosomal protein genes across expression stages. Significance of association with representative nucleotide variant at every pQTL signal is presented.
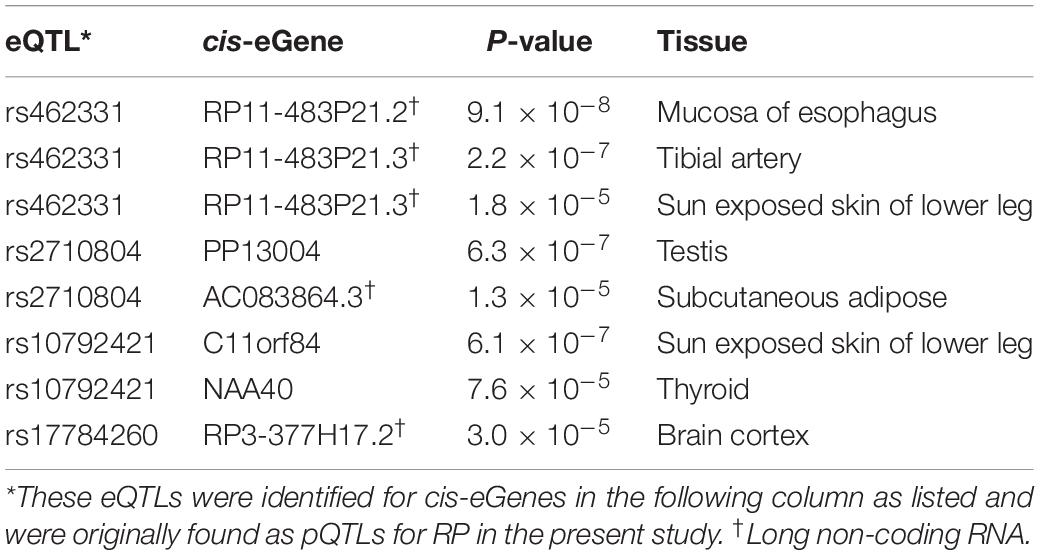
Table 2. Association of pQTL for ribosomal protein with mRNA expression of near gene (cis-eGene).
Furthermore, the top-ranked 200 target genes were analyzed for their mRNA interaction with each of the four lncRNAs associated with pQTLs. Protein abundance of nine of the target genes was associated (P < 0.05) with the pQTLs identified in the present study (Table 3). Two (DFFA and VKORC1L1) of these nine target genes for lncRNAs were associated with multiple pQTLs (rs462331 and rs2710804) which were previously identified for expression of lncRNAs (RP11-483P21.2 and AC083864.3, respectively).
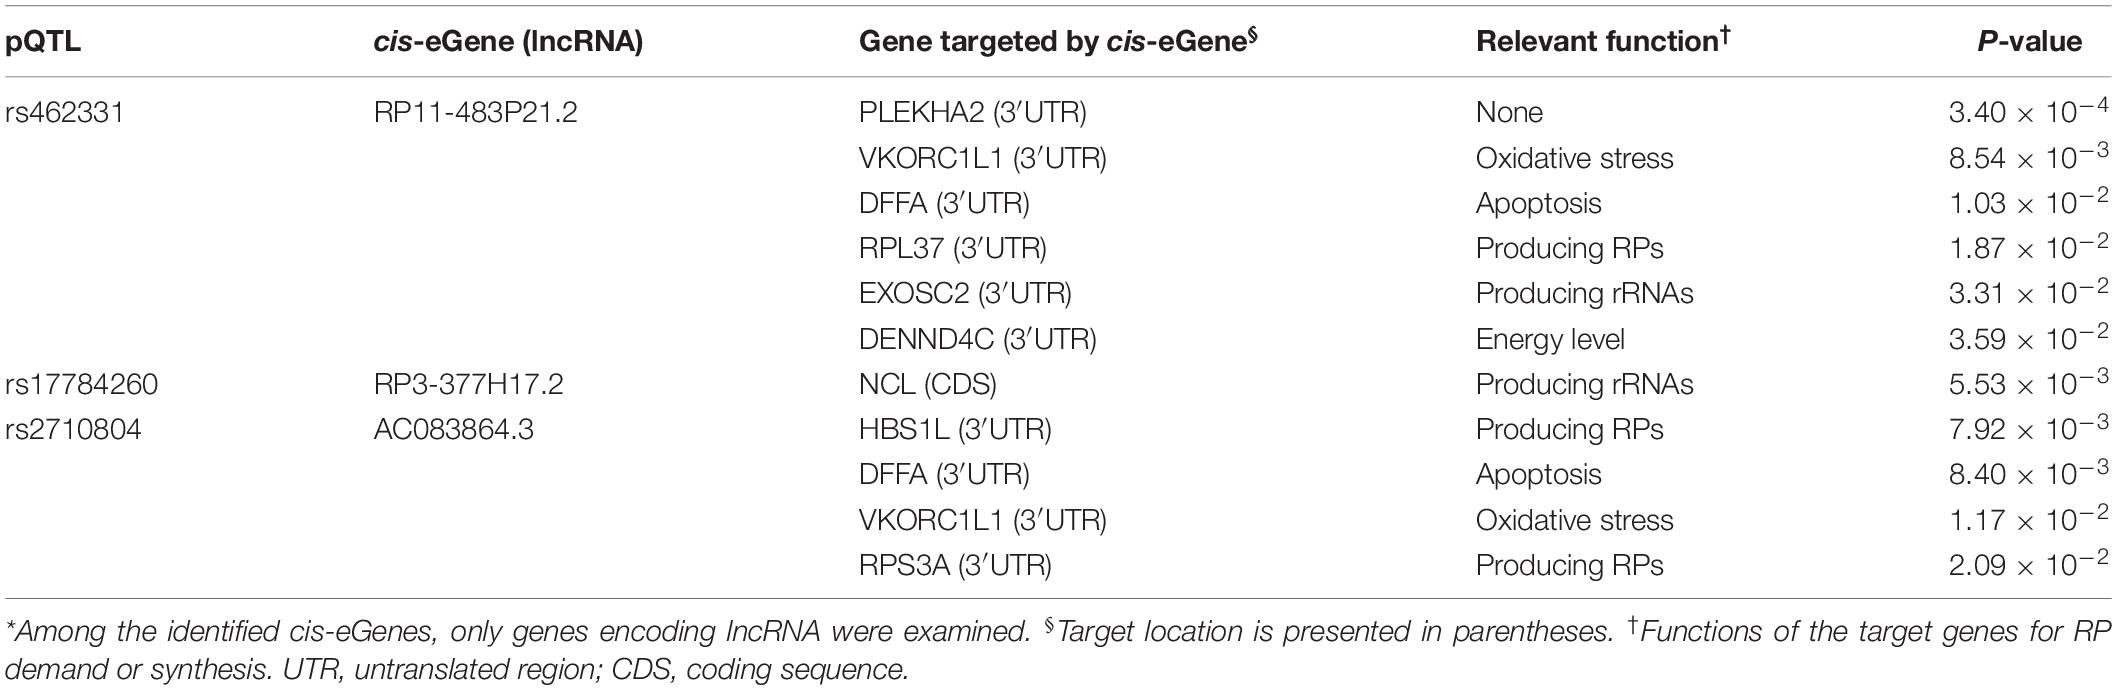
Table 3. Association of pQTL with gene targeted by cis-eGene*.
Of the 80 known RP genes in human genome, RNAs transcribed from 76 genes were found to interact with miRNAs using CLASH (Table 4). Their proportion (0.95) is significantly larger (P < 0.01) than that (0.35) for other human genes. The interactions for every RP RNA and the RP RNA targeted by a miRNA occurred more frequently than those for other human genes (P < 0.05).
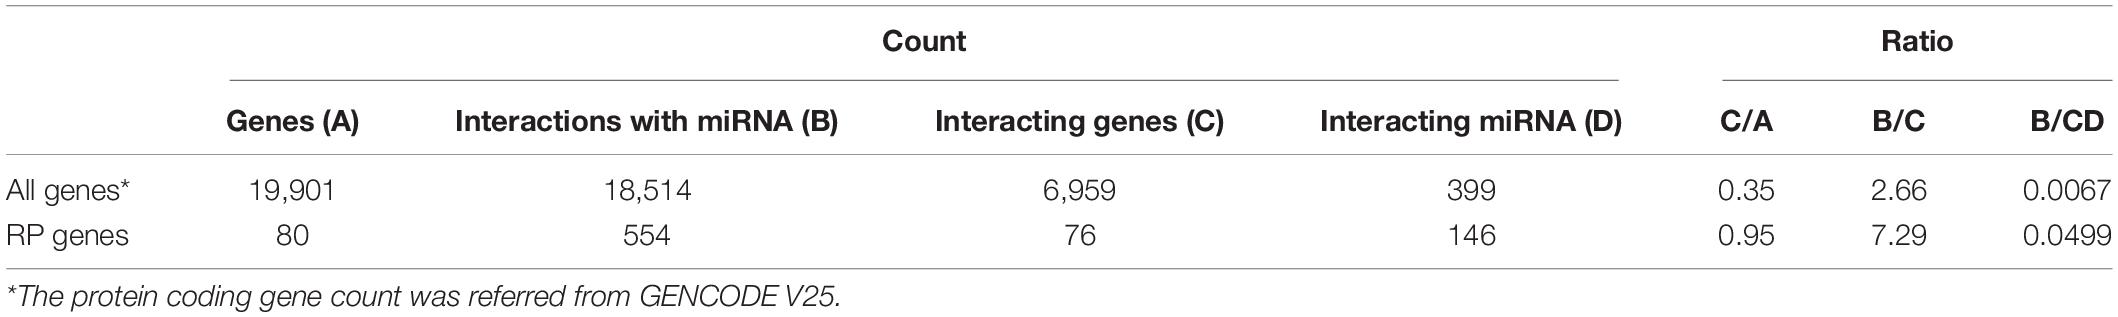
Table 4. Number and enrichment ratio of ribosomal protein genes interacting with miRNAs.
Discussion
We identified 18 erQTLs for protein abundance of 21 RPs: 10 RPs in a small subunit and 11 RPs in a large subunit (P < 1.0 × 10⁻⁵). They were all protein-specific and trans-acting erQTLs. Three (rs462331, rs2710804, and rs10986456) of these pQTLs were associated with lncRNAs (RP11-483P21.3, AC083864.3, RP11-483P21.2, and RP3-377H17.2) in cis-acting. Some genes predicted as targets of the lncRNAs shared the pQTLs with RP genes. The target genes may trigger the RP expression. For example, RPS3A, RPL37, NCL, and EXOSC2 are known to be involved in ribosome synthesis (Mitchell et al., 1997; Ginisty et al., 1998; Fremerey et al., 2016). Furthermore, DFFA is implicated in apoptosis by provoking DNA fragmentation (Liu et al., 1997), and expression of VKORC1L1 is inflated by oxidative stress (Westhofen et al., 2011).
Since ribosomes are essential for most cellular activities such as cell survival, cell growth, and development in every living cell, the genes encoding RPs are well known and stably expressed (De Jonge et al., 2007). About 70% of cellular transcription is involved in ribosome biogenesis. Moreover, 50% of RNAPII transcription and 90% of mRNA splicing are allocated to transcription of RP genes (Li et al., 1999; Warner, 1999). About 30% translation in cells is processed for ribosome biogenesis (de la Cruz et al., 2018). Thus, the RP expression seems to be a high energy-demanding process and requires efficient regulation of the fluctuating cellular environment.
Certain strategies are applied for the rapid production of RPs according to the cell demand. RPs are excessively produced. In general, 25% of RPs in the protein level are spared to cope with the unexpectedly increased demand (Metzl-Raz et al., 2017); however, translation is a high-energy-consuming process for amino acid synthesis and polypeptide assembly. This requires approximately 50% of ATP consumption in the rapidly growing yeast cells (Warner, 1999). In contrast, transcription utilizes only 10% of the energy required for protein production (Liu et al., 2016). Thus, an instantaneous translation may be an energy-efficient model for prompt production of proteins. Indeed, RP mRNAs are abundantly stored as inactive messenger ribonucleoprotein (mRNP) particles in the cytoplasm of quiescent cells and poised for translation (Mayer and Grummt, 2006; Patursky-Polischuk et al., 2009). Only RP pQTLs were identified in the present study due to the intensive translational control of RPs; that is, instantaneous changes from repressed to active state are greatly attributed to translational regulations. In particular, it is notable that erQTL for ribosomal occupancy was not found in the current study, considering that ribosomal occupancy is, in general, largely correlated with protein abundance (Battle et al., 2015). A substantial control after initiation of translation is suspected. Polysomes for RP transcripts have larger ribosome density and larger tRNA adaptation than those for non-RP transcripts to cope with a heavy translation burden for cellular activity (Riba et al., 2019). Nevertheless, elongation of translation is slower for RP transcripts than for other transcripts (Riba et al., 2019). These results imply that expression of the RP genes is intensively regulated by controlling elongation speed of translation. The elongation speed can be controlled by frequent interaction of RP mRNA with miRNA. This was supported by the current study where various miRNAs were bound to RP mRNA as shown in Table 4. Numerous RPs (95%) were regulated by miRNAs, with three times more frequent interactions than other human genes. Moreover, RP genes were regulated 7.49 times more frequently by one miRNA on average than by other human genes. The substantial interactions with miRNA may efficiently regulate the RP expression. The fine-tuning in translational regulation by various miRNAs is crucial for ribosome heterogeneity (Genuth and Barna, 2018).
The 18 pQTLs found in the present study were all trans-acting pQTLs. Among these, 15 pQTLs were associated with multiple RPs. We initially tried to discover cis-eGenes of the trans-acting pQTLs. As a result, seven cis-eGenes were identified, and four of them were lncRNAs (Table 2). The lncRNAs were five times larger than those (0.8) that resulted from non-RP pQTLs (P < 0.05; Supplementary Table S1). In general, lncRNAs regulate the expression of their target genes after transcription via base-pairing interactions between lncRNA and RNA (Kretz et al., 2013). These lncRNAs may regulate the gene expression that may further control expression of RP genes. Protein abundance of nine target genes, which presumably interact with the four lncRNAs, is known to be associated with the pQTLs originally identified in the present study (Table 3). The target genes may contribute to ribosome synthesis by producing rRNAs or RPs itself or indirectly by controlling the metabolic cues that influence ribosome synthesis (Table 3). For example, RPL37 and RPS3A as the RPs were found to be regulated by lncRNA. HBS1L controls ribosome-associated mRNA surveillance, retrieving stalled ribosome during translation and maintaining ribosome homeostasis (Shoemaker et al., 2010). NCL and EXOSC2 produce rRNA (Mitchell et al., 1997; Ginisty et al., 1998; Fremerey et al., 2016). The rRNAs as major components for ribosome synthesis are expressed simultaneously with the RP genes. In particular, transcription of rRNAs strictly controlled the expression of RP genes in yeasts (Granneman and Tollervey, 2007). Moreover, NCL is known to play a pivotal role in ribosome assembly and biogenesis as well as in rRNA transcription and maturation (Ghisolfi et al., 1992; Bouvet et al., 1998). The NCL can control the expression of RPs by modulating the posttranscriptional expression of apoptosis-related genes such as BCL2, CCNI, and TP53 (Sengupta et al., 2004; Takagi et al., 2005; Abdelmohsen et al., 2011). Target genes with a function of regulating metabolic cues for ribosome synthesis include DFFA, VKORC1L1, and DENND4C. DFFA as an inhibitor of CAD is normally present in a complex with CAD. A cleavage between DFFA and CAD can provoke DNA fragmentation, a primary process of apoptosis (Sakahira et al., 1998). VKORC1L1 decreases the level of vitamins, K 2,3-epoxide, and K quinone. This reductase contributes to vitamin K-mediated protection against oxidative stress and conversion to active vitamin K (Westhofen et al., 2011; Karasawa et al., 2013). Thus, it plays a pivotal role in cell survival and apoptosis via intracellular antioxidation (Westhofen et al., 2011) and binding of the active vitamin K to BAK (Karasawa et al., 2013), respectively. DENND4C can facilitate glucose transportation into a cell as a guanine nucleotide exchange factor for Rab10 that is required for translocating GLUT4 (Sano et al., 2011). Cellular glucose is essential for promoting mTOR signaling (Dibble and Manning, 2013) and thereby affects the RP expression. Moreover, mTOR can be also facilitated by other metabolic cues such as apoptosis and oxidative stress. It triggers expression of various RPs by trans-pQTL. Such trans-regulations might considerably explain various protein levels in human cells. A previous pQTL study of human blood plasma revealed that multiple variants of a single gene can regulate even 60% of protein variance (Suhre et al., 2017). Knowledge regarding the underlying mechanisms of these trans-regulations is limited only to the regulation by few intermediates such as miRNA.
The present study identifies 18 erQTLs for RP genes in humans, and they are all pQTLs and trans-acting. Notably, the RP expression might be triggered by the target gene of lncRNA that is the very cis-eGene of the trans-acting pQTL. Moreover, RPs can be efficiently regulated via substantial interactions with miRNAs after the transcriptional stage. The erQTLs across expressional stages would help in understanding the underlying regulatory mechanisms in RP expression.
Data Availability Statement
Publicly available datasets were analyzed in this study. This data can be found here: GSE61742.
Author Contributions
JR and CL conceived the work, analyzed the data, interpreted the results, and wrote the manuscript.
Funding
This work was supported by the National Research Foundation of Korea (NRF) grants funded by the Ministry of Education (NRF-2018R1A6A3A11049586) and by the Ministry of Science and ICT (NRF-2018R1A2B6004867).
Conflict of Interest
The authors declare that the research was conducted in the absence of any commercial or financial relationships that could be construed as a potential conflict of interest.
Supplementary Material
The Supplementary Material for this article can be found online at: https://www.frontiersin.org/articles/10.3389/fgene.2020.00501/full#supplementary-material
Footnotes
- ^ ftp://ftp.1000genomes.ebi.ac.uk/vol1/ftp/release/20130502/
- ^ https://gtexportal.org/
- ^ http://rtools.cbrc.jp/cgi-bin/RNARNA/index.pl
- ^ http://cnsgenomics.com/software/gcta/
References
Abdelmohsen, K., Tominaga, K., Lee, E. K., Srikantan, S., Kang, M. J., Kim, M. M., et al. (2011). Enhanced translation by nucleolin via G-rich elements in coding and non-coding regions of target mRNAs. Nucleic Acids Res. 39, 8513–8530. doi: 10.1093/nar/gkr488
Anger, A. M., Armache, J. P., Berninghausen, O., Habeck, M., Subklewe, M., Wilson, D. N., et al. (2013). Structures of the human and Drosophila 80S ribosome. Nature 497, 80–85. doi: 10.1038/nature12104
Battle, A., Khan, Z., Wang, S. H., Mitrano, A., Ford, M. J., Pritchard, J. K., et al. (2015). Impact of regulatory variation from RNA to protein. Science 347, 664–667. doi: 10.1126/science.1260793
Bouvet, P., Diaz, J. J., Kindbeiter, K., Madjar, J. J., and Amalric, F. (1998). Nucleolin interacts with several ribosomal proteins through its RGG domain. J. Biol. Chem. 273, 19025–19029. doi: 10.1074/jbc.273.30.19025
De Jonge, H. J., Fehrmann, R. S., de Bont, E. S., Hofstra, R. M., Gerbens, F., Kamps, W. A., et al. (2007). Evidence based selection of housekeeping genes. PLoS One 2:e898. doi: 10.1371/journal.pone.0000898
de la Cruz, J., Gómez-Herreros, F., Rodríguez-Galán, O., Begley, V., de la Cruz Muñoz-Centeno, M., and Chávez, S. (2018). Feedback regulation of ribosome assembly. Curr. Genet. 64, 393–404. doi: 10.1007/s00294-017-0764-x
Deisenroth, C., and Zhang, Y. (2010). Ribosome biogenesis surveillance: probing the ribosomal protein-Mdm2-p53 pathway. Oncogene 29, 4253–4260. doi: 10.1038/onc.2010.189
Dibble, C. C., and Manning, B. D. (2013). Signal integration by mTORC1 coordinates nutrient input with biosynthetic output. Nat. Cell Biol. 15, 555–564. doi: 10.1038/ncb2763
Fremerey, J., Morozov, P., Meyer, C., Garzia, A., Teplova, M., Tuschl, T., et al. (2016). Nucleolin controls ribosome biogenesis through its RNA-binding properties. Blood 128:5056. doi: 10.1182/blood.V128.22.5056.5056
Gao, B., and Roux, P. P. (2015). Translational control by oncogenic signaling pathways. Biochim. Biophys. Acta 1849, 753–765. doi: 10.1016/j.bbagrm.2014.11.006
Gentilella, A., and Thomas, G. (2012). Cancer biology: the director’s cut. Nature 485, 50–51. doi: 10.1038/485050a
Genuth, N. R., and Barna, M. (2018). The discovery of ribosome heterogeneity and its implications for gene regulation and organismal life. Mol. Cell 71, 364–374. doi: 10.1016/j.molcel.2018.07.018
Ghisolfi, L., Kharrat, A., Joseph, G., Amalric, F., and Erard, M. (1992). Concerted activities of the RNA recognition and the glycine-rich C-terminal domains of nucleolin are required for efficient complex formation with pre-ribosomal RNA. Eur. J. Biochem. 209, 541–548. doi: 10.1111/j.1432-1033.1992.tb17318.x
Ginisty, H., Amalric, F., and Bouvet, P. (1998). Nucleolin functions in the first step of ribosomal RNA processing. EMBO J. 17, 1476–1486. doi: 10.1093/emboj/17.5.1476
Granneman, S., and Tollervey, D. (2007). Building ribosomes: even more expensive than expected? Curr. Biol. 17, R415–R417. doi: 10.1016/j.cub.2007.04.011
Gupta, V., and Warner, J. R. (2014). Ribosome-omics of the human ribosome. RNA 20, 1004–1013. doi: 10.1261/rna.043653.113
Helwak, A., Kudla, G., Dudnakova, T., and Tollervey, D. (2013). Mapping the human miRNA interactome by CLASH reveals frequent noncanonical binding. Cell 153, 654–665. doi: 10.1016/j.cell.2013.03.043
Holz, M. K., Ballif, B. A., Gygi, S. P., and Blenis, J. (2005). mTOR and S6K1 mediate assembly of the translation preinitiation complex through dynamic protein interchange and ordered phosphorylation events. Cell 123, 569–580. doi: 10.1016/j.cell.2005.10.024
Jorgensen, P., Rupeš, I., Sharom, J. R., Schneper, L., Broach, J. R., and Tyers, M. (2004). A dynamic transcriptional network communicates growth potential to ribosome synthesis and critical cell size. Genes Dev. 18, 2491–2505. doi: 10.1101/gad.1228804
Karasawa, S., Azuma, M., Kasama, T., Sakamoto, S., Kabe, Y., Imai, T., et al. (2013). Vitamin K2 covalently binds to Bak and induces Bak-mediated apoptosis. Mol. Pharmacol. 83, 613–620. doi: 10.1124/mol.112.082602
Kretz, M., Siprashvili, Z., Chu, C., Webster, D. E., Zehnder, A., Qu, K., et al. (2013). Control of somatic tissue differentiation by the long non-coding RNA TINCR. Nature 493, 231–235. doi: 10.1038/nature11661
Lappalainen, T., Sammeth, M., Friedländer, M. R., Ac‘t Hoen, P., Monlong, J., Rivas, M. A., et al. (2013). Transcriptome and genome sequencing uncovers functional variation in humans. Nature 501, 506–511. doi: 10.1038/nature12531
Lee, C. (2018). Genome-wide expression quantitative trait loci analysis using mixed models. Front. Genet. 9:341. doi: 10.3389/fgene.2018.00341
Li, B., Nierras, C. R., and Warner, J. R. (1999). Transcriptional elements involved in the repression of ribosomal protein synthesis. Mol. Cell Biol. 19, 5393–5404. doi: 10.1128/mcb.19.8.5393
Liu, X., Zou, H., Slaughter, C., and Wang, X. (1997). DFF, a heterodimeric protein that functions downstream of caspase-3 to trigger DNA fragmentation during apoptosis. Cell 89, 175–184. doi: 10.1016/s0092-8674(00)80197-x
Liu, Y., Beyer, A., and Aebersold, R. (2016). On the dependency of cellular protein levels on mRNA abundance. Cell 165, 535–550. doi: 10.1016/j.cell.2016.03.014
Mayer, C., and Grummt, I. (2006). Ribosome biogenesis and cell growth: mTOR coordinates transcription by all three classes of nuclear RNA polymerases. Oncogene 25, 6384–6391. doi: 10.1038/sj.onc.1209883
Metzl-Raz, E., Kafri, M., Yaakov, G., Soifer, I., Gurvich, Y., and Barkai, N. (2017). Principles of cellular resource allocation revealed by condition-dependent proteome profiling. Elife 6:e28034. doi: 10.7554/eLife.28034
Mitchell, P., Petfalski, E., Shevchenko, A., Mann, M., and Tollervey, D. (1997). The exosome: a conserved eukaryotic RNA processing complex containing multiple 3′ → 5′ exoribonucleases. Cell 91, 457–466. doi: 10.1016/s0092-8674(00)80432-8
Patursky-Polischuk, I., Stolovich-Rain, M., Hausner-Hanochi, M., Kasir, J., Cybulski, N., Avruch, J., et al. (2009). The TSC-mTOR pathway mediates translational activation of TOP mRNAs by insulin largely in a raptor-or rictor-independent manner. Mol. Cell Biol. 29, 640–649. doi: 10.1128/MCB.00980-08
Pickrell, J. K., Pai, A. A., Gilad, Y., and Pritchard, J. K. (2010). Noisy splicing drives mRNA isoform diversity in human cells. PLoS Genet. 6:e1001236. doi: 10.1371/journal.pgen.1001236
Reid, J. L., Iyer, V. R., Brown, P. O., and Struhl, K. (2000). Coordinate regulation of yeast ribosomal protein genes is associated with targeted recruitment of Esa1 histone acetylase. Mol. Cell 6, 1297–1307. doi: 10.1016/s1097-2765(00)00128-3
Riba, A., Di Nanni, N., Mittal, N., Arhné, E., Schmidt, A., and Zavolan, M. (2019). Protein synthesis rates and ribosome occupancies reveal determinants of translation elongation rates. Proc. Natl. Acad. Sci. U.S.A. 116, 15023–15032. doi: 10.1073/pnas.1817299116
Sakahira, H., Enari, M., and Nagata, S. (1998). Cleavage of CAD inhibitor in CAD activation and DNA degradation during apoptosis. Nature 391, 96–99. doi: 10.1038/34214
Sano, H., Peck, G. R., Kettenbach, A. N., Gerber, S. A., and Lienhard, G. E. (2011). Insulin-stimulated GLUT4 protein translocation in adipocytes requires the Rab10 guanine nucleotide exchange factor Dennd4C. J. Biol. Chem. 286, 16541–16545. doi: 10.1074/jbc.C111.228908
Sengupta, T. K., Bandyopadhyay, S., Fernandes, D. J., and Spicer, E. K. (2004). Identification of nucleolin as an AU-rich element binding protein involved in bcl-2 mRNA stabilization. J. Biol. Chem. 279, 10855–10863. doi: 10.1074/jbc.M309111200
Shoemaker, C. J., Eyler, D. E., and Green, R. (2010). Dom34: Hbs1 promotes subunit dissociation and peptidyl-tRNA drop-off to initiate no-go decay. Science 330, 369–372. doi: 10.1126/science.1192430
Suhre, K., Arnold, M., Bhagwat, A. M., Cotton, R. J., Engelke, R., Raffler, J., et al. (2017). Connecting genetic risk to disease end points through the human blood plasma proteome. Nat. Commun. 8:14357. doi: 10.1038/ncomms14357
Sung, M. K., Reitsma, J. M., Sweredoski, M. J., Hess, S., and Deshaies, R. J. (2016). Ribosomal proteins produced in excess are degraded by the ubiquitin–proteasome system. Mol. Biol. Cell 27, 2642–2652. doi: 10.1091/mbc.E16-05-0290
Takagi, M., Absalon, M. J., McLure, K. G., and Kastan, M. B. (2005). Regulation of p53 translation and induction after DNA damage by ribosomal protein L26 and nucleolin. Cell 123, 49–63. doi: 10.1016/j.cell.2005.07.034
Terai, G., Iwakiri, J., Kameda, T., Hamada, M., and Asai, K. (2016). Comprehensive prediction of lncRNA-RNA interactions in human transcriptome. BMC Genomics 17:12. doi: 10.1186/s12864-015-2307-5
Thomson, E., Ferreira-Cerca, S., and Hurt, E. (2013). Eukaryotic ribosome biogenesis at a glance. J. Cell Sci. 126, 4815–4821. doi: 10.1242/jcs.111948
Warner, J. R. (1999). The economics of ribosome biosynthesis in yeast. Trends Biochem. Sci. 24, 437–440. doi: 10.1016/s0968-0004(99)01460-7
Westhofen, P., Watzka, M., Marinova, M., Hass, M., Kirfel, G., Muller, J., et al. (2011). Human vitamin K 2,3-epoxide reductase complex subunit 1-like 1 (VKORC1L1) mediates vitamin K-dependent intracellular antioxidant function. J. Biol. Chem. 286, 15085–15094. doi: 10.1074/jbc.M110.210971
Keywords: ribosomal protein, expression regulatory quantitative trait loci, trans-acting regulation, pQTL, lncRNA
Citation: Ryu J and Lee C (2020) Regulatory Nucleotide Sequence Signals for Expression of the Genes Encoding Ribosomal Proteins. Front. Genet. 11:501. doi: 10.3389/fgene.2020.00501
Received: 13 February 2020; Accepted: 23 April 2020;
Published: 05 June 2020.
Edited by:
Yadong Zheng, Lanzhou Institute of Veterinary Research (CAAS), ChinaReviewed by:
Sunny Sharma, Massachusetts General Hospital, Harvard Medical School, United StatesYoshihiro Shimizu, RIKEN, Japan
Copyright © 2020 Ryu and Lee. This is an open-access article distributed under the terms of the Creative Commons Attribution License (CC BY). The use, distribution or reproduction in other forums is permitted, provided the original author(s) and the copyright owner(s) are credited and that the original publication in this journal is cited, in accordance with accepted academic practice. No use, distribution or reproduction is permitted which does not comply with these terms.
*Correspondence: Chaeyoung Lee, Y2xlZUBzc3UuYWMua3I=