 Kun Wang†
 Lin Zhang
- Department of Thyroid and Breast Surgery, Tongji Hospital, Tongji Medical College, Huazhong University of Science and Technology, Wuhan, China
The current focus in the treatment of papillary thyroid carcinoma (PTC) is tumor progression. The aim of this study was to build RNA-based classifiers and develop a comprehensive model to provide progression-free interval (PFI) risk prediction for PTC. The RNAseq data, miRNAseq data, and clinical information of PTC were downloaded from The Cancer Genome Atlas database. Based on the differently expressed RNAs, the least absolute shrinkage and selection operator (LASSO) Cox regression model was utilized to build the RNA-based classifiers for PFI of the patients with PTC. A 6-messenger RNA (mRNA)-based classifier, a 5-long non-coding RNA (lncRNA)-based classifier, and a 4-microRNA (miRNA)-based classifier were constructed to predict the PFI. Patients with high risk based on the constructed RNA-based classifiers had worse prognosis in Kaplan–Meier curve analysis with log-rank test. The areas under the curves of the first, third, and fifth years in the training and testing set were 0.83, 0.82, and 0.82 and 0.67, 0.72, and 0.73 for the 6-mRNA-based classifier, respectively; 0.75, 0.84, and 0.85 and 0.71, 0.67, and 0.71 for the 5-lncRNA-based classifier, respectively; and 0.70, 0.77, and 0.79 and 0.74, 0.67, and 0.66 for the 4-miRNA-based classifier, respectively. The prediction capability of the three RNA-based classifiers was superior to the TNM stage system. Furthermore, a nomogram based on the verified independent prognostic factors was established for the prognostic prediction. The C-index and calibration plots indicated good predictive accuracy of the nomogram. In summary, the 6-mRNA-based classifier and 5-lncRNA-based classifier constructed in this study were independent prognostic factors for PTC.
Introduction
Thyroid carcinoma (THCA) is the most prevalent malignancy of the endocrine system. The incidence rate of THCA nearly tripled between 1975 and 2016 (Howlader et al., 2019). Papillary thyroid carcinoma (PTC), the most common and least deadly histologic type, accounts for up to 90% of the new cases (Howlader et al., 2019). Although the morbidity rate of PTC has risen, the mortality from the cancer has been relatively stable (Howlader et al., 2019). PTC tends to have a biologically indolent nature and can be effectively treated with surgical operation, hormone therapy, and radioiodine therapy. The 30-year cancer-specific death rate from PTC was less than 10% (Grogan et al., 2013). However, the 30-year recurrence rate was close to 30% (Dong et al., 2019).
Patients suffering PTC progression would live under enormous mental stress and financial burden, although most of the progressions were not lethal. Thus, more clinical attention should be paid to PTC progression. It is crucial to explore the molecular mechanisms underlying PTC progression. Several molecular changes have been identified in PTC. RET fusion proteins (the RET/PTC family) appeared to play an oncogenic role in approximately 20% of PTC (Prescott and Zeiger, 2015). Mutation in the BRAF gene resulting in the BRAF V60E protein was also considered prominent in PTC. Many studies focused on molecular markers in predicting outcome for patients with PTC and found some widely known molecular markers, such as BRAF, RAS, RET, and TERT. However, the majority of studies were retrospective and large prospective studies are needed (D’Cruz et al., 2018).
Long non-coding RNAs (lncRNAs), defined as RNA molecules with longer than 200 nucleotides and without translation function, have gained widespread attention in the last few years as a potentially new and essential layer of multiple biological processes. Competing endogenous RNA (ceRNA) network was proposed as a specific regulatory pathway of lncRNAs, by which lncRNAs could sponge microRNAs (miRNAs) through miRNA response elements and participate in the regulation of target RNA expression subsequently (Salmena et al., 2011; Thomson and Dinger, 2016). LncRNAs have been suggested as crucial factors in oncogenesis and tumor development (Tsai et al., 2011; Schmitt and Chang, 2016). Some researchers have revealed that several lncRNAs were associated with the initiation and progression of PTC (Ding et al., 2018; Xia et al., 2018; Zhuang et al., 2019). The ceRNA network has also been investigated in the study about the roles of lncRNAs in the diagnosis and overall survival of PTC (You et al., 2018; Zhao et al., 2018). However, the role of ceRNA network and the prognostic value of lncRNAs, miRNAs, and messenger RNAs (mRNAs) in PTC progression have not been fully explored yet.
In the present study, we performed a comprehensive analysis of PTC progression to identify prognostic lncRNAs, miRNAs, and mRNAs, construct a progression-free interval (PFI)-related ceRNA network, and further develop a nomogram to predict progression risk for PTC patients.
Materials and Methods
Data Source
The RNA sequencing data including lncRNAs, miRNAs, and mRNAs of PTC were downloaded from The Cancer Genome Atlas (TCGA) dataset1. There were 510 thyroid cancer tissues and 58 adjacent non-tumor tissues for lncRNAs and mRNAs and 514 thyroid cancer tissues and 59 adjacent non-tumor tissues for miRNAs. The corresponding clinical information was downloaded from the UCSC Xena website2 and TCGA Pan-Cancer Clinical Data Resource (Liu J. et al., 2018).
Data Processing
Gene expression quantification data were annotated by Ensembl GTF file in our study. We used edgeR package of R software to identify the differentially expressed lncRNAs (DElncRNAs), mRNAs (DEmRNAs) and miRNAs (DEmiRNAs) with |logFC| >1 and padj <0.05 between PTC and normal tissues. Only the RNAs with a cpm greater than 1 in 2 or more samples were kept in the differential analysis. Patients with complete information on PFI were randomly split into training and testing sets at a 1:1 ratio. In the training set, we first conducted a univariate Cox regression to assess the associations between PFI and the DElncRNAs, DEmiRNAs, and DEmRNAs. RNAs with a P < 0.05 in the univariate Cox regression analysis were retained for further analysis. Then, we utilized the least absolute shrinkage and selection operator (LASSO) method with 10-fold cross validation and Cox proportional hazards model with Akaike information criterion (AIC) selection criteria to build the RNA-based classifier. The prognostic accuracy of the classifiers in the training and testing sets was evaluated by the Kaplan–Meier curve, log-rank test, and receiver operating characteristic (ROC) curve analysis. Subsequently, univariate and multivariate Cox regression analysis were performed among the patients with complete RNA-based classifiers and clinical data to select independent prognostic factors. The final model selection was performed by a backward stepwise process with the AIC. A nomogram was further constructed with the final model to estimate the PFI for PTC patients. For nomogram validation, the discrimination was measured via concordance index (c-index) and the calibration was assessed by calibration plots.
Competing Endogenous RNA Network Construction
The ceRNA network was established based on lncRNA–miRNA–mRNA axes. We used miRcode3 database to predict the lncRNA–miRNA interactions. The miRNA–mRNA interactions were identified by the intersection of TargetScan4, miRTarBase5, and miRDB6 database. First, we constructed a global ceRNA network based on the DElncRNAs, DEmiRNAs, and DEmRNAs. Subsequently, we used the PFI-related lncRNAs and mRNAs that were identified by the univariate Cox regression to retrieve lncRNA–miRNA–mRNA axes from the global ceRNA network and form the PFI-related ceRNA network. Cytoscape version 3.7.2 was used to visualize the ceRNA network (Shannon et al., 2003).
Statistical Analysis
Kaplan–Meier method and log-rank test were used to assess differences between survival curves. LASSO selection method and Cox proportional hazards regression were fitted to the survival data. Chi-square test was used for association analyses. All the analyses were performed in R software (version 3.6.1) with the following packages: “edgeR,” “survival,” “glmnet,” “survminer,” “survivalROC,” and “rms.”
Results
Selection of RNAs Related to Progression-Free Interval of Papillary Thyroid Carcinoma and Progression-Free Interval-Related Competing Endogenous RNA Network Construction
Nine non-PTC tumor tissues were removed before differential expression analysis. With the cutoff values of |logFC| >1 and P <0.05, the edgeR package was utilized to assess the differential expression of RNAs. In total, 2,720 mRNAs (1,750 upregulated and 970 downregulated mRNAs) and 1,330 lncRNAs (848 upregulated and 482 downregulated lncRNAs) were identified between 501 PTC and 58 normal samples (Figures 1A,B), and 91 miRNAs (63 upregulated and 28 downregulated miRNAs) were identified between 505 PTC and 59 normal samples (Figure 1C). From the differently expressed RNAs, we further identified 123 PFI-related lncRNAs, 209 PFI-related mRNAs, and nine PFI-related miRNAs using the univariate Cox regression analysis.
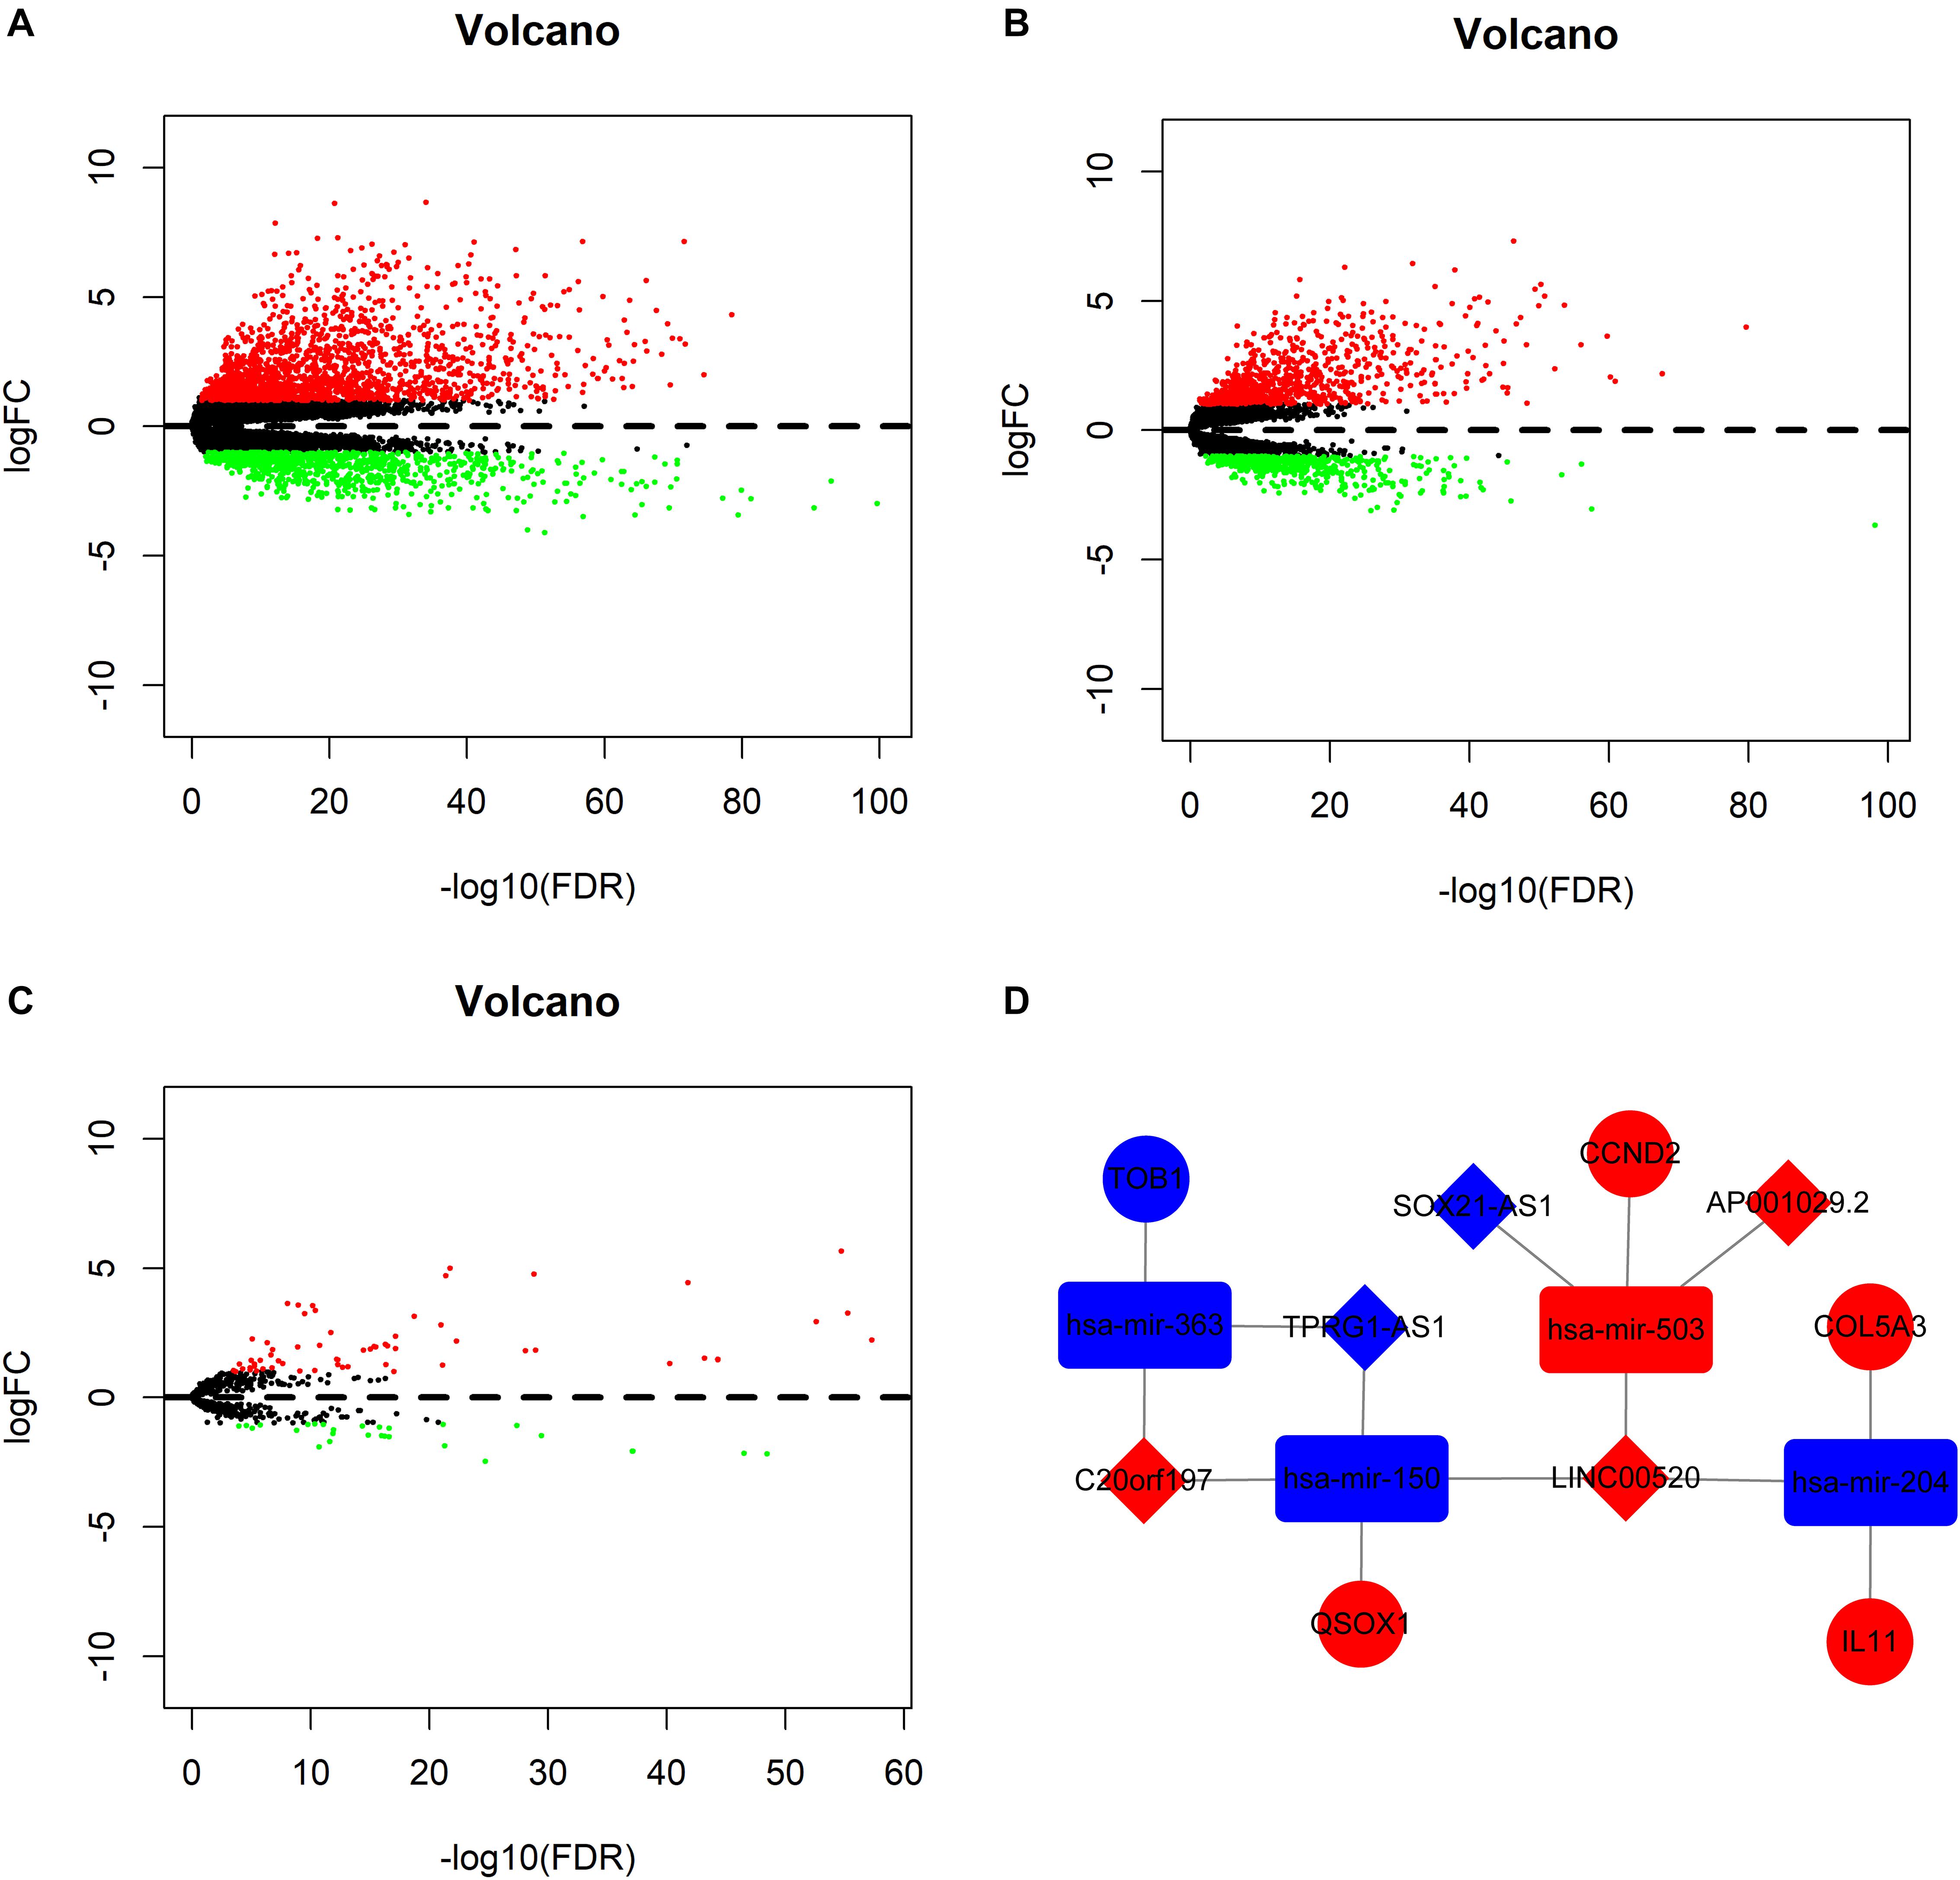
Figure 1. Volcano plot of differentially expressed messenger RNAs (mRNAs) (A), long non-coding RNAs (lncRNAs) (B), and microRNAs (miRNAs) (C). (D) Progression-free interval-related competing endogenous RNA network. The red indicates of the upregulated RNAs, and the blue indicates the downregulated RNAs. The diamond represents lncRNAs, the round rectangle represents miRNAs, and the ellipse represents mRNAs.
The global ceRNA network built based on DEmRNAs, DEmiRNAs, and DElncRNAs was comprised of 108 lncRNAs, 105 miRNAs, 78 mRNAs, and 460 edges (Supplementary Figure S1). A total of five lncRNAs, four miRNAs, five mRNAs, and 14 edges were retrieved from the global ceRNA network to form the PFI-related ceRNA network (Figure 1D).
Construction of RNA-Based Classifiers for Progression-Free Interval
Patients with complete information on PFI were randomly split into training and testing sets at a 1:1 ratio. The distribution of the clinical variables in the training and testing sets was shown in Supplementary Table S1. Based on the PFI-related RNAs identified in univariate Cox regression analysis, we constructed a 6-mRNA-based classifier (Figures 2A,B), a 5-lncRNA-based classifier (Figures 2C,D), and a 4-miRNA-based classifier (Figures 2E,F) for PFI of PTC patients by using the LASSO Cox regression method and AIC selection criteria in the training sets. Details of these lncRNAs, mRNAs, and miRNAs are presented in Table 1.
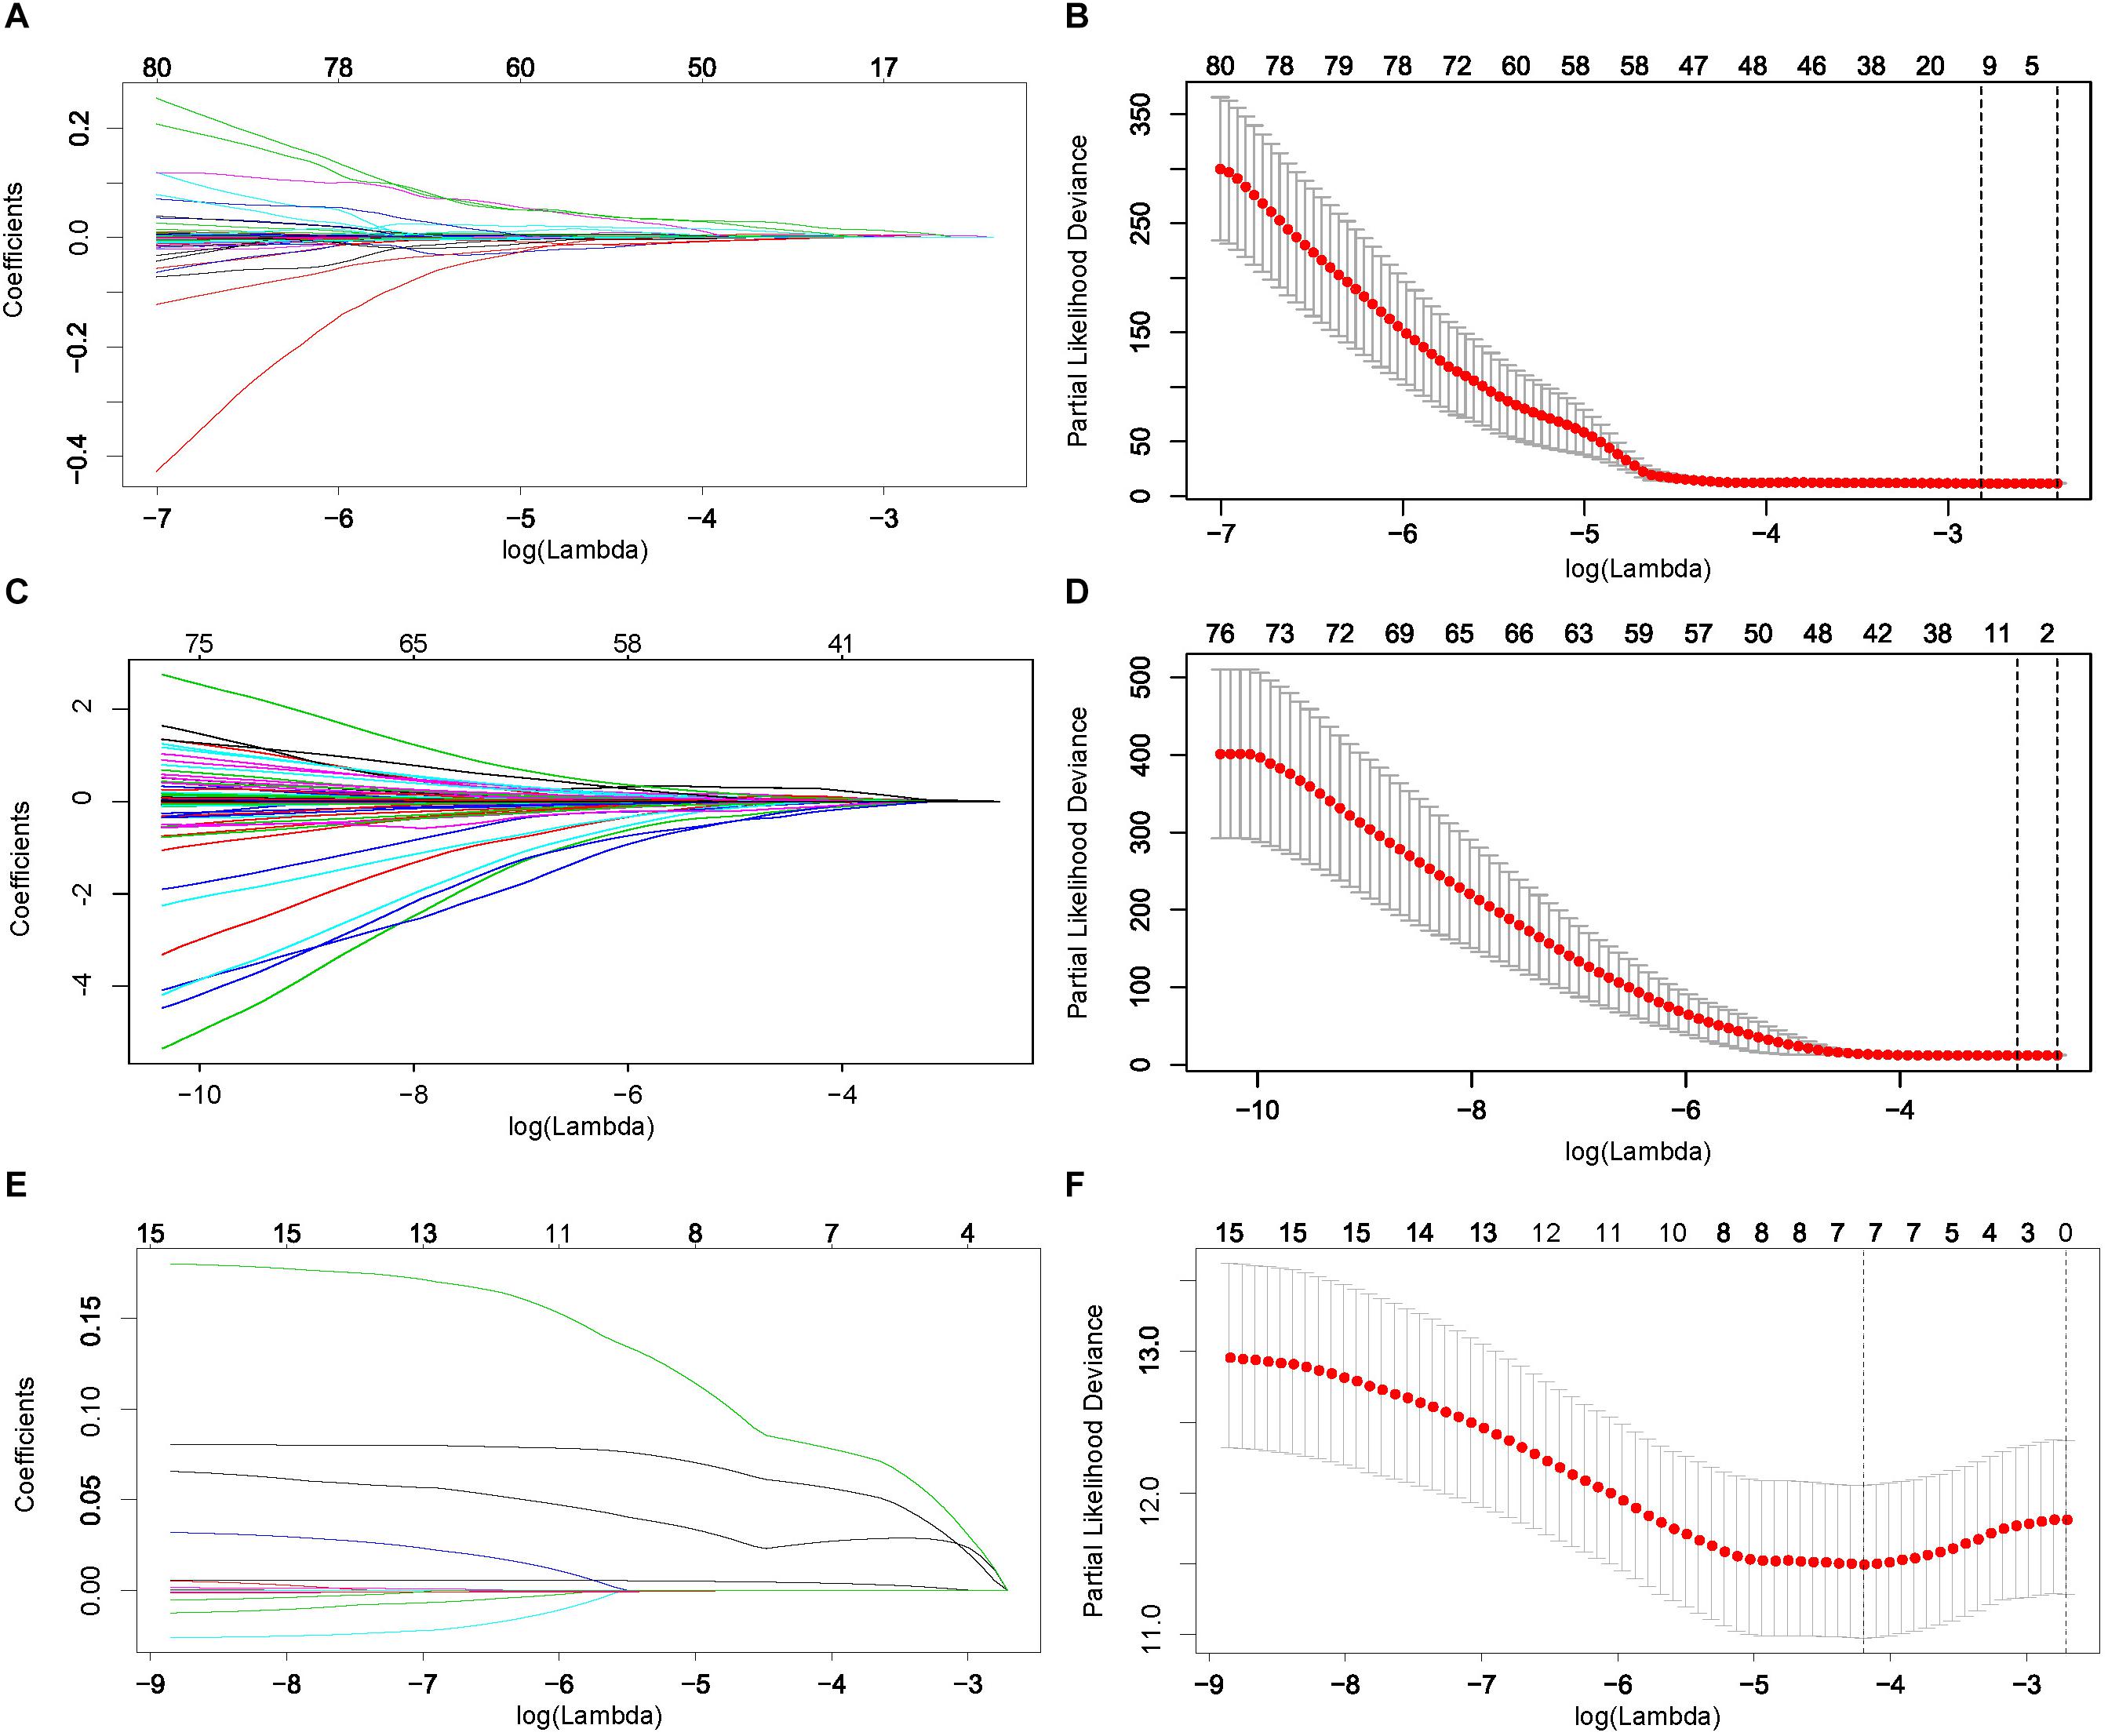
Figure 2. Least absolute shrinkage and selection operator (LASSO) coefficient profiles (A) and 10-fold cross validation for tuning parameter selection (B) for messenger RNAs (mRNAs). Similarly, (C,D) are for long non-coding RNAs (lncRNAs), and (E,F) are for microRNAs (miRNAs).
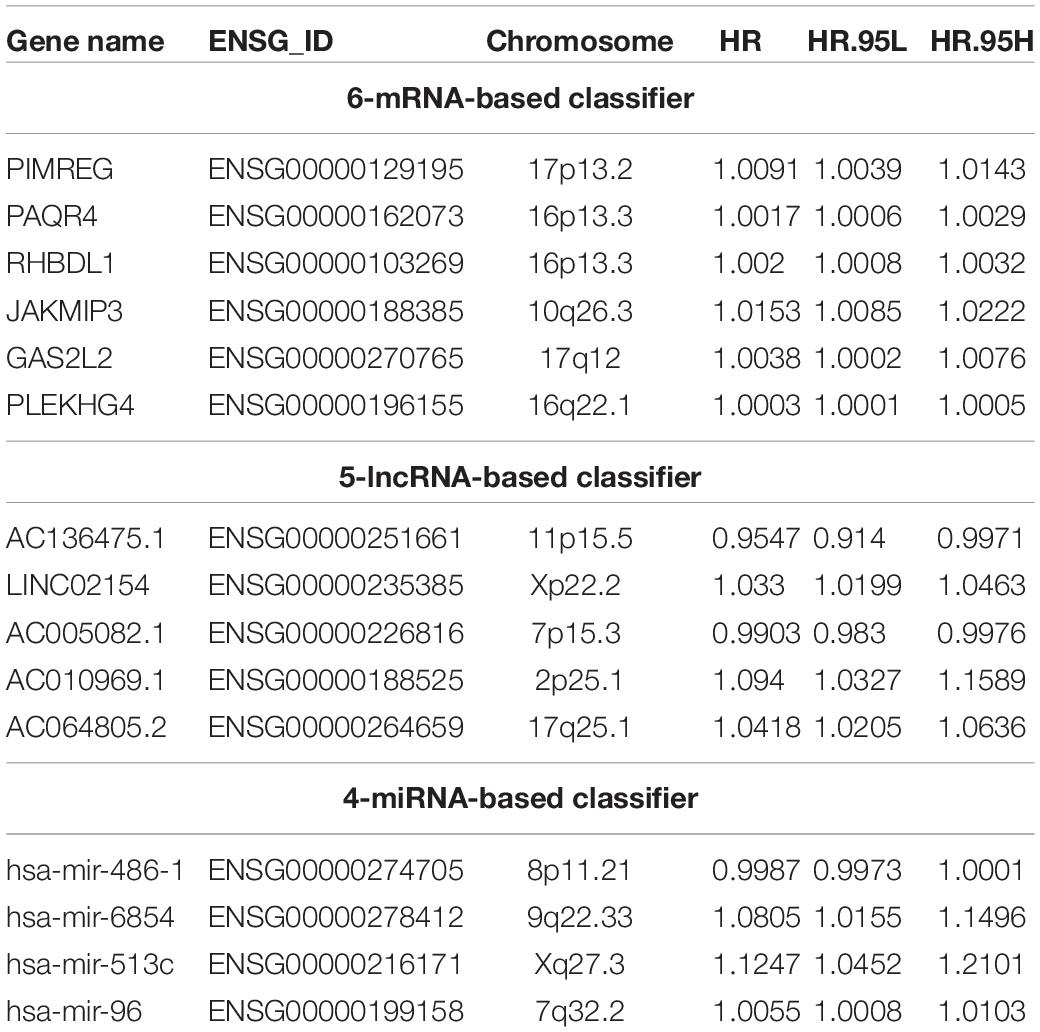
Table 1. The details of RNAs for constructing the prognostic signature.
According to the risk score calculated by the RNA-based classifiers for each patient, patients were divided into high- and low-risk groups using the cutoff of the median risk score (Supplementary Figure S2). The Kaplan–Meier curves and log-rank test showed that patients with high-risk scores had worse PFI than those with low-risk scores in both training cohorts (Figures 3A,C,E) and the testing cohorts (Figures 3B,D,F) for all three classifiers.
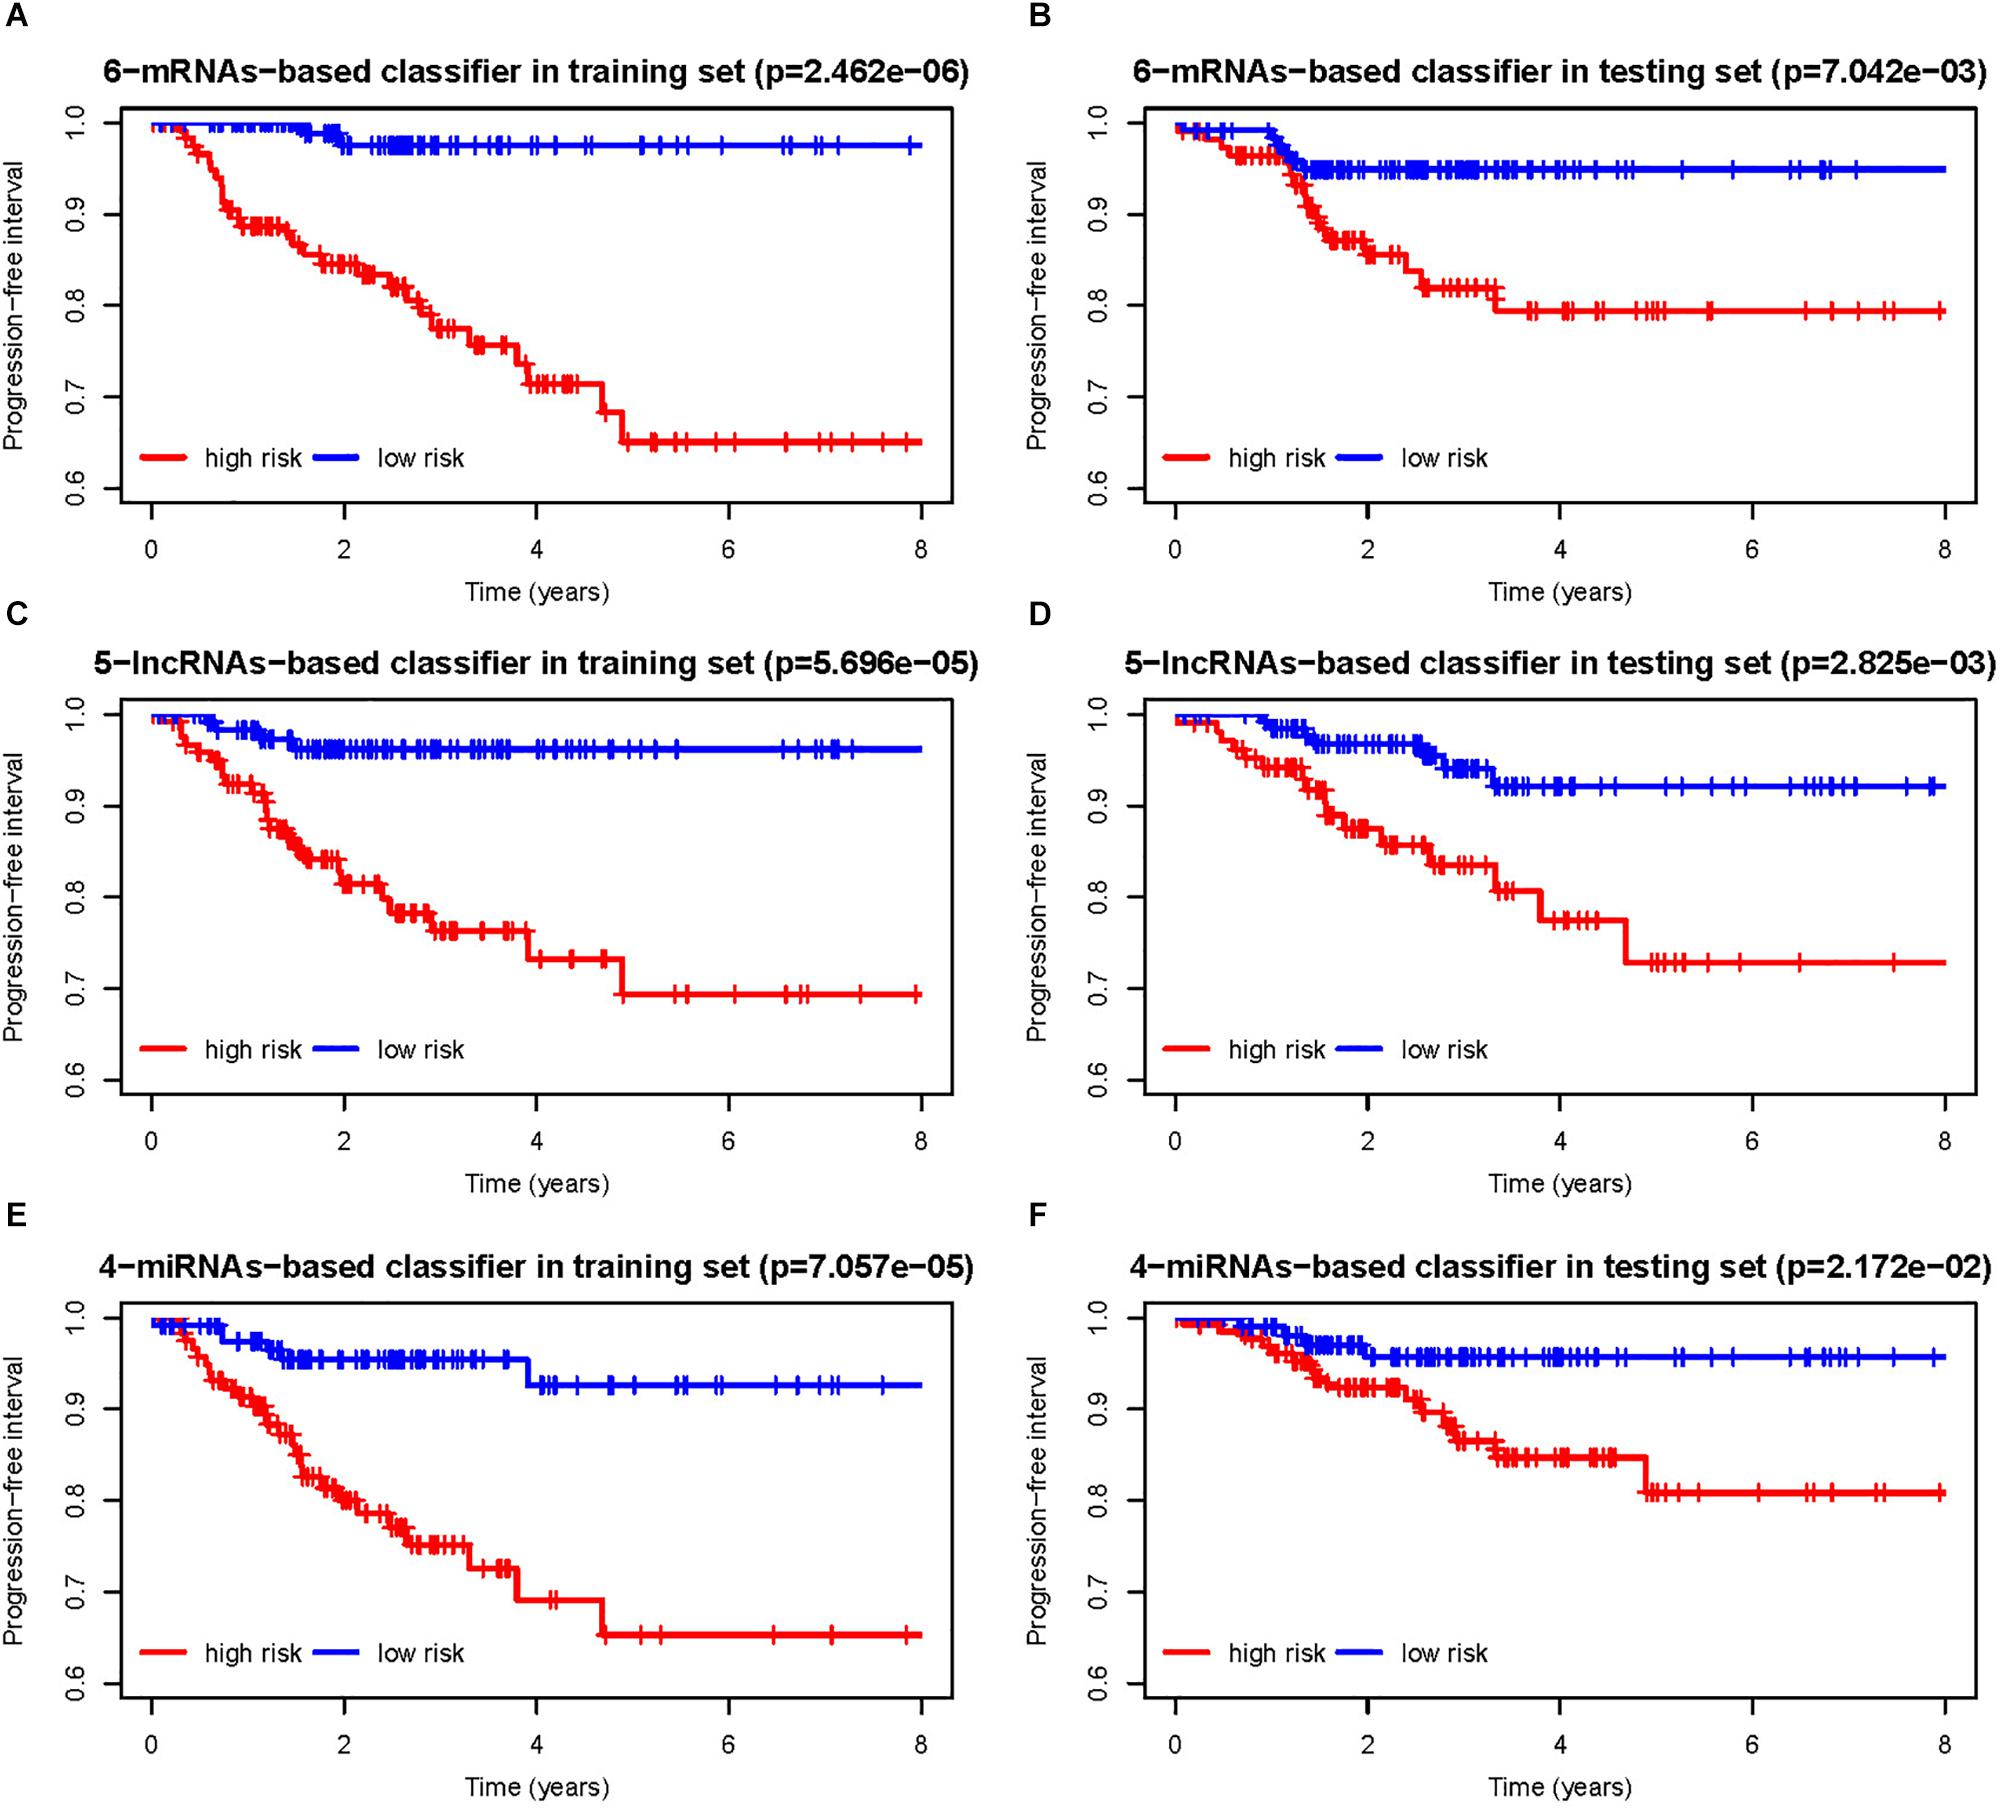
Figure 3. (A,B) Progression-free interval curves of papillary thyroid carcinoma (PTC) patients in the training and testing sets with a low or high risk of progression according to 6-messenger RNA (mRNA)-based classifier. Similarly, (C,D) are for 5-long non-coding RNA (lncRNA)-based classifier, and (E,F) are for 4-microRNA (miRNA)-based classifier.
As shown in Table 2, for all the three RNA-based classifiers, the pathologic stage showed significant differences between the low-risk and high-risk group in the whole cohort. Patients with a high pathologic T stage were inclined to have a high-risk score, although statistic differences were only marginal for the 5-lncRNA-based and 6-mRNA-based classifiers. Patients with a pathologic subtype of tall cell tended to have a high-risk score according to 6-mRNA-based classifier and 4-miRNAs-based classifier. Older (no less than 55 years) patients might have a high-risk score of 6-mRNA-based classifier. However, gender and pathologic N stage were not associated with risk score of all the three classifiers.
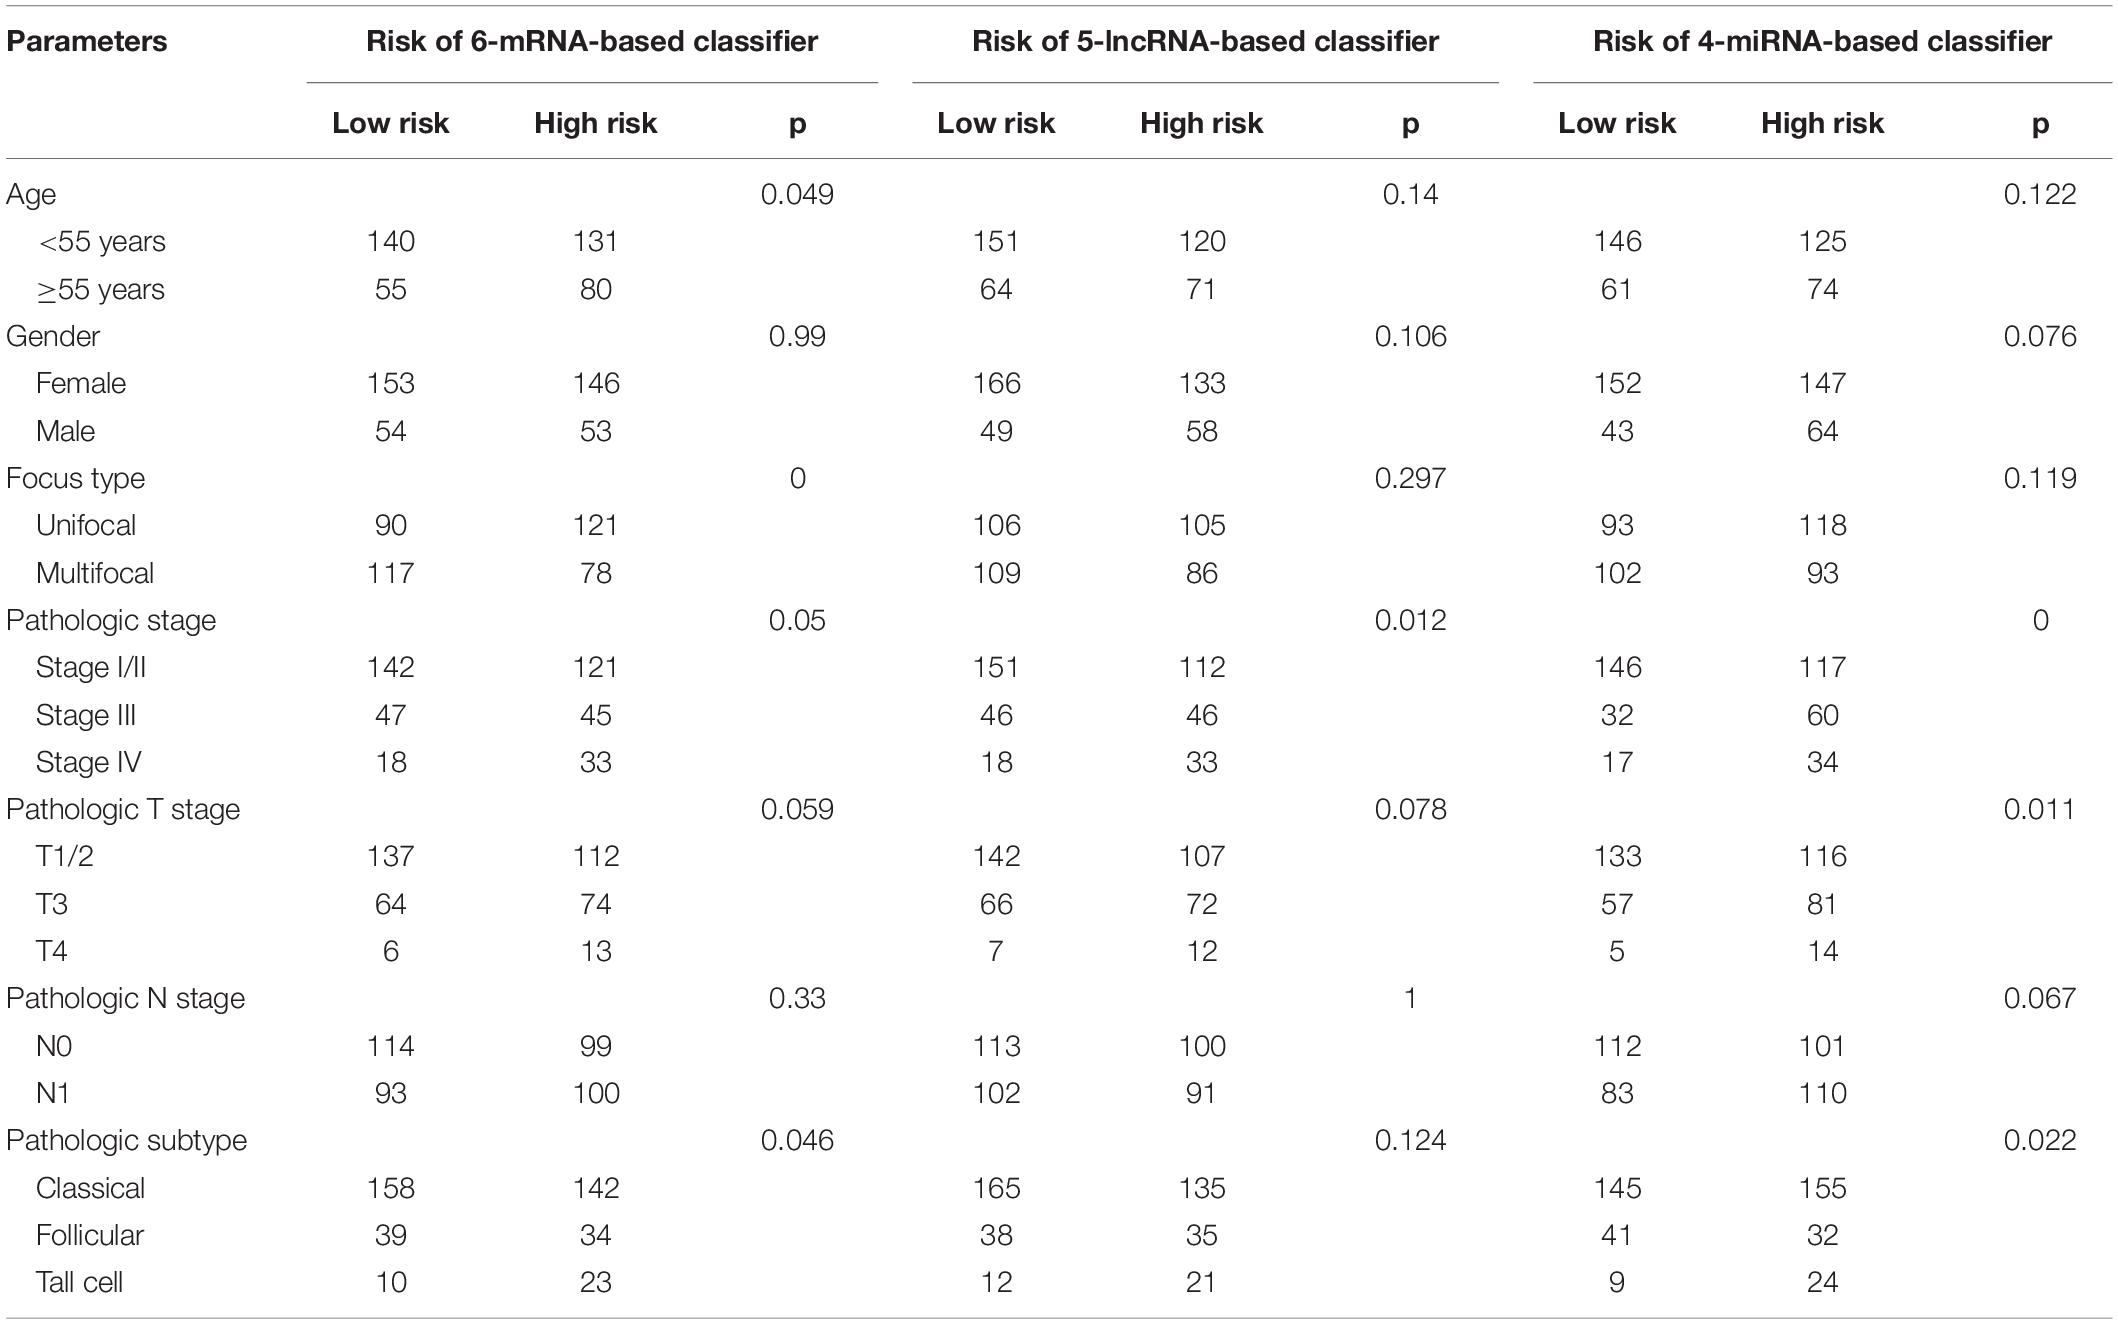
Table 2. Relationships between risk score of the RNA-based classifier and clinical parameters.
Prognostic Value of RNA Classifiers for Assessing Progression-Free Interval
The time-dependent ROC curve analysis revealed that all three classifiers showed a predictive capability. The areas under the curve (AUCs) of the first, third, and fifth years in the training and testing sets were 0.83, 0.82, and 0.82 and 0.67, 0.72, and 0.73, respectively, for the 6-mRNA-based classifier (Figures 4A,D); 0.75, 0.84, and 0.85 and 0.71, 0.67, and 0.71, respectively, for the 5-lncRNA-based classifier (Figures 4B,E); 0.70, 0.77, and 0.79 and 0.74, 0.67, and 0.66, respectively, for the 4-miRNA-based classifier (Figures 4C,F). The ROC curve analysis comparing pathologic TNM stage with the three RNA-based classifiers showed that each of the RNA-based classifiers had better predictive accuracy (Figures 4G–I).
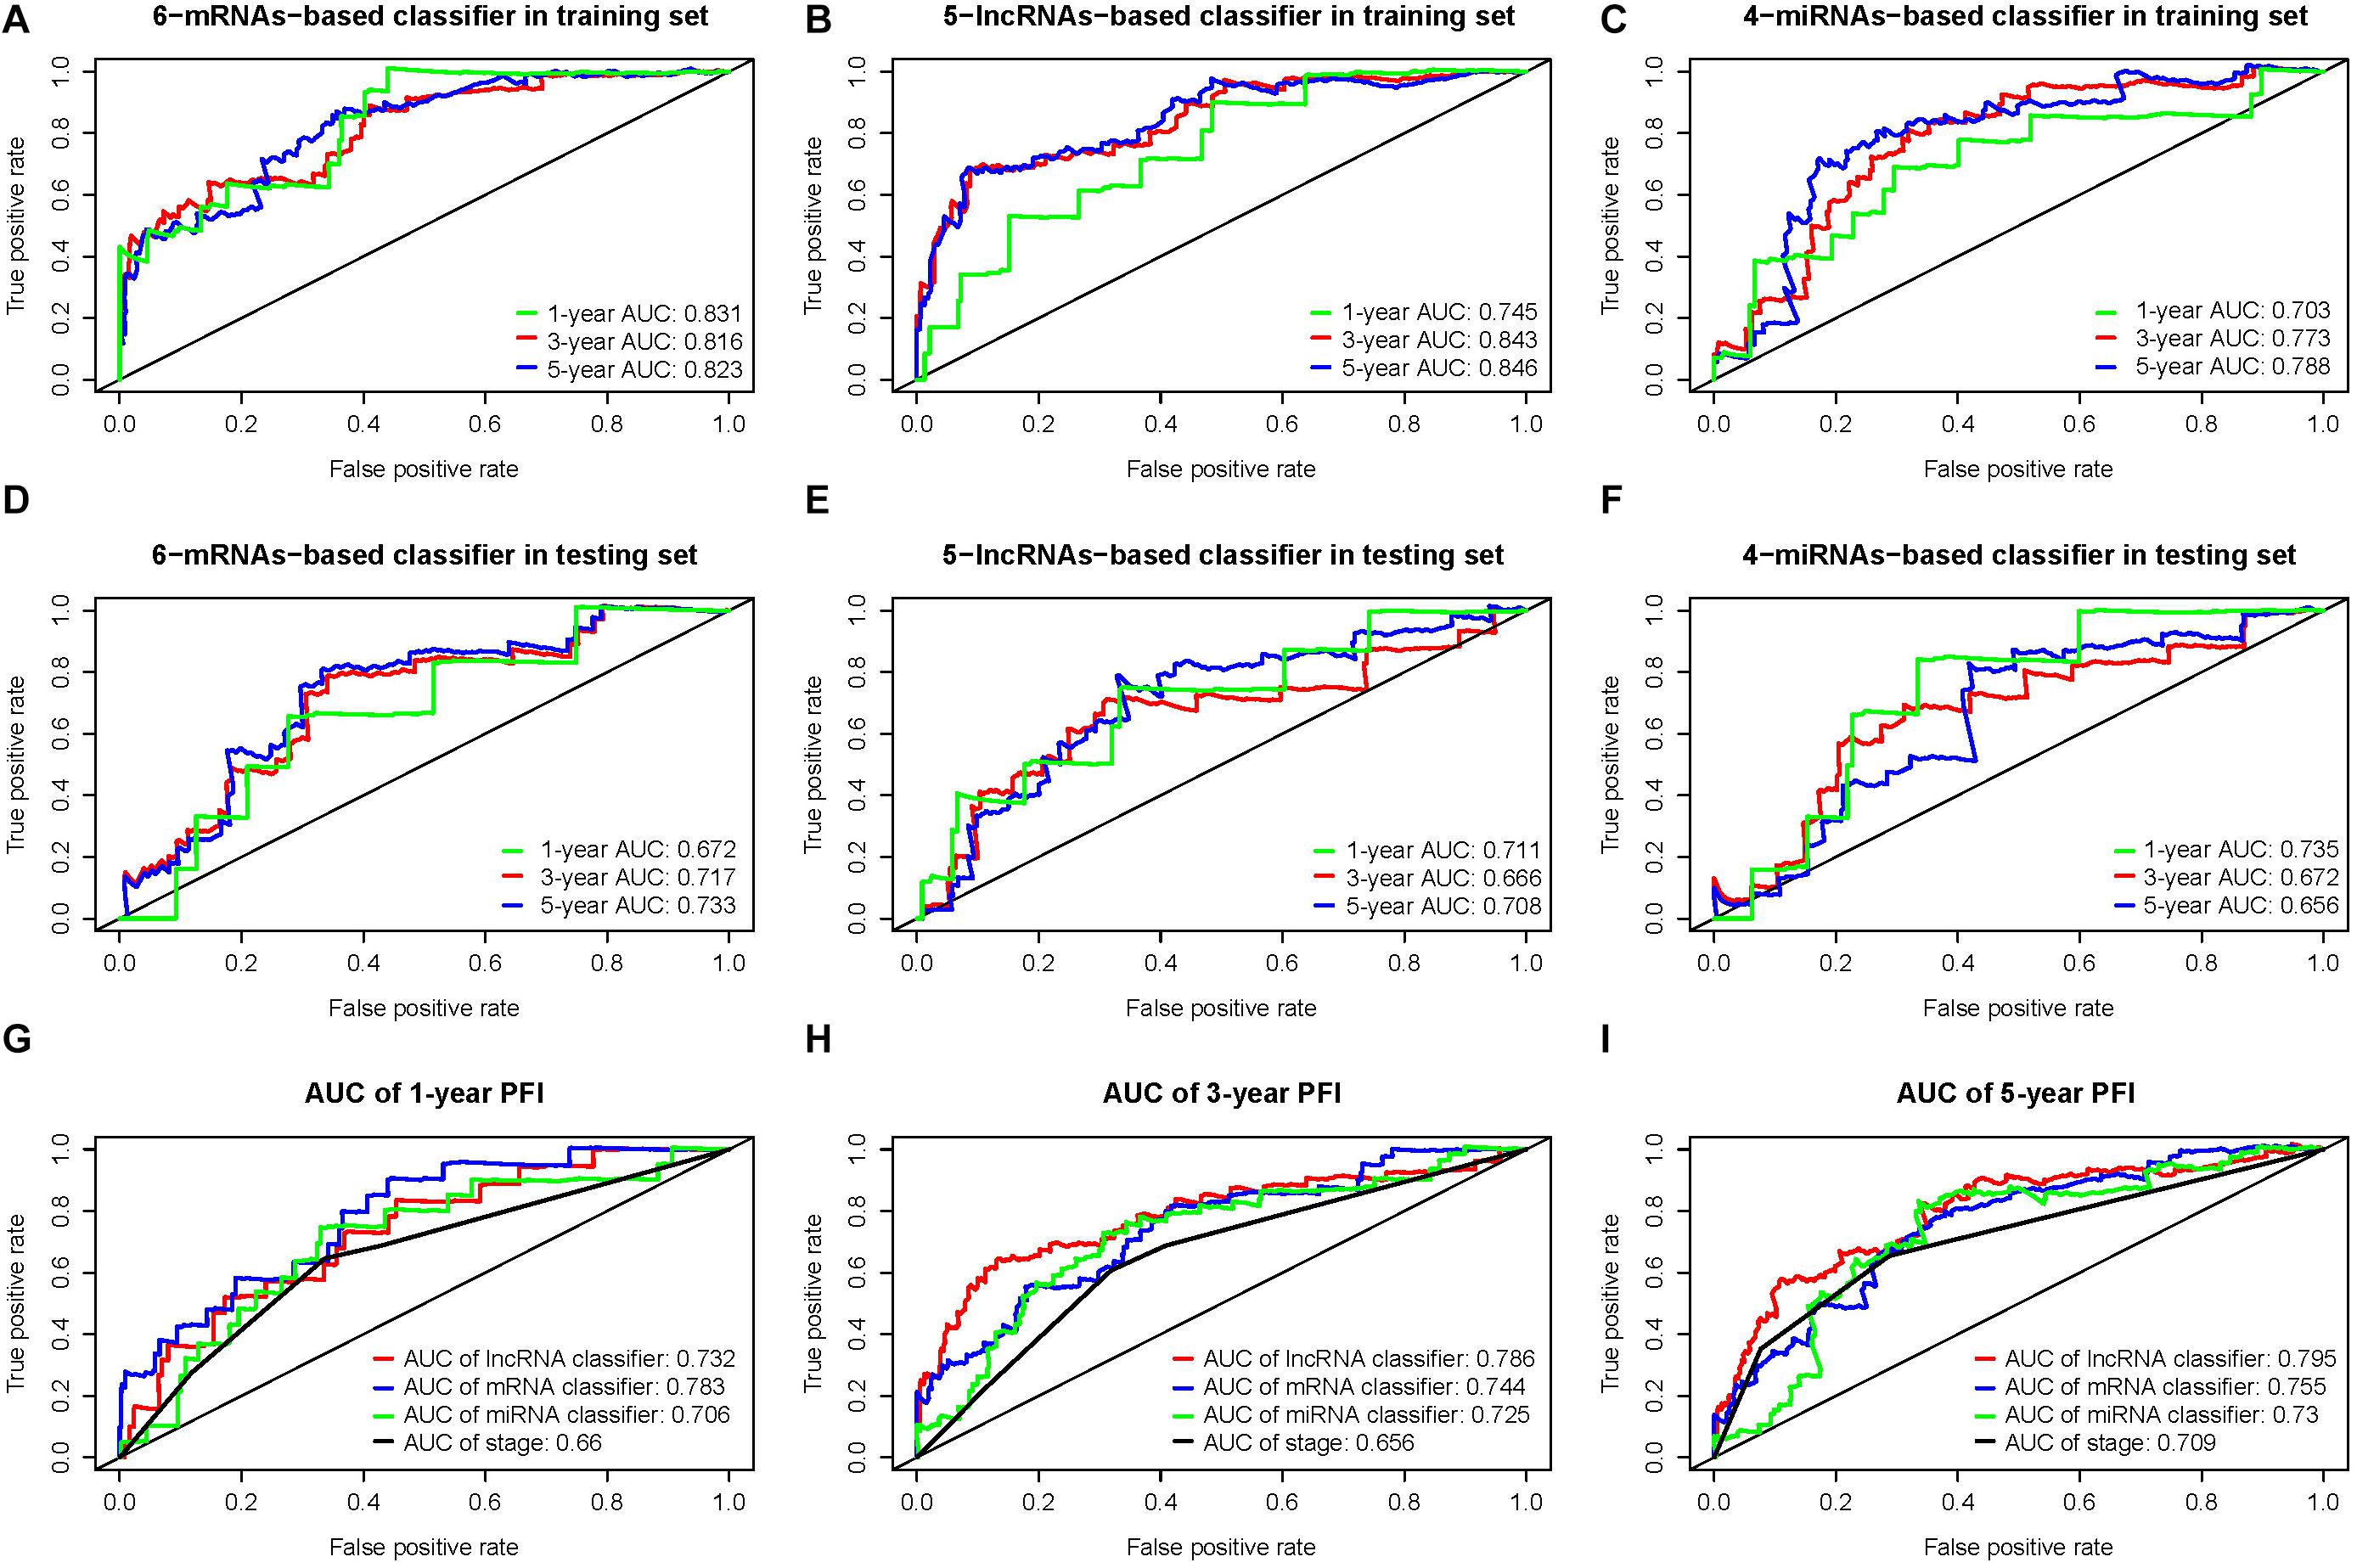
Figure 4. (A,D) Time-dependent receiver operating characteristic (ROC) curves at 1, 3, and 5 years for 6-messenger RNA (mRNA)-based classifier in the training and testing sets. Similarly, (B,E) are for 5-long non-coding RNA (lncRNA)-based classifier, and (C,F) are for 4-microRNA (miRNA)-based classifier. (G–I) The ROC for the three RNA classifiers and TNM stage system at 1, 3, and 5 years.
Complete clinical information and RNA-based classifier data were available for further analysis in 406 PTC patients. In the univariate Cox regression analysis, the 6-mRNA-based classifier, 5-lncRNA-based classifier, 4-miRNA-based classifier, age, pathologic stage, pathologic T stage, and pathologic subtype were significantly associated with PFI. However, only the 6-mRNA-based classifier, 5-lncRNA-based classifier, and pathologic T stage were retained to be independent prognostic factors for PFI after the multivariate Cox regression analysis with AIC selection criteria (Table 3).
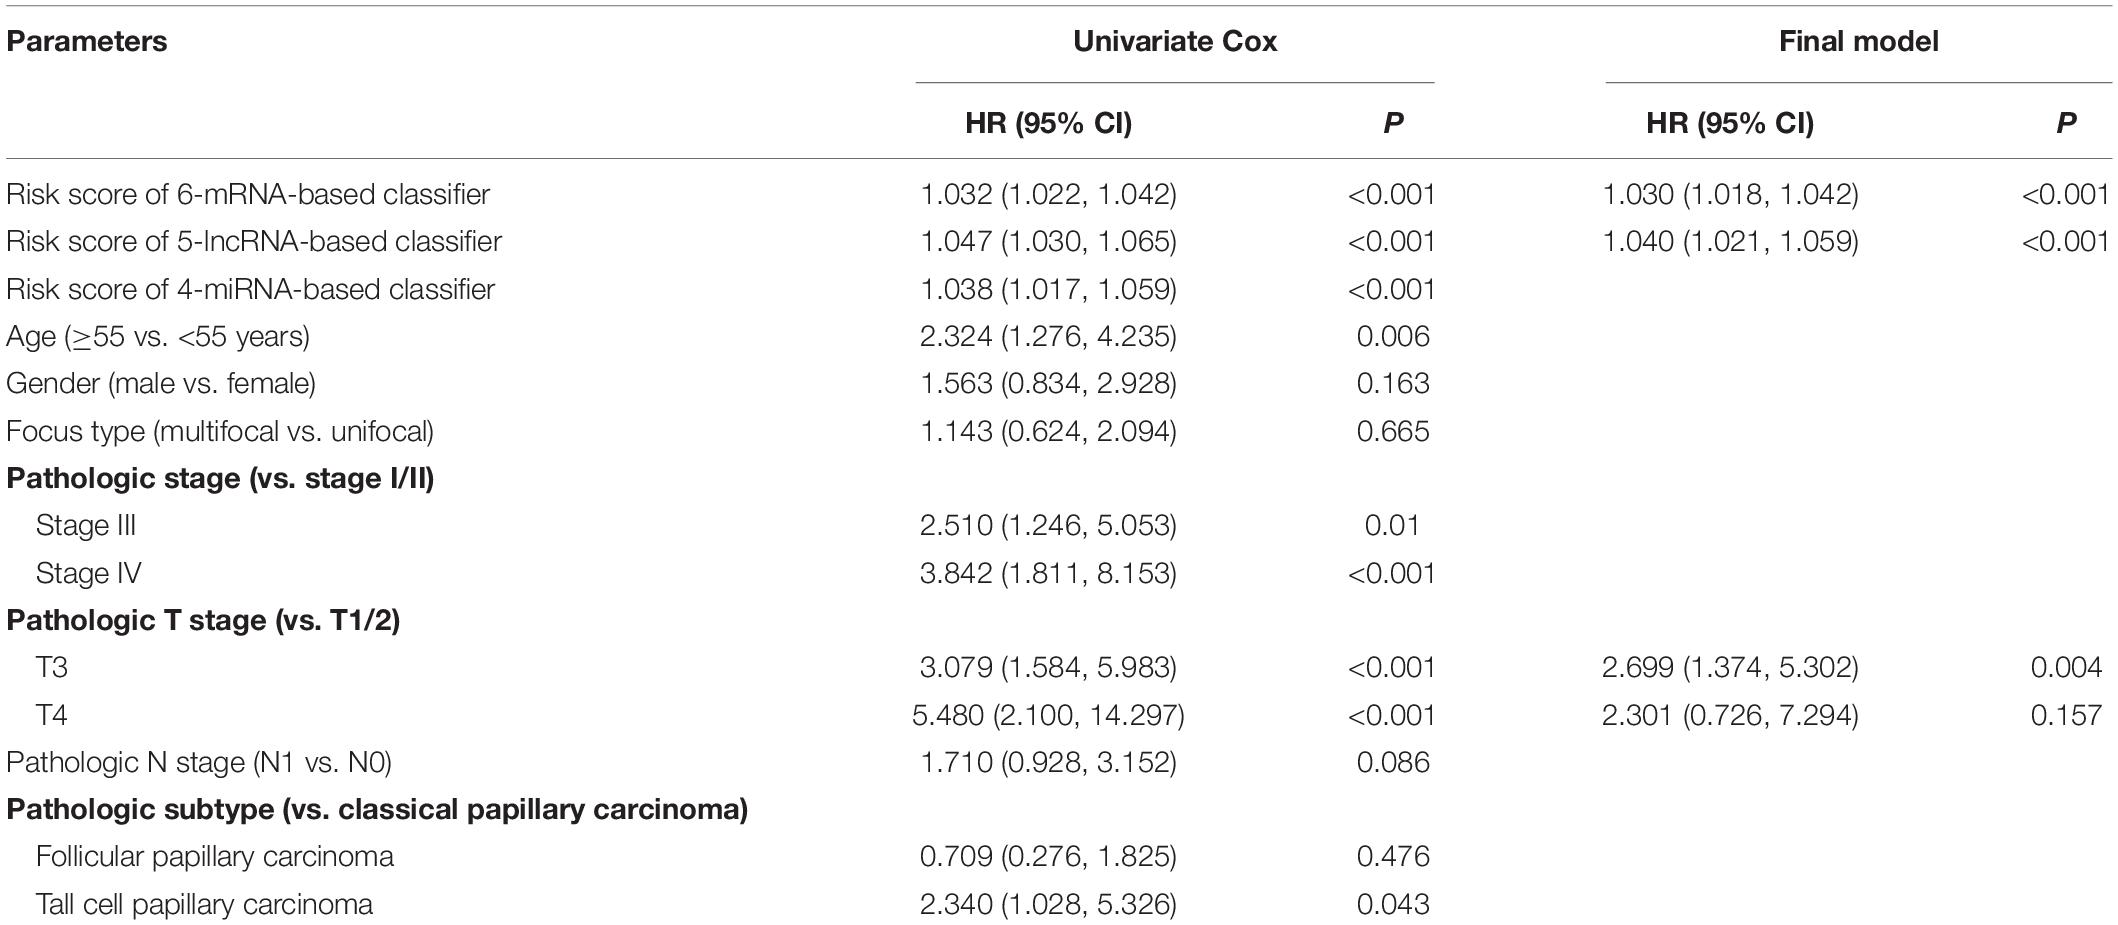
Table 3. Univariate and multivariate Cox regression analysis of the three RNA-based classifiers and clinical parameters with progression-free interval.
Nomogram Analysis
We constructed a nomogram for the prognostic prediction in patients with PTC based on the verified prognostic classifiers and clinical parameters (6-mRNA-based classifier, 5-lncRNA-based classifier, and pathologic T stage) in the multivariate Cox regression analysis. As shown in Figure 5D, the overall score could be calculated to estimate the PFI prognosis (1-, 3-, and 5-year PFI probabilities). The C-index of this nomogram model was 0.792 (95% CI: 0.716–0.867). The calibration curve demonstrated good discrimination of the nomogram model (Figures 5A–C). In general, this nomogram model could appropriately predict the PFI of PTC patients.
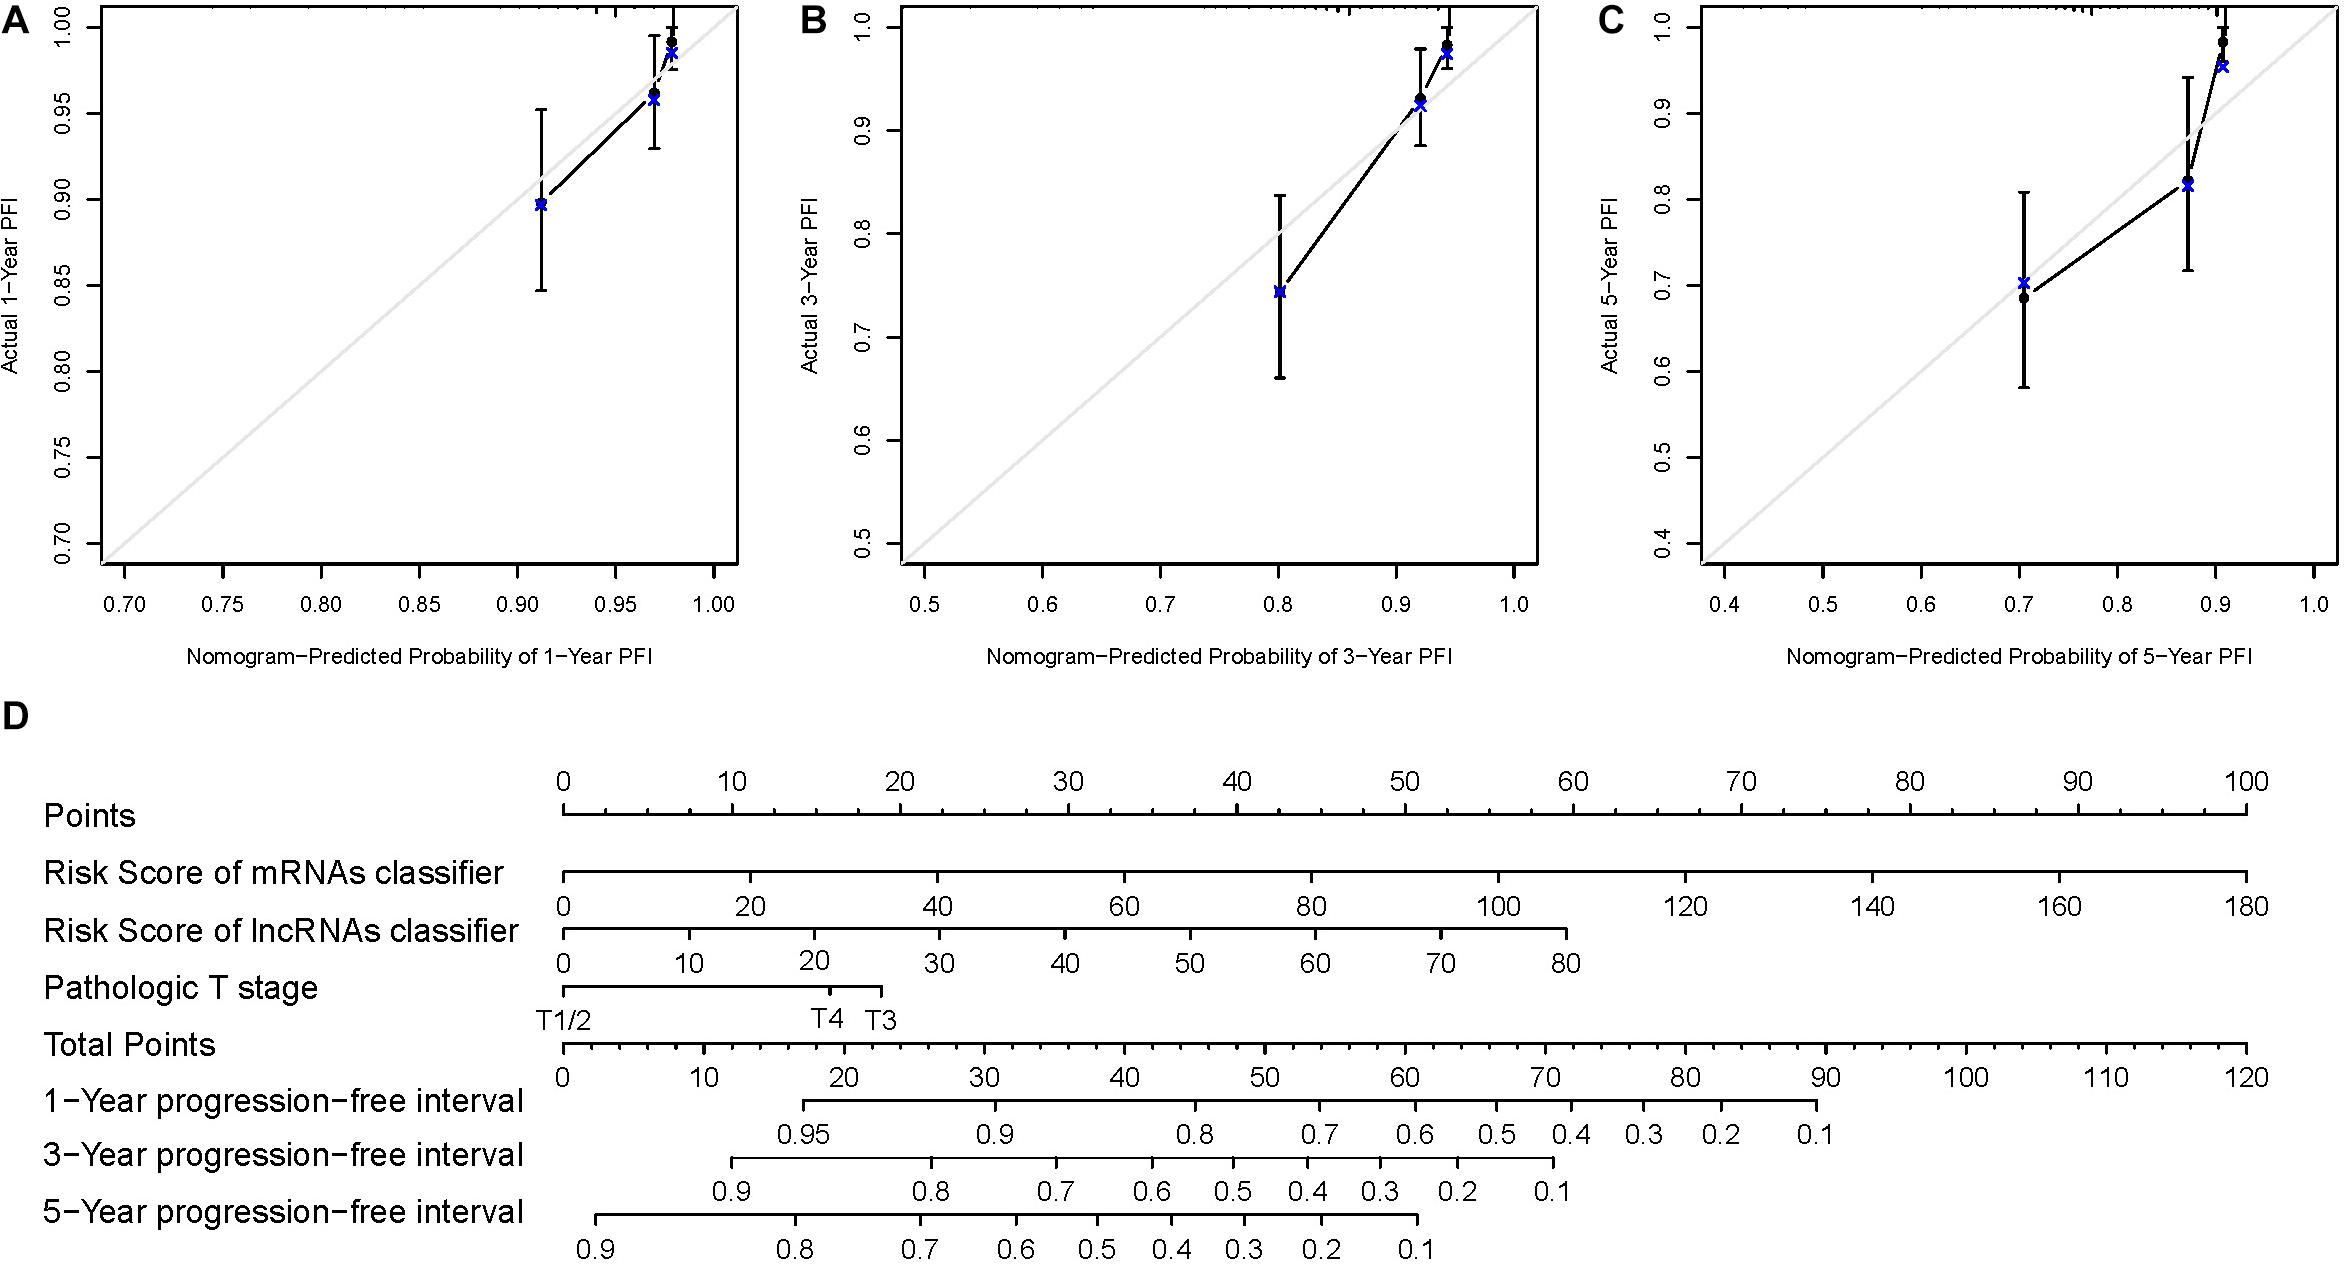
Figure 5. (D) The nomogram established with two RNA-based classifiers and pathologic T stage. (A–C) Calibration plots for the nomogram predicting 1-, 3-, and 5-year progression-free interval.
Discussion
PTC is generally considered as an indolent carcinoma, and patients with PTC are commonly expected to have a favorable prognosis for disease-specific survival. However, the progression is not rare despite effective initial treatment (Mazzaferri and Jhiang, 1994; Grogan et al., 2013). Many stage systems have been developed to predict the risk of mortality in THCA patients. TNM stage system has been validated in both retrospective studies and prospective practice (Haugen et al., 2015). Nevertheless, molecular biomarkers were not integrated into the current stage system, and the predictive value for the progression of the PTC was not determined.
Increasing evidence has proved that the dysregulated ceRNA network which mainly involved lncRNA, miRNA, and mRNA was essential in many physiologic and pathological conditions including cancer initiation, progression, and metastasis (Karreth and Pandolfi, 2013). The lncRNA–miRNA–mRNA interactions have already been reported in many carcinomas, such as gastric cancer (Song et al., 2017), breast cancer (Lu et al., 2018), and hepatocellular cancer (Wang et al., 2019). As for PTC, although the role of ceRNA network has been investigated by some researchers (Liu H. et al., 2018; Zhuang et al., 2019), there are still some essentials to be explored. Firstly, the prognostic classifier for the progression of PTC should be built. Secondly, the internal validation of the classifier is indispensable to prove the stability of the classifier. Thirdly, the predictive value of the classifier should be compared with the existing stage system. Finally, a comprehensive prognostic model integrating multiple types of RNAs and clinical parameters could provide more accurate predictions.
In this study, based on the TCGA–THCA cohort, we constructed a PFI-related ceRNA network, established and validated three prognostic RNA-based classifiers for PFI, and built a nomogram including both the RNA signatures and clinical parameters.
There were some studies involving the ceRNA network of PTC (You et al., 2018; Zhao et al., 2018; Xu et al., 2019). However, only the global ceRNA network based on the differentially expressed lncRNAs, mRNAs, and miRNAs was constructed in these studies. Except the global ceRNA network, we also constructed a PFI-related ceRNA network that comprised five lncRNAs, four miRNAs, five mRNAs, and 14 edges. These RNAs and interactions might be valuable for further research.
Few studies have focused on the association between RNA-based classifiers and PTC progression. Chen et al. (2019) reported a prognostic lncRNA signature (TTTY10) that was identified through logistic regression model and incorporated into a nomogram to predict tumor recurrence risk of PTC based on the TCGA database. However, the recurrence data were essentially time-to-event data, and the logistic regression was not suitable to include both the event and time aspects as the outcome in the model. Moreover, as a clinical endpoint of TCGA-THCA data, PFI was considered more reliable than any other type of endpoints, such as overall survival, disease-specific survival, and disease-free interval (Liu J. et al., 2018). Therefore, in our study, we utilized the LASSO Cox regression method to select the prognostic RNA-based classifiers for predicting the PFI of PTC patients. Finally, a 6-mRNA-based classifier, a 5-lncRNA-based classifier, and a 4-miRNA-based classifier for PFI were constructed and validated. The results indicated that these classifiers could reasonably divide PTC patients into high- or low-risk groups with significant differences in PFI in the training set. The repeatability and practicability of the classifiers for the prediction of PFI were also verified in the testing set, indicating the potential prognostic value of the classifiers. Furthermore, we compared the discrimination ability of the classifiers with the TNM stage system. The ROC curve analysis showed that all the three classifiers had an obviously better predictive accuracy than the TNM stage system.
A comprehensive prognostic model integrating RNA-based classifiers and clinical parameters for PFI of the PTC patients was constructed based on univariate and multivariate Cox regression analyses. Only the 6-mRNA-based classifier, 5-lncRNA-based classifier, and the pathologic T stage were retained in the model as independent prognostic factors. A nomogram based on the prognostic model was established for the PFI prediction in patients with PTC. The C-index and calibration plot indicated good predictive accuracy of the nomogram.
Although our study revealed that the three RNA-based classifiers were related to the PFI of PTC, most of the RNAs in our classifiers have not been fully explored. Some of the RNAs have been reported in the previous study. PICALM interacting mitotic regulator (PIMREG) could promote breast cancer aggressiveness via sustaining nuclear factor (NF)-κB activation (Jiang et al., 2019). Progestin and adipoQ receptor family member (PAQR) 4 has been found to compete with S-phase kinase-associated protein (SKP) 2 for binding to the same region in cyclin-dependent kinase (CDK) 4, thereby abrogating SKP2-mediated ubiquitination of CDK4 and contributing to tumorigenesis (Wang et al., 2017). Growth arrest specific 2 like 2 (GAS2L2), also known as G2L2, was reported to be involved in mediating the cross talk between filamentous actin and microtubules (Stroud et al., 2014). Zhang et al. (2019) showed that LINC02154 was a risk factor for the prognosis of patients with laryngeal cancer. A study revealed that hsa-mir-486-1 may serve as a potential diagnostic biomarker of lung adenocarcinoma (Ren et al., 2019). Hsa-mir-6854 was reported as a potential prognostic miRNA biomarker for colon adenocarcinoma (Wei et al., 2018).
The present study also has some limitations. The study is based on the TCGA database. Further prospective clinical trials are needed to validate the results. Obtaining comprehensive clinical annotation was not the primary objective of the TCGA, thus, some important clinical factors such as treatment data were limited. The classifiers built in our study were based on the ceRNA theory; however, the specific molecular mechanisms of the RNAs in our classifiers are still unclear. The need for further studies is indisputable.
Conclusion
In conclusion, a 6-mRNA-based classifier and a 5-lncRNA-based classifier were constructed and verified as novel and independent prognostic factors for PFI of PTC patients. The potential prognostic RNAs are worthy of further investigation prior to the utilization in the clinic.
Data Availability Statement
Publicly available datasets were analyzed in this study. The data that support the findings of this study are openly available in TCGA at http://www.tcga.org/.
Author Contributions
LiZ contributed to the conception and design. LuZ, SL, and CL contributed to the acquisition of the data. KW and JX contributed to the analysis and interpretation of the data, and manuscript writing and revising. All authors contributed to the article and approved the submitted version.
Conflict of Interest
The authors declare that the research was conducted in the absence of any commercial or financial relationships that could be construed as a potential conflict of interest.
Supplementary Material
The Supplementary Material for this article can be found online at: https://www.frontiersin.org/articles/10.3389/fgene.2020.00805/full#supplementary-material
FIGURE S1 | Globe competing endogenous RNA network. The red indicates the upregulated RNAs, and the blue indicates the downregulated RNAs. The diamond represents lncRNAs, the round rectangle represents miRNAs, and the ellipse represents mRNAs.
FIGURE S2 | (A–F) The risk score distribution in the training and testing sets. (G–L) The risk score distribution of progression status in the training and testing sets.
Footnotes
- ^ https://cancergenome.nih.gov/
- ^ https://xena.ucsc.edu/
- ^ http://www.mircode.org/
- ^ http://www.targetscan.org/
- ^ http://mirtarbase.mbc.nctu.edu.tw/php/index.php
- ^ http://www.mirdb.org/
References
Chen, F., Li, Z., Deng, C., and Yan, H. (2019). Integrated analysis identifying new lncRNA markers revealed in ceRNA network for tumor recurrence in papillary thyroid carcinoma and build of nomogram. J. Cell Biochem. 120, 19673–19683. doi: 10.1002/jcb.29273
D’Cruz, A. K., Vaish, R., Vaidya, A., Nixon, I. J., Williams, M. D., Vander Poorten, V., et al. (2018). Molecular markers in well-differentiated thyroid cancer. Eur. Arch. Laryngol. 275, 1375–1384. doi: 10.1007/s00405-018-4944-1
Ding, S., Qu, W., Jiao, Y., Zhang, J., Zhang, C., and Dang, S. (2018). LncRNA SNHG12 promotes the proliferation and metastasis of papillary thyroid carcinoma cells through regulating wnt/beta-catenin signaling pathway. Cancer Biomark 22, 217–226. doi: 10.3233/cbm-170777
Dong, W., Horiuchi, K., Tokumitsu, H., Sakamoto, A., Noguchi, E., Ueda, Y., et al. (2019). Time-varying pattern of mortality and recurrence from papillary thyroid cancer: lessons from a long-term follow-up. Thyroid 29, 802–808. doi: 10.1089/thy.2018.0128
Grogan, R. H., Kaplan, S. P., Cao, H., Weiss, R. E., Degroot, L. J., Simon, C. A., et al. (2013). A study of recurrence and death from papillary thyroid cancer with 27 years of median follow-up. Surgery 154, 1436–1447. doi: 10.1016/j.surg.2013.07.008
Haugen, B. R., Alexander, E. K., Bible, K. C., Doherty, G. M., Mandel, S. J., Nikiforov, Y. E., et al. (2015). American thyroid association management guidelines for adult patients with thyroid nodules and differentiated thyroid cancer the american thyroid association guidelines task force on thyroid nodules and differentiated thyroid cancer. Thyroid 26, 1–133. doi: 10.1089/thy.2015.0020
Howlader, N., Noone, A. M., Krapcho, M., Miller, D., Brest, A., and Yu, M., et al. (eds) (2019). SEER Cancer Statistics Review. Bethesda, MD: National Cancer Institute.
Jiang, L., Ren, L., Zhang, X., Chen, H., Chen, X., Lin, C., et al. (2019). Overexpression of PIMREG promotes breast cancer aggressiveness via constitutive activation of NF-kappaB signaling. EBioMedicine 43, 188–200. doi: 10.1016/j.ebiom.2019.04.001
Karreth, F. A., and Pandolfi, P. P. (2013). ceRNA cross-talk in cancer: when ce-bling rivalries go awry. Cancer Discov. 3, 1113–1121. doi: 10.1158/2159-8290.Cd-13-0202
Liu, H., Deng, H. Y., Zhao, Y. J., Li, C., and Liang, Y. (2018). LncRNA XIST/miR-34a axis modulates the cell proliferation and tumor growth of thyroid cancer through MET-PI3K-AKT signaling. J. Exp. Clin. Cancer Res. 37:279. doi: 10.1186/s13046-018-0950-9
Liu, J., Lichtenberg, T., Hoadley, K. A., Poisson, L. M., Lazar, A. J., Cherniack, A. D., et al. (2018). An Integrated TCGA pan-cancer clinical data resource to drive high-quality survival outcome analytics. Cell 173, 400.e11–416.e11. doi: 10.1016/j.cell.2018.02.052
Lu, G., Li, Y., Ma, Y., Lu, J., Chen, Y., Jiang, Q., et al. (2018). Long noncoding RNA LINC00511 contributes to breast cancer tumourigenesis and stemness by inducing the miR-185-3p/E2F1/Nanog axis. J. Exp. Clin. Cancer Res. 37:289. doi: 10.1186/s13046-018-0945-6
Mazzaferri, E. L., and Jhiang, S. M. (1994). Long-term impact of initial surgical and medical therapy on papillary and follicular thyroid cancer. Am. J. Med. 97, 418–428. doi: 10.1016/0002-9343(94)90321-2
Prescott, J. D., and Zeiger, M. A. (2015). The RET oncogene in papillary thyroid carcinoma. Cancer 121, 2137–2146. doi: 10.1002/cncr.29044
Ren, Z. P., Hou, X. B., Tian, X. D., Guo, J. T., Zhang, L. B., Xue, Z. Q., et al. (2019). Identification of nine microRNAs as potential biomarkers for lung adenocarcinoma. FEBS Open Bio 9, 315–327. doi: 10.1002/2211-5463.12572
Salmena, L., Poliseno, L., Tay, Y., Kats, L., and Pandolfi, P. P. (2011). A ceRNA hypothesis: the rosetta stone of a hidden RNA language? Cell 146, 353–358. doi: 10.1016/j.cell.2011.07.014
Schmitt, A. M., and Chang, H. Y. (2016). Long noncoding RNAs in cancer pathways. Cancer Cell 29, 452–463. doi: 10.1016/j.ccell.2016.03.010
Shannon, P., Markiel, A., Ozier, O., Baliga, N. S., Wang, J. T., Ramage, D., et al. (2003). Cytoscape: a software environment for integrated models of biomolecular interaction networks. Genome Res. 13, 2498–2504. doi: 10.1101/gr.1239303
Song, Y. X., Sun, J. X., Zhao, J. H., Yang, Y. C., Shi, J. X., Wu, Z. H., et al. (2017). Non-coding RNAs participate in the regulatory network of CLDN4 via ceRNA mediated miRNA evasion. Na. Commun. 8:289. doi: 10.1038/s41467-017-00304-1
Stroud, M. J., Nazgiewicz, A., McKenzie, E. A., Wang, Y. S., Kammerer, R. A., and Ballestrem, C. (2014). GAS2-like proteins mediate communication between microtubules and actin through interactions with end-binding proteins. J. Cell Sci. 127, 2672–2682. doi: 10.1242/jcs.140558
Thomson, D. W., and Dinger, M. E. (2016). Endogenous microRNA sponges: evidence and controversy. Nat. Rev. Genet. 17, 272–283. doi: 10.1038/nrg.2016.20
Tsai, M. C., Spitale, R. C., and Chang, H. Y. (2011). Long intergenic noncoding RNAs: new links in cancer progression. Cancer Res. 71, 3–7. doi: 10.1158/0008-5472.CAN-10-2483
Wang, L., Zhang, R., You, X., Zhang, H., Wei, S., Cheng, T., et al. (2017). The steady-state level of CDK4 protein is regulated by antagonistic actions between PAQR4 and SKP2 and involved in tumorigenesis. J. Mol. Cell Biol. 9, 409–421. doi: 10.1093/jmcb/mjx028
Wang, Y., Yang, L., Chen, T., Liu, X., Guo, Y., Zhu, Q., et al. (2019). A novel lncRNA MCM3AP-AS1 promotes the growth of hepatocellular carcinoma by targeting miR-194-5p/FOXA1 axis. Mol. Cancer 18:28. doi: 10.1186/s12943-019-0957-7
Wei, H. T., Guo, E. N., Liao, X. W., Chen, L. S., Wang, J. L., Ni, M., et al. (2018). Genome-scale analysis to identify potential prognostic microRNA biomarkers for predicting overall survival in patients with colon adenocarcinoma. Oncol. Rep. 40, 1947–1958. doi: 10.3892/or.2018.6607
Xia, E., Bhandari, A., Shen, Y., Zhou, X., Sindan, N., Xiang, J., et al. (2018). LncRNA CCND2-AS1 promotes proliferation, migration, and invasion in papillary thyroid carcinoma. Biochem. Biophys. Res. Commun. 496, 628–632. doi: 10.1016/j.bbrc.2018.01.102
Xu, Y., Chen, J., Yang, Z., and Xu, L. (2019). Identification of RNA expression profiles in thyroid cancer to construct a competing endogenous RNA (ceRNA) network of mRNAs, long noncoding RNAs (lncRNAs), and microRNAs (miRNAs). Med. Sci. Monit. 25, 1140–1154. doi: 10.12659/msm.912450
You, X., Zhao, Y., Sui, J., Shi, X., Sun, Y., Xu, J., et al. (2018). Integrated analysis of long noncoding RNA interactions reveals the potential role in progression of human papillary thyroid cancer. Cancer Med. 7, 5394–5410. doi: 10.1002/cam4.1721
Zhang, G. H., Fan, E. X., Zhong, Q. Y., Feng, G. Y., Shuai, Y., Wu, M. N., et al. (2019). Identification and potential mechanisms of a 4-lncRNA signature that predicts prognosis in patients with laryngeal cancer. Hum. Genomics 13:36. doi: 10.1186/s40246-019-0230-6
Zhao, Y., Wang, H., Wu, C., Yan, M., Wu, H., Wang, J., et al. (2018). Construction and investigation of lncRNA-associated ceRNA regulatory network in papillary thyroid cancer. Oncol. Rep. 39, 1197–1206. doi: 10.3892/or.2018.6207
Keywords: papillary thyroid carcinoma, long non-coding RNA, microRNA, messenger RNA, nomogram, prognosis
Citation: Wang K, Xu J, Zhao L, Liu S, Liu C and Zhang L (2020) Prognostic lncRNA, miRNA, and mRNA Signatures in Papillary Thyroid Carcinoma. Front. Genet. 11:805. doi: 10.3389/fgene.2020.00805
Received: 31 March 2020; Accepted: 06 July 2020;
Published: 04 August 2020.
Edited by:
Yadong Zheng, Lanzhou Institute of Veterinary Research (CAAS), ChinaCopyright © 2020 Wang, Xu, Zhao, Liu, Liu and Zhang. This is an open-access article distributed under the terms of the Creative Commons Attribution License (CC BY). The use, distribution or reproduction in other forums is permitted, provided the original author(s) and the copyright owner(s) are credited and that the original publication in this journal is cited, in accordance with accepted academic practice. No use, distribution or reproduction is permitted which does not comply with these terms.
*Correspondence: Lin Zhang, emhhbmdsaW5hckAxNjMuY29t
†These authors have contributed equally to this work