 Yang Li
 Jin-Shen Wang
 Tao Zhang
 Hong-Chang Wang
 Le-Ping Li
- 1Department of Gastrointestinal Surgery, Shandong Provincial Hospital, Cheeloo College of Medicine, Shandong University, Jinan, China
- 2Department of Biostatistics, School of Public Health, Shandong University, Jinan, China
We aimed to identify new targets affecting gastric cancer (GC) prognosis. Six target genes were identified from hub genes based on their relationship with important factors affecting tumor progression, like immune infiltration, purity, tumor mutation burden (TMB), and tumor microenvironment (TME) score. The effect of target genes’ somatic mutations and copy number alteration (CNA) was examined to determine their effect on GC prognosis. Six target genes (FBN1, FN1, HGF, MMP9, THBS1, and VCAN) were identified. Reduced expression of each target gene, except MMP9, indicated better prognosis and lower grade in GC. FBN1, THBS1, and VCAN showed lower expression in stage I GC. Non-silencing mutations of the six genes played a role in significantly higher TMB and TME scores. THBS1 mutation was associated with earlier stage GC, and VCAN mutation was associated with lower grade GC. However, patients with target gene CNA displayed higher tumor purity. MMP9, THBS1, and VCAN CNA was associated with lower grade GC, while FBN1 CNA reflected earlier T stage. Additionally, the target genes may affect GC prognosis by influencing multiple oncogenic signaling pathways. FBN1, FN1, HGF, MMP9, THBS1, and VCAN may be new GC prognostic targets by affecting tumor purity, TMB, TME score, and multiple oncogenic signaling pathways.
Introduction
Gastric cancer (GC) is a disease with a high incidence and high mortality around the world (Kamangar et al., 2006). With the development of medical technology, treatment of GC with surgery combined with chemoradiotherapy is gradually becoming more effective, but the 5-year survival rate remains subpar (Ferlay et al., 2015; Li Y. et al., 2019). In particular, post-operative chemotherapy has a major impact on the prognosis and survival of GC patients (Kunkler, 1994; van de Velde, 2008; Bernini and Bencini, 2012). In recent years, a variety of regimens have been studied to identify an improved therapeutic approach. However, treatment can vary greatly in patients with the same pathological type and stage, or even in those with similar expression of hub genes (Yan et al., 2018; Huang et al., 2019). Therefore, it is important to identify new targets influencing the prognosis of GC.
Immune infiltration, tumor purity, tumor mutation burden (TMB), and tumor microenvironment (TME) score have been investigated as important factors affecting tumor prognosis and chemoradiotherapy (Yoshihara et al., 2013; Aran et al., 2015; Hellmann et al., 2018; Lazar et al., 2018; Zeng et al., 2018; Pan et al., 2019). Higher TMB, TME score, and tumor purity indicate a better prognosis. Somatic mutations and copy number alterations (CNAs) of genes are also key factors affecting tumor development through complex mechanisms (Cutcutache et al., 2016; Liang et al., 2016; Li et al., 2018; Li X. et al., 2019). Large-scale studies have aimed to explore the molecular changes in GC that may reveal new and important targets in its therapy.
In our study, we analyzed the Cancer Cell Line Encyclopedia (CCLE), The Cancer Genome Atlas (TCGA), and the Genomics of Drug Sensitivity in Cancer (GDSC) database, to select six genes (FBN1, FN1, HGF, MMP9, THBS1, and VCAN) as target genes. Based on their expression, mutation, and CNA, along with analysis of their relationship with clinical information, TMB, TME score, tumor purity, immune infiltration, and classic oncogenic signaling pathways, we thought that these genes could serve as new therapeutic and prognostic targets (Figure 1).

Figure 1. The analysis chart of our study.
Materials and Methods
Data Collection and Hub Gene Selection
RNA-seq data from gastric cells was downloaded from the CCLE database1. 5-FU and oxaliplatin drug sensitivity for different gastric cancer cell lines were obtained from the GDSC database2. Primary somatic mutation, RNA-seq, and clinical data from TCGA Stomach Cancer (STAD) was downloaded from TCGA3. GEPIA24 was used for the comparison of gene expression between STAD and normal tissue from GTEx dataset. MC3 gene-level non-silent mutation data and gistic2 threshold of copy number data was obtained from UCSC Xena website5. The EdgeR package was used to analyze differential gene expression (P < 0.05, | log FC| ≥ 1). Gene Ontology (GO) and Kyoto Encyclopedia of Genes and Genomes (KEGG) were analyzed using DAVID6. The protein interaction network was constructed in String7. Using 12 algorithms and a combination of the most commonly used methods (Degree and MCC) referenced elsewhere (Chin et al., 2014; Wang W. et al., 2019), we selected the top 30 hub genes using cytohubba in Cytoscape (version 3.7.1).
Calculation of Immune Infiltration, Tumor Purity, TMB, and TME Score
The immune cells portion was calculated using the CIBERSORTS8 method and the LM22 gene signature were used for immune infiltration analysis (Chen et al., 2018). All results were considered statistically significant if P < 0.05. Correlation between immune cells and hub genes was calculated by Pearson (| R| > 0.4 and P < 0.05). TMB was calculated based on somatic mutation data. TME score was calculated as previously described (Zeng et al., 2019). Tumor purity, immune score, and stromal score were calculated using the ESTIMATE package (Yoshihara et al., 2013). The best cut-off values of genes for Kaplan-Meier were calculated by survminer package through R software (Li M. et al., 2019). Ten classic oncogenic signaling pathways and important genes among them were from Sanchez-Vega et al. (2018).
Statistical Analysis
Statistical analyses were conducted using R software (3.6.1 version) and SPSS version 23.0. Graphical representations were generated using GraphPad Prism 8. Mann-Whitney test and Kruskal-Wallis tests were used for continuous variables with two or more groups, respectively. Chi squared was used for categorical variables. The Pearson coefficient was used to test for correlations.
Results
Differential Gene Expression and Hub Genes
From the GDSC database, genes were analyzed for differences in expression between sensitive and drug-resistant cells of 5-Fluorouraci (5-FU) and Oxaliplatin, respectively. Comparing sensitive and drug-resistant cells revealed 328 and 84 differentially expressed genes, respectively (16 duplicate genes) (Figures 2A,B and Supplementary Table S1). Gene Ontology Biological process (GO-BP) analysis showed that the differentially expressed genes were primarily involved in negative regulation of endopeptidase activity, cell adhesion, inflammatory response, and O-glycan processing (Figures 2C,D). These biological functions are closely related to the development and prognosis of GC (Duarte et al., 2016; Cui et al., 2017; Mukai et al., 2017; Geng et al., 2018).
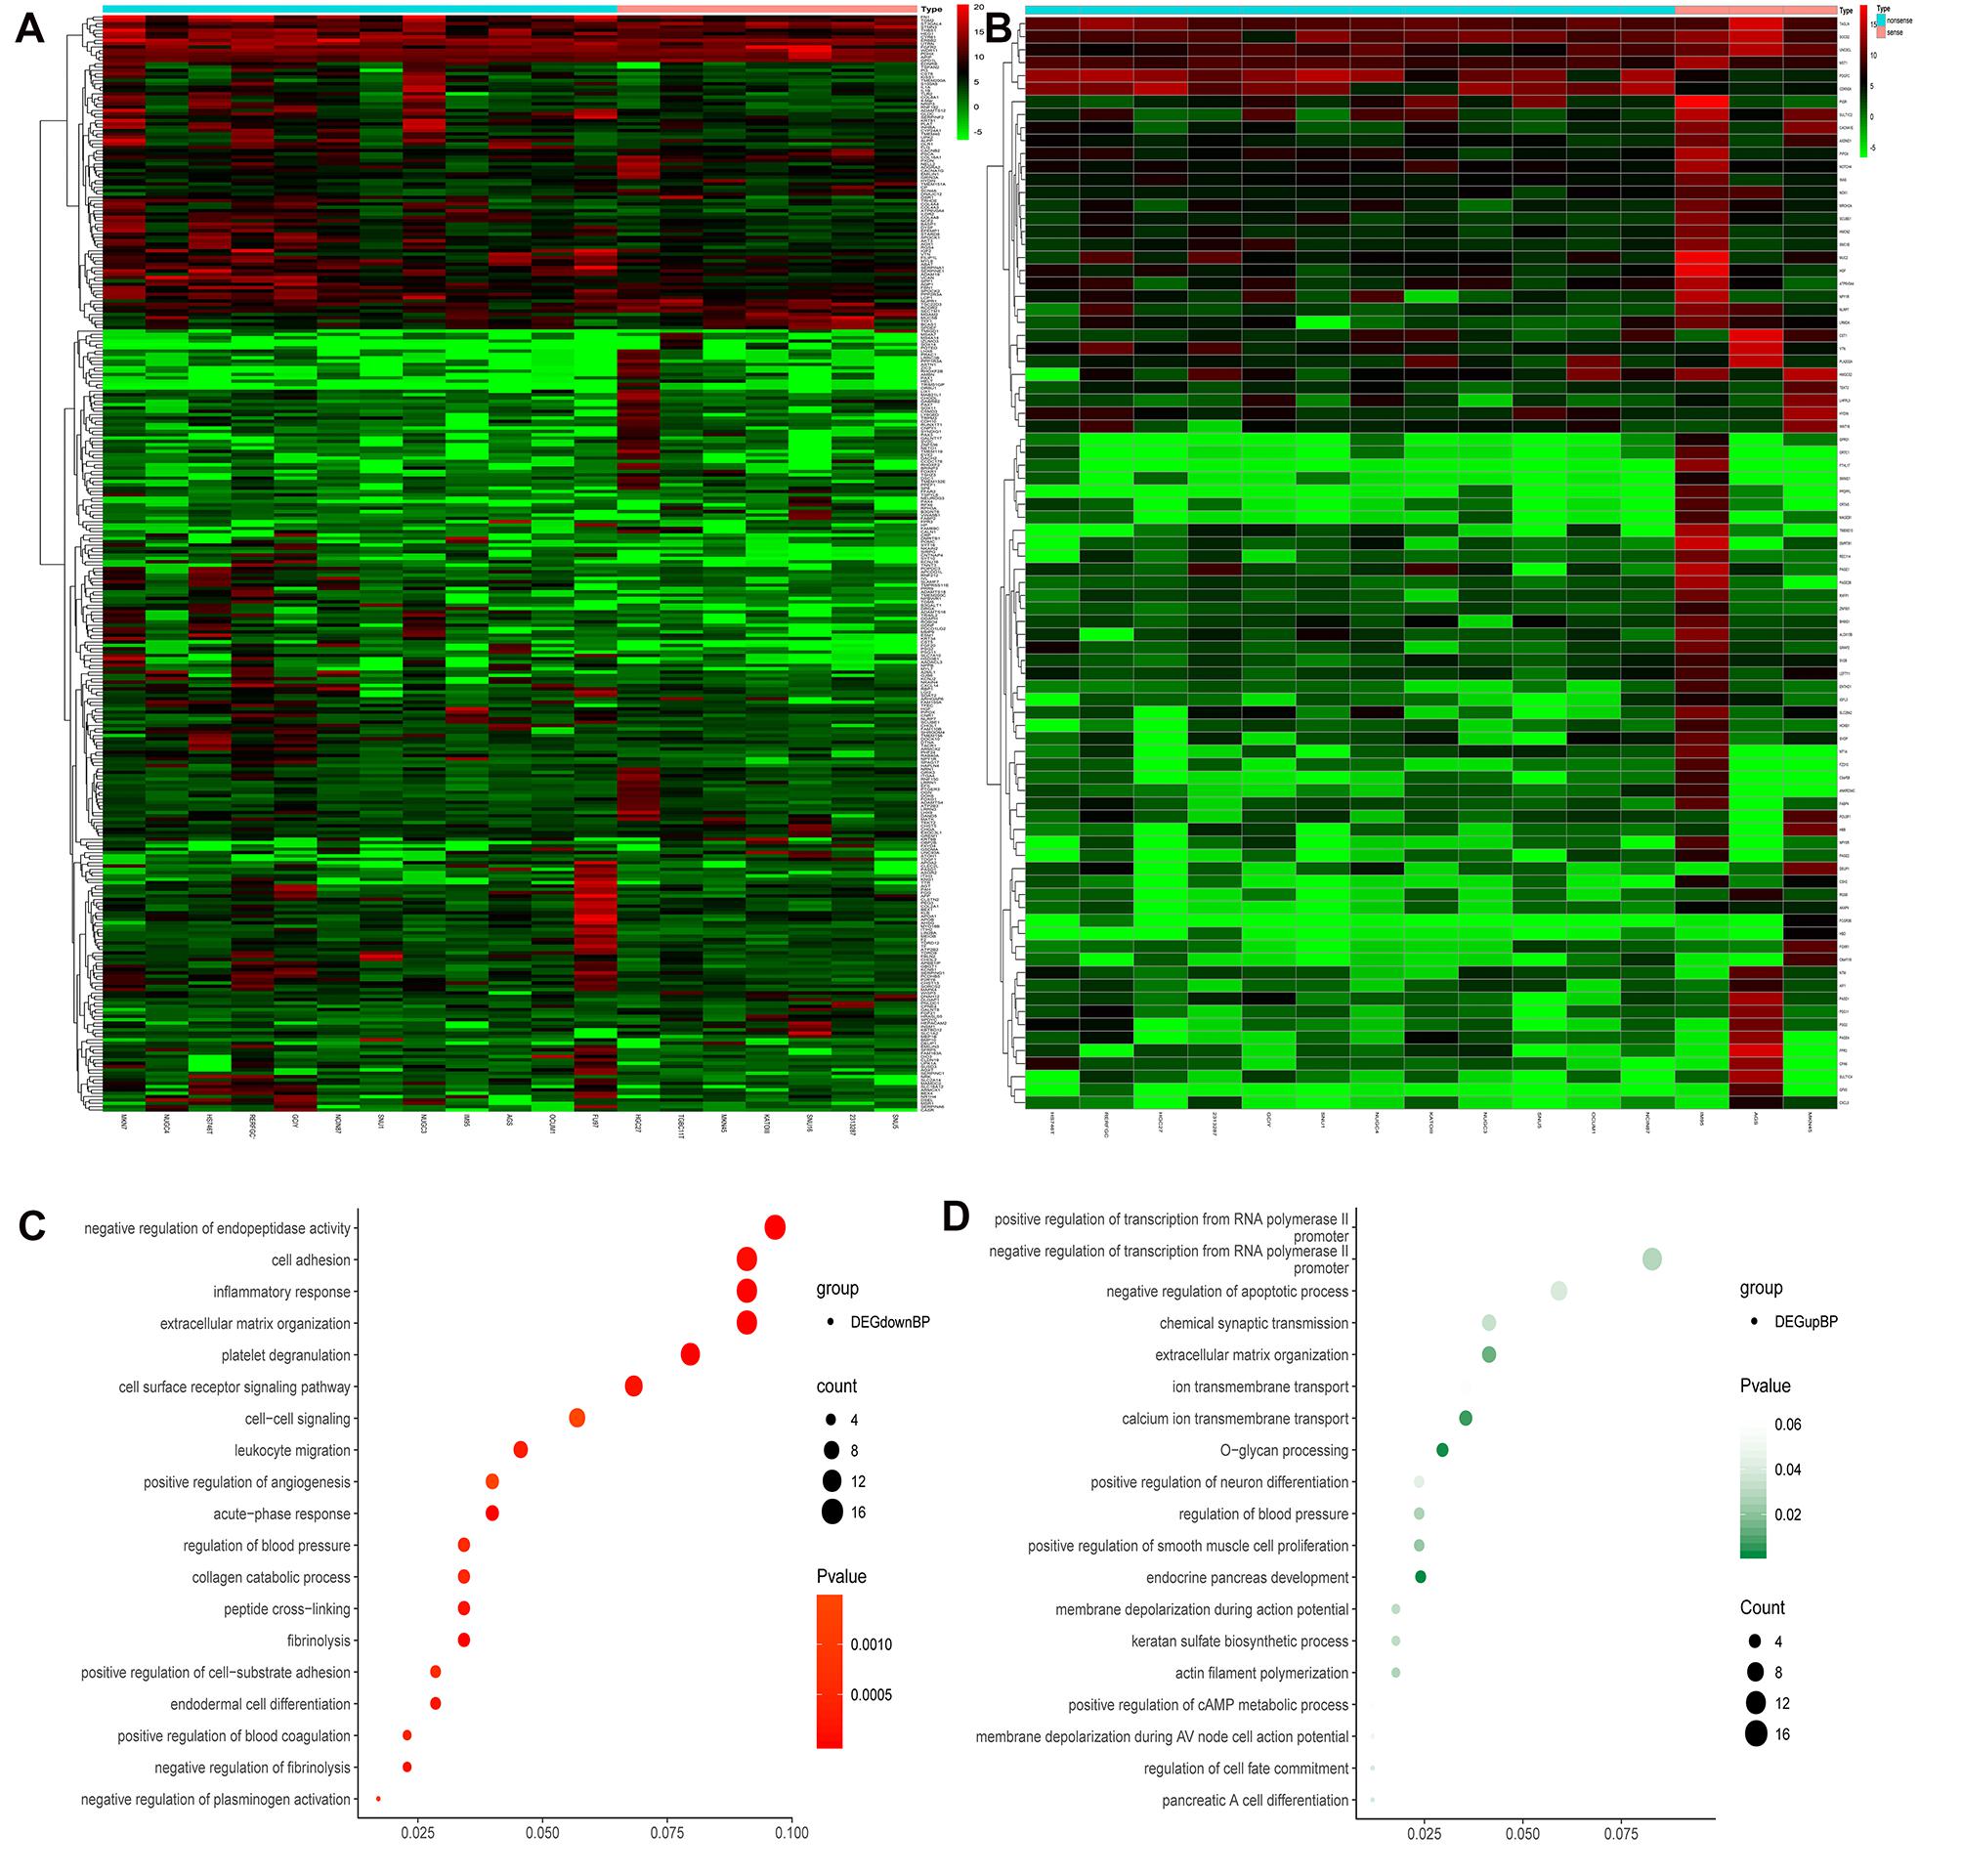
Figure 2. Heat maps and GO-BP of differential gene expression analysis in sensitized and drug-resistant cells. (A) Heat map of the genes differentially expressed between 5FU-sensitive and non-sensitive cells, (B) heat map of differentially expressed genes in Oxaliplatin groups, (C) GO analysis of downregulated genes revealed that these genes were primarily involved in the negative regulation of endopeptidase activity, cell adhesion, inflammatory response, extracellular matrix organization, etc., (D) upregulated genes were primarily involved in positive and negative regulation of transcription from RNA polymerase II promoter, negative regulation of apoptosis, chemical synaptic transmission, etc.
Selection of Hub Genes
All differentially expressed genes were used in the String website to construct a protein interaction network, and key hub genes were identified by cytohubba in Cytoscape. Thirty hub genes were selected using 12 algorithms (Supplementary Table S2) and combined the most frequent methods (Degree and MCC) referenced in other studies. The expression levels of the 30 hub genes in TCGA Stomach adenocarcinoma (TCGA-STAD) and normal tissue from GTEx dataset were got from GEPIA2 (Figure 3). It showed that 10 genes (AGT, FN1, ERBB2, FBN1, IGF2, MMP9, SERPINA1, SPP1, VCAN and SERPINE1) were significantly higher expressed in tumor tissues, while 3 genes including APOA1, FGG, and TTR, were significantly lower expressed in tumor tissues.

Figure 3. Expression of 30 hub genes in TCGA-STAD and normal tissue from GTEx dataset. *P < 0.05.
Correlation Between Hub Genes and Immune Infiltration
The correlation between mRNA expression of the 30 hub genes and 22 immune cell types is shown in Figure 4B. Naive T cells were not considered due to lack of expression in almost all patients, prohibiting any comparisons. mRNA expression of MMP9 and SPP1 showed a high positive correlation with Macrophage M0 cells (Figure 4A). mRNA expression of IL1B showed a high positive correlation with activated mast cells and neutrophils. In contrast, mRNA expression of MMP9 showed a negative correlation with resting mast cells. The correlation between the expression of other hub genes and immune cell types was low (between 0 and 0.4). Therefore, we assumed that mRNA expression level of other hub genes, other than those mentioned above, had little correlation with immune cells.
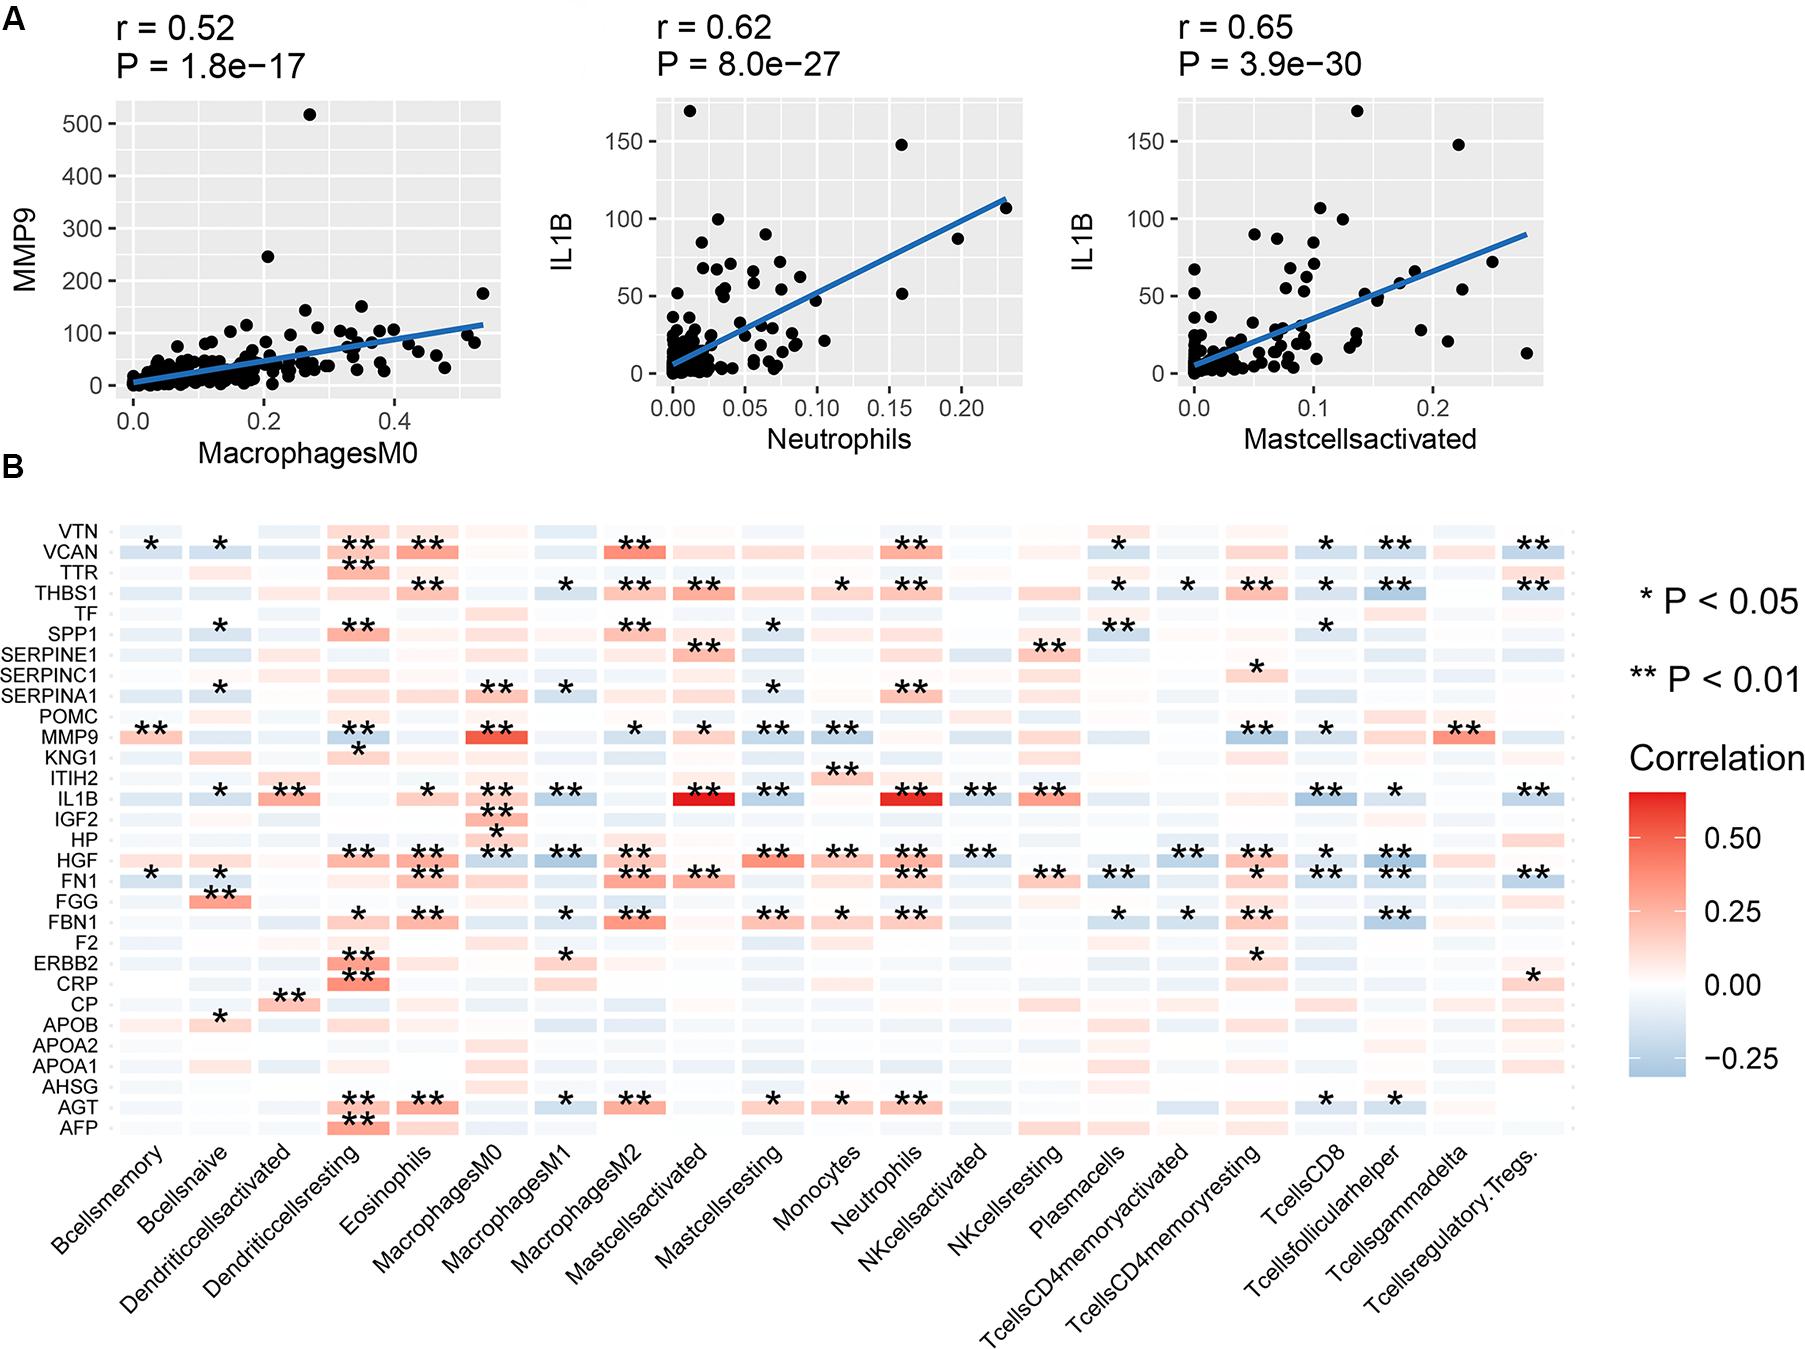
Figure 4. Correlation between hub genes and immune infiltration. (A) Correlation between MMP9 and macrophages (M0), IL1B and neutrophils, and IL1B and activated mast cells, (B) correlation between the expression of the 30 hub genes and 22 types of immune cells. **P < 0.01; *P < 0.05.
Correlation Between Hub Genes and TMB, TME Score, Tumor Purity, Immune Score, and Stromal Score
Among the 30 hub genes, six genes (FBN1, FN1, HGF, MMP9, THBS1, and VCAN) were negatively correlated with tumor purity and TME score, and positively correlated with tumor immune score and stromal score (Figure 5B). Therefore, we selected these six genes as target genes. Figure 5A shows how target gene expression changes based on tumor purity and TME score. This is consistent with the results in Figure 5B, indicating that lower mRNA expression of target genes is associated with higher tumor purity and TME score, and lower immune and stromal scores.
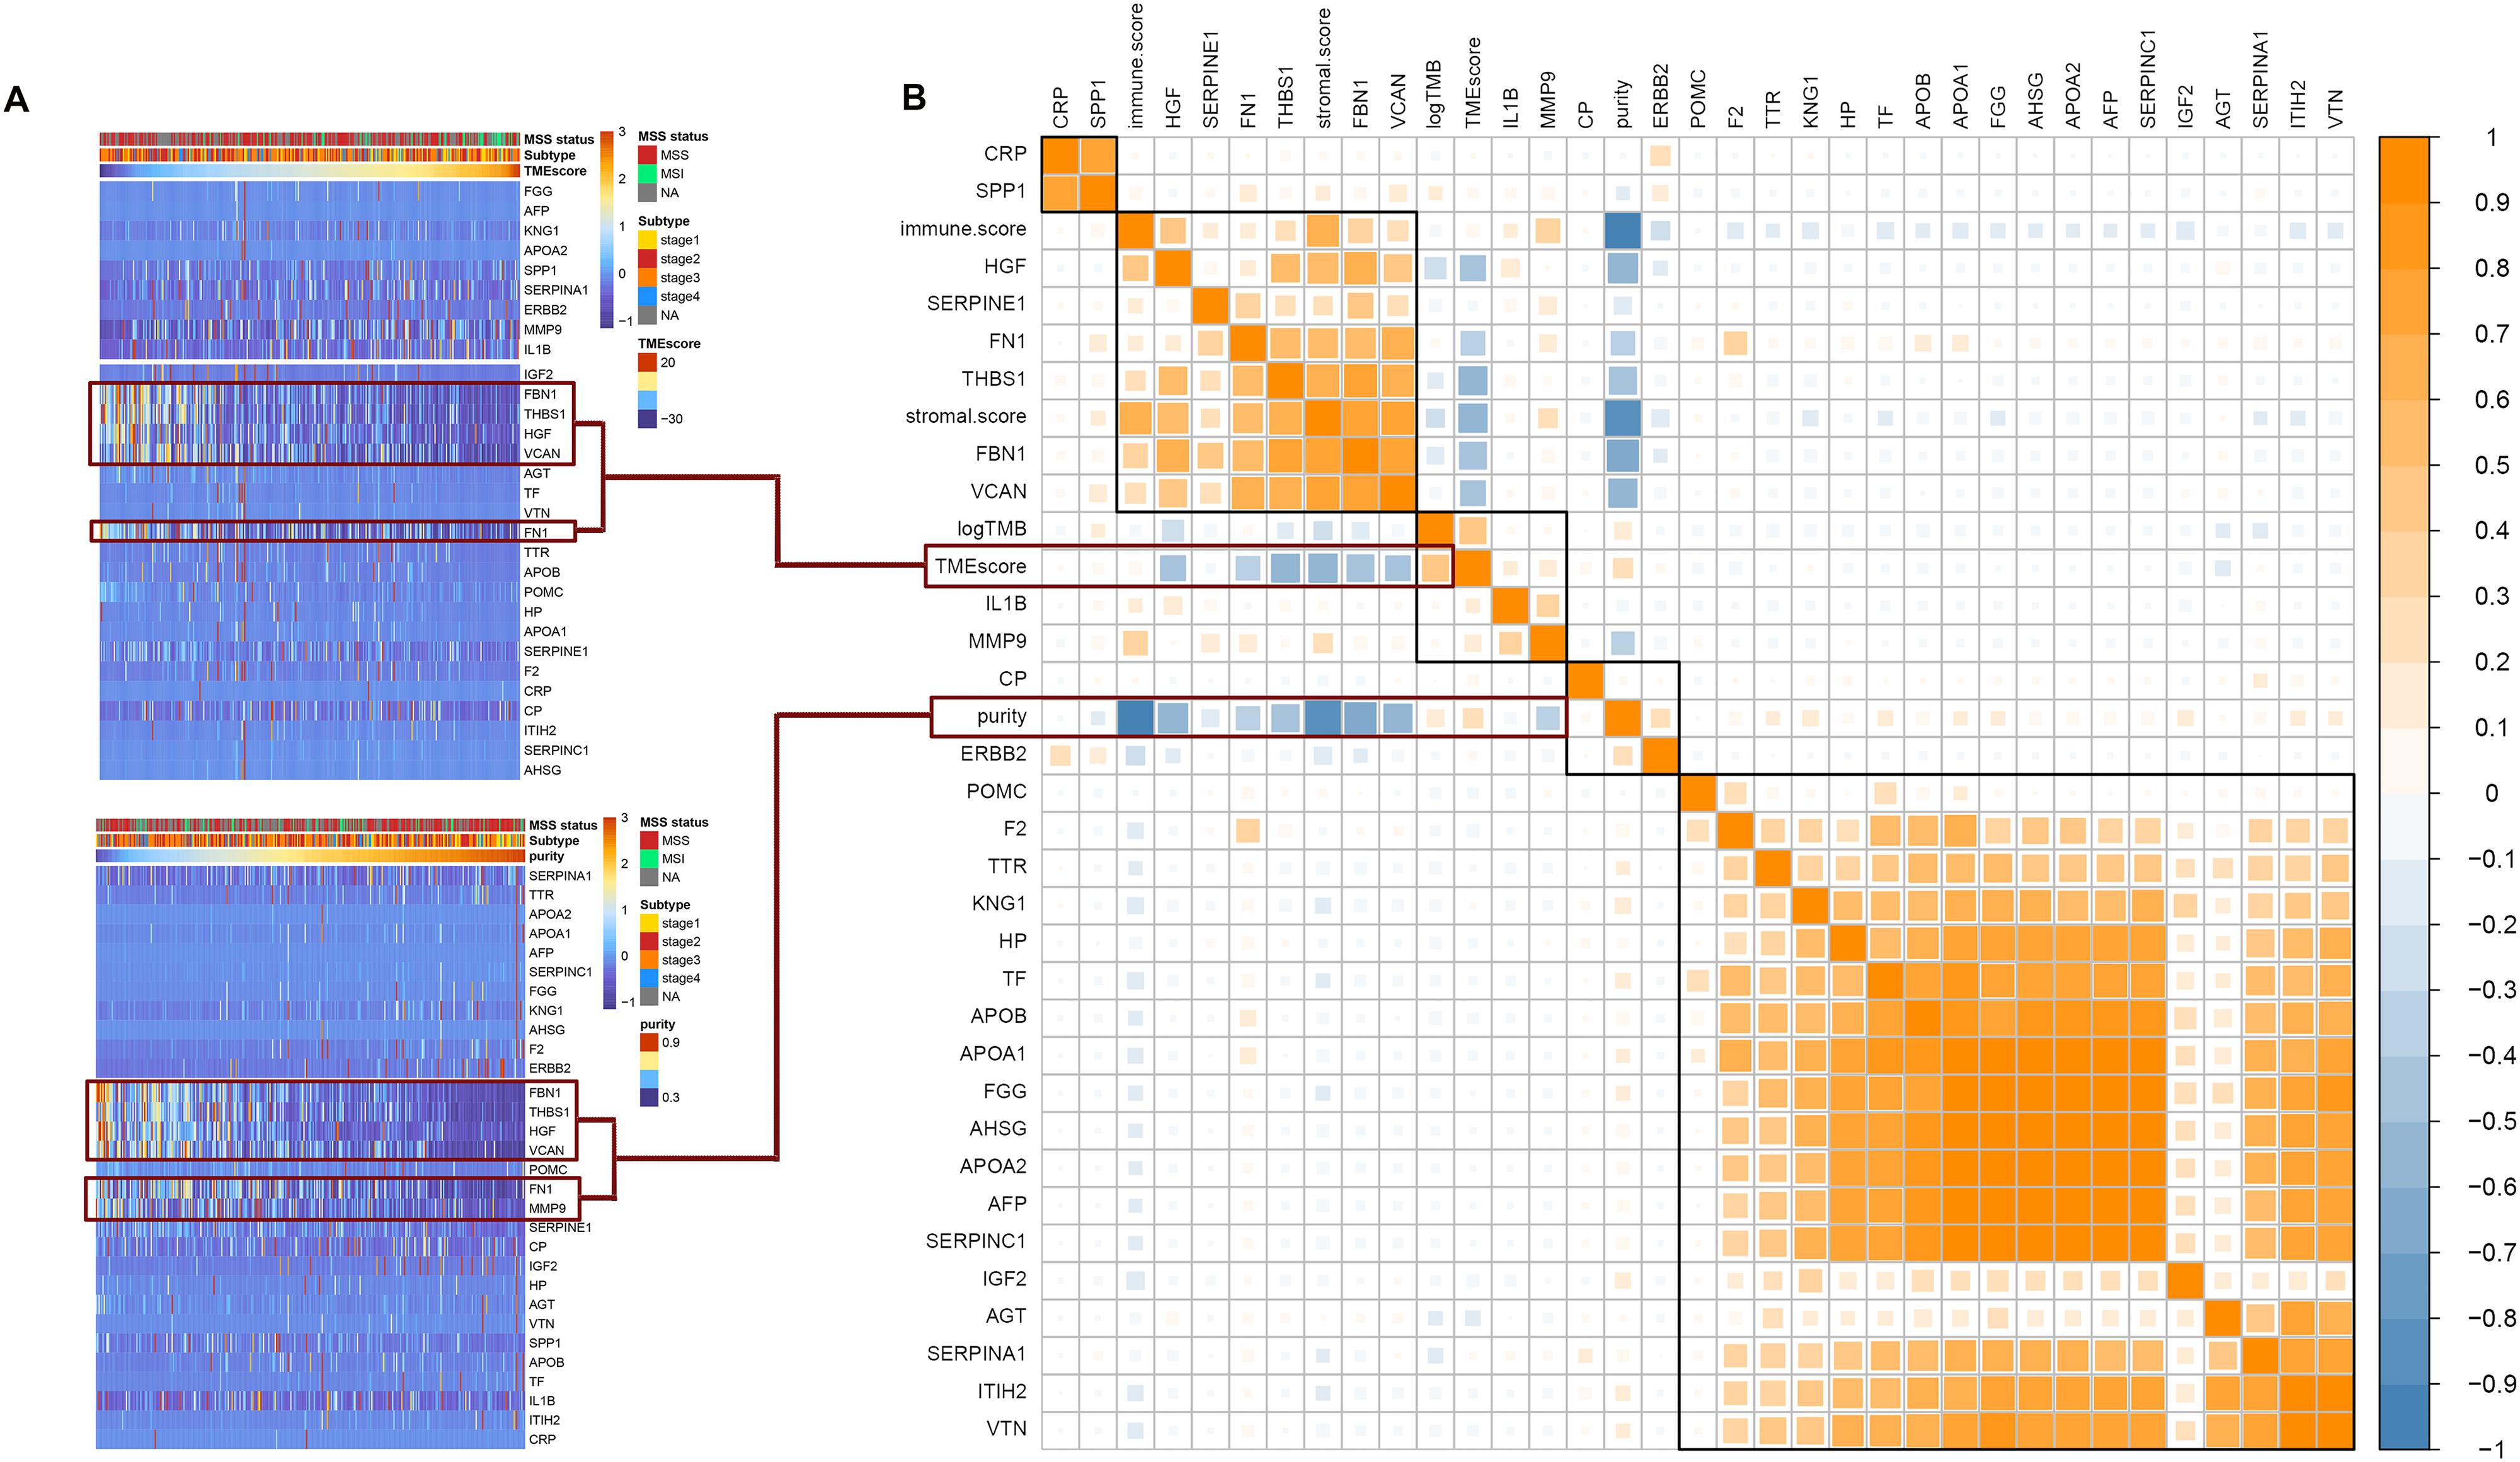
Figure 5. Correlation between hub genes expression and important factors. (A) Heat map of the hub genes expression according to the TME score and tumor purity, (B) correlation between hub gene expression and TMB, TME score, tumor purity, immune score, and stromal score.
Correlation Between Target Gene Mutations and TMB, TME Score, Tumor Purity, Immune Score, and Stromal Score
Figure 6A shows that APOB, FBN1, VCAN, FN1, ERBB2, HGF, THBS1, and MMP9 have high mutation frequencies. These genes typically harbor missense mutations. Except for APOB and ERBB2, the remaining genes were the target genes selected above, which were highly related to tumor purity, TME score, immune score, and stromal score. Figure 6B shows that there were no significant differences in mRNA expression, tumor purity, immune score, or stromal score between the mutated and wild type genes. However, the TMB and TME scores in the mutated target genes were significantly higher than those in the non-mutated genes. This suggests that GC patients with target gene mutations could displayed higher TMB and TME score.
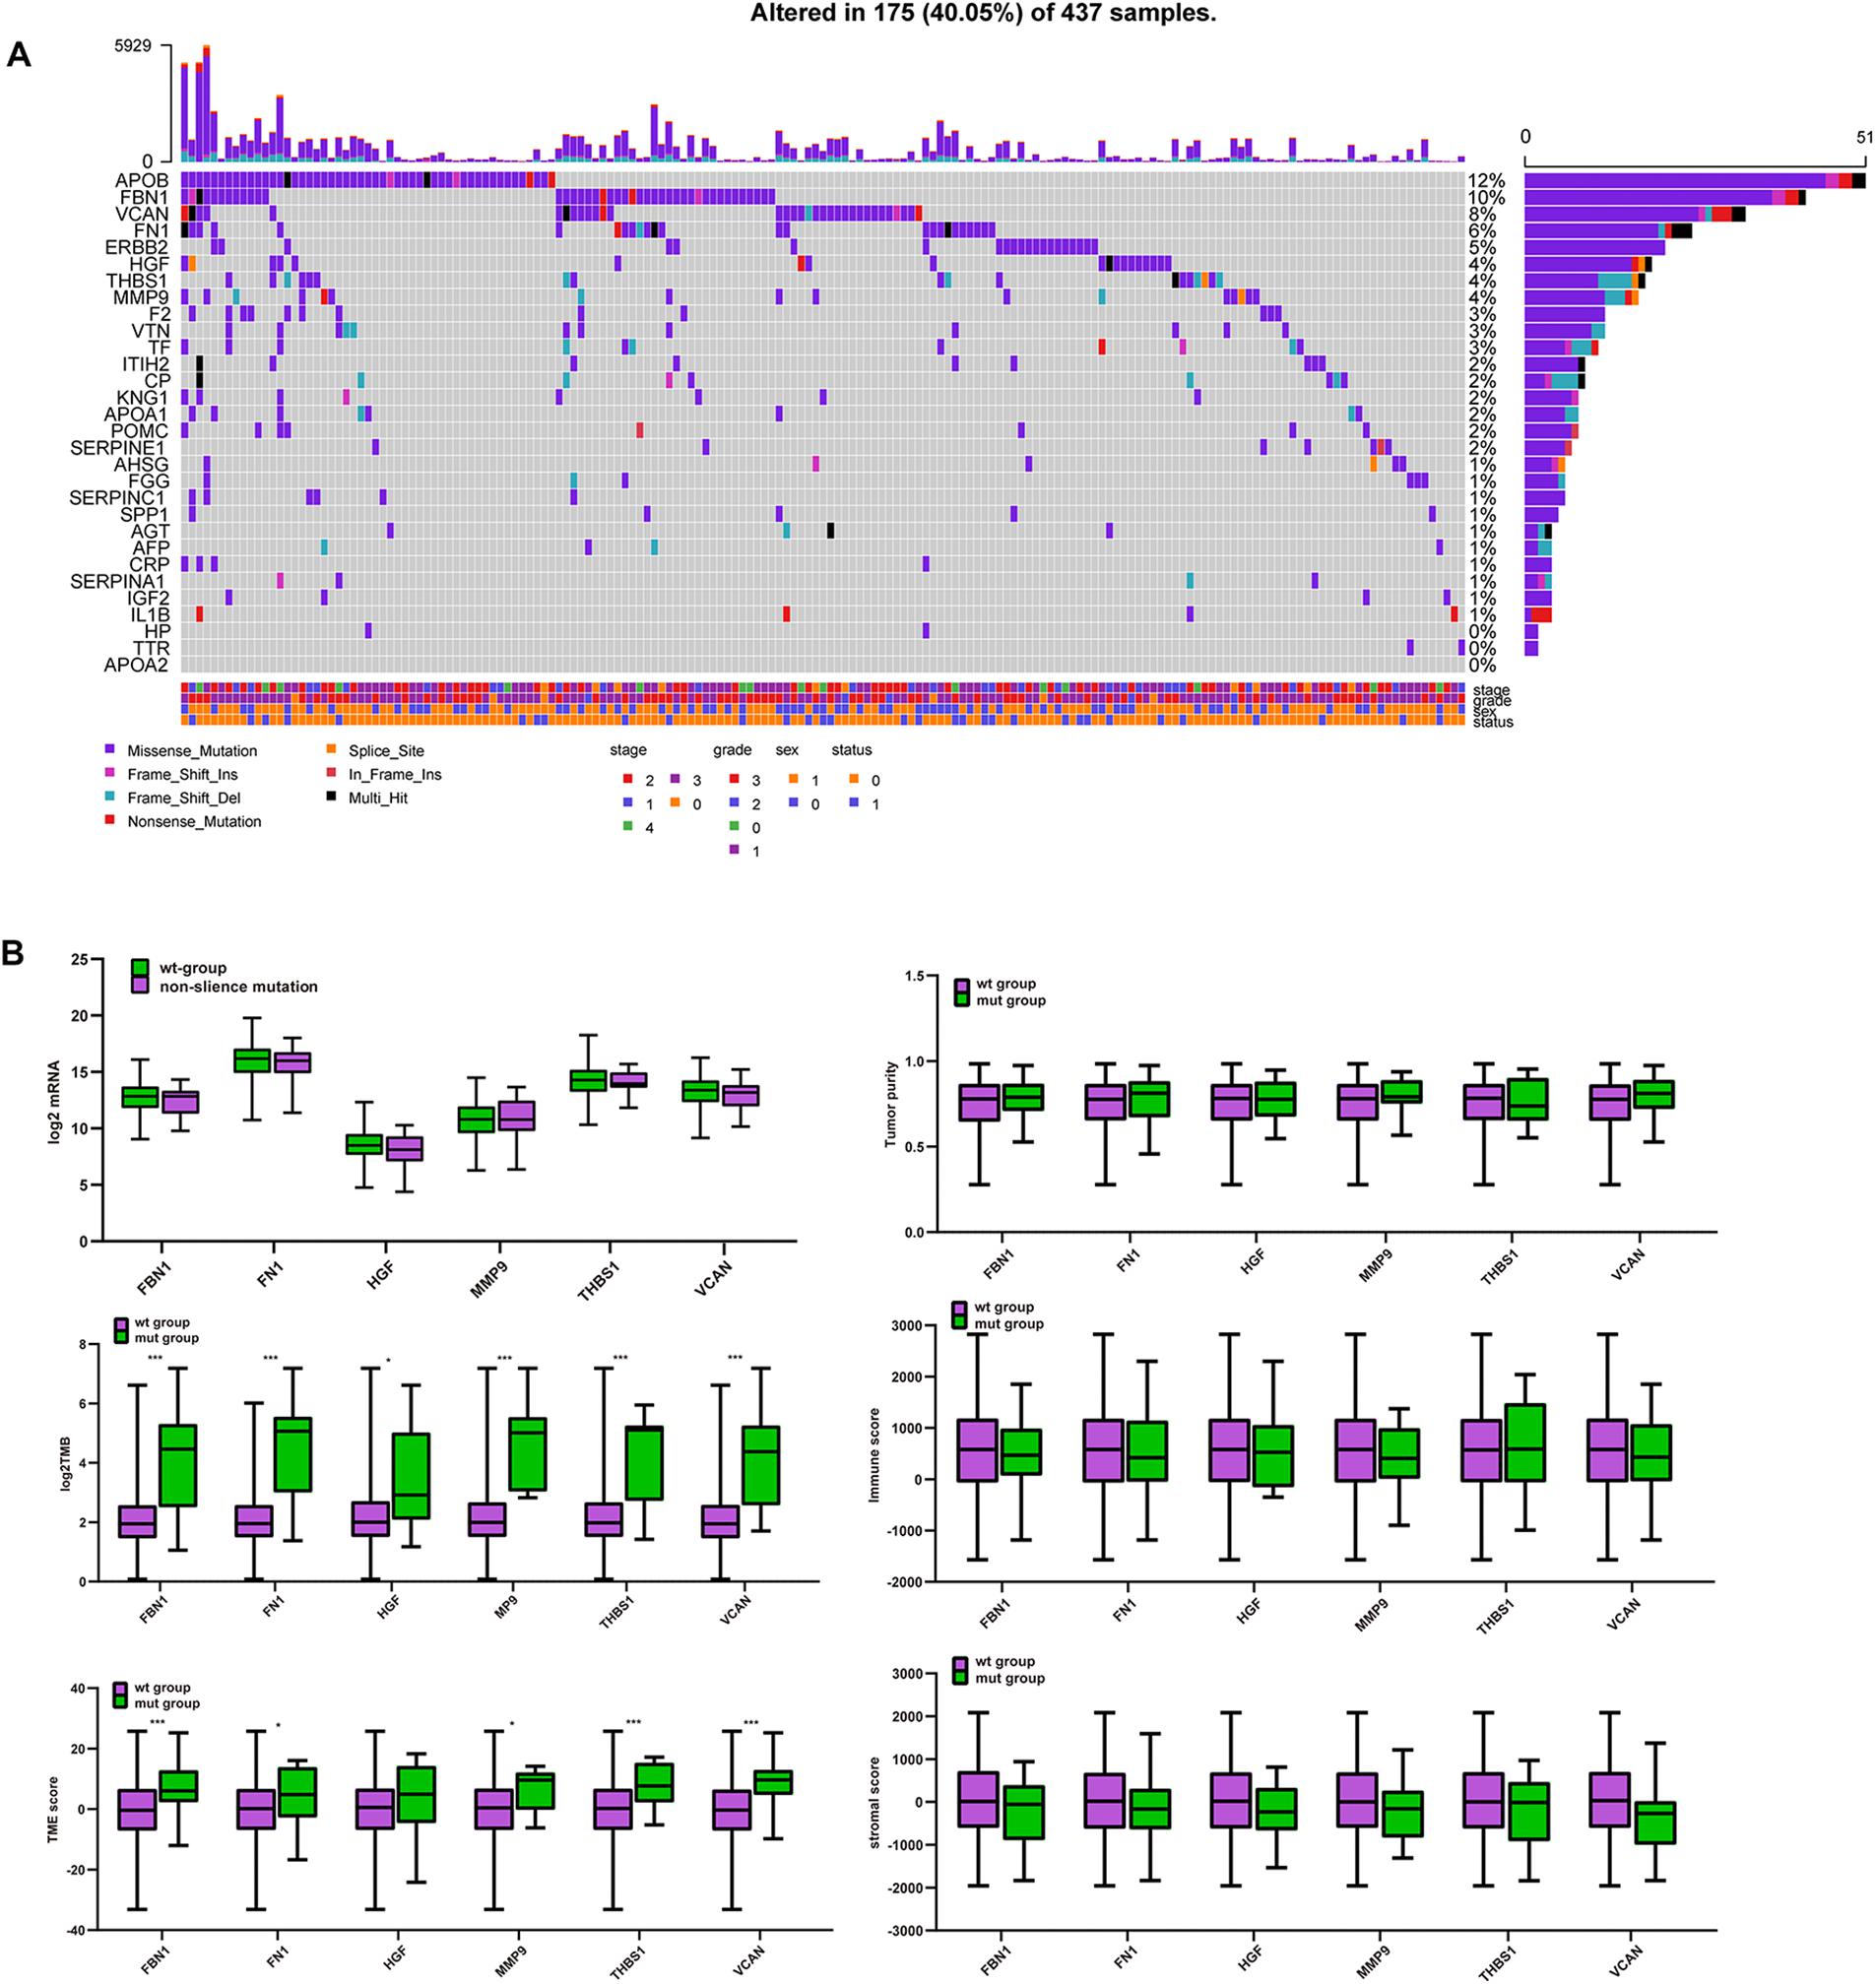
Figure 6. Mutation of target genes and the effect on purity, TMB and TME score. (A) Six hub gene mutation frequency in TCGA-STAD, (B) comparison of mRNA expression, tumor purity, immune score, stromal score, log2TMB, and TME score between the mutated and wild type group. ***P < 0.005; *P < 0.05.
Correlation Between CNA of Target Genes and TMB, Tumor Purity, TME Score, Immune Score, and Stromal Score
Unlike mutations, the 30 hub genes had significantly higher rates of CNA, with each gene occurring in approximately a third or more of the patients (Figure 7A). We also divided the CNA group and non-CNA group for analysis. Four target genes (FBN1, HGF, THBS1, and VCAN) had significantly lower mRNA expression in the CNA group (Figure 7B). For further analysis, we compared the mRNA expression in different subgroup (Figure 7C). When single copy deletion occurred, the expression of FBN1, HGF, THBS1, and VCAN decreased. While for FBN1 and THBS1, the expression also decreased when low amplification occurred. Maybe heterogeneity or unusual behavior of these patients affected the expression of genes. Other types of CNA seemed no impact on the expression of the genes. No matter amplification or deletion, the variation trend of genes expression reflected in Figure 7C was consistent with that in Figure 7B.
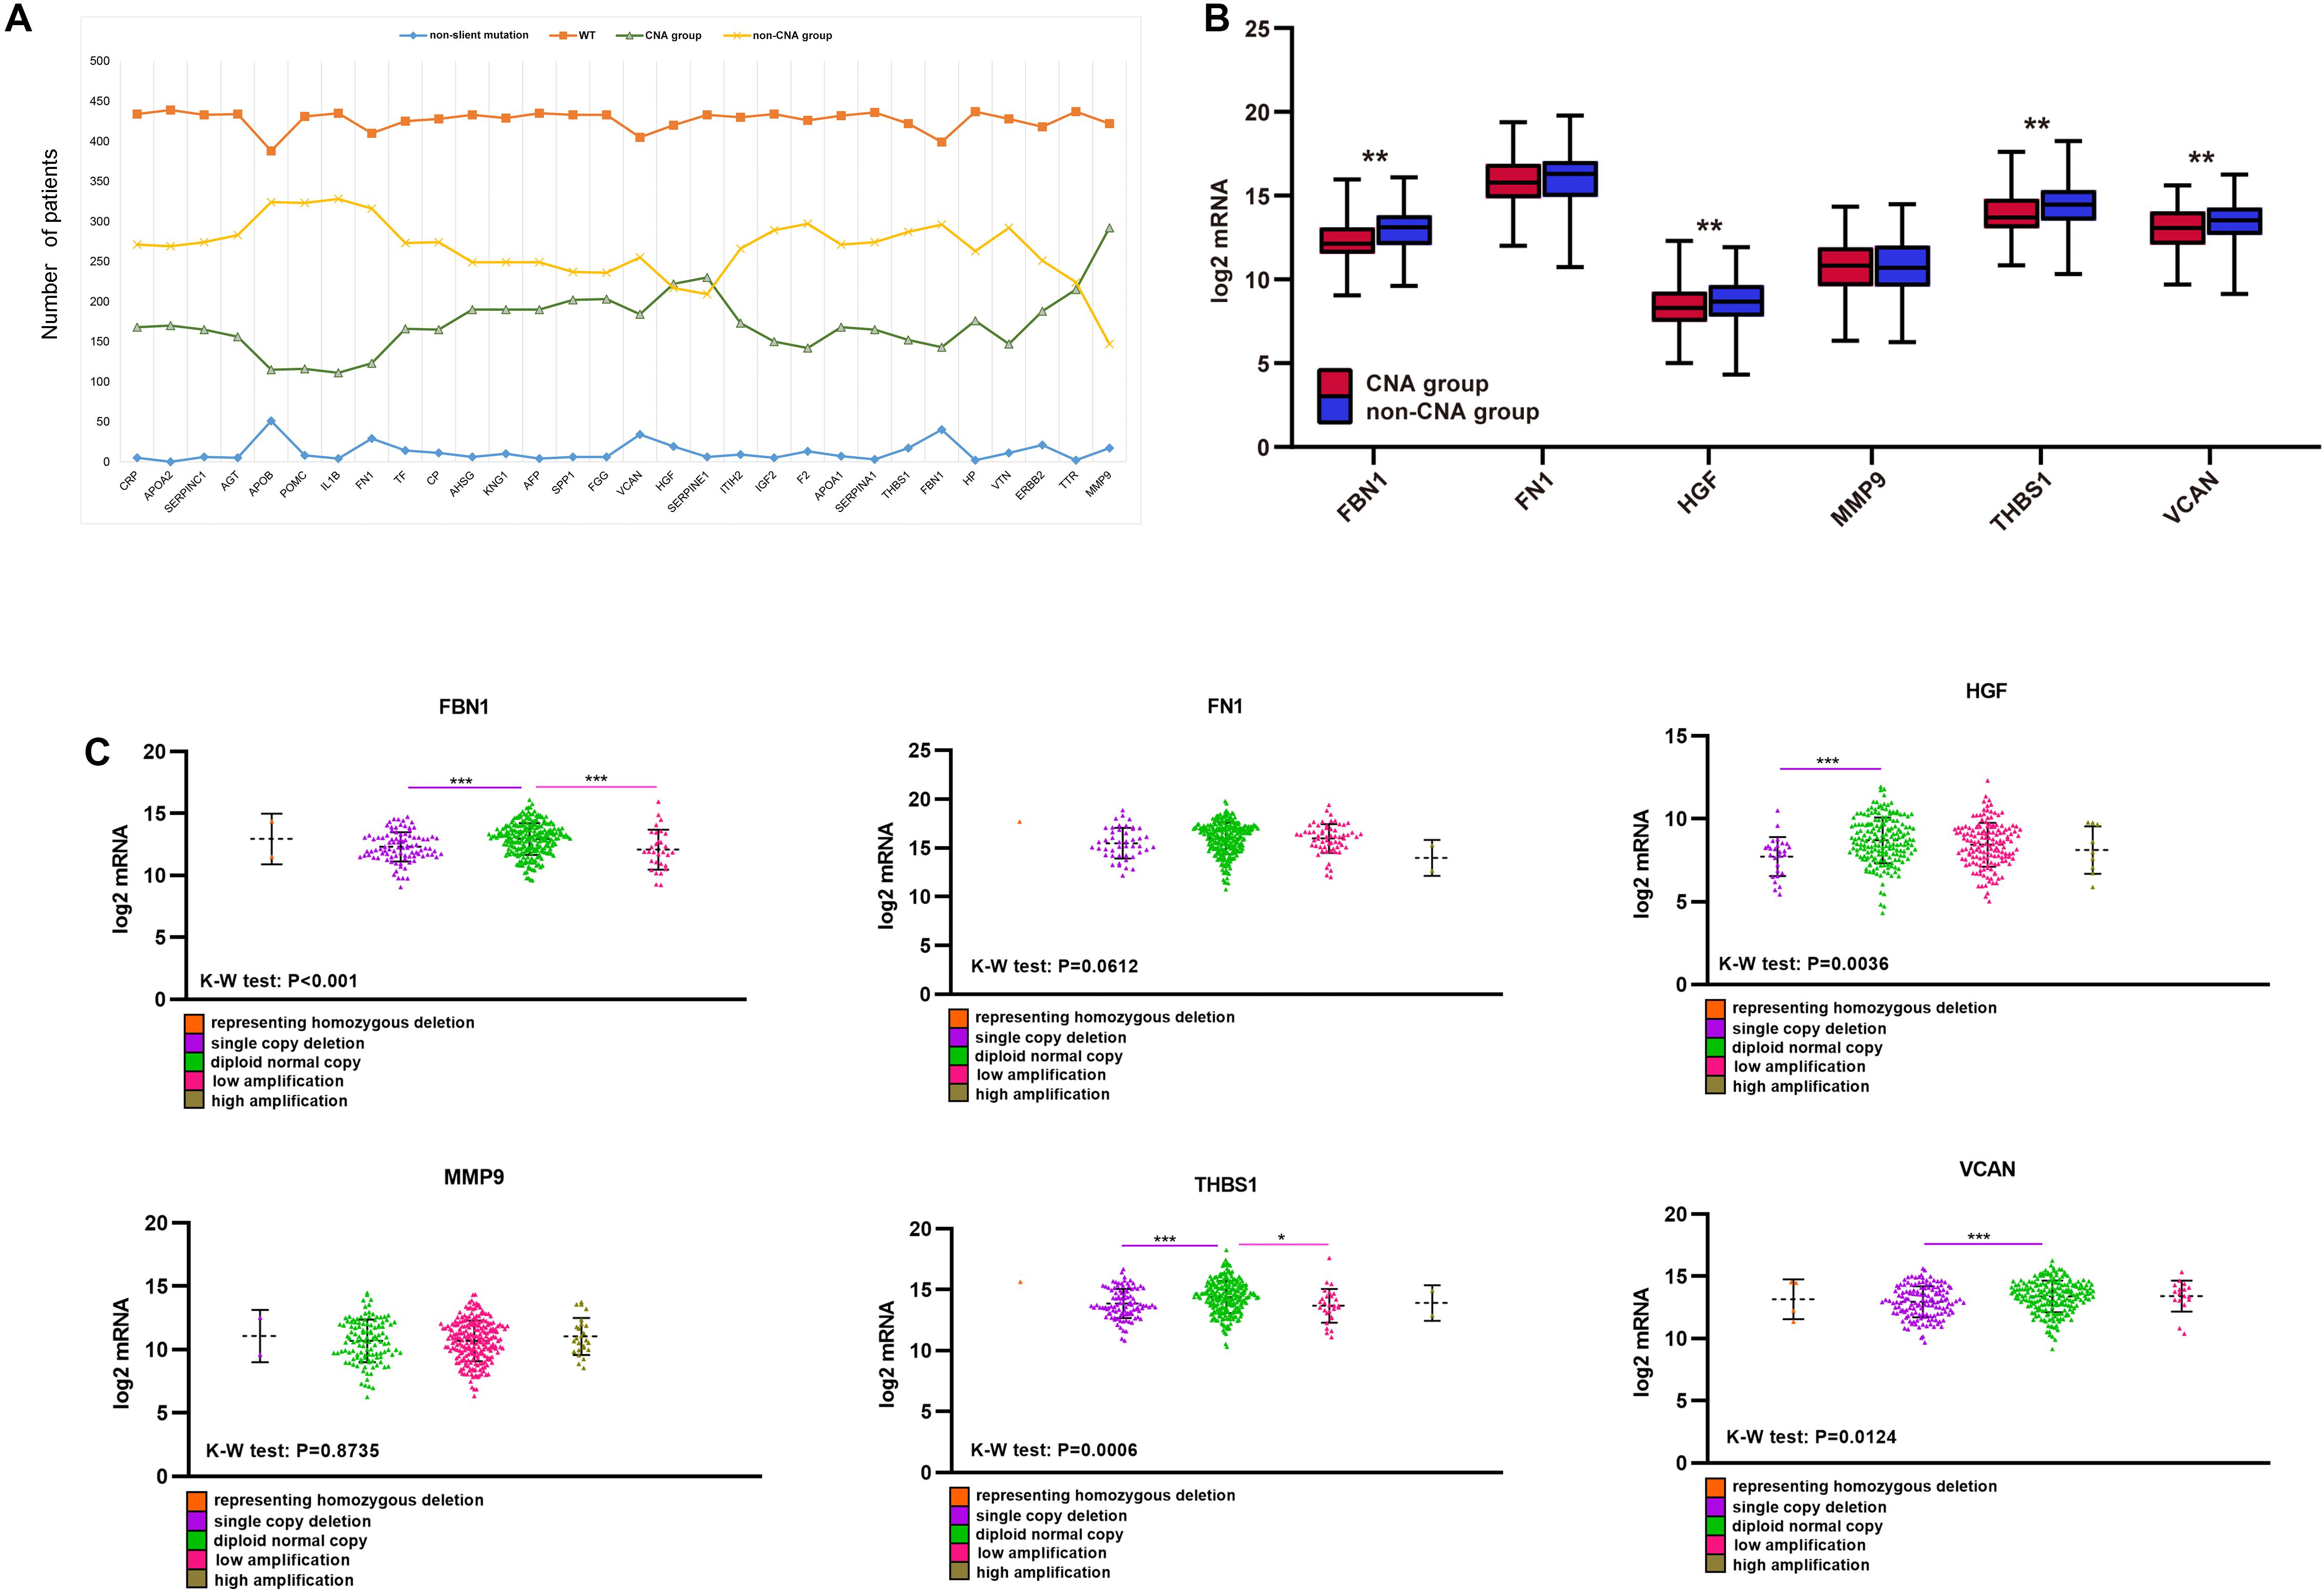
Figure 7. CNA of target genes and the effect on purity, TMB, and TME score. (A) Number of mutations and CNA for the 30 hub genes, (B) expression of the six target genes in the CNA and non-CNA group, (C) expression of the six target genes in different CNA subtype group. ***P < 0.005; **P < 0.01; *P < 0.05.
Single-copy number deletions and low-fold amplifications were the major types of CNA found for the target genes. Tumor purity was higher in the CNA group than that in the non-CNA group (Figure 8A), and their stromal and immune scores were significantly lower than those in the non-CNA group (Figures 8B,C). A similar trend was found for all six target genes. There was no significant difference in TMB or TME score between the CNA and non-CNA groups (Figures 8D,E). This suggests that the CNA of target genes may significantly affected the purity of the tumor.
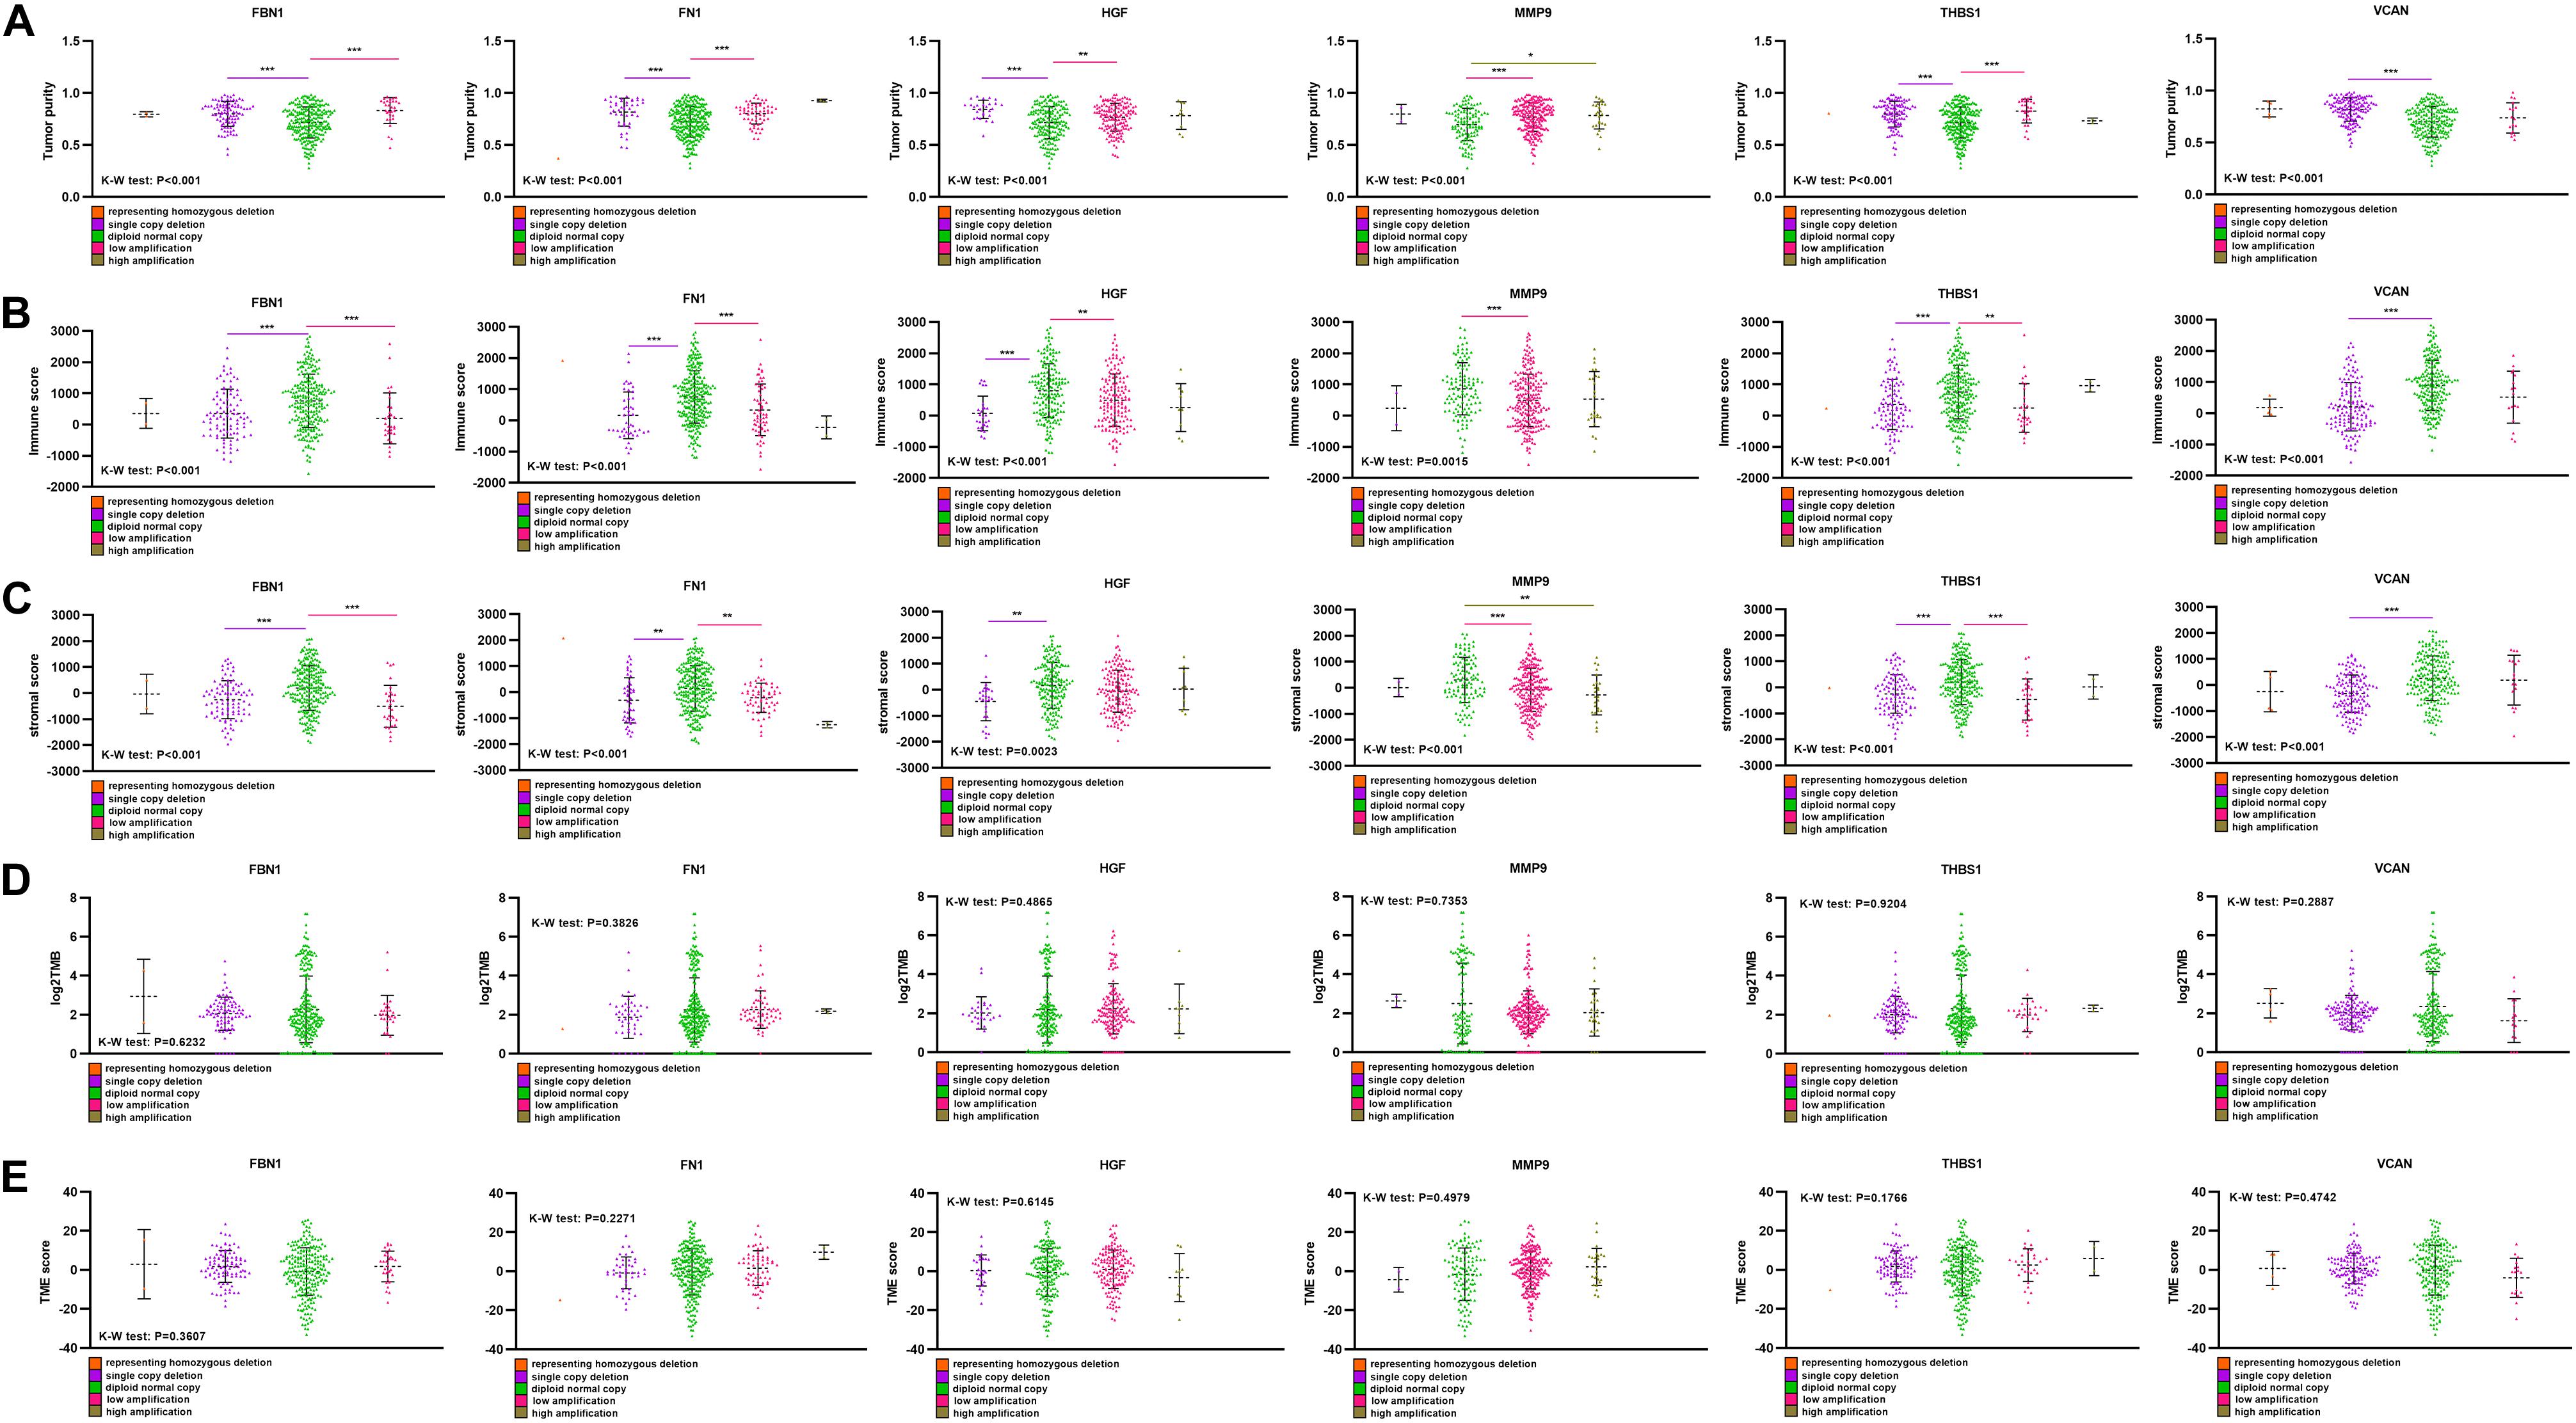
Figure 8. Comparison of purity, TMB, and TME score among different CNA subtype. (A) Tumor purity in different target gene CNA types, (B) immune score in different target gene CNA types, (C) stromal score in different target gene CNA types, (D) log2TMB in different target gene CNA types, (E) TME score in different target gene CNA types. ***P < 0.005; **P < 0.01; *P < 0.05.
Correlation Between Target Genes and Clinical Information
We analyzed the relationship between target gene mRNA expression level and clinical stage and grade. The expression of FBN1, THBS1, and VCAN had a significant relationship with stage (Figure 9A), and each had reduced expression in stage1. Regarding grade, all target genes except MMP9 had significant relationships with grade, especially between grade 2 and 3 (Figure 9B). This indicated that lower expression of target genes was associated with earlier stages and lower grades. Regarding survival (Figure 9C), all target genes except MMP9 were found to be prognostic factors by univariate cox analysis; lower expression indicated better prognosis.
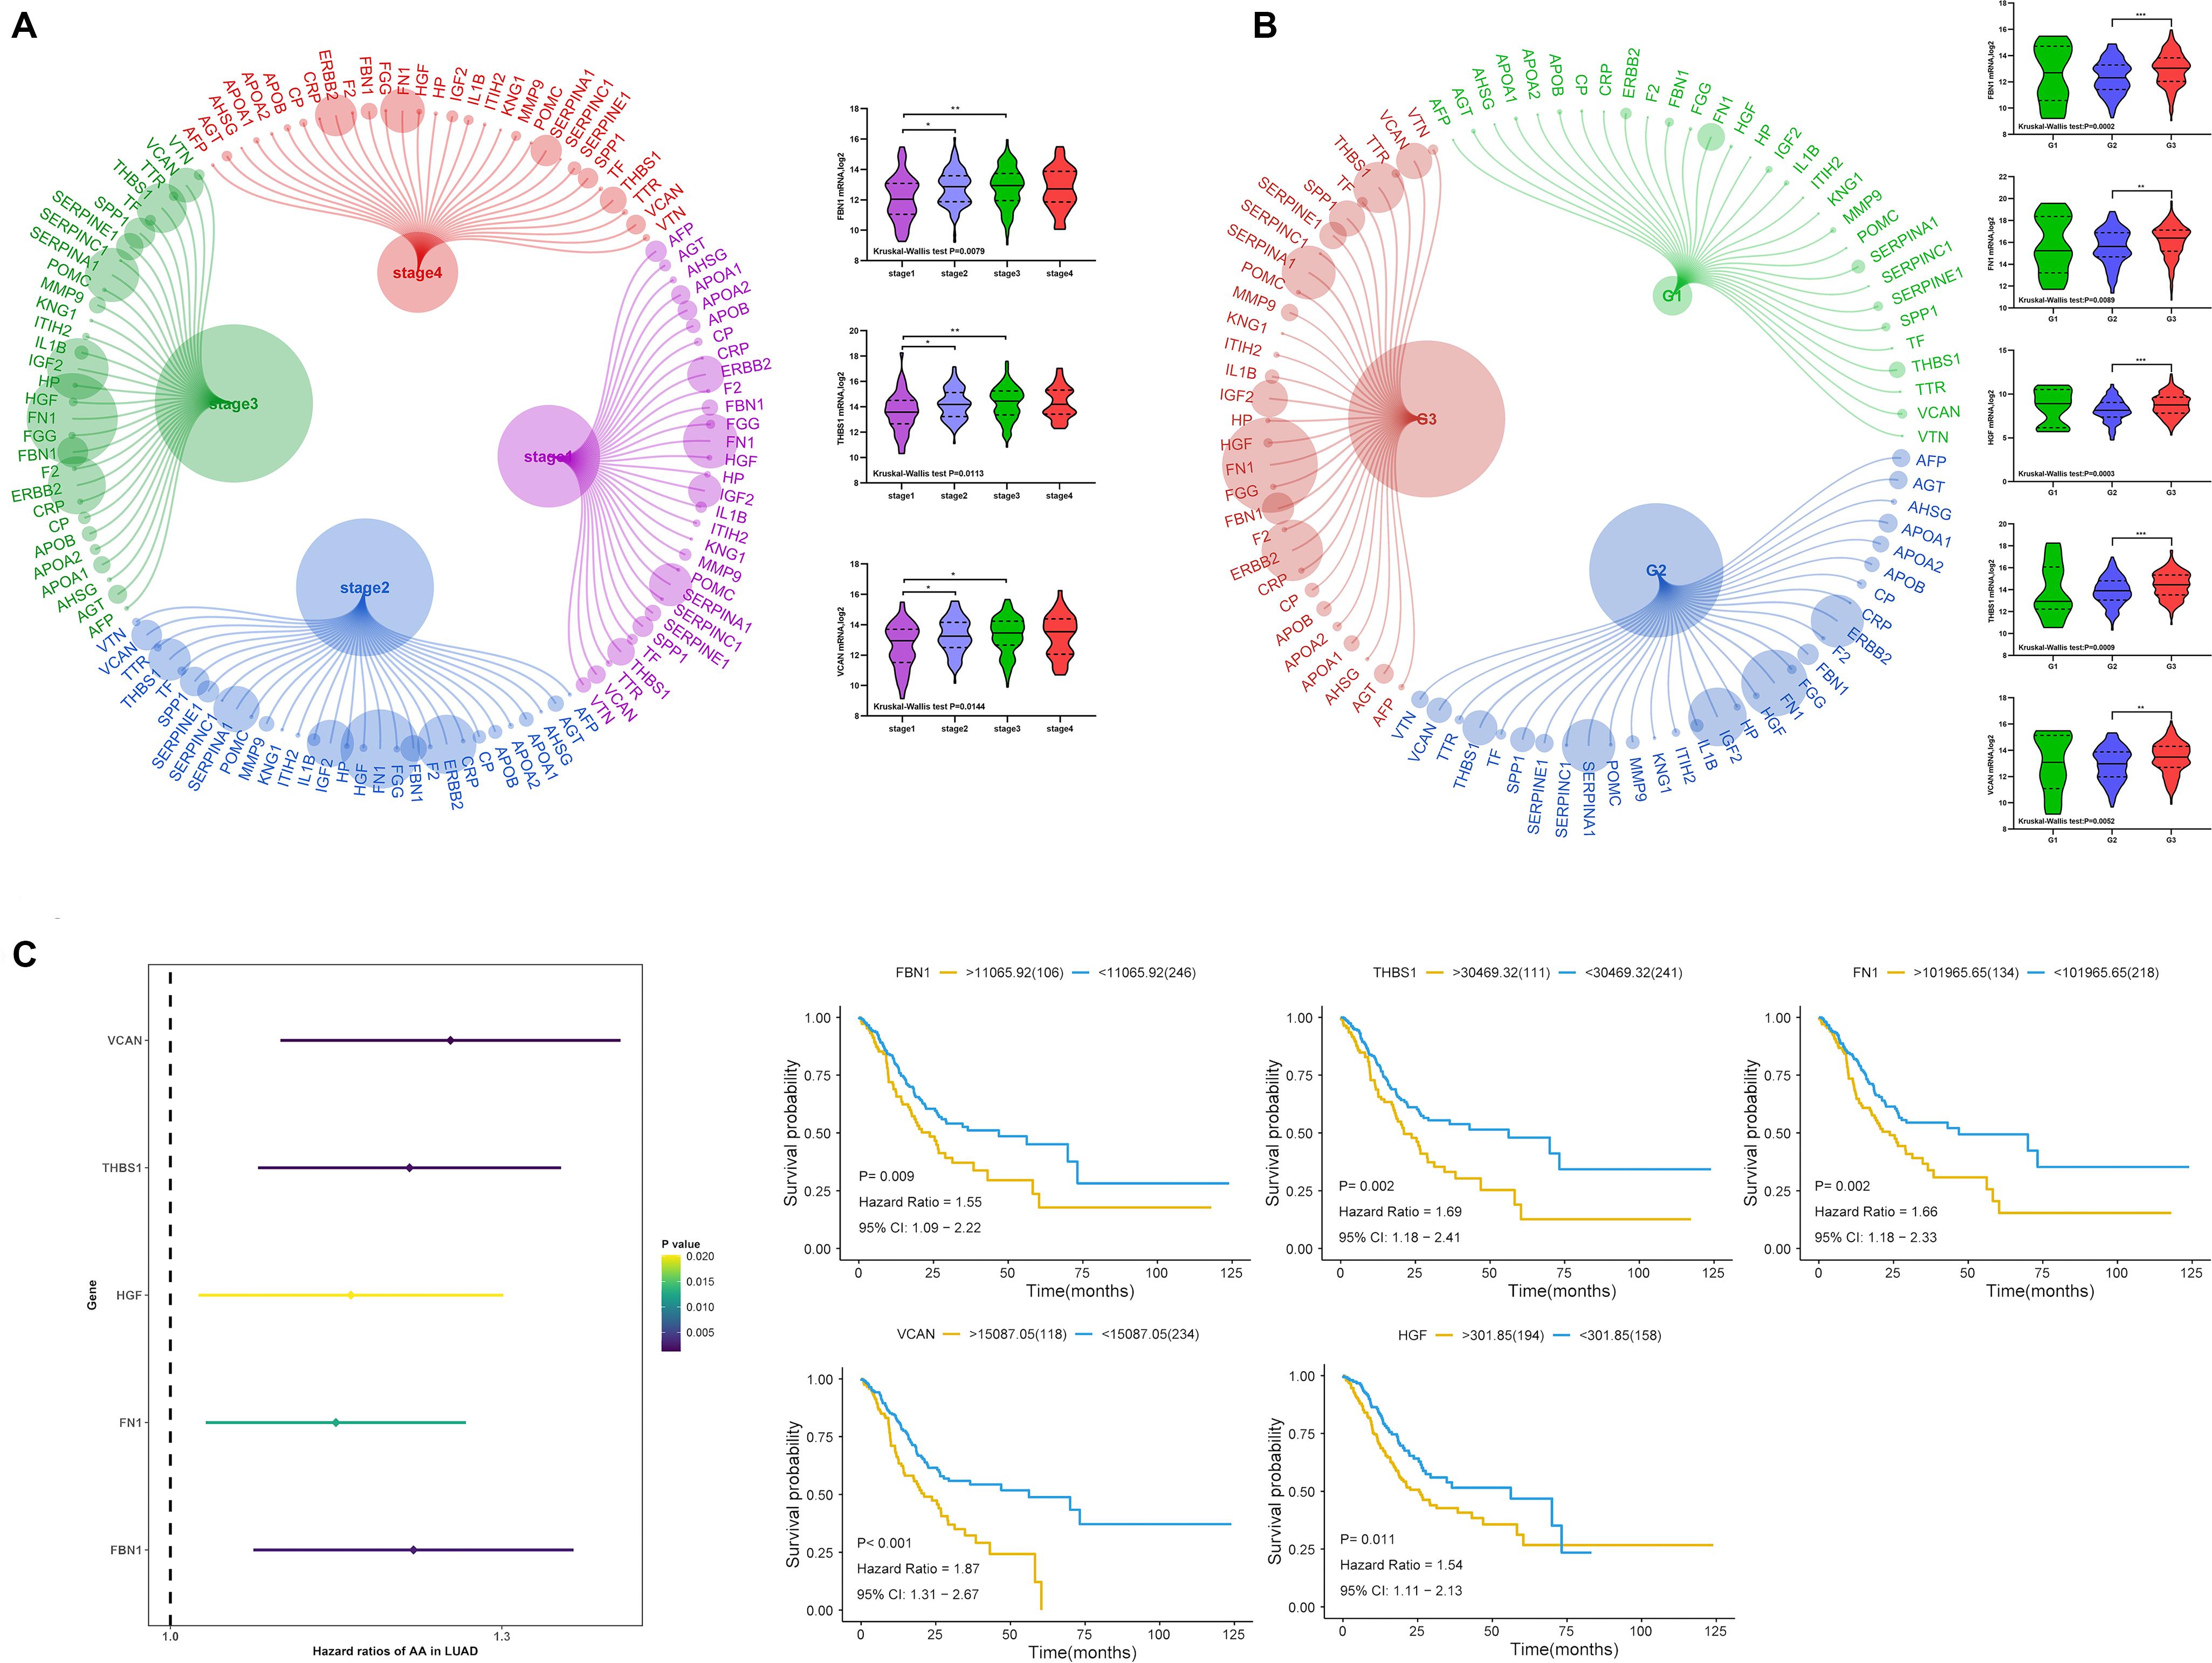
Figure 9. Expression of target genes and clinical characteristics. (A) Relationship between target genes and clinical stage, (B) relationship between target genes and clinical grade, (C) univariate cox analysis and Kaplan-Meier (KM) of target genes. ***P < 0.005; **P < 0.01; *P < 0.05.
As shown in Table 1, most patients in the FN1 mutation group were female, and those with THBS1 mutations had a relatively earlier clinical stage. Other gene mutations were not clinically relevant. Patients with VCAN mutations appeared to have a lower grade compared to patients without VCAN mutations.

Table 1. Mutation of target genes and clinical characteristics.
Besides, we also compared the clinical characteristics in CNA subgroup (Supplementary Table S3). However, the small sample size in some group made the comparison less accurate, so we divided the patients into CNA and non-CNA group. As shown in Table 2, the number of male patients with MMP9 CNA was higher than the number of female patients, and patients with MMP9 CNA showed a lower grade. In addition, patients with THBS1 CNA or VCAN CNA also showed lower grades.

Table 2. CNA of target genes and clinical characteristics.
Additionally, we analyzed the prognosis with respect to target genes in the mutant and wild type groups, and CNA and non-CNA group; however, there were no significant differences (Figure 10 and Supplementary Table S3). This indicates that the mutation or CNA of target genes is associated with an earlier stage or grade, especially for THBS1, VCAN, FBN1, and MMP9.
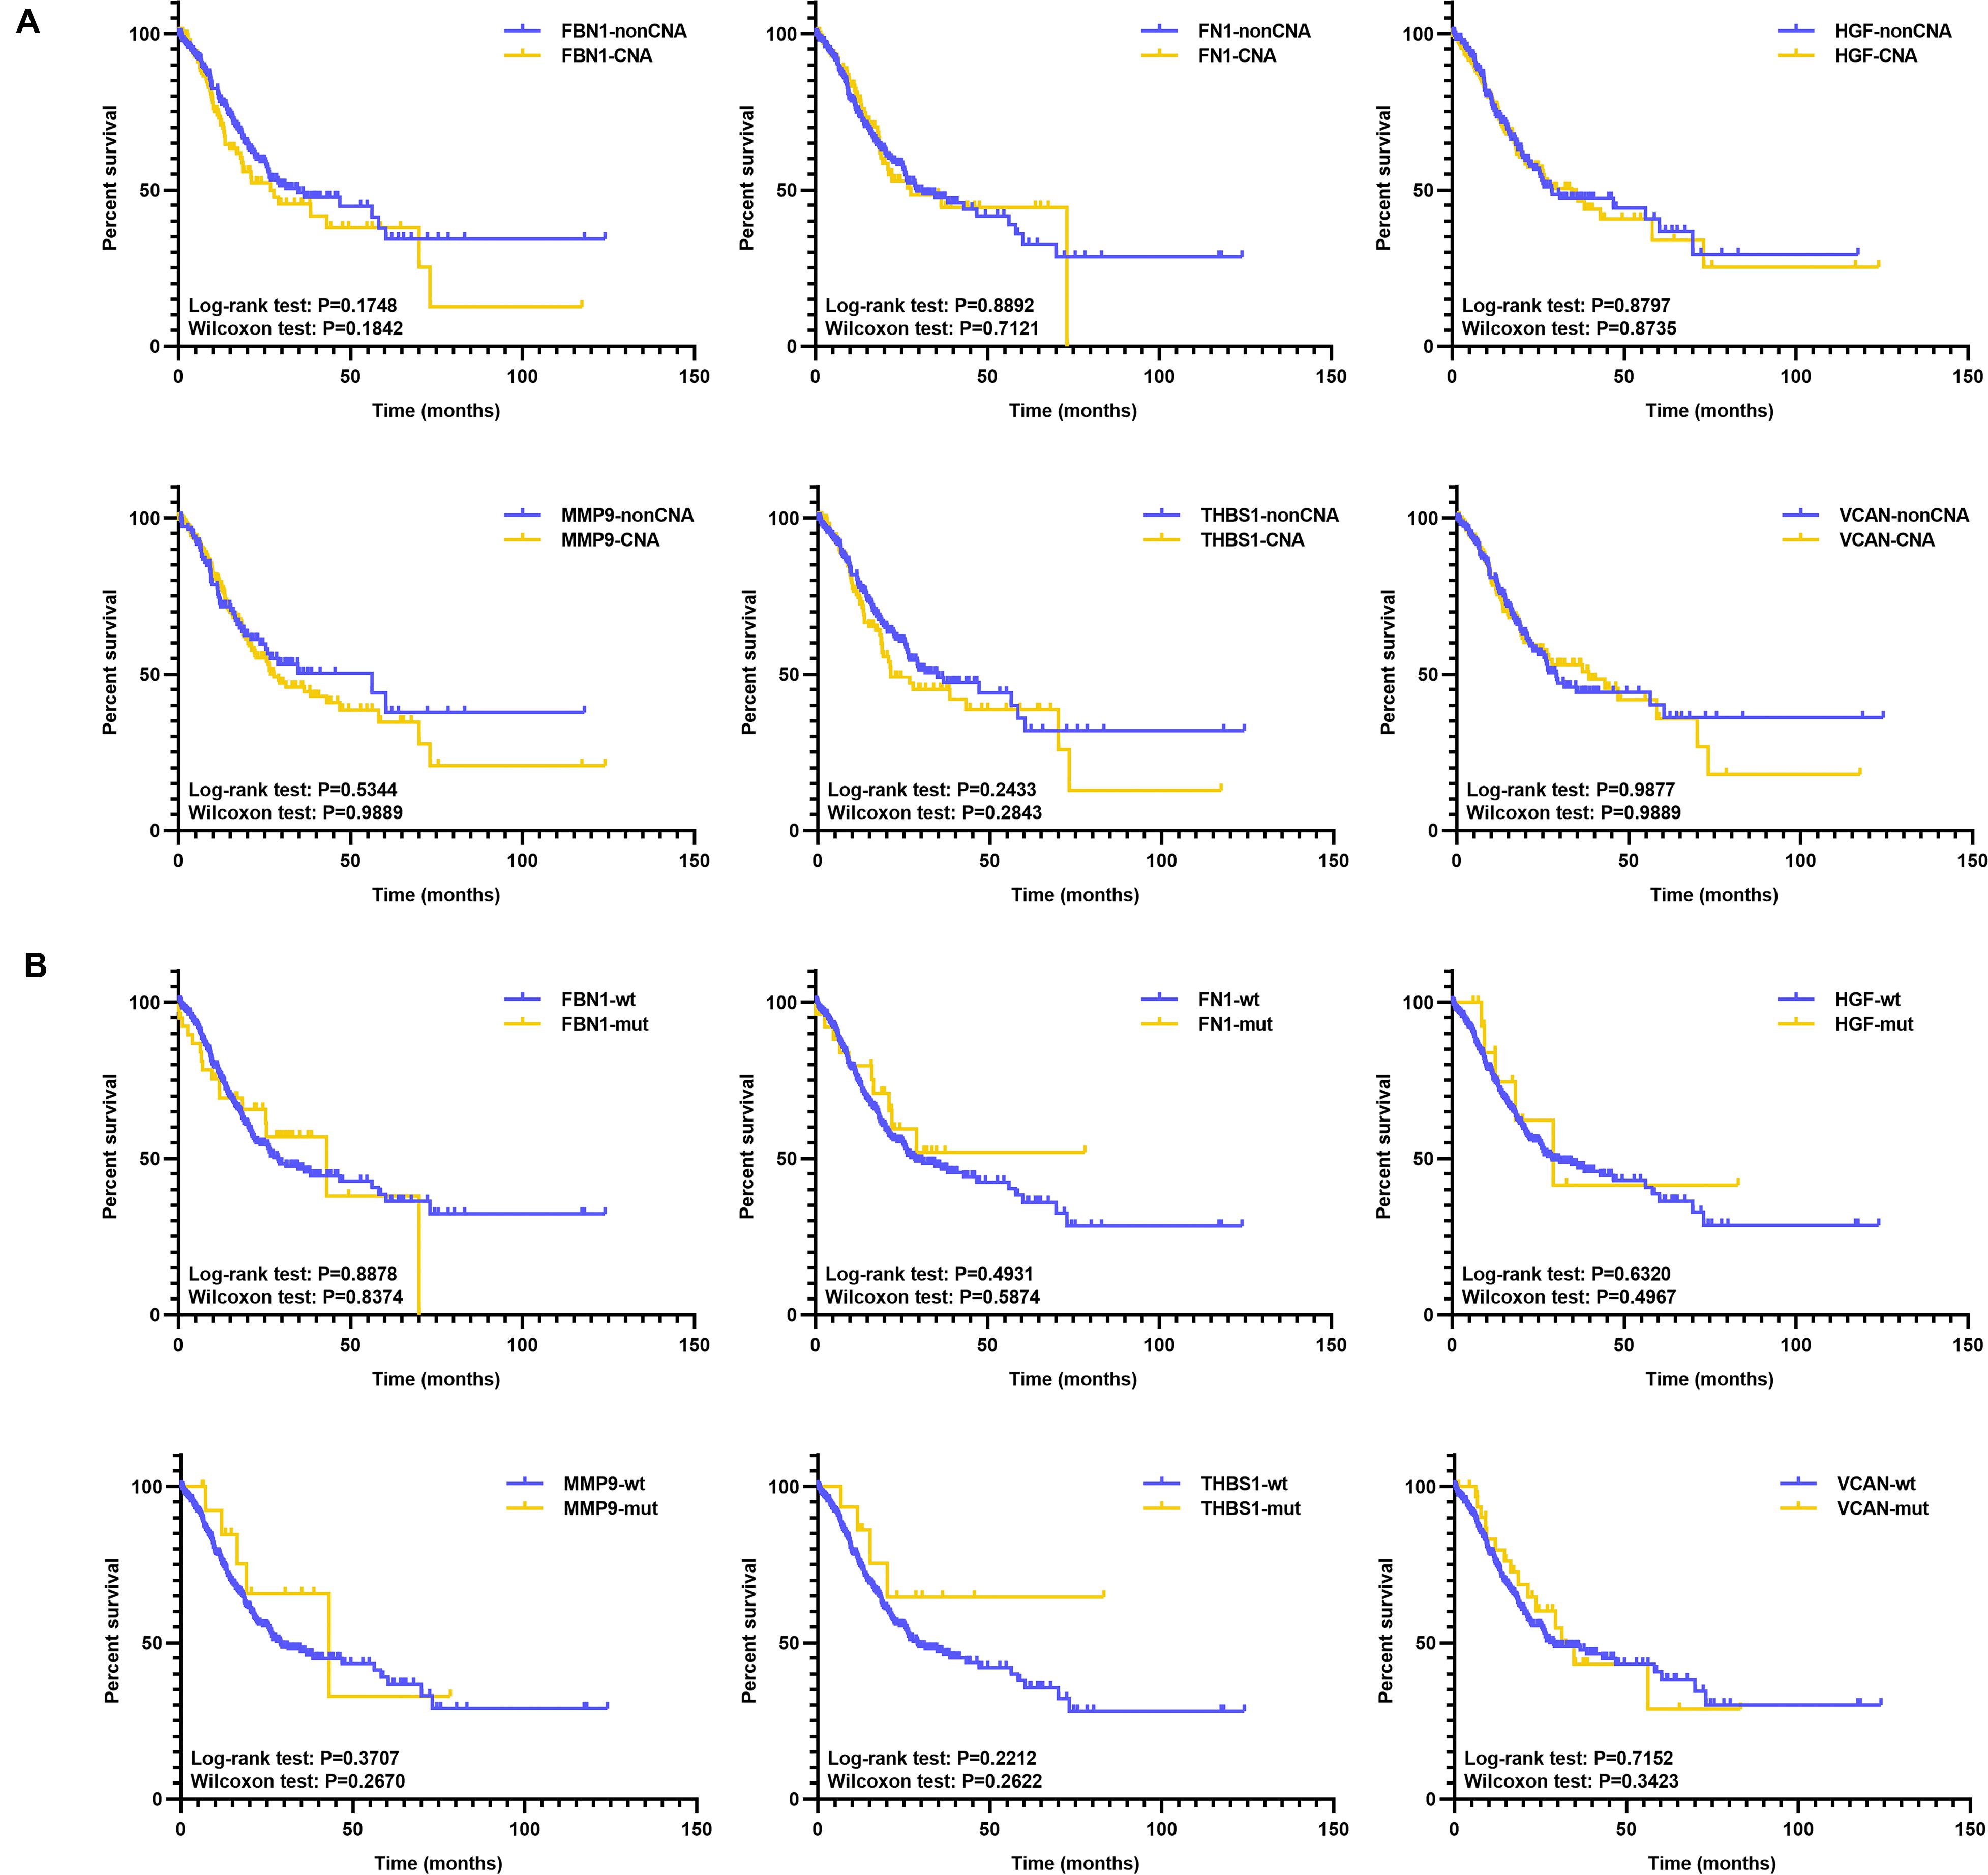
Figure 10. KM of target genes with mutation or CNA. (A) KM survival between the CNA and non-CNA group of target genes, (B) KM survival between the mutated and wild type group of target genes.
Target Genes and 10 Classic Oncogenic Signaling Pathways
Sanchez-Vega et al. (2018) showed that 10 oncogenic signaling pathways are altered in the TCGA pan-cancer atlas. The pathways were considered altered if any key pathway gene was changed (Sanchez-Vega et al., 2018). Here we cited the data of signaling pathways and gene alteration in the article, and explored the relationship between our target genes and these pathways. Indeed, the classic oncogenic pathways were found to be altered in different groups with respect to the mutation and CNA of our target genes.
Figures 11A,B shows that the mutation of target genes seemed to have no effect on the TP53 or MYC pathway. Mutations in all target genes displayed higher alterations in the HIPPO pathway. With exception of HGF, the mutation of target genes also showed higher alterations in the WNT, PI3K, and NOTCH pathways. In addition, mutation of FBN1 and MMP9 reflected higher alterations in the TGF pathway. Mutation of FBN1 and FN1 showed increased alterations of the RTK-RAS pathway. Mutation of FN1 showed increased alteration in NRF2 pathway. For HGF mutation, other than the HIPPO pathway, only the Cell cycle pathway had reduced alteration.
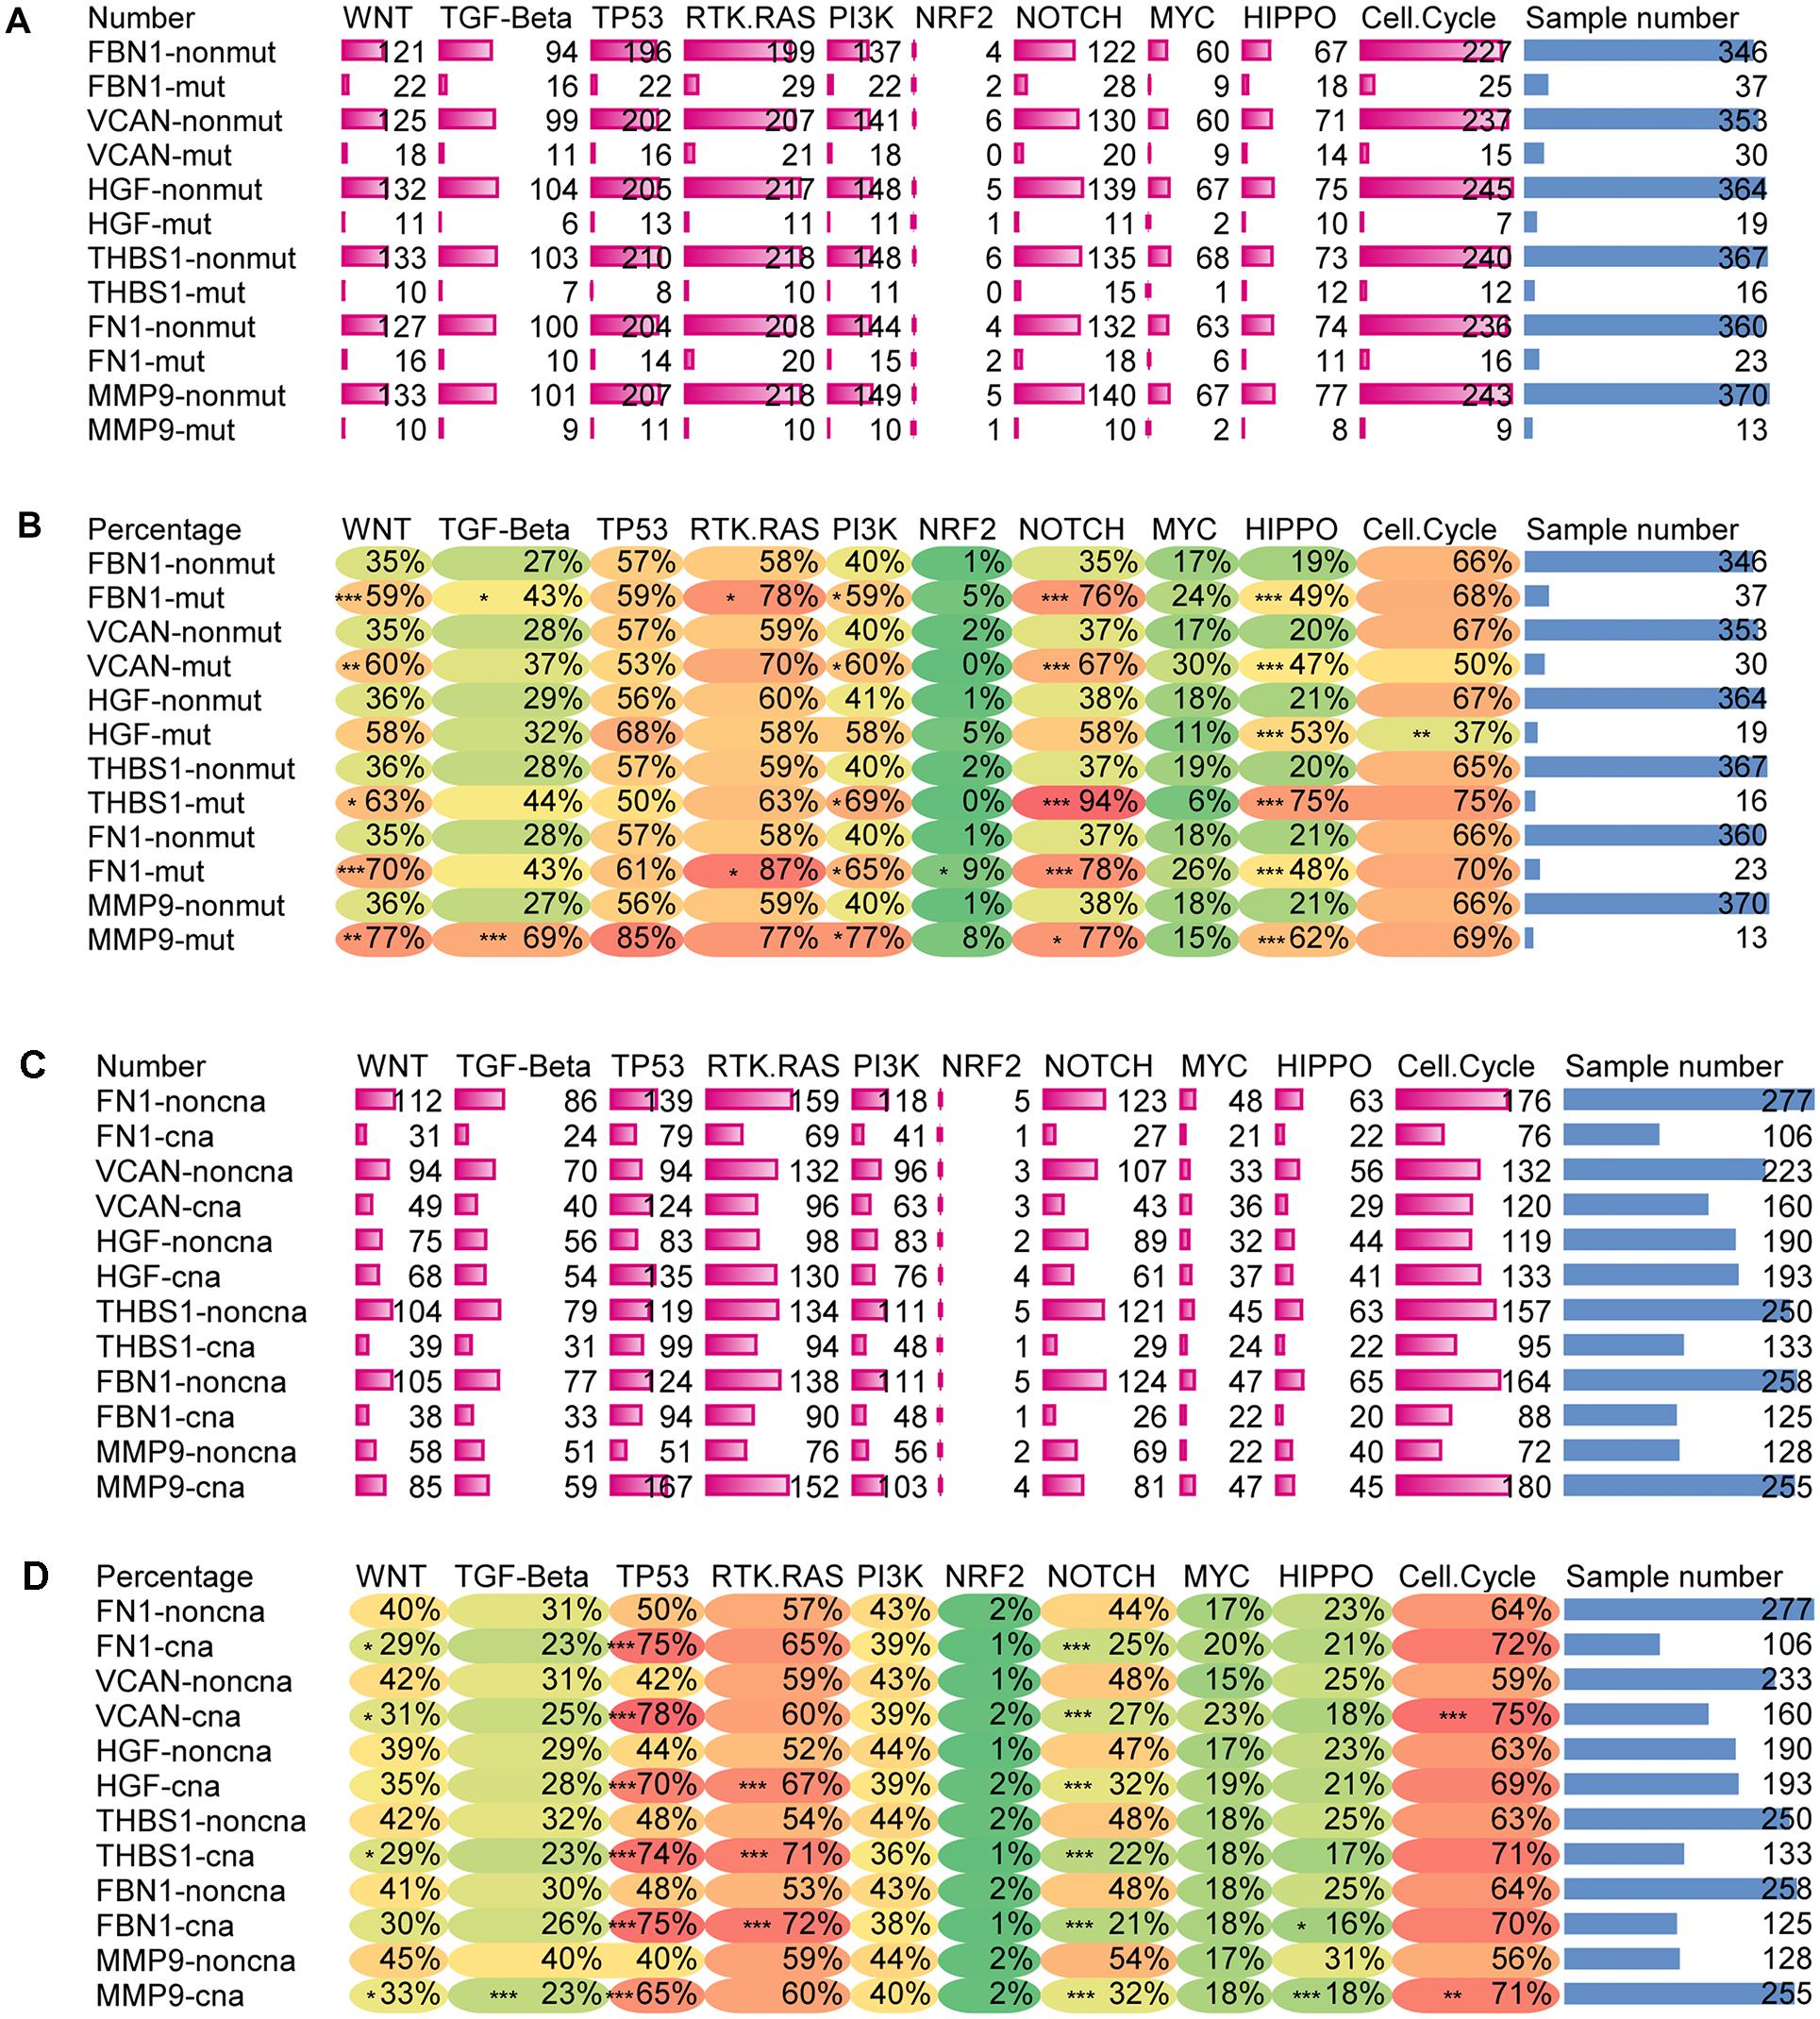
Figure 11. Alteration ratio of 10 signaling pathway in mutation and CNA groups. (A) Number of changes in each pathway for the mutated and wild type groups of target genes, (B) percentage of change numbers in each pathway for the mutated and wild type groups of target genes, (C) number of changes in each pathway for the CNA and non-CNA groups of target genes, (D) percentage of change numbers in each pathway for the CNA and non-CNA groups of target genes. ***P < 0.005; **P < 0.01; *P < 0.05.
Figures 11C,D shows that when CNA occurred in any of the target genes, the altered ratio of the TP53 pathway significantly increased while the altered ratio of the NOTCH pathway significantly decreased. In addition, alteration of the RAS pathway seemed to increase with the CNA of HGF, THBS1, and FBN1. Alteration of Cell cycle pathway also increased with the CNA of VCAN and MMP9. The CNA of FN1, THBS1, VCAN, and MMP9 reflected a decreased alteration of the WNT pathway. CNA of MMP9 displayed a decreased alteration in the TGF pathway and HIPPO pathway. CNA of FBN1 showed a reduced alteration in the HIPPO pathway. PI3K, NFR2, and MYC signaling pathways showed no significant alterations with the CNA of target genes.
This indicated that the CNA of target genes seemed to have more influence on the WNT, TP53, and NOTCH pathways. However, the mutation of target genes may have more influence on the WNT, PI3K, NOTCH, and HIPPO pathways. Taken together, these results showed that changes in the target genes could affect multiple signaling pathways.
Co-occurrence and Mutual Exclusivity Between Target Genes and Pathway Genes
Figure 12 shows the co-occurrence and mutual exclusivity between target genes and 187 genes from 10 pathways. Target genes exhibited co-occurrence with the key genes in these pathways and no significant mutual exclusivity (Supplementary Table S4). In addition, FN1 and FBN1 showed more co-occurrence with pathway genes, particularly from the NOTCH and HIPPO pathways. The other target genes also tended to co-occur with genes in the NOTCH and HIPPO pathways. Among the target genes, FBN1 most often co-occurred with FN1 and VCAN. MMP9 most often co-occurred with VCAN. HGF and THBS1 have little co-occurrence with other genes (Supplementary Table S4).
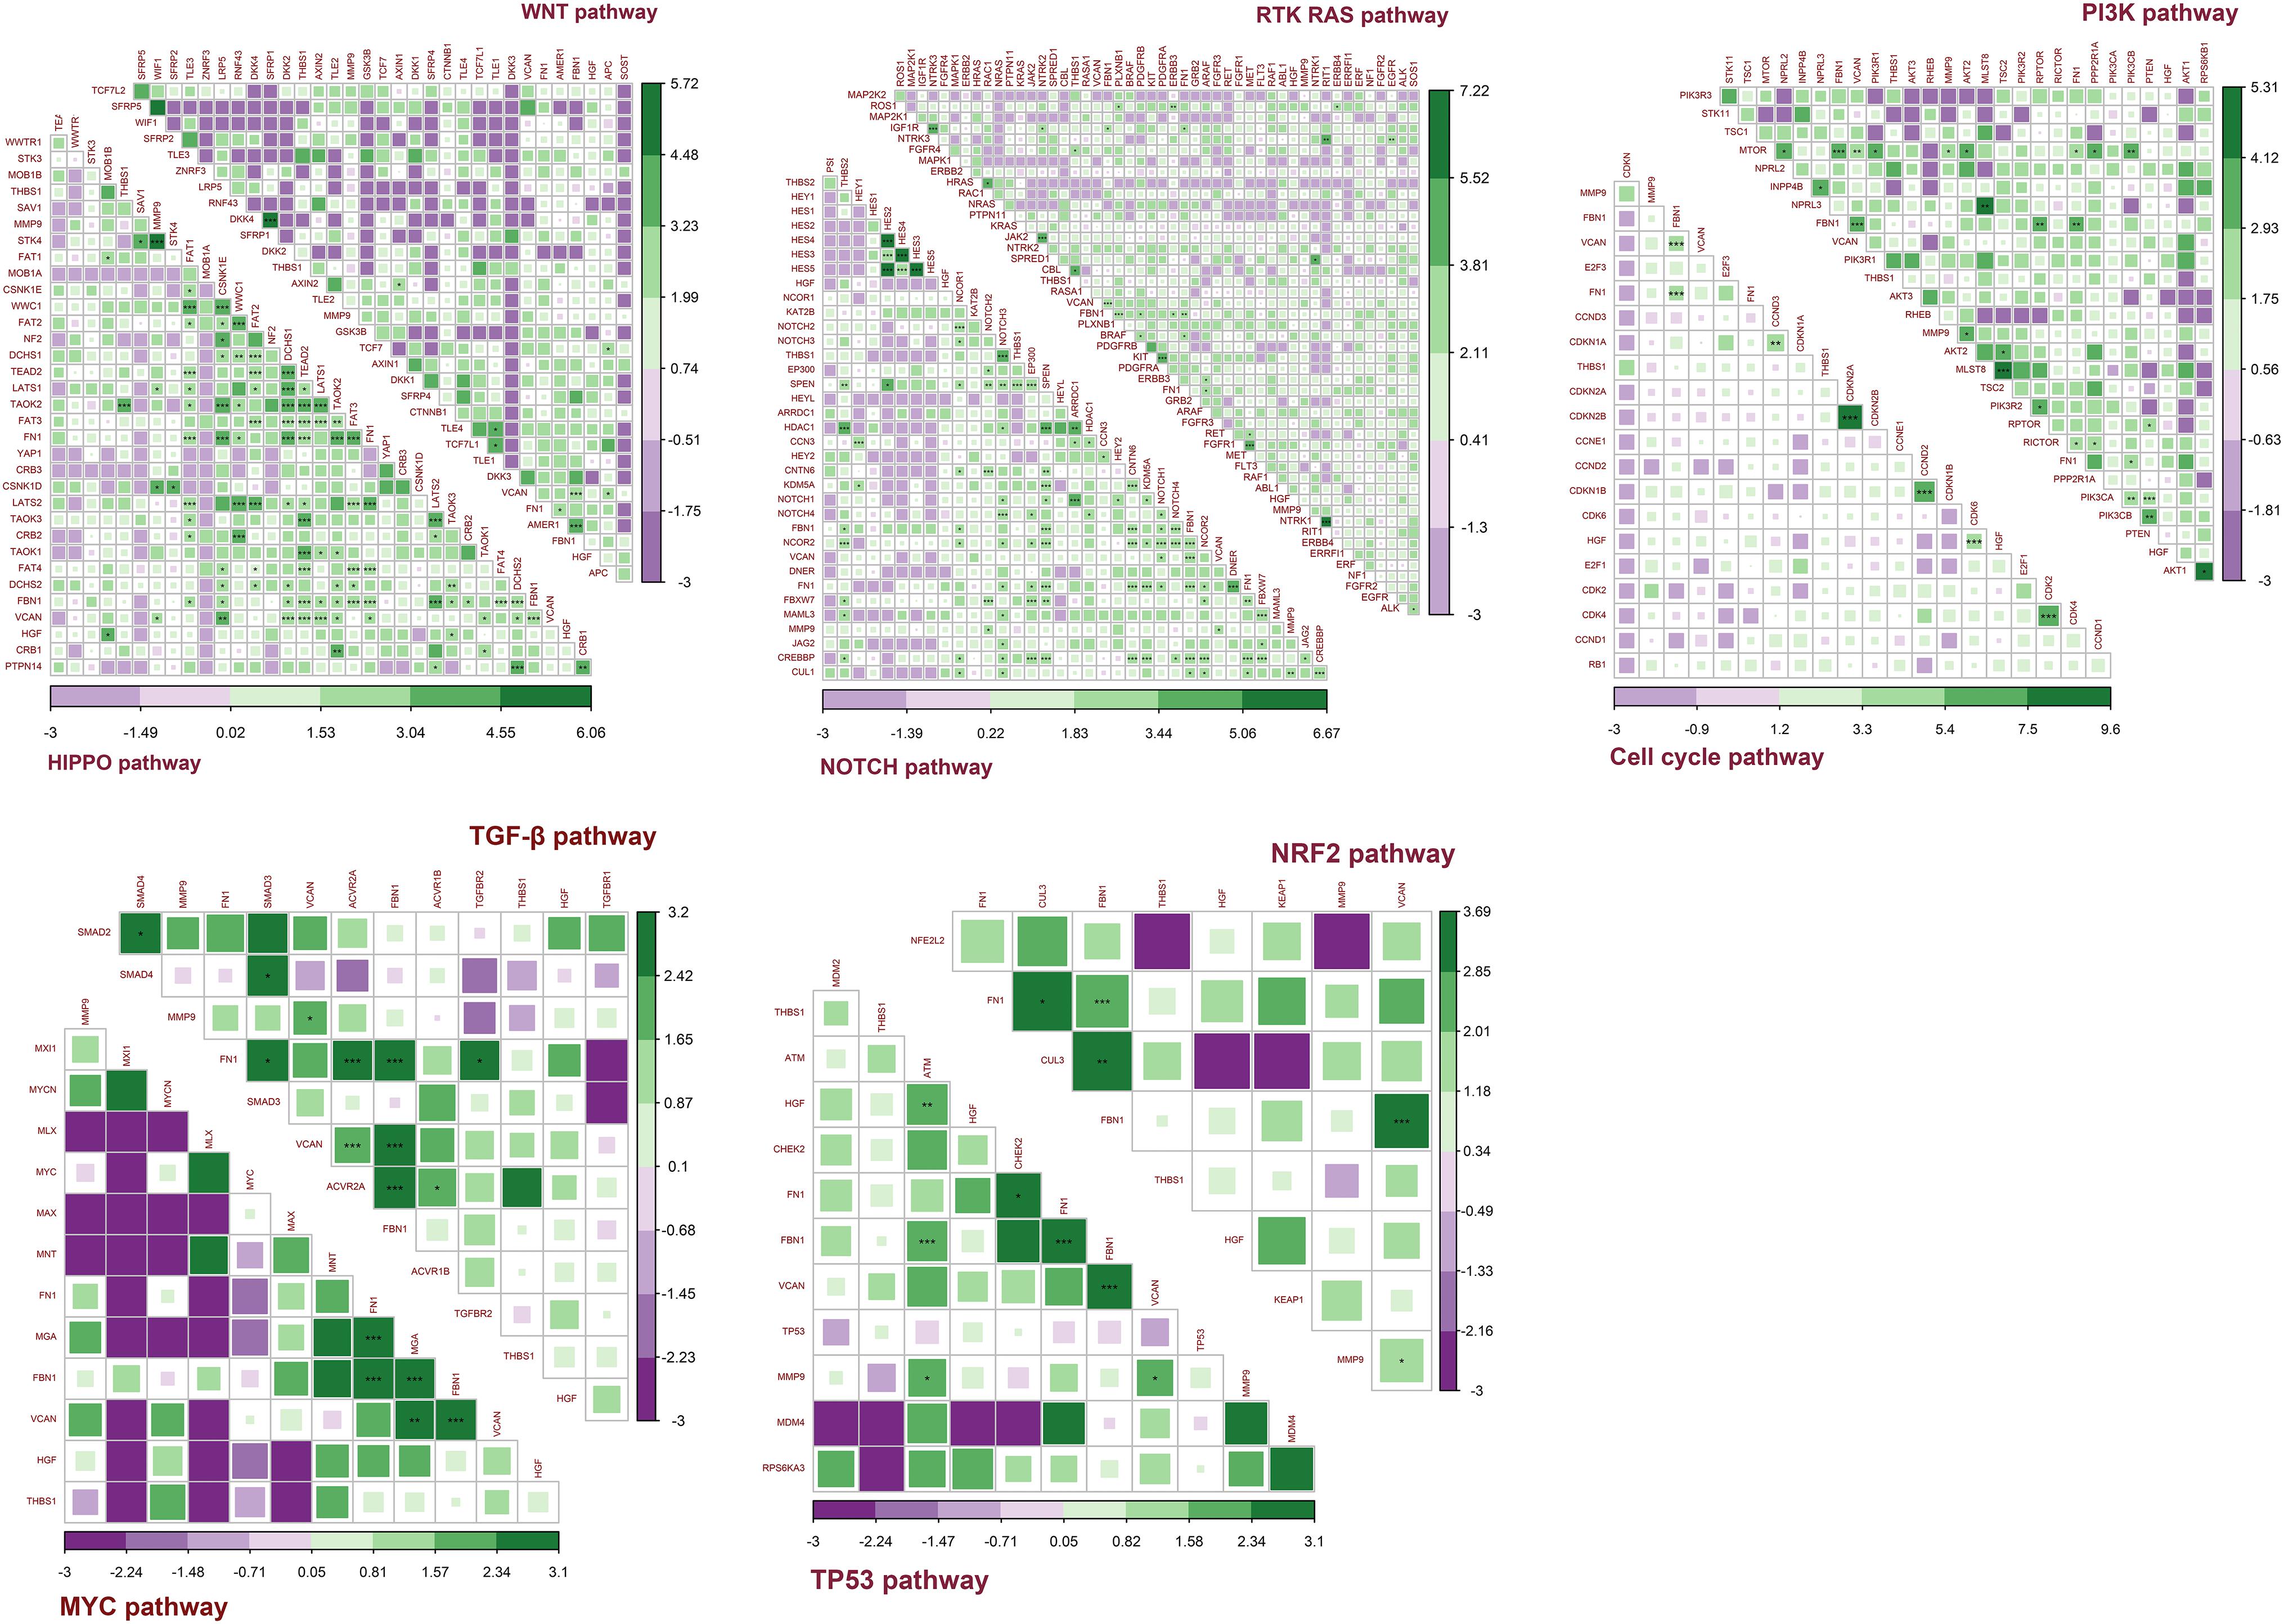
Figure 12. Co-occurrence and mutual exclusivity between target genes and key genes in each pathway. Green indicates co-occurrence and purple indicates mutual exclusivity; ***P < 0.005; **P < 0.01; *P < 0.05.
Together, these results indicated that the target genes always exhibited co-occurrence in GC, especially FBN1, FN1, and VCAN. The target genes exhibited more co-occurrence with key genes in the NOTCH and HIPPO pathways than other pathways.
Discussion
GC is a common malignant tumor with various factors causing high mortality rates and a low ratio of 5-year survival. Different treatment regimens have been adopted for GC patients at different stages. Even patients with the same pathological type, the outcomes of surgery and post-operative chemotherapy will be very different. Therefore, it has been urgent find new factors and targets in GC. In our study, we combined the GDSC, CCLE, and TCGA database to identify six new target genes (FBN1, FN1, HGF, MMP9, THBS1, and VCAN). A few of articles reflected that some indexes could affect the proliferation and invasion of GC by regulating HGF or MMP9 (Appleby et al., 2017; Matsumoto et al., 2017; Zhang et al., 2017; Ding et al., 2018; Wang R. et al., 2018), but the function of these six genes in GC was still not well-known, especially FBN1, FN1, and VCAN (Lee et al., 2016; Sakai et al., 2016; Wang J. et al., 2018; Jiang et al., 2019). By observing the relationships between target genes and important factors that have proven to affect the treatment and prognosis of GC, such as immune infiltration, tumor purity, TMB, TME score, and oncogenic signaling pathways, we expect that the six genes could be considered as new prognostic targets in GC.
In terms of mRNA, a high negative correlation was found between the target genes and purity and TME score. Studies have shown that as purity decreases, it becomes more challenging for drugs to penetrated into the tumor, leading to a lower recognition and elimination ratio by endogenous immune cells (Mao et al., 2018; Rhee et al., 2018). The TME score is an approach to estimate the microenvironment surrounding the tumor cells. Studies have found that higher TME scores show improved immune treatment and prognosis (Junttila and de Sauvage, 2013; Lazar et al., 2018; Zeng et al., 2019). In our study, all six genes, except MMP9, showed a significant negative correlation with tumor purity and TME score. Additionally, improved survival was observed in lower mRNA expression groups. Meanwhile, low mRNA expression of FBN1, THBS1, and VCAN was observed in earlier stages, and lower expression of all six genes, except MMP9, was observed in earlier grades. Taken together, this indicates that the lower expression of these target genes may play a role in improving tumor purity and TME to display a better prognosis of GC.
Regarding somatic mutation, significantly higher TMBs and TME scores were observed in groups with mutations in the target genes. TMB was calculated based on the number of mutations per gene. Patients with higher TMB have been found to have a better prognosis (Hellmann et al., 2018; Maleki Vareki, 2018; Wang F. et al., 2019; Kim et al., 2020). As the tumor reaches a higher TMB, it is more likely to have more neoantigens that could be recognized and killed by endogenous immune cells. Additionally, TME scores have been shown to have a positive correlation with TMB (Zeng et al., 2019). In our study, the mutation frequency of the target genes is shown in Figure 6. When the six genes have mutations, their mRNA expression level is not affected, but the TMB increased in all mutated groups. Additionally, higher TME scores were observed in all target genes except HGF. No significant difference was found for tumor purity, immune score, or stromal score. In addition, THBS1 mutations were associated with an earlier stage while the VCAN mutations were associated with a lower grade. Taken together, these results indicate that the mutation of these target genes may affect the clinical stage and grade, and improve the prognosis or treatment by affecting the TMB and TME score.
CNA primarily affects tumor purity. Five CNA types, including homozygous deletion, single copy deletion, normal copy, low amplification, and high amplification, were observed, with single copy deletion and low amplification being the most common. CNA of each target gene reflected higher tumor purity and lower immune and stromal scores. No significant difference was observed in TMB or TME score. In addition, the CNA of four target genes (FBN1, HGF, THBS1, and VCAN) led to lower mRNA expression of the gene compared to a normal group. Lower expression of target genes was associated with better prognosis, as shown in Figure 9. Therefore, we believe that the CNA of target genes may significantly reduce their mRNA expression and improve the purity of the tumor to affect the prognosis of GC.
To explore the possible pathways affected by the six target genes, we investigated the relationship between the target genes and 10 classic oncogenic signaling pathways that have been proven to play important roles in the occurrence and development of cancer (Joshi-Tope et al., 2005; Ciriello et al., 2013; Bahceci et al., 2017; Sanchez-Vega et al., 2018). The co-occurrence and mutual exclusivity between the key genes of each pathway and our target genes were calculated (Tyner et al., 2018). The target genes are related to multiple pathways. Mutations of the target genes can be accompanied by alterations in multiple pathways, including mutations, methylation, CNA, etc. In addition, the target genes tended to co-occur with key genes in the NOTCH and HIPPO pathways. Some genes that targets co-occurred with, such as BRAF, PDGFRB, APC, IGF1R, and MTOR, have been targeted by drugs to treat tumor progression (Wang et al., 2014; Kavuri et al., 2015; Long et al., 2015; Smyth et al., 2016; David et al., 2017; Zhang et al., 2018; Sullivan et al., 2019). In the clinical treatment of patients with alterations in the target genes, we can choose to study the classic pathway where these relevant pleiotropic genes are located to then apply relevant drugs for clinical treatment. This will further clarify our research and therapeutic directions, and enhance treatment.
In summary, FBN1, FN1, HGF, MMP9, THBS1, and VCAN can be used as new target genes to observe the prognosis of gastric cancer. The lower the expression, the better the prognosis. The mutation of target genes may affect the TMB and TME score of the tumor, while their CNA may make an impact on the purity of the tumor. By exploring the relationship between target genes and hub genes in oncogenic signaling pathways that they co-occur with, such as BRAF, PIK3CA, APC, MTOR, etc., that have been proven in targeted therapy, we can choose more suitably potential research mechanisms to improve the prognosis of GC. We will further collect clinical samples and study the mechanisms in detail through in vitro and in vivo experiments.
Data Availability Statement
Publicly available datasets were analyzed in this study. This data can be found here: https://portals.broadinstitute.org/ccle; https://www.cancerrxgene.org/; https://www.cancer.gov/; https://xena.ucsc.edu/.
Author Contributions
YL and L-PL were the guarantors and designed the study. YL, J-SW, and H-CW participated in the acquisition, analysis, and interpretation of the data, and drafted the initial manuscript. TZ participated in the statistics analysis. J-SW and L-PL completed the review and editing. All authors contributed to the article and approved the submitted version.
Funding
The article was supported by the Key Technology Research and Development Program of Shandong (Grant Nos. 2017GSF221018 and 2017G006007).
Conflict of Interest
The authors declare that the research was conducted in the absence of any commercial or financial relationships that could be construed as a potential conflict of interest.
Acknowledgments
We thank all authors for agreeing to share their data.
Supplementary Material
The Supplementary Material for this article can be found online at: https://www.frontiersin.org/articles/10.3389/fgene.2020.00865/full#supplementary-material
Abbreviations
5-FU, 5-Fluorourac; CCLE, Cancer Cell Line Encyclopedia; CNA, Copy Number Alteration; GC, Gastric Cancer; GDSC, Genomics of Drug Sensitivity in Cancer; GO-BP, Gene Ontology Biological process; GTEx, The Genotype-Tissue Expression; KM, Kaplan-Meier; STAD, Stomach Adenocarcinoma; TCGA, The Cancer Genome Atlas; TMB, Tumor Mutation Burden; TME, Tumor Microenvironment.
Footnotes
- ^ https://portals.broadinstitute.org/ccle
- ^ https://www.cancerrxgene.org/
- ^ https://www.cancer.gov/
- ^ http://gepia2.cancer-pku.cn/#index
- ^ https://xena.ucsc.edu/
- ^ https://david.ncifcrf.gov/
- ^ https://string-db.org/
- ^ https://cibersort.stanford.edu/
References
Appleby, T. C., Greenstein, A. E., Hung, M., Liclican, A., Velasquez, M., Villasenor, A. G., et al. (2017). Biochemical characterization and structure determination of a potent, selective antibody inhibitor of human MMP9. J. Biol. Chem. 292, 6810–6820. doi: 10.1074/jbc.M116.760579
Aran, D., Sirota, M., and Butte, A. J. (2015). Systematic pan-cancer analysis of tumour purity. Nat. Commun. 6:8971.
Bahceci, I., Dogrusoz, U., La, K. C., Babur, O., Gao, J., and Schultz, N. (2017). PathwayMapper: a collaborative visual web editor for cancer pathways and genomic data. Bioinformatics 33, 2238–2240. doi: 10.1093/bioinformatics/btx149
Bernini, M., and Bencini, L. (2012). Multimodal treatment of gastric cancer: surgery, chemotherapy, radiotherapy, and timing. Int. J. Surg. Oncol. 2012:246290. doi: 10.1155/2012/246290
Chen, B., Khodadoust, M. S., Liu, C. L., Newman, A. M., and Alizadeh, A. A. (2018). “Profiling Tumor Infiltrating Immune Cells with CIBERSORT,” in Cancer Systems Biology: Methods and Protocols, ed. L. von Stechow (New York, NY: Springer), 243–259.
Chin, C. H., Chen, S. H., Wu, H. H., Ho, C. W., Ko, M. T., and Lin, C. Y. (2014). cytoHubba: identifying hub objects and sub-networks from complex interactome. BMC Syst. Biol. 8(Suppl. 4):S11. doi: 10.1186/1752-0509-8-S4-S11
Ciriello, G., Miller, M. L., Aksoy, B. A., Senbabaoglu, Y., Schultz, N., and Sander, C. (2013). Emerging landscape of oncogenic signatures across human cancers. Nat. Genet. 45, 1127–1133. doi: 10.1038/ng.2762
Cui, Y., Li, Q., Li, H., Wang, Y., Wang, H., Chen, W., et al. (2017). Asparaginyl endopeptidase improves the resistance of microtubule-targeting drugs in gastric cancer through IQGAP1 modulating the EGFR/JNK/ERK signaling pathway. Onco Targets Ther. 10, 627–643. doi: 10.2147/OTT.S125579
Cutcutache, I., Wu, A. Y., Suzuki, Y., McPherson, J. R., Lei, Z., Deng, N., et al. (2016). Abundant copy-number loss of CYCLOPS and STOP genes in gastric adenocarcinoma. Gastric Cancer 19, 453–465. doi: 10.1007/s10120-015-0514-z
David, P., Smi, E. F., Harry, J. M. G., Julien, M., Besse, B., Åslaug, H., et al. (2017). Dabrafenib plus trametinib in patients with previously untreated BRAFV600E-mutant metastatic non-small-cell lung cancer: an open-label, phase 2 trial. Lancet Oncol. 18, 1307–1316. doi: 10.1016/s1470-2045(17)30679-4
Ding, X., Xi, W., Ji, J., Cai, Q., Jiang, J., Shi, M., et al. (2018). HGF derived from cancerassociated fibroblasts promotes vascularization in gastric cancer via PI3K/AKT and ERK1/2 signaling. Oncol. Rep. 40, 1185–1195. doi: 10.3892/or.2018.6500
Duarte, H. O., Freitas, D., Gomes, C., Gomes, J., Magalhaes, A., and Reis, C. A. (2016). Mucin-Type O-glycosylation in gastric carcinogenesis. Biomolecules 6:33. doi: 10.3390/biom6030033
Ferlay, J., Soerjomataram, I., Dikshit, R., Eser, S., Mathers, C., Rebelo, M., et al. (2015). Cancer incidence and mortality worldwide: sources, methods and major patterns in GLOBOCAN 2012. Int. J. Cancer 136, E359–E386. doi: 10.1002/ijc.29210
Geng, B., Pan, J., Zhao, T., Ji, J., Zhang, C., Che, Y., et al. (2018). Chitinase 3-like 1-CD44 interaction promotes metastasis and epithelial-to-mesenchymal transition through beta-catenin/Erk/Akt signaling in gastric cancer. J. Exp. Clin. Cancer Res. 37:208. doi: 10.1186/s13046-018-0876-2
Hellmann, M. D., Callahan, M. K., Awad, M. M., Calvo, E., Ascierto, P. A., Atmaca, A., et al. (2018). Tumor mutational burden and efficacy of nivolumab monotherapy and in combination with ipilimumab in small-cell lung cancer. Cancer Cell 33, 853,e4–861.e4.
Huang, Y. K., Wang, M., Sun, Y., Di Costanzo, N., Mitchell, C., Achuthan, A., et al. (2019). Macrophage spatial heterogeneity in gastric cancer defined by multiplex immunohistochemistry. Nat. Commun. 10:3928. doi: 10.1038/s41467-019-11788-4
Jiang, K., Liu, H., Xie, D., and Xiao, Q. (2019). Differentially expressed genes ASPN, COL1A1, FN1, VCAN and MUC5AC are potential prognostic biomarkers for gastric cancer. Oncol. Lett. 17, 3191–3202. doi: 10.3892/ol.2019.9952
Joshi-Tope, G., Gillespie, M., Vastrik, I., D’Eustachio, P., Schmidt, E., de Bono, B., et al. (2005). Reactome: a knowledgebase of biological pathways. Nucleic Acids Res. 33, D428–D432. doi: 10.1093/nar/gki072
Junttila, M. R., and de Sauvage, F. J. (2013). Influence of tumour micro-environment heterogeneity on therapeutic response. Nature 501, 346–354. doi: 10.1038/nature12626
Kamangar, F., Dores, G. M., and Anderson, W. F. (2006). Patterns of cancer incidence, mortality, and prevalence across five continents: defining priorities to reduce cancer disparities in different geographic regions of the world. J. Clin. Oncol. 24, 2137–2150. doi: 10.1200/JCO.2005.05.2308
Kavuri, S. M., Jain, N., Galimi, F., Cottino, F., Leto, S. M., Migliardi, G., et al. (2015). HER2 activating mutations are targets for colorectal cancer treatment. Cancer Discov. 5, 832–841. doi: 10.1158/2159-8290.CD-14-1211
Kim, J., Kim, B., Kang, S. Y., Heo, Y. J., Park, S. H., Kim, S. T., et al. (2020). Tumor mutational burden determined by panel sequencing predicts survival after immunotherapy in patients with advanced gastric cancer. Front. Oncol. 10:314. doi: 10.3389/fonc.2020.00314
Kunkler, I. (1994). Cancer of the upper gastrointestinal tract. Palliative chemotherapy unproved in advanced gastric cancer. BMJ 308, 1508–1509. doi: 10.1136/bmj.308.6942.1508b
Lazar, D. C., Avram, M. F., Romosan, I., Cornianu, M., Taban, S., and Goldis, A. (2018). Prognostic significance of tumor immune microenvironment and immunotherapy: novel insights and future perspectives in gastric cancer. World J. Gastroenterol. 24, 3583–3616. doi: 10.3748/wjg.v24.i32.3583
Lee, J. C., Su, S. Y., Changou, C. A., Yang, R. S., Tsai, K. S., Collins, M. T., et al. (2016). Characterization of FN1-FGFR1 and novel FN1-FGF1 fusion genes in a large series of phosphaturic mesenchymal tumors. Mod. Pathol. 29, 1335–1346. doi: 10.1038/modpathol.2016.137
Li, M., Spakowicz, D., Burkart, J., Patel, S., Husain, M., He, K., et al. (2019). Change in neutrophil to lymphocyte ratio during immunotherapy treatment is a non-linear predictor of patient outcomes in advanced cancers. J. Cancer Res. Clin. Oncol. 145, 2541–2546. doi: 10.1007/s00432-019-02982-4
Li, X., Zhang, W., and Chen, K. (2019). Tumor mutation load and frequently mutated genes in gastric cancer-in reply. JAMA Oncol. 5, 577–578. doi: 10.1001/jamaoncol.2019.0135
Li, X., Pasche, B., Zhang, W., and Chen, K. (2018). Association of MUC16 mutation with tumor mutation load and outcomes in patients with gastric cancer. JAMA Oncol. 4, 1691–1698. doi: 10.1001/jamaoncol.2018.2805
Li, Y., Guo, X. B., Wang, J. S., Wang, H. C., and Li, L. P. (2019). Function of fibroblast growth factor 2 in gastric cancer occurrence and prognosis. Mol. Med. Rep. 21, 575–582. doi: 10.3892/mmr.2019.10850
Liang, L., Fang, J. Y., and Xu, J. (2016). Gastric cancer and gene copy number variation: emerging cancer drivers for targeted therapy. Oncogene 35, 1475–1482. doi: 10.1038/onc.2015.209
Long, G. V., Stroyakovskiy, D., Gogas, H., Levchenko, E., and Braud, F. D. (2015). Dabrafenib and trametinib versus dabrafenib and placebo for Val600 BRAF-mutant melanoma: a multicentre, double-blind, phase 3 randomised controlled trial. Lancet 386, 444–451.
Maleki Vareki, S. (2018). High and low mutational burden tumors versus immunologically hot and cold tumors and response to immune checkpoint inhibitors. J. Immuno Ther. Cancer 6:157.
Mao, Y., Feng, Q., Zheng, P., Yang, L., Liu, T., Xu, Y., et al. (2018). Low tumor purity is associated with poor prognosis, heavy mutation burden, and intense immune phenotype in colon cancer. Cancer Manag. Res. 10, 3569–3577. doi: 10.2147/CMAR.S171855
Matsumoto, K., Umitsu, M., De Silva, D. M., Roy, A., and Bottaro, D. P. (2017). Hepatocyte growth factor/MET in cancer progression and biomarker discovery. Cancer Sci. 108, 296–307. doi: 10.1111/cas.13156
Mukai, S., Oue, N., Oshima, T., Imai, T., Sekino, Y., Honma, R., et al. (2017). Overexpression of PCDHB9 promotes peritoneal metastasis and correlates with poor prognosis in patients with gastric cancer. J. Pathol. 243, 100–110. doi: 10.1002/path.4931
Pan, J. H., Zhou, H., Cooper, L., Huang, J.-L., Zhu, S.-B., Zhao, X.-X., et al. (2019). LAYN is a prognostic biomarker and correlated with immune infiltrates in gastric and colon cancers. Front. Immunol. 10:6. doi: 10.3389/fimmu.2019.00006
Rhee, J. K., Jung, Y. C., Kim, K. R., Yoo, J., Kim, J., Lee, Y. J., et al. (2018). Impact of tumor purity on immune gene expression and clustering analyses across multiple cancer types. Cancer Immunol. Res. 6, 87–97. doi: 10.1158/2326-6066.CIR-17-0201
Sakai, L. Y., Keene, D. R., Renard, M., and De Backer, J. (2016). FBN1: the disease-causing gene for Marfan syndrome and other genetic disorders. Gene 591, 279–291. doi: 10.1016/j.gene.2016.07.033
Sanchez-Vega, F., Mina, M., Armenia, J., Chatila, W. K., Luna, A., La, K. C., et al. (2018). Oncogenic signaling pathways in the cancer genome atlas. Cell 173, 321.e10–337.e10. doi: 10.1016/j.cell.2018.03.035
Smyth, M. J., Ngiow, S. F., Ribas, A., and Teng, M. W. (2016). Combination cancer immunotherapies tailored to the tumour microenvironment. Nat. Rev. Clin. Oncol. 13, 143–158. doi: 10.1038/nrclinonc.2015.209
Sullivan, R. J., Hamid, O., Gonzalez, R., Infante, J. R., Patel, M. R., Hodi, F. S., et al. (2019). Atezolizumab plus cobimetinib and vemurafenib in BRAF-mutated melanoma patients. Nat. Med. 25, 929–935. doi: 10.1038/s41591-019-0474-7
Tyner, J. W., Tognon, C. E., Bottomly, D., Wilmot, B., Kurtz, S. E., Savage, S. L., et al. (2018). Functional genomic landscape of acute myeloid leukaemia. Nature 562, 526–531. doi: 10.1038/s41586-018-0623-z
van de Velde, C. J. (2008). Current role of surgery and multimodal treatment in localized gastric cancer. Ann. Oncol. 19(Suppl. 5), v93–v98. doi: 10.1093/annonc/mdn319
Wang, F., Wei, X. L., Wang, F. H., Xu, N., Shen, L., Dai, G. H., et al. (2019). Safety, efficacy and tumor mutational burden as a biomarker of overall survival benefit in chemo-refractory gastric cancer treated with toripalimab, a PD-1 antibody in phase Ib/II clinical trial NCT02915432. Ann. Oncol. 30, 1479–1486. doi: 10.1093/annonc/mdz197
Wang, J., Gao, P., Song, Y., Sun, J., Chen, X., Yu, H., et al. (2018). Prognostic value of gastric cancer-associated gene signatures: evidence based on a meta-analysis using integrated bioinformatics methods. J. Cell. Mol. Med. 22, 5743–5747. doi: 10.1111/jcmm.13823
Wang, R., Deng, X., Yuan, C., Xin, H., Liu, G., Zhu, Y., et al. (2018). IFT80 improves invasion ability in gastric cancer cell line via ift80/p75NGFR/MMP9 signaling. Int. J. Mol. Sci. 19:3616. doi: 10.3390/ijms19113616
Wang, W., Lou, W., Ding, B., Yang, B., Lu, H., Kong, Q., et al. (2019). A novel mRNA-miRNA-lncRNA competing endogenous RNA triple sub-network associated with prognosis of pancreatic cancer. Aging 11, 2610–2627. doi: 10.18632/aging.101933
Wang, Z., Martin, D., Molinolo, A. A., Patel, V., Iglesias-Bartolome, R., Degese, M. S., et al. (2014). mTOR co-targeting in cetuximab resistance in head and neck cancers harboring PIK3CA and RAS mutations. J. Natl. Cancer Inst. 106:dju215. doi: 10.1093/jnci/dju215
Yan, H. H. N., Siu, H. C., Law, S., Ho, S. L., Yue, S. S. K., Tsui, W. Y., et al. (2018). A comprehensive human gastric cancer organoid biobank captures tumor subtype heterogeneity and enables therapeutic screening. Cell Stem Cell 23, 882.e11–897.e11. doi: 10.1016/j.stem.2018.09.016
Yoshihara, K., Shahmoradgoli, M., Martínez, E., Vegesna, R., Kim, H., Torres-Garcia, W., et al. (2013). Inferring tumour purity and stromal and immune cell admixture from expression data. Nat. Commun. 4:2612.
Zeng, D., Li, M., Zhou, R., Zhang, J., Sun, H., Shi, M., et al. (2019). Tumor microenvironment characterization in gastric cancer identifies prognostic and immunotherapeutically relevant gene signatures. Cancer Immunol. Res. 7, 737–750. doi: 10.1158/2326-6066.CIR-18-0436
Zeng, D., Zhou, R., Yu, Y., Luo, Y., Zhang, J., Sun, H., et al. (2018). Gene expression profiles for a prognostic immunoscore in gastric cancer. Br. J. Surg. 105, 1338–1348. doi: 10.1002/bjs.10871
Zhang, H., Deng, T., Liu, R., Bai, M., Zhou, L., Wang, X., et al. (2017). Exosome-delivered EGFR regulates liver microenvironment to promote gastric cancer liver metastasis. Nat. Commun. 8:15016. doi: 10.1038/ncomms15016
Keywords: gastric cancer, prognosis, mutation, CNA, purity, TMB, TME score
Citation: Li Y, Wang J-S, Zhang T, Wang H-C and Li L-P (2020) Identification of New Therapeutic Targets for Gastric Cancer With Bioinformatics. Front. Genet. 11:865. doi: 10.3389/fgene.2020.00865
Received: 04 June 2020; Accepted: 16 July 2020;
Published: 18 August 2020.
Edited by:
Pietro Zoppoli, Oncological Center of Basilicata (IRCCS), ItalyReviewed by:
Sabino Russi, Oncological Center of Basilicata (IRCCS), ItalyMulong Du, Nanjing Medical University, China
Copyright © 2020 Li, Wang, Zhang, Wang and Li. This is an open-access article distributed under the terms of the Creative Commons Attribution License (CC BY). The use, distribution or reproduction in other forums is permitted, provided the original author(s) and the copyright owner(s) are credited and that the original publication in this journal is cited, in accordance with accepted academic practice. No use, distribution or reproduction is permitted which does not comply with these terms.
*Correspondence: Le-Ping Li, bGVwaW5nZG9jdG9yQDEyNi5jb20=