 Yan Song1
 Changliang Peng
- 1Department of Nephrology, The Second Hospital, Cheeloo College of Medicine, Shandong University, Jinan, China
- 2Department of Hematology, The Second Hospital, Cheeloo College of Medicine, Shandong University, Jinan, China
- 3Institute of Medical Sciences, The Second Hospital, Cheeloo College of Medicine, Shandong University, Jinan, China
- 4Department of Pathology, The Second Hospital, Cheeloo College of Medicine, Shandong University, Jinan, China
- 5Central Research Laboratory, The Second Hospital, Cheeloo College of Medicine, Shandong University, Jinan, China
- 6Department of Orthopedics, The Second Hospital, Cheeloo College of Medicine, Shandong University, Jinan, China
Synovial sarcoma (SS) is a highly aggressive soft tissue tumor with high risk of local recurrence and metastasis. However, the mechanisms underlying SS metastasis are still largely unclear. The purpose of this study is to screen metastasis-associated biomarkers in SS by integrated bioinformatics analysis. Two mRNA datasets (GSE40018 and GSE40021) were selected to analyze the differentially expressed genes (DEGs). Using the Database for Annotation, Visualization and Integrated Discovery (DAVID) and gene set enrichment analysis (GSEA), functional and pathway enrichment analyses were performed for DEGs. Then, the protein-protein interaction (PPI) network was constructed via the Search Tool for the Retrieval of Interacting Genes (STRING) database. The module analysis of the PPI network and hub genes validation were performed using Cytoscape software. Gene Ontology (GO) and Kyoto Encyclopedia of Genes and Genomes (KEGG) pathway analysis of the hub genes were performed using WEB-based GEne SeT AnaLysis Toolkit (WebGestalt). The expression levels and survival analysis of hub genes were further assessed through Gene Expression Profiling Interactive Analysis (GEPIA) and the Kaplan-Meier plotter database. In total, 213 overlapping DEGs were identified, of which 109 were upregulated and 104 were downregulated. GO analysis revealed that the DEGs were predominantly involved in mitosis and cell division. KEGG pathways analysis demonstrated that most DEGs were significantly enriched in cell cycle pathway. GSEA revealed that the DEGs were mainly enriched in oocyte meiosis, cell cycle and DNA replication pathways. A key module was identified and 10 hub genes (CENPF, KIF11, KIF23, TTK, MKI67, TOP2A, CDC45, MELK, AURKB, and BUB1) were screened out. The expression and survival analysis disclosed that the 10 hub genes were upregulated in SS patients and could result in significantly reduced survival. Our study identified a series of metastasis-associated biomarkers involved in the progression of SS, and may provide novel therapeutic targets for SS metastasis.
Introduction
Synovial sarcoma (SS) ranks the fourth most common form of soft tissue sarcoma (STS), comprising nearly 10% of total STSs worldwide. As an aggressive high-grade malignancy, SS predominantly affects children, adolescents and young adults. SS harbors the unique chromosomal translocation t(X;18) (p11.2; q11.2) which results in the formation of a fusion protein, SS18-SSX (Svejstrup, 2013). It has been demonstrated that the SS18-SSX fusion protein is the oncogenic driver in the development of SS (Nagai et al., 2001). And the underlying mechanism is considered to be that this fusion protein preferentially affects the cell growth, cell proliferation, cell invasion and metastasis, TP53 pathway, and chromatin remodeling mechanisms (Przybyl et al., 2012). Nowadays, radical surgery combined with radiotherapy and/or chemotherapy is the mainstay of therapy for localized SS (Desar et al., 2018). Despite the improvements in these treatments in the past two decades, about 49% of SS patients eventually develop local recurrence and/or distant metastasis (Krieg et al., 2011). Thus, it is urgent to identify the molecules that regulate SS metastasis, which would provide novel therapeutic targets for the treatment of SS.
To date, there are a variety of biomarkers considered to play important roles in SS metastasis, nevertheless, only few of them have been externally identified as statistically significant predictors of survival for SS patients, such as SS18-SSX (Sun et al., 2009), P300 (Liu et al., 2019), SHCBP1 (Peng et al., 2017), VEGF (Feng et al., 2018), SUZ12 (Cho et al., 2018), EDD1 (Cho et al., 2018), EZH2 (Yalcinkaya et al., 2017), FOXM1 (Maekawa et al., 2016), IGFBP7 (Benassi et al., 2015), MRP1 (Martin-Broto et al., 2014), p27 (Kawauchi et al., 2001), E-cadherin (Saito et al., 2000), HGF/c-MET (Oda et al., 2000), etc. Moreover, the interactions among these biomarkers in SS are not investigated by integrated analysis. More importantly, the differential expression of metastasis-associated genes between SS patients with and without metastasis is not explored.
Based on bioinformatics analysis, the present study aimed at screening critical metastasis-associated biomarkers of SS, identifying hub genes in protein-protein interaction (PPI) networks, and evaluating their prognostic significance for predicting survival and metastasis in patients with SS. Two mRNA datasets (GSE40018 and GSE40021) were selected to screen the differentially expressed genes (DEGs) between metastasis SS samples and non-metastasis SS samples. To assess the underlying molecular mechanism that regulates SS metastasis, the DEGs were further analyzed by Gene Ontology (GO), Kyoto Encyclopedia of Genes and Genomes (KEGG) pathway, using the Database for Annotation, Visualization and Integrated Discovery (DAVID) and gene set enrichment analysis (GSEA). By constructing PPI network and using the Search Tool for the Retrieval of Interacting Genes (STRING) database and Cytoscape software, a key module was then screened out from the whole network, and based on the key module, the hub genes were identified. Subsequently, GO and KEGG pathway analysis of the identified hub genes were performed using the WEB-based GEne SeT AnaLysis Toolkit (WebGestalt) online tool. Finally, the expression and survival analysis of the hub genes were carried out by Gene Expression Profiling Interactive Analysis (GEPIA) and Kaplan-Meier plotter (KM plotter) online database, respectively. This study identified several potentially critical metastasis-associated biomarkers involved in the progress of SS, which may provide novel targets for anti-metastatic therapeutics in SS.
Materials and Methods
Microarray Data
The microarray expression data of GSE40018 and GSE40021 were obtained from the Gene Expression Omnibus database (GEO1). The dataset GSE40018 based on the platform of GPL13497 platform (Agilent-026652 Whole Human Genome Microarray 4 × 44K v2) including 17 non-metastasis SS samples and 17 metastasis SS samples. The dataset GSE40021 based on the platform of GPL6480 platform (Agilent-014850 Whole Human Genome Microarray 4 × 44K G4112F) containing 30 non-metastasis SS samples and 28 metastasis SS samples.
DEGs Analysis
To screen the DEGs between non-metastasis SS samples and metastasis SS samples, we used the GEO2R online web tool2, which allows users to compare different gene expression data of two or more groups of samples. Adjusted p-value < 0.05 and | log (FC)| ≥ 1.0 were set as the thresholds for identifying DEGs. DEGs with logFC > 0 were considered as upregulated genes, and those with logFC < 0 were classified as downregulated genes. To identify the intersectional genes between GSE40018 and GSE40021, the Venny 2.1 online web tool3 was used to create a Venn diagram. Heatmaps of the DEGs were generated by HemI software (Version 1.0.3.7) (Deng et al., 2014), a toolkit for illustrating heatmaps.
Go Functional and Pathway Enrichment Analyses
Based on the DAVID database4 (Version 6.8), we analyzed GO and KEGG pathway enrichment analyses for the DEGs. GO terms enrichment analysis were categorized into biological process (BP), cellular component (CC), and molecular function (MF). Benjamini-Hochberg false discovery rate (FDR) < 0.05 was specified for statistical significance.
GSEA
GO and KEGG pathway enrichment analyses for the DEGs were further performed using GSEA 4.0 software, which was downloaded from GSEA home5 and run in a Java environment. The GSEA analysis was carried out as previously described (Subramanian et al., 2005). Samples from GSE40021 were classified into two groups as metastasis group and non-metastasis group, and meanwhile the DEGs were also separated into two groups as upregulated group and downregulated group. The number and type of permutations was defined as “1000” and “phenotype,” respectively. After that the c5.bp.v7.0.symbols.gmt, c5.cc.v7.0.symbols.gmt, c5.mf.v7.0.symbols.gmt and c2.cp.kegg.v7.0.symbols.gmt downloaded from the Molecular Signatures Database (MSigDB) (Liberzon et al., 2015) were chosen as the reference gene sets to perform GSEA analysis. The cut-off criteria were set as nominal P < 0.05, FDR q-value < 0.25 and enrichment score (ES) > 0.6.
PPI Network Construction and Module Analysis
The STRING database6 was used to characterize the PPI network of DEGs, and the combined score > 0.4 was used as the cut-off criteria. The PPI network was then mapped using Cytoscape software (Version 3.7.2). In order to screen the most significant module of PPI network, the Molecular Complex Detection (MCODE) plugin (Version 1.6.1) in Cytoscape was carried out with MCODE scores > 5, degree cut-off = 2, node score cut-off = 0.2, k-core = 2 and max. depth = 100 (Bader and Hogue, 2003). After that, GO functional analysis of DEGs in the most significant module was performed using Cytoscape ClueGO (Version 2.5.7) and CluePedia (Version 1.5.7) plugins with a threshold value of FDR < 0.05 and κ-coefficient of 0.4 (Bindea et al., 2009, 2013).
Hub Genes Selection and Analysis
The hub genes were selected from the above most significant module network using the Cytoscape CytoHubba plugin (Version 0.1). Genes with a degree ≥ 10 were defined as hub genes. Also, if an adjusted p-value < 0.05, the selection of the hub genes is considered statistically significant. Here, the genes with the top 10 highest degree values were considered as real hub genes. Meanwhile, GO and KEGG pathway enrichment analyses were carried out for the top 10 hub genes using the WebGestalt7 with a threshold of FDR < 0.05.
Survival Analysis
The comparison of the identified hub genes expression between tumor and normal samples of SS was analyzed through GEPIA8 (Tang et al., 2017), a public database for cancer and normal gene expression profiling and interactive analyses. A difference or result with p-value < 0.05 and |Log2FC| > 1 was regarded as statistically significant. The prognostic values of these hub genes for SS patients were further validated through KM plotter database9. Database including 259 patients with relapse-free and overall survival information was used for validation. Briefly, patients were categorized into two groups (high expression and low expression) according to the median of each hub gene expression. Subsequently, the identified hub genes were imported into the database, and the Kaplan-Meier survival plots were then generated and the hazard ratio (HR) and its associated 95% confidence intervals (CI) and log rank test P value were calculated. Log-rank test results with P < 0.05 were considered as statistically significant.
Results
Identification of DEGs
By using the GEO2R online tool from the GEO, we found that there were 804 DEGs (317 upregulated and 487 downregulated) in GSE40018, 1200 DEGs (374 upregulated and 826 downregulated) in GSE40021, which were differentially expressed between metastasis SS samples and non-metastasis SS samples as shown by volcano plots in Figures 1A,B. Further analysis of these DEGs by using Venn diagram, we found that there were 213 overlapping DEGs including 109 upregulated and 104 downregulated genes between the two datasets (Figure 2A; Table 1), which were identified according to the cut-off criteria (adjusted p-value < 0.05 and | logFC| ≥ 1). Meanwhile, the 213 overlapping DEGs in GSE40018 and GSE40021 were displayed in a heatmap (Figure 2B).
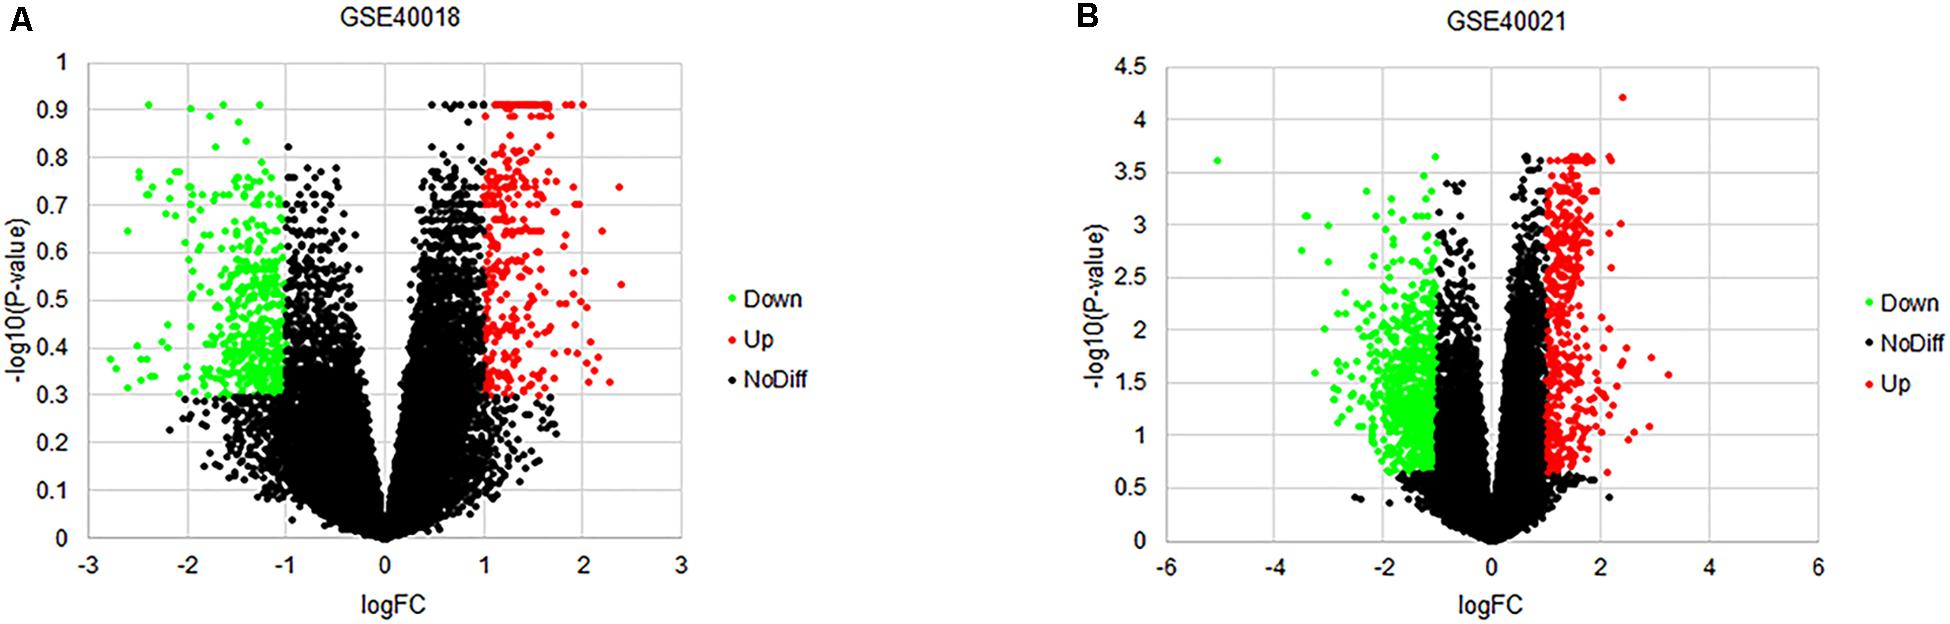
Figure 1. Volcano plots of DEGs detected from the datasets of GSE40018 and GSE40021. (A) GSE40018, (B) GSE40021. The red dots represent upregulated DEGs; the green dots mean downregulated DEGs; the black dots denote no differentially expressed genes.
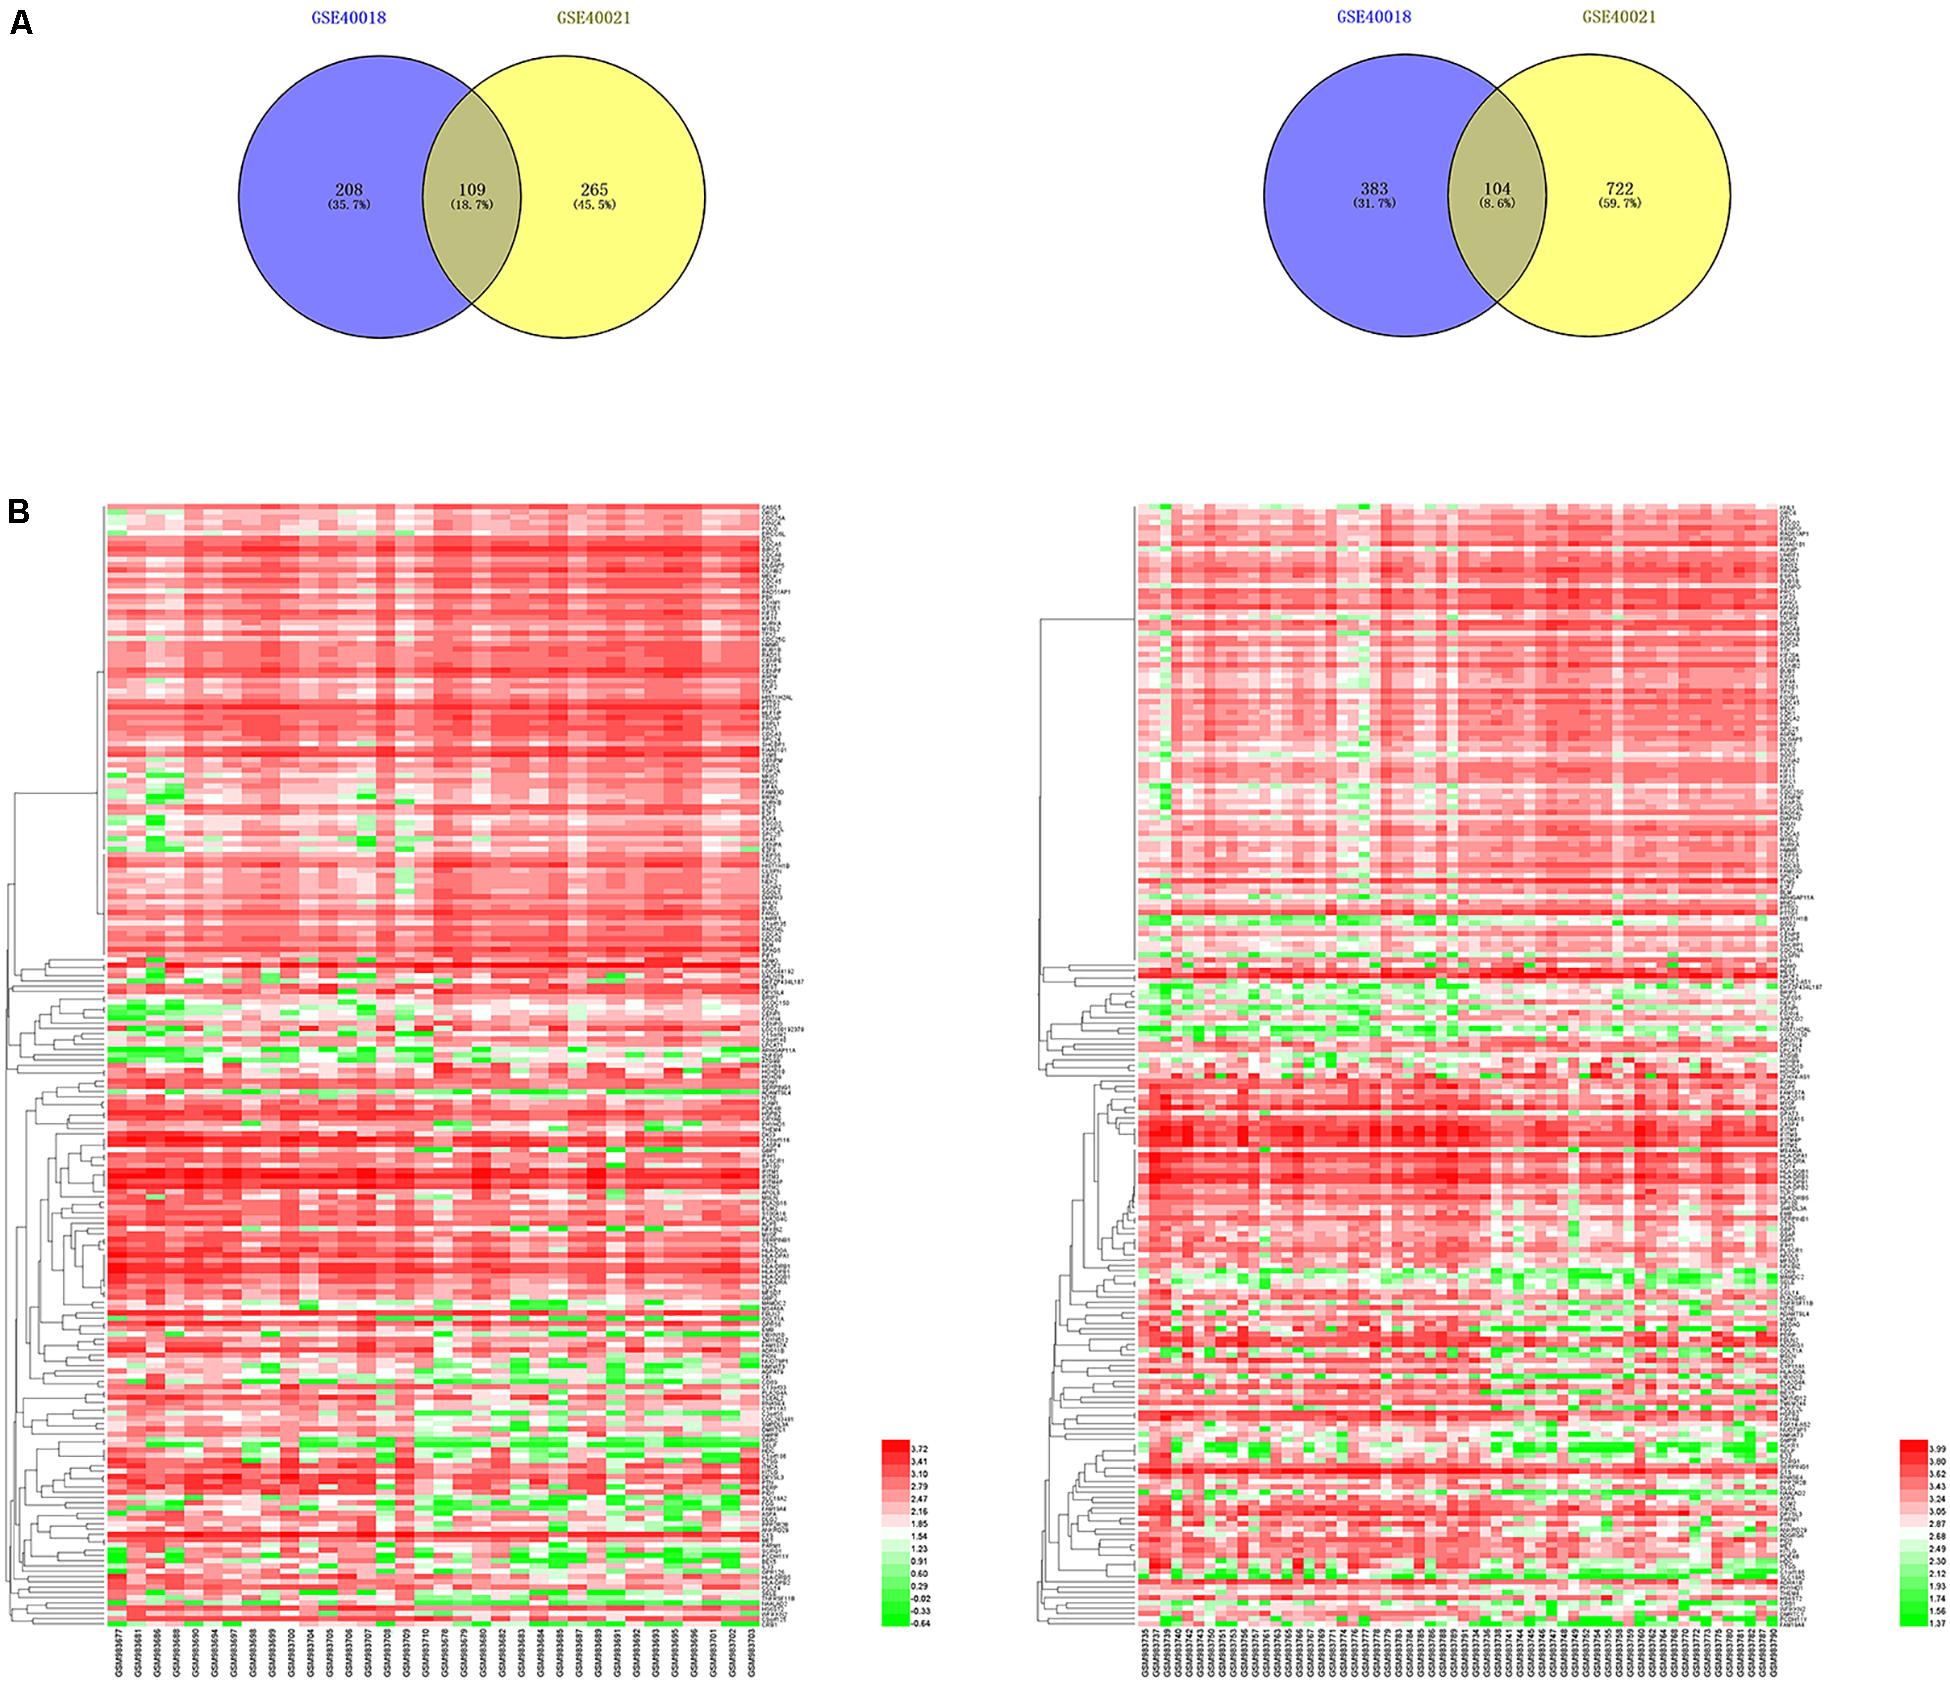
Figure 2. Identification of DEGs associated with SS metastasis. (A) Venn diagram demonstrates the crossed genes shared by GSE40018 and GSE40021 datasets. Left panel represents the upregulated co-differentially expressed genes between GSE40018 and GSE40021 datasets, whereas the right panel represents the downregulated intersectional genes between the two datasets. (B) Heatmap of the top 213 DEGs associated with SS metastasis in the two datasets. Left, GSE40018; right, GSE40021.
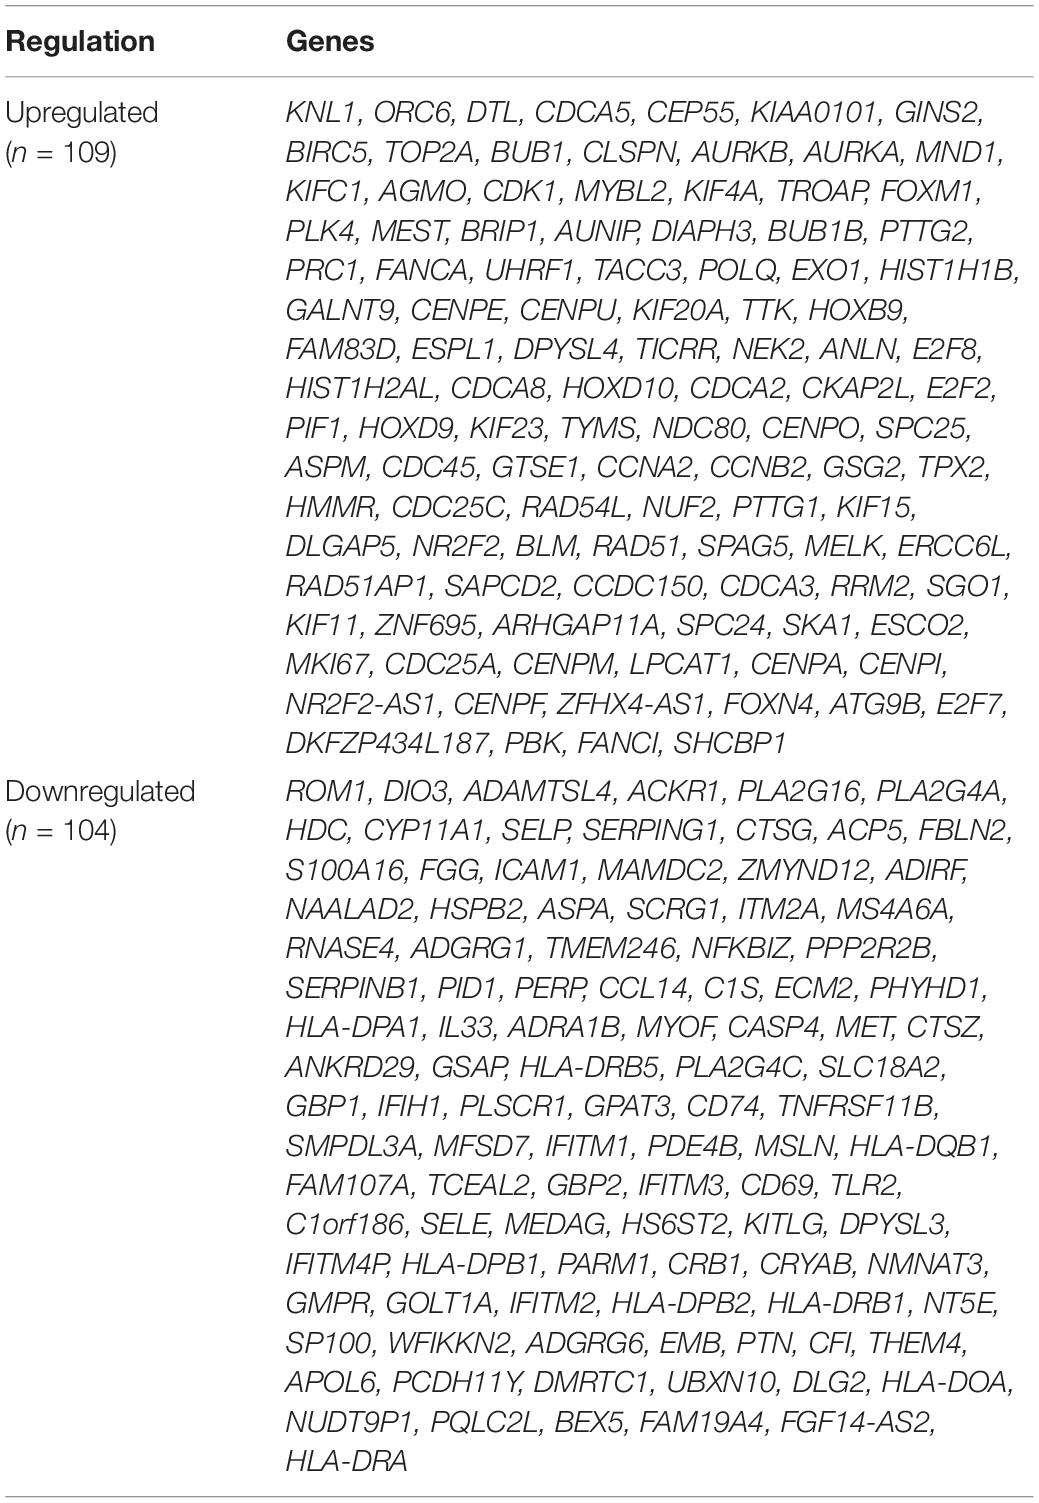
Table 1. Identification of DEGs associated with SS metastasis.
Functional Enrichment Analysis of DEGs
To obtain further investigation of the functions of identified 213 overlapping DEGs, we used the DAVID database to perform GO and KEGG pathway enrichment analyses of DEGs. It was found that according to biological process, the identified 213 overlapping DEGs were mainly enriched in mitotic nuclear division, sister chromatid cohesion and cell division (Figure 3A; Table 2). For cellular component, it was uncovered that most DEGs were enriched in condensed chromosome kinetochore, midbody and spindle (Figure 3B; Table 2). In terms of molecular function, it was revealed that DEGs were mainly enriched in MHC class II receptor activity, protein binding and peptide antigen binding (Figure 3C; Table 2). For KEGG pathway analysis, significantly enriched pathways of DEGs were enriched in staphylococcus aureus infection, cell cycle and rheumatoid arthritis signaling pathways (Figure 3D; Table 3).
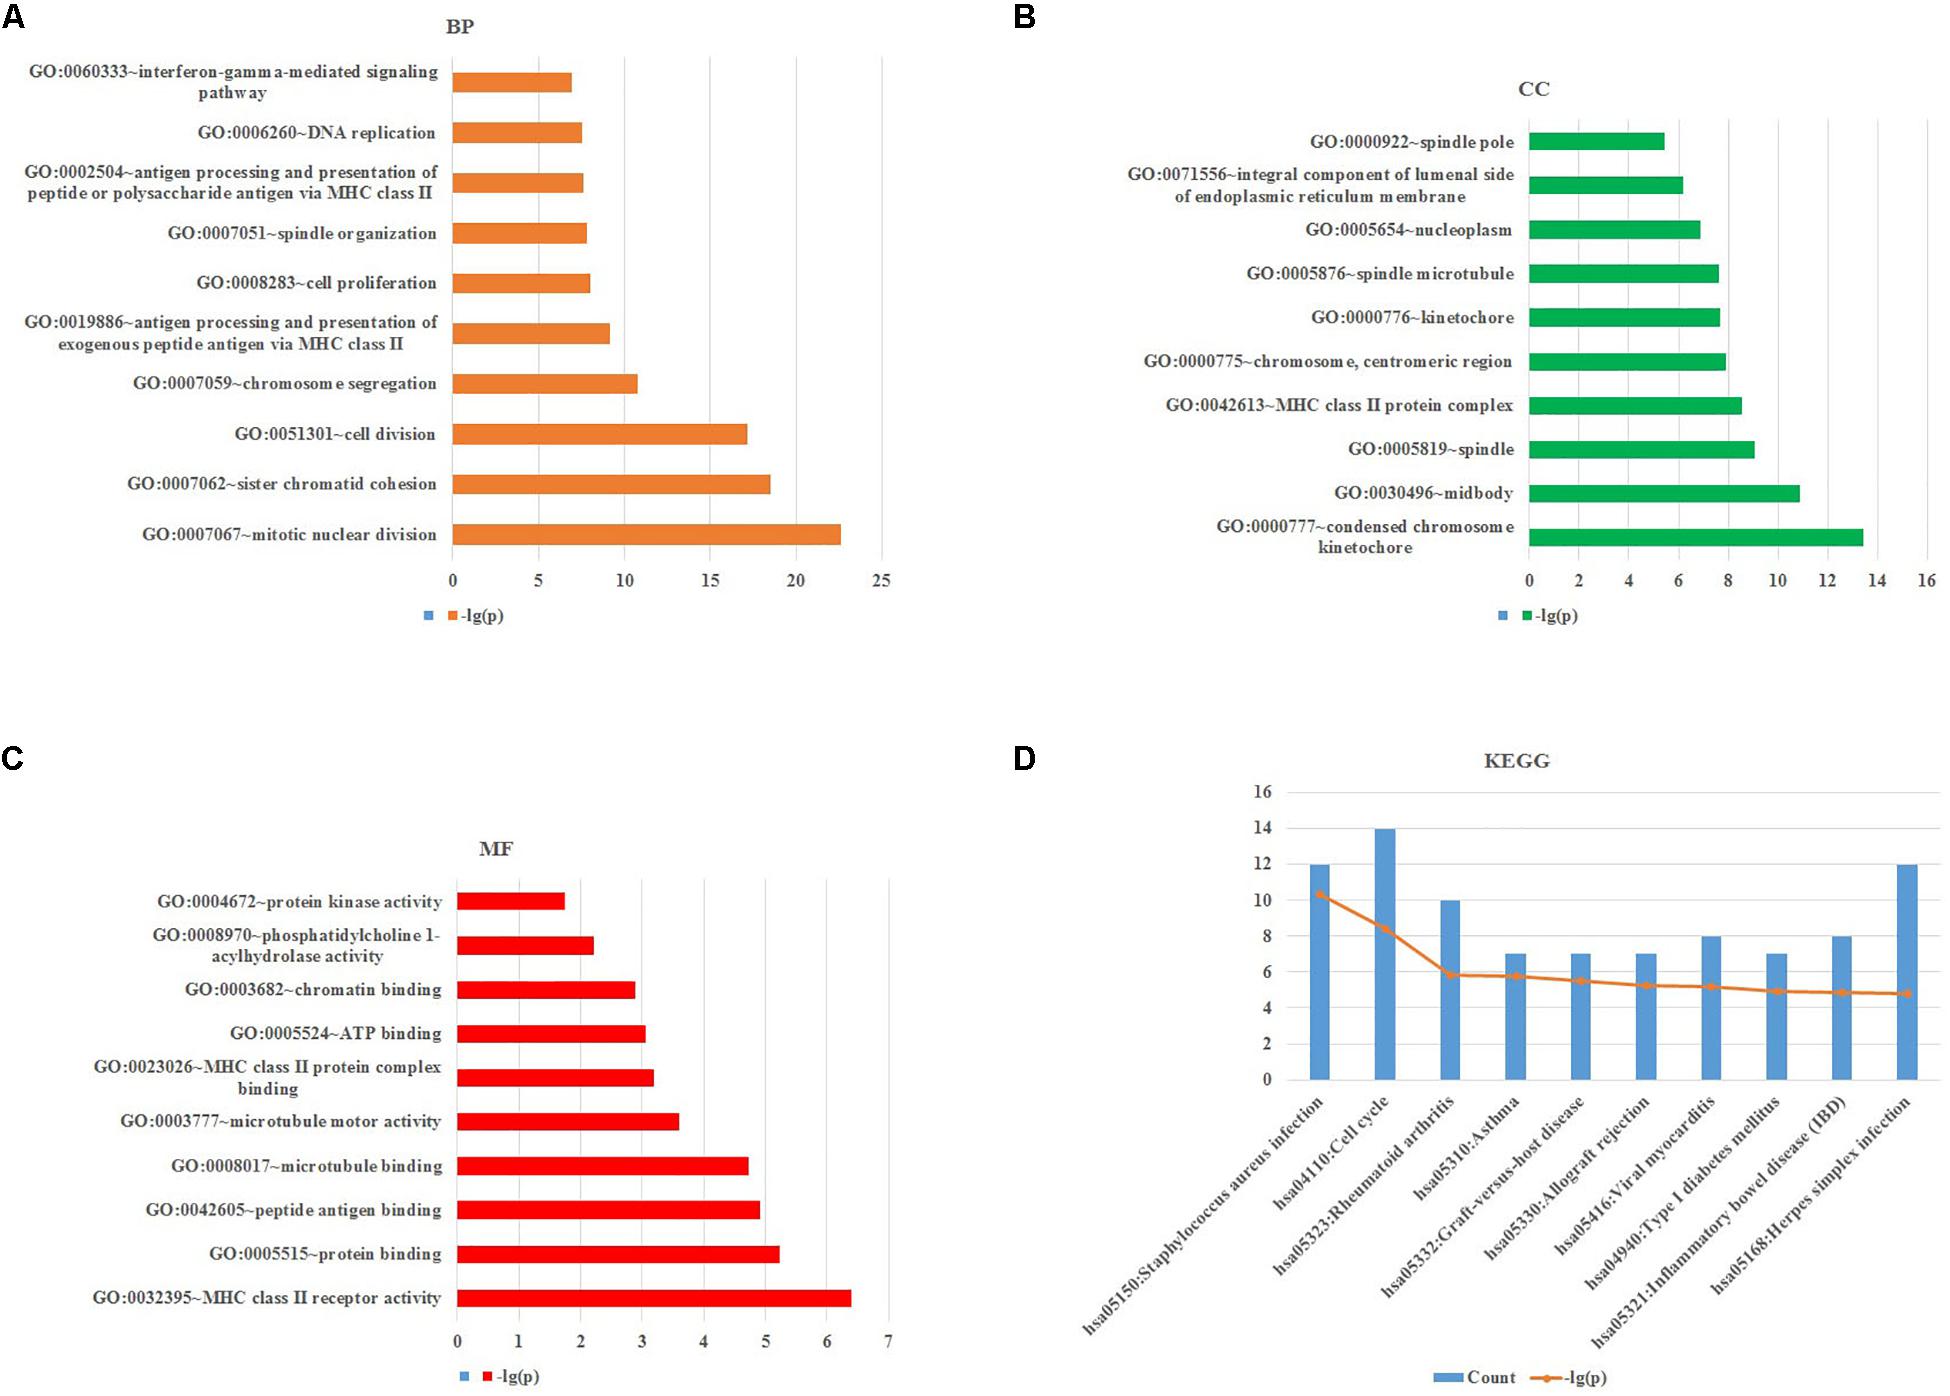
Figure 3. GO and KEGG pathway enrichment analyses of DEGs using the DAVID database. (A) Biological processes, (B) cellular components, (C) molecular functions, (D) the signaling pathways from the GSE40018 and GSE40021 datasets.
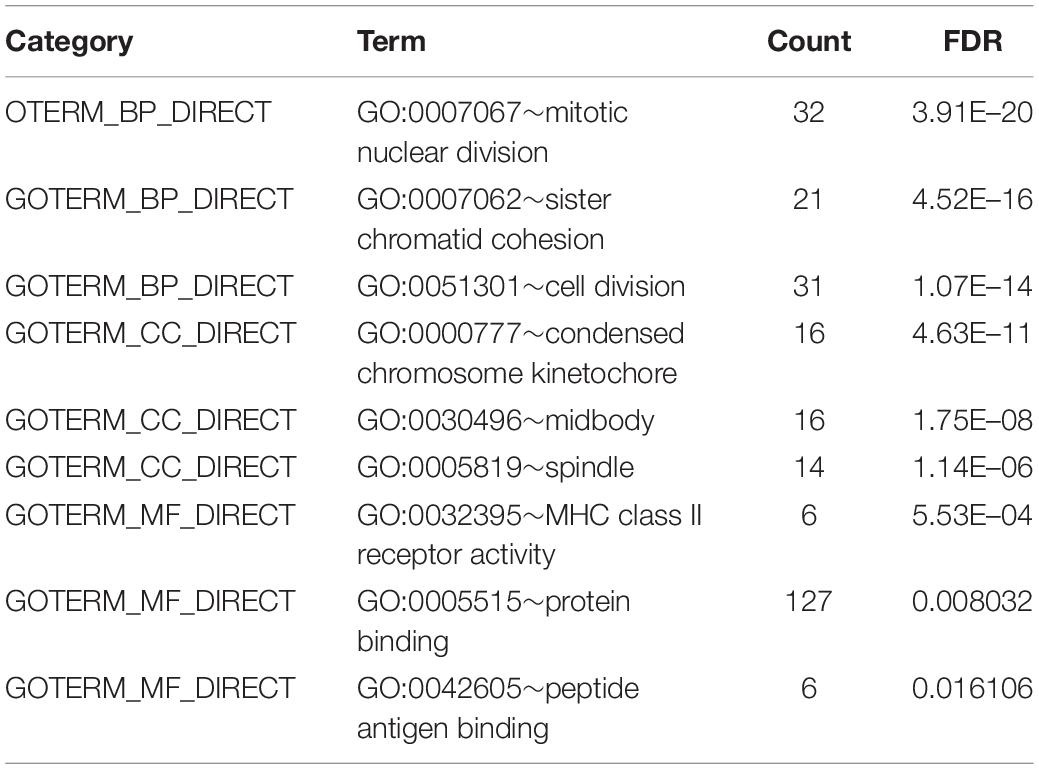
Table 2. The top 3 enriched GO terms of DEGs associated with SS metastasis.
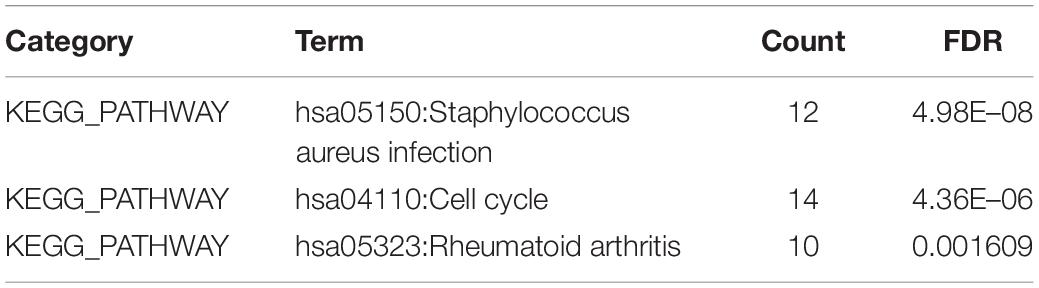
Table 3. The top 3 enriched KEGG pathways of DEGs associated with SS metastasis.
GSEA Analysis
Based on GO and KEGG pathway enrichment analyses of DEGs, GSEA software was also used to identify the potential molecular mechanisms underlying SS metastasis. In agreement with the above results of DAVID, GSEA results indicated that DEGs were significantly involved in GO_ SISTER_CHROMATID_SEGREGATION, GO_MITOTIC_SPINDLE_ORGANIZATION and GO_ CHROMOSOME_SEGREGATION (BP) (Supplementary Figure S1A); and GO_CONDENSED_CHROMOSOME, GO_KINETOCHORE and GO_CHROMOSOME_CENTRO-MERIC_REGION (CC) (Supplementary Figure S1B); and GO_DNA_DIRECTED_DNA_POLYMERASE_ACTIVITY, GO_ SINGLE_STRANDED_DNA_BINDING and GO_N_ACYLTR-ANSFERASE_ACTIVITY (MF) (Supplementary Figure S1C). For KEGG pathway, significantly enriched pathways of DEGs were enriched in oocyte meiosis, cell cycle and DNA replication signaling pathways (Supplementary Figure S1D).
PPI Network and Module Analysis
In order to explore the interaction between the screened 213 DEGs, we used the STRING database to construct the PPI network. As shown in Figure 4A, a relevant PPI network was successfully constructed, which contained 204 nodes and 3210 edges. Then, this PPI network was visualized using Cytoscape software (Figure 4B). Module analysis was then conducted using the MCODE plugin of Cytoscape based on the whole network. As shown in Figure 4C, the identified key module from the whole network was detected with 77 nodes and 2650 edges. Next, the DEGs in this key module were then subjected to perform GO and KEGG pathway enrichment analyses using Cytoscape plugins ClueGO and CluePedia, and the results revealed that most DEGs were significantly enriched in mitotic nuclear division 36.54%, negative regulation of sister chromatid segregation 6.98%, and regulation of mitotic sister chromatid segregation 6.64% for BP (Figure 5A; Supplementary Figure S2A); and chromosome, centromeric region 32.35%, midbody 23.53%, and spindle 14.71% for CC (Figure 5B; Supplementary Figure S2B); and microtubule motor activity 66.67% and histone kinase activity 33.33% for MF (Figure 5C; Supplementary Figure S2C).
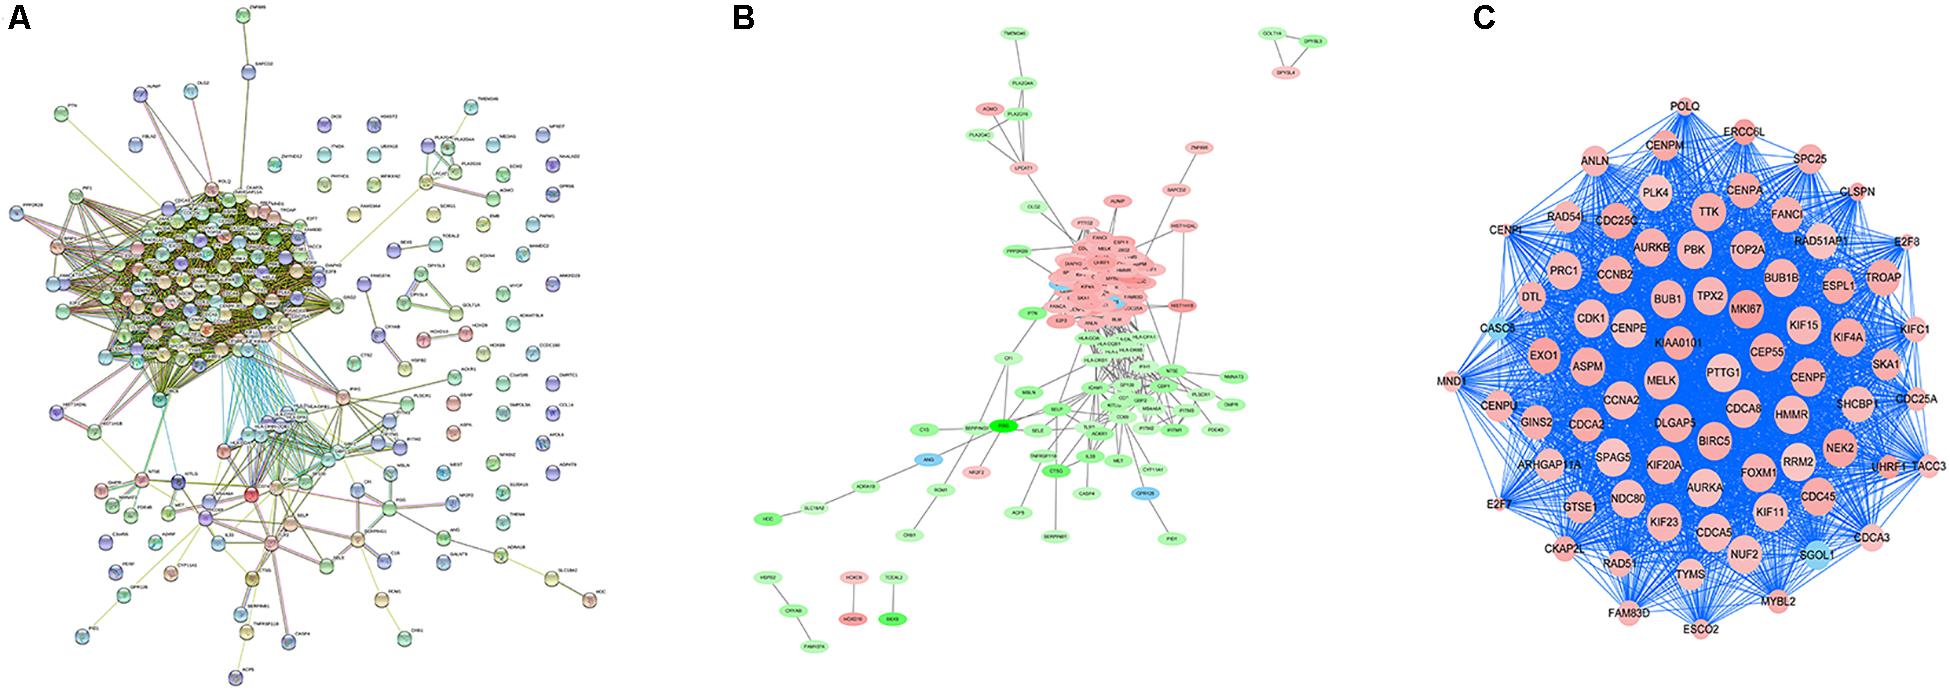
Figure 4. PPI network analysis and identification of hub genes. (A) Protein-protein interactions of DEGs were analyzed using the STRING database. (B) The PPI network of DEGs was established using Cytoscape software. The red nodes indicated upregulated genes, whereas the green nodes represented downregulated genes. (C) The most significant module in the PPI network was identified using MCODE plugin. The size of the node represented the node degree. Nodes with higher the degree represented more bigger size.
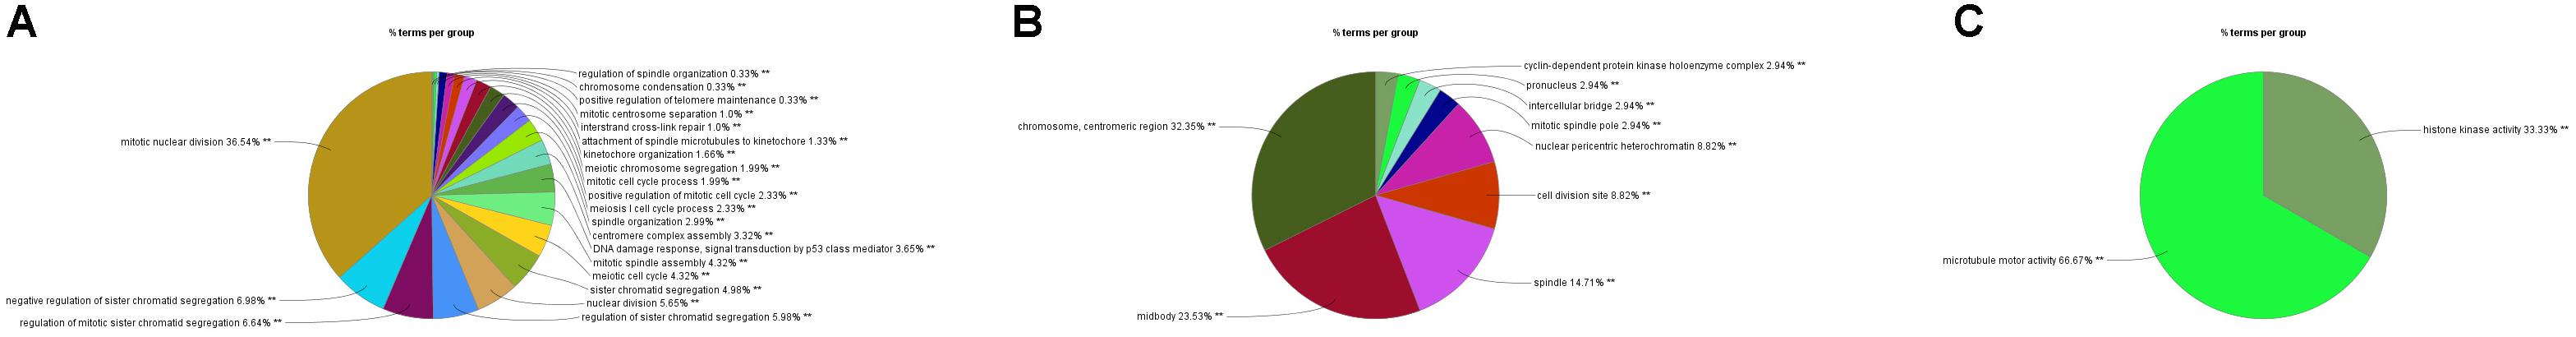
Figure 5. GO analyses of DEGs in the most significant module using Cytoscape plugins ClueGO and CluePedia. (A) Percentages of biological processes terms per group. (B) Percentages of cellular components terms per group. (C) Percentages of molecular functions terms per group.
Hub Genes Selection and Survival Analysis
The top 10 hub genes were identified using degrees > 10. The top 10 hub genes were filtered out from the key module using the CytoHubba plugin, including CENPF, KIF11, KIF23, TTK, MKI67, TOP2A, CDC45, MELK, AURKB, and BUB1 (Figure 6A; Table 4). Then, the online tool WebGestalt was employed to further discover the GO and KEGG pathway enrichment analyses for the identified 10 hub genes. It was found that the 10 hub genes were significantly enriched in mitotic cell cycle process, cellular component organization, nuclear division, cell cycle process, and organelle fission for BP (Figure 6B; Supplementary Table S1); and condensed chromosome, chromosome, spindle, microtubule cytoskeleton, and kinetochore for CC (Figure 6C; Supplementary Table S2); and ATP binding, adenyl ribonucleotide binding, adenyl nucleotide binding, drug binding, and purine ribonucleoside triphosphate binding for MF (Figure 6D; Supplementary Table S3). In terms of KEGG pathway, the 10 hub genes were significantly enriched in cell cycle (Figure 6E; Supplementary Table S4).
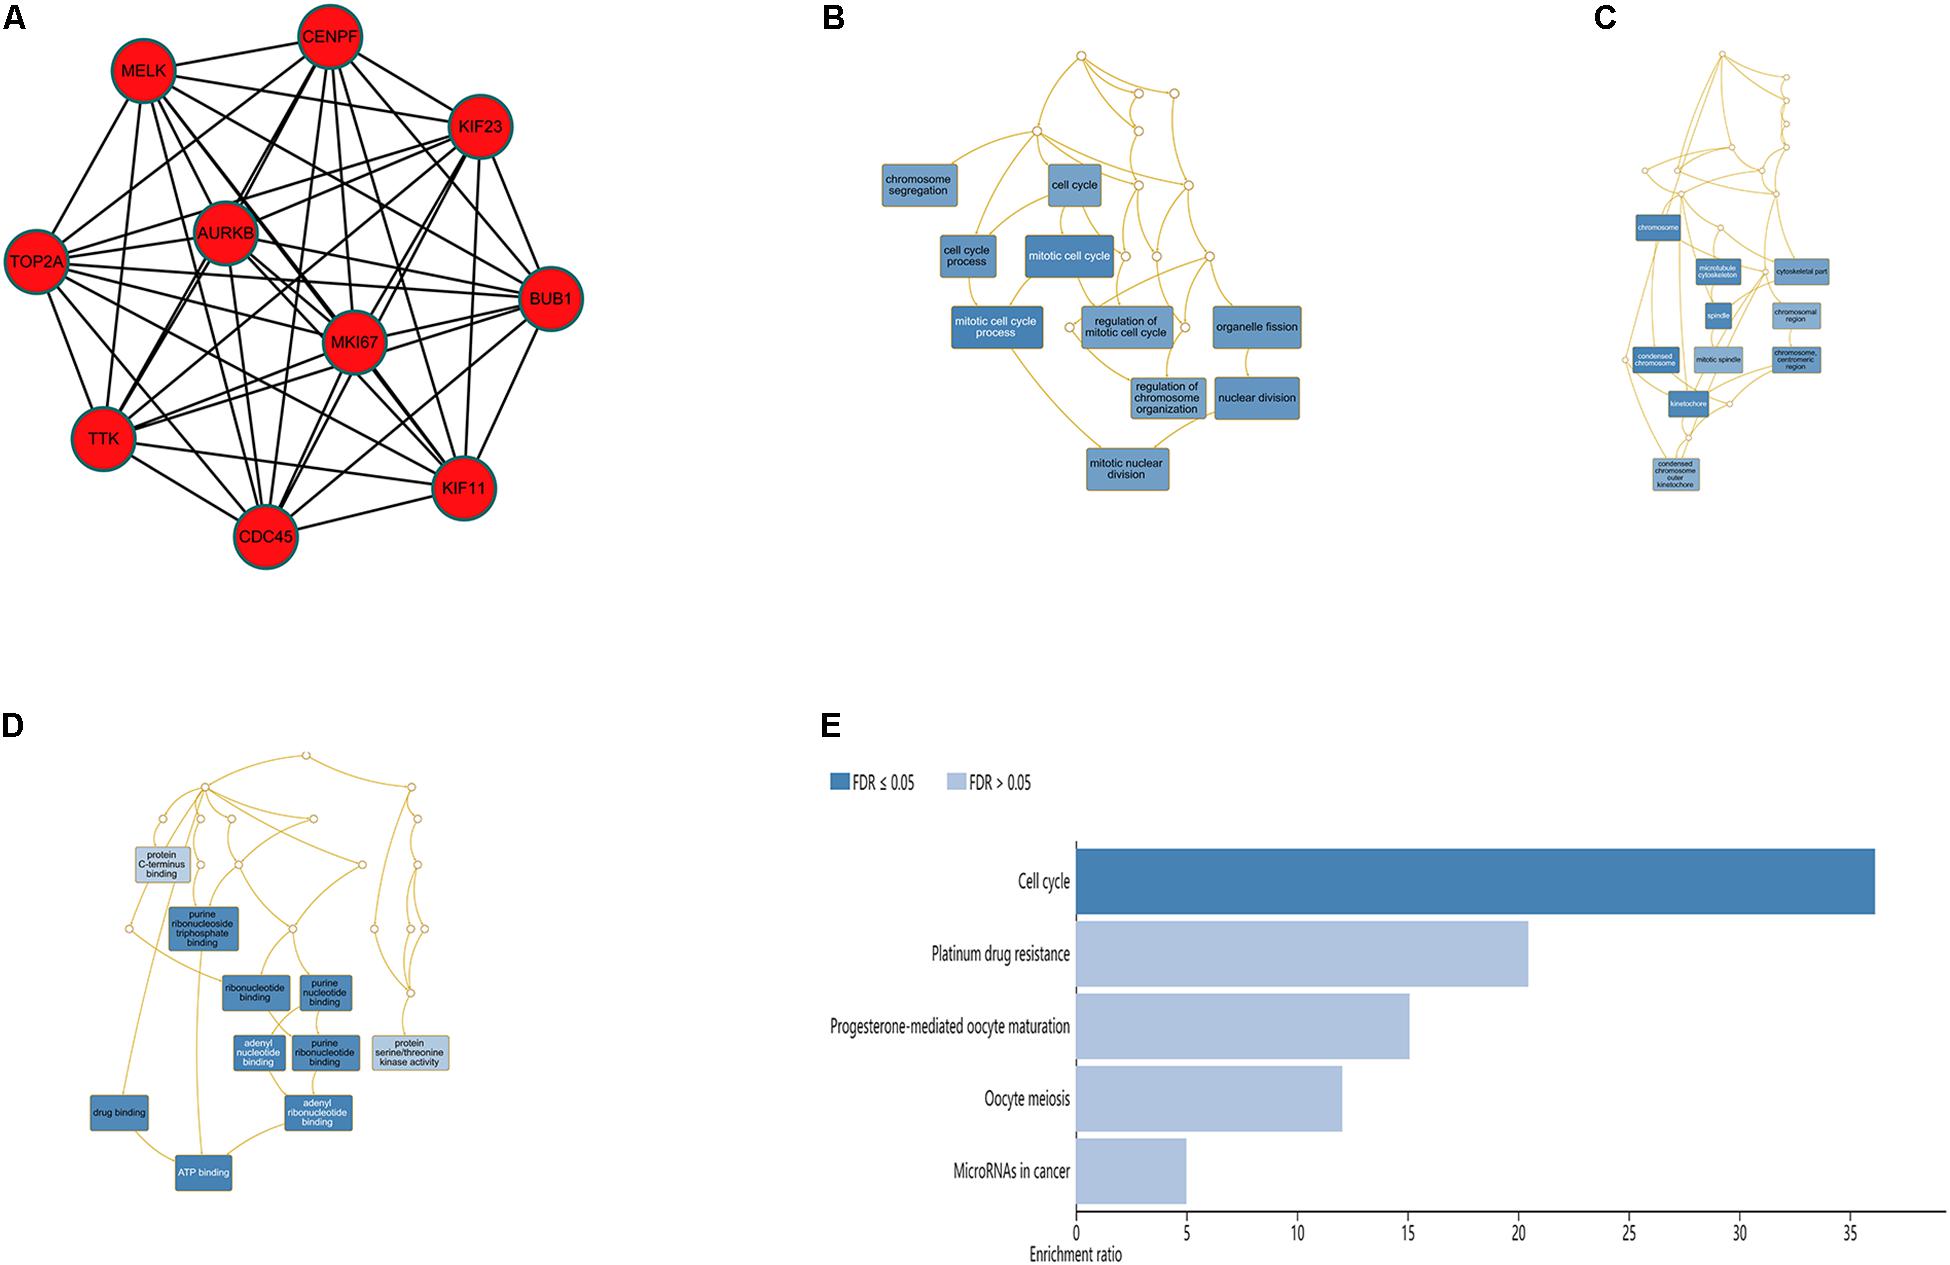
Figure 6. Significantly enriched GO and KEGG pathways for the 10 hub genes using the WebGestalt database. (A) Ten hub genes were identified from the most significant module. (B) Biological process, (C) cellular component, (D) molecular function, (E) KEGG pathways for the 10 hub genes.
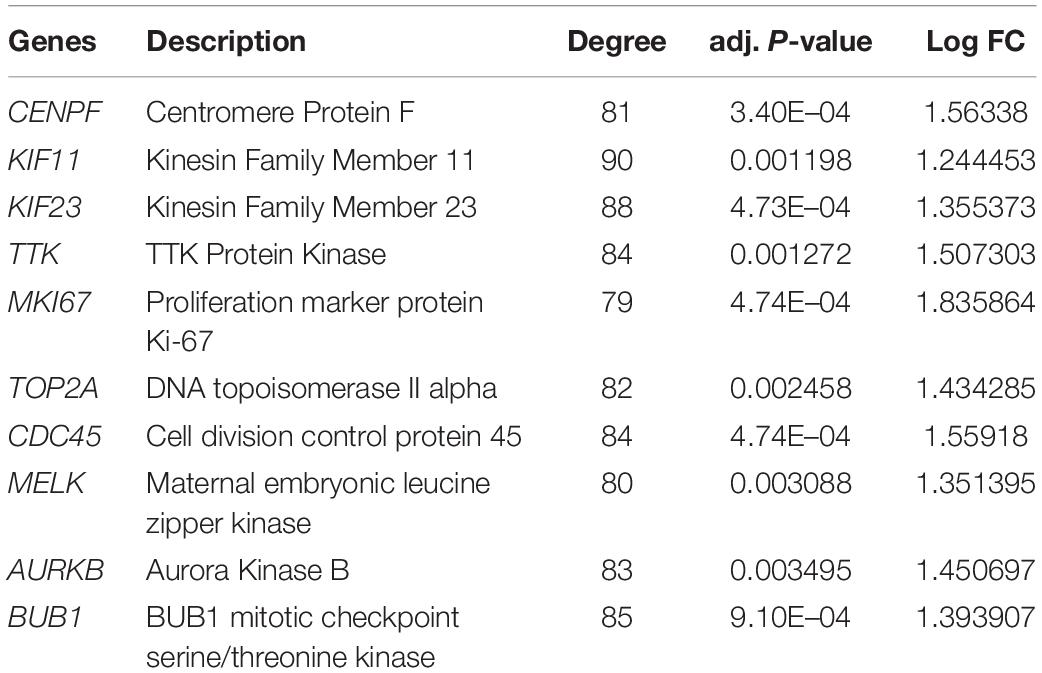
Table 4. Hub genes identified in the key module.
Next, comparing the expression levels of hub genes was performed using GEPIA database. It was found that the 10 hub genes displayed significantly higher expression in SS patients compared to the normal control subjects (Figure 7). Thereafter, the effects of 10 hub genes on overall survival were conducted using Kaplan Meier plots. As shown in Figure 8, SS patients with high expression of CENPF, KIF11, KIF23, TTK, MKI67, TOP2A, CDC45, MELK, AURKB, and BUB1 had worse overall survival. Moreover, SS patients with high expression of CENPF, KIF11, KIF23, TTK, MKI67, TOP2A, CDC45, MELK, AURKB, and BUB1 predicted worse recurrence-free survival (Figure 9).
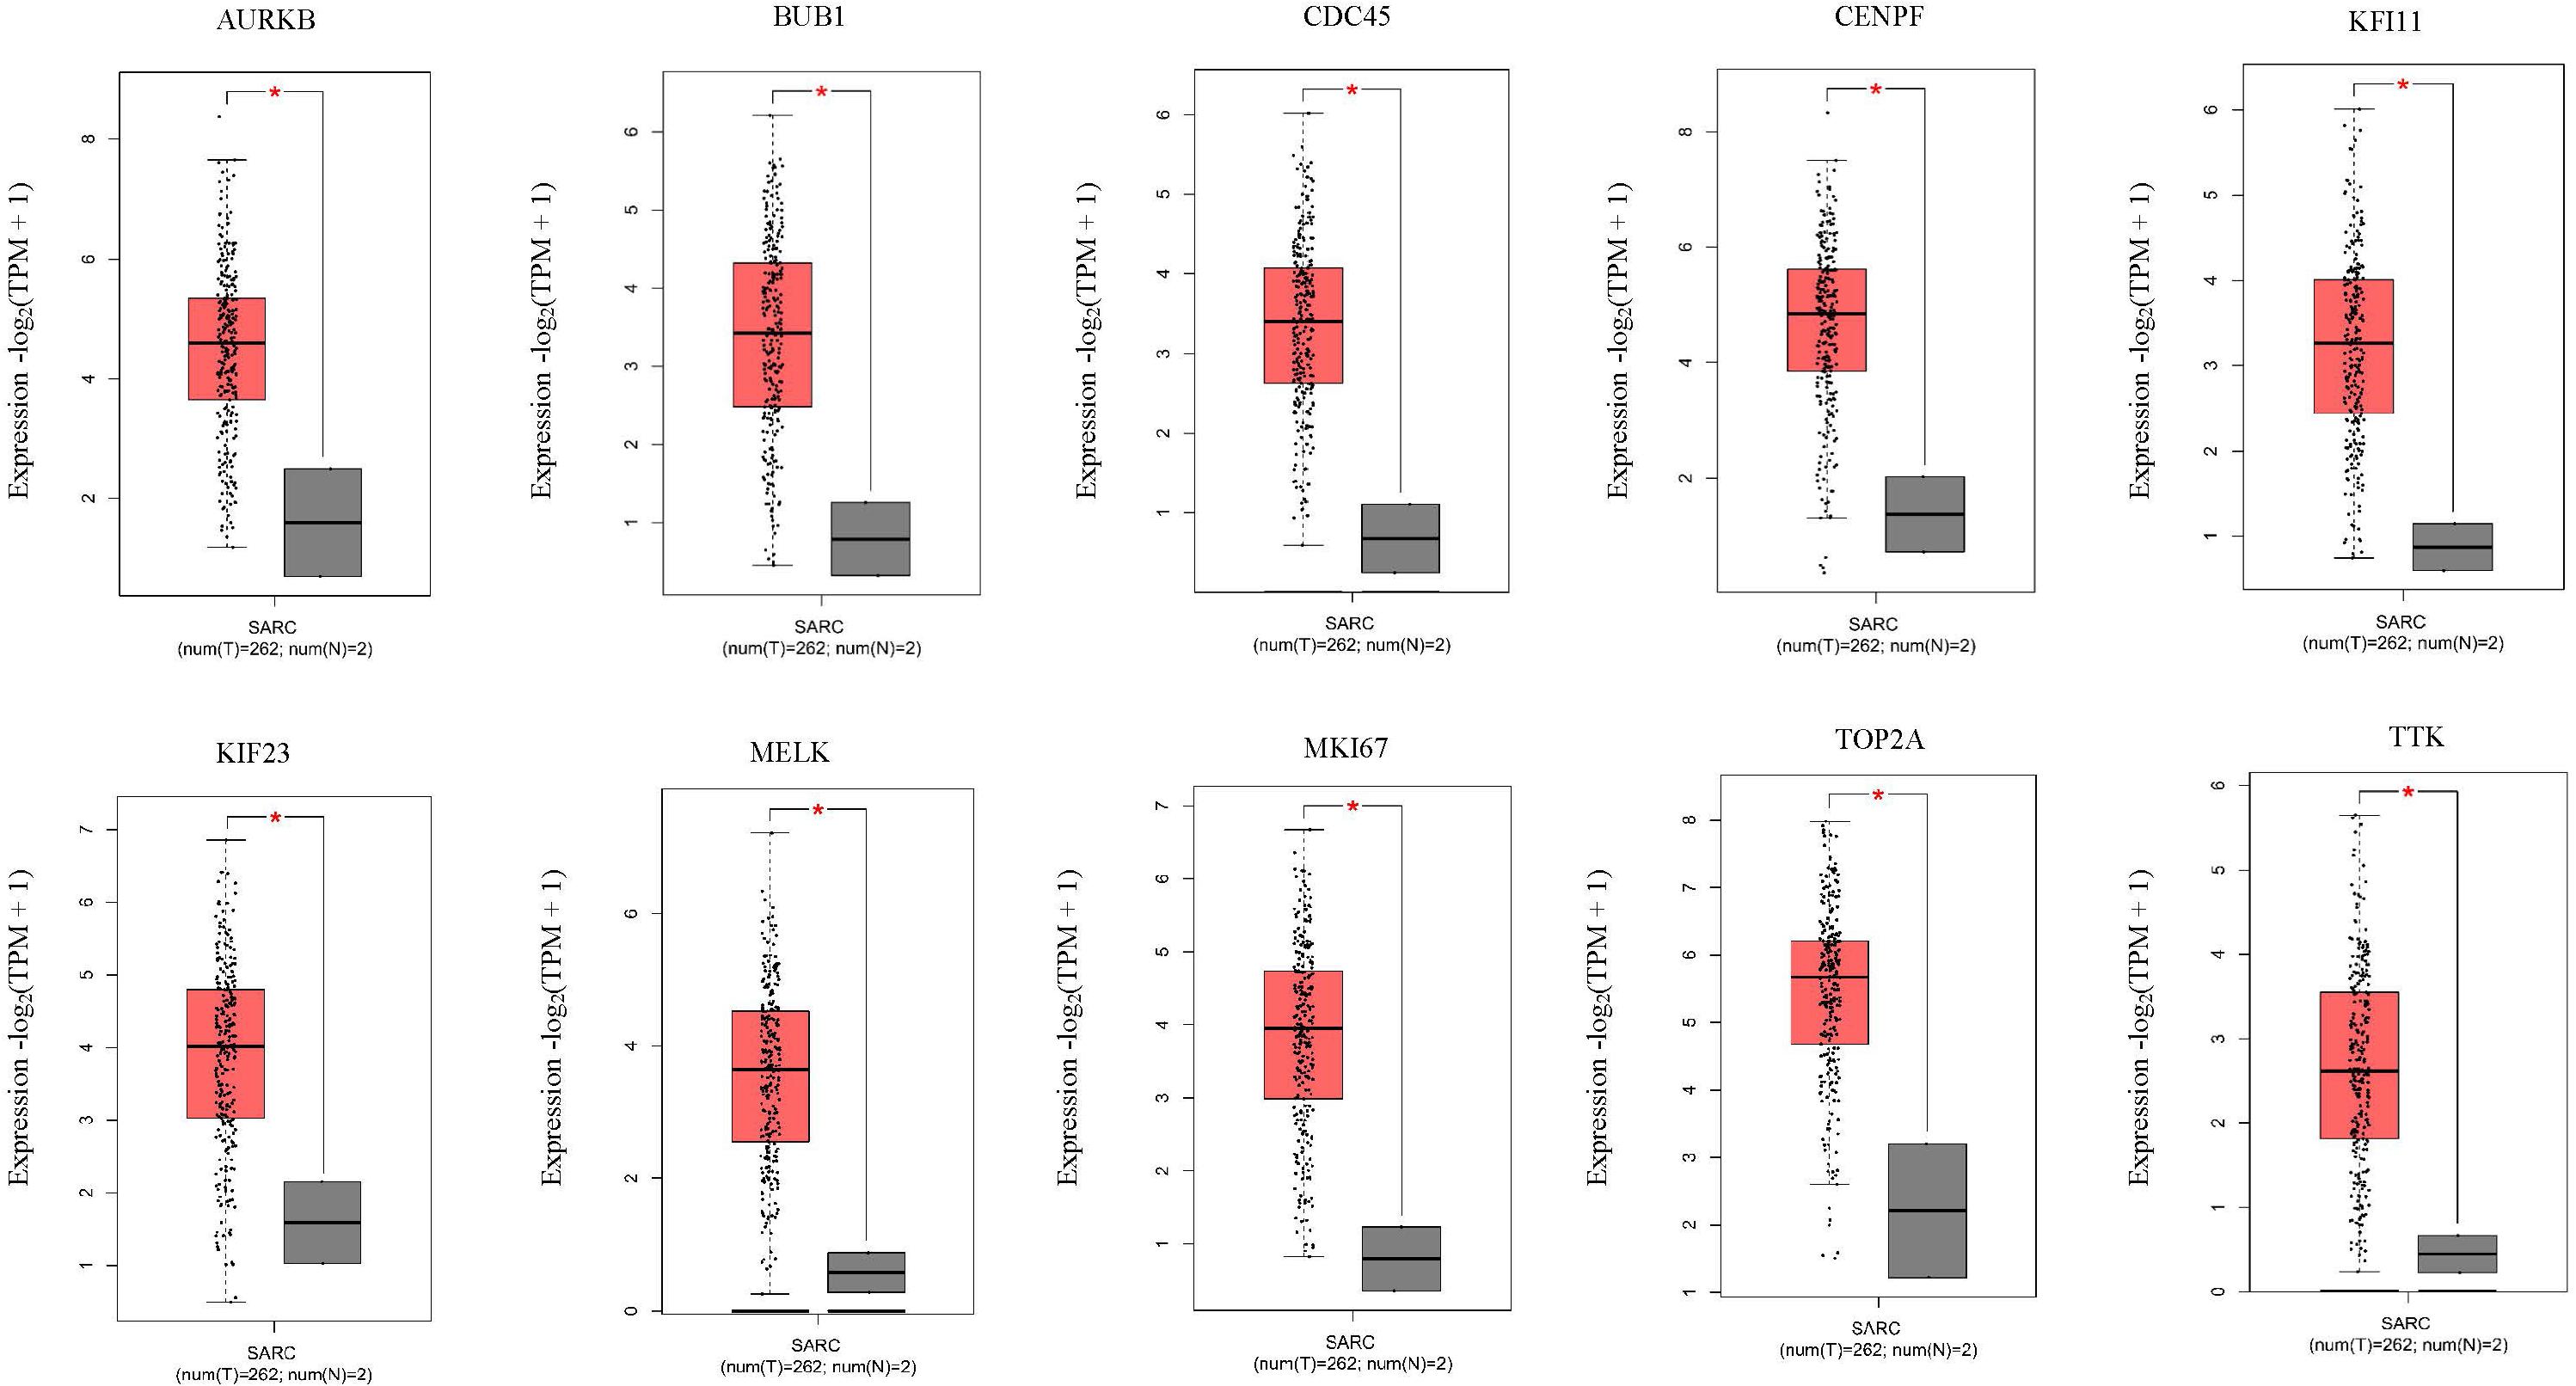
Figure 7. Validation of the 10 hub genes overexpression in SS tissues using the GEPIA database. *P < 0.05, unpaired Student’s t-test.
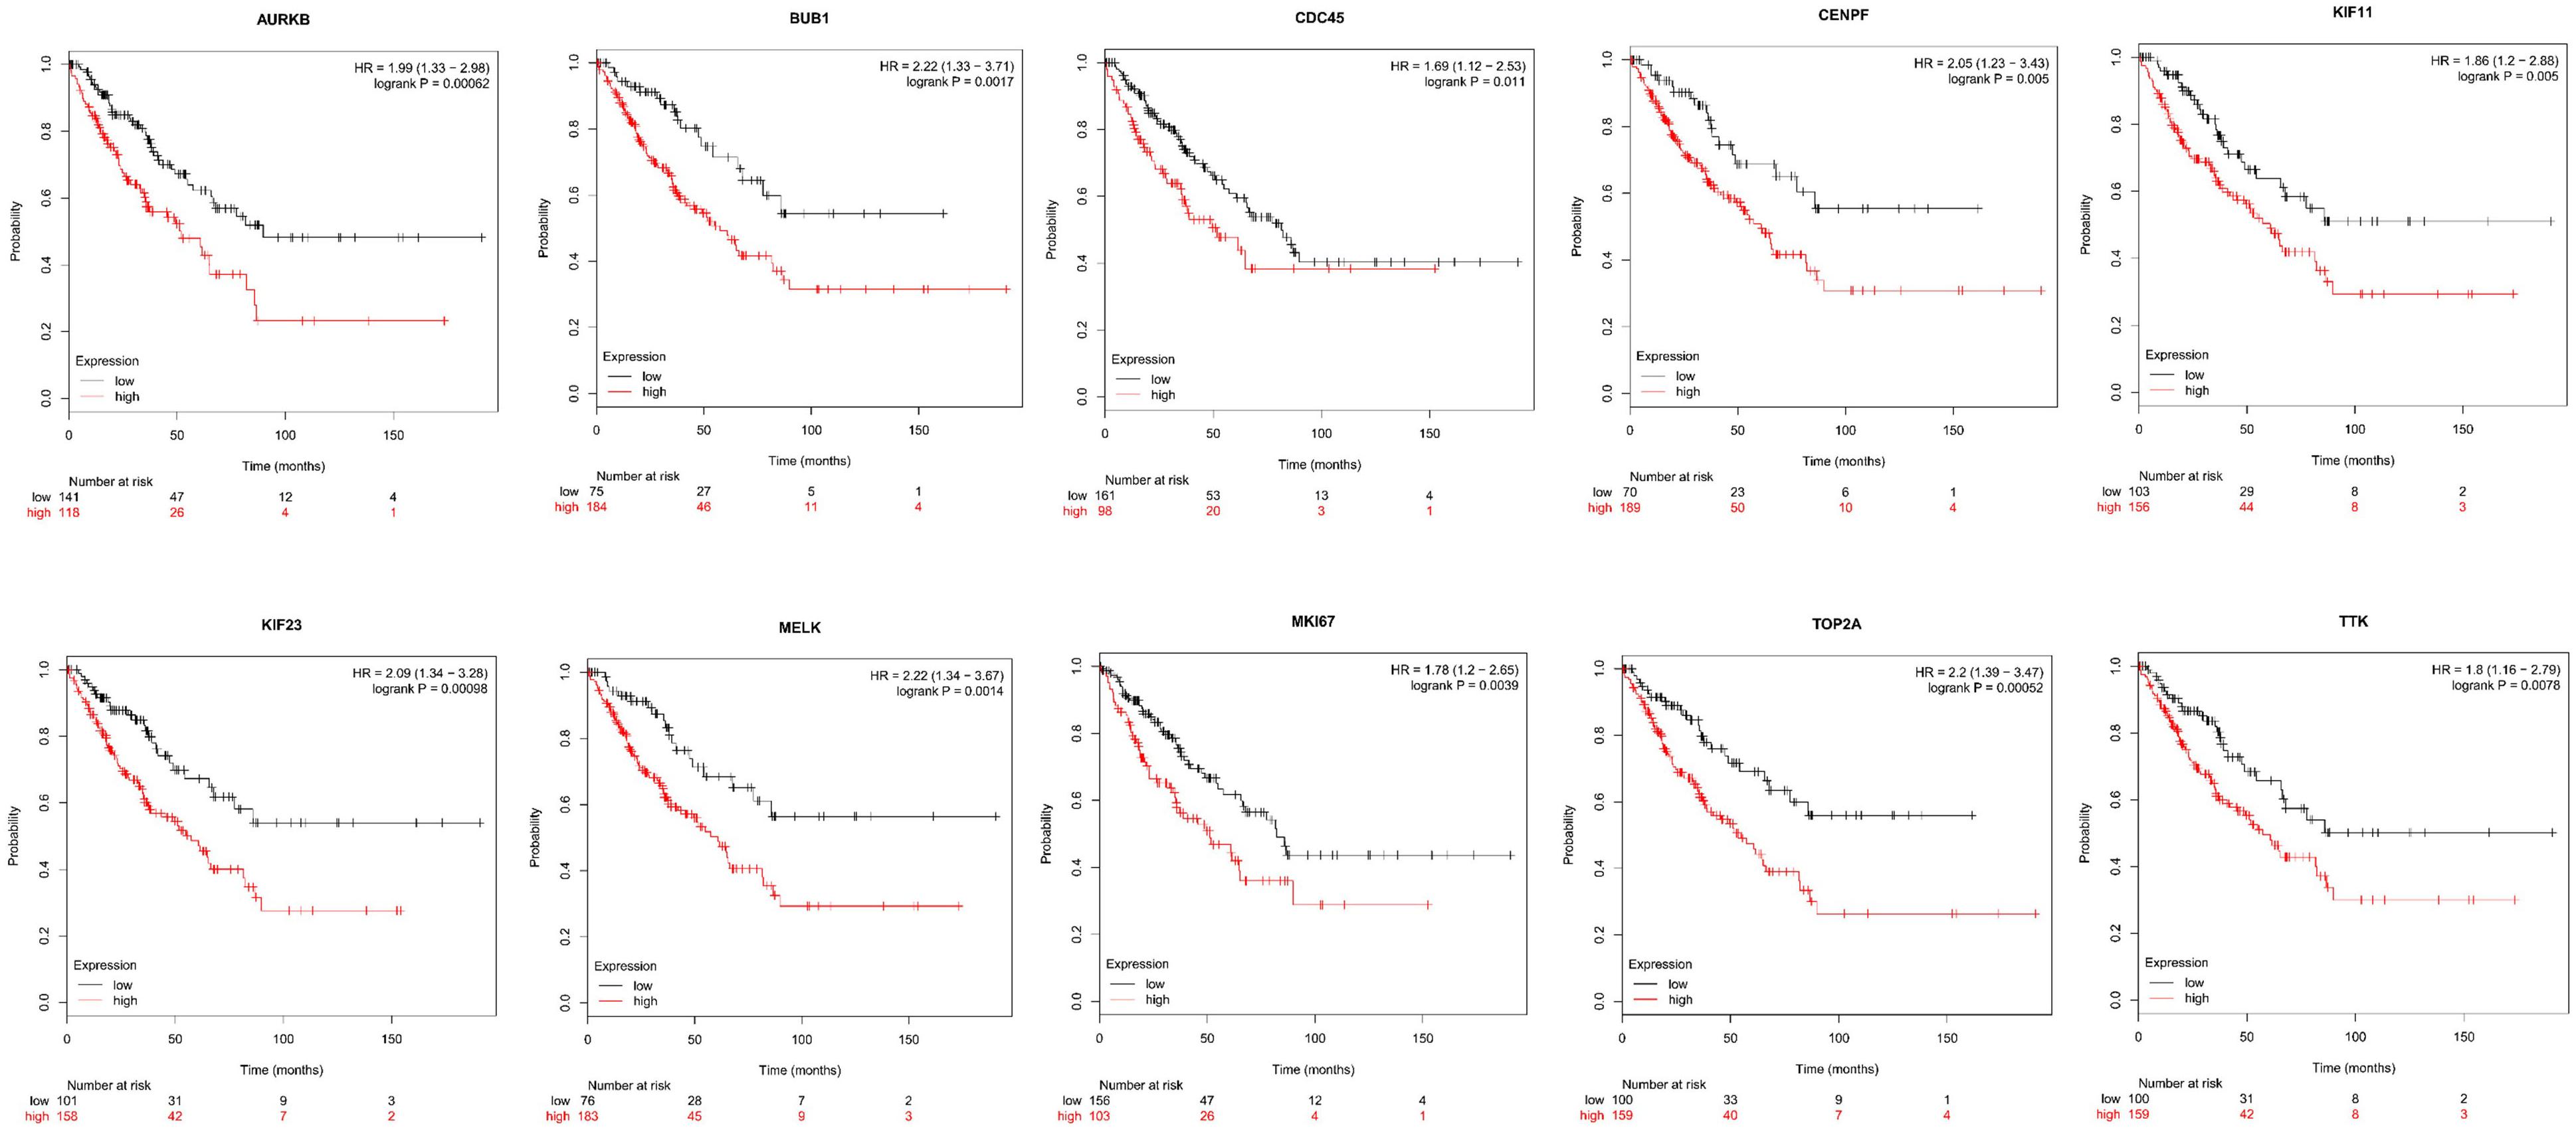
Figure 8. Kaplan Meier curves for overall survival analysis of the 10 hub genes in SS patients. Red line represented the high expression group, whereas black line denoted the low expression group.
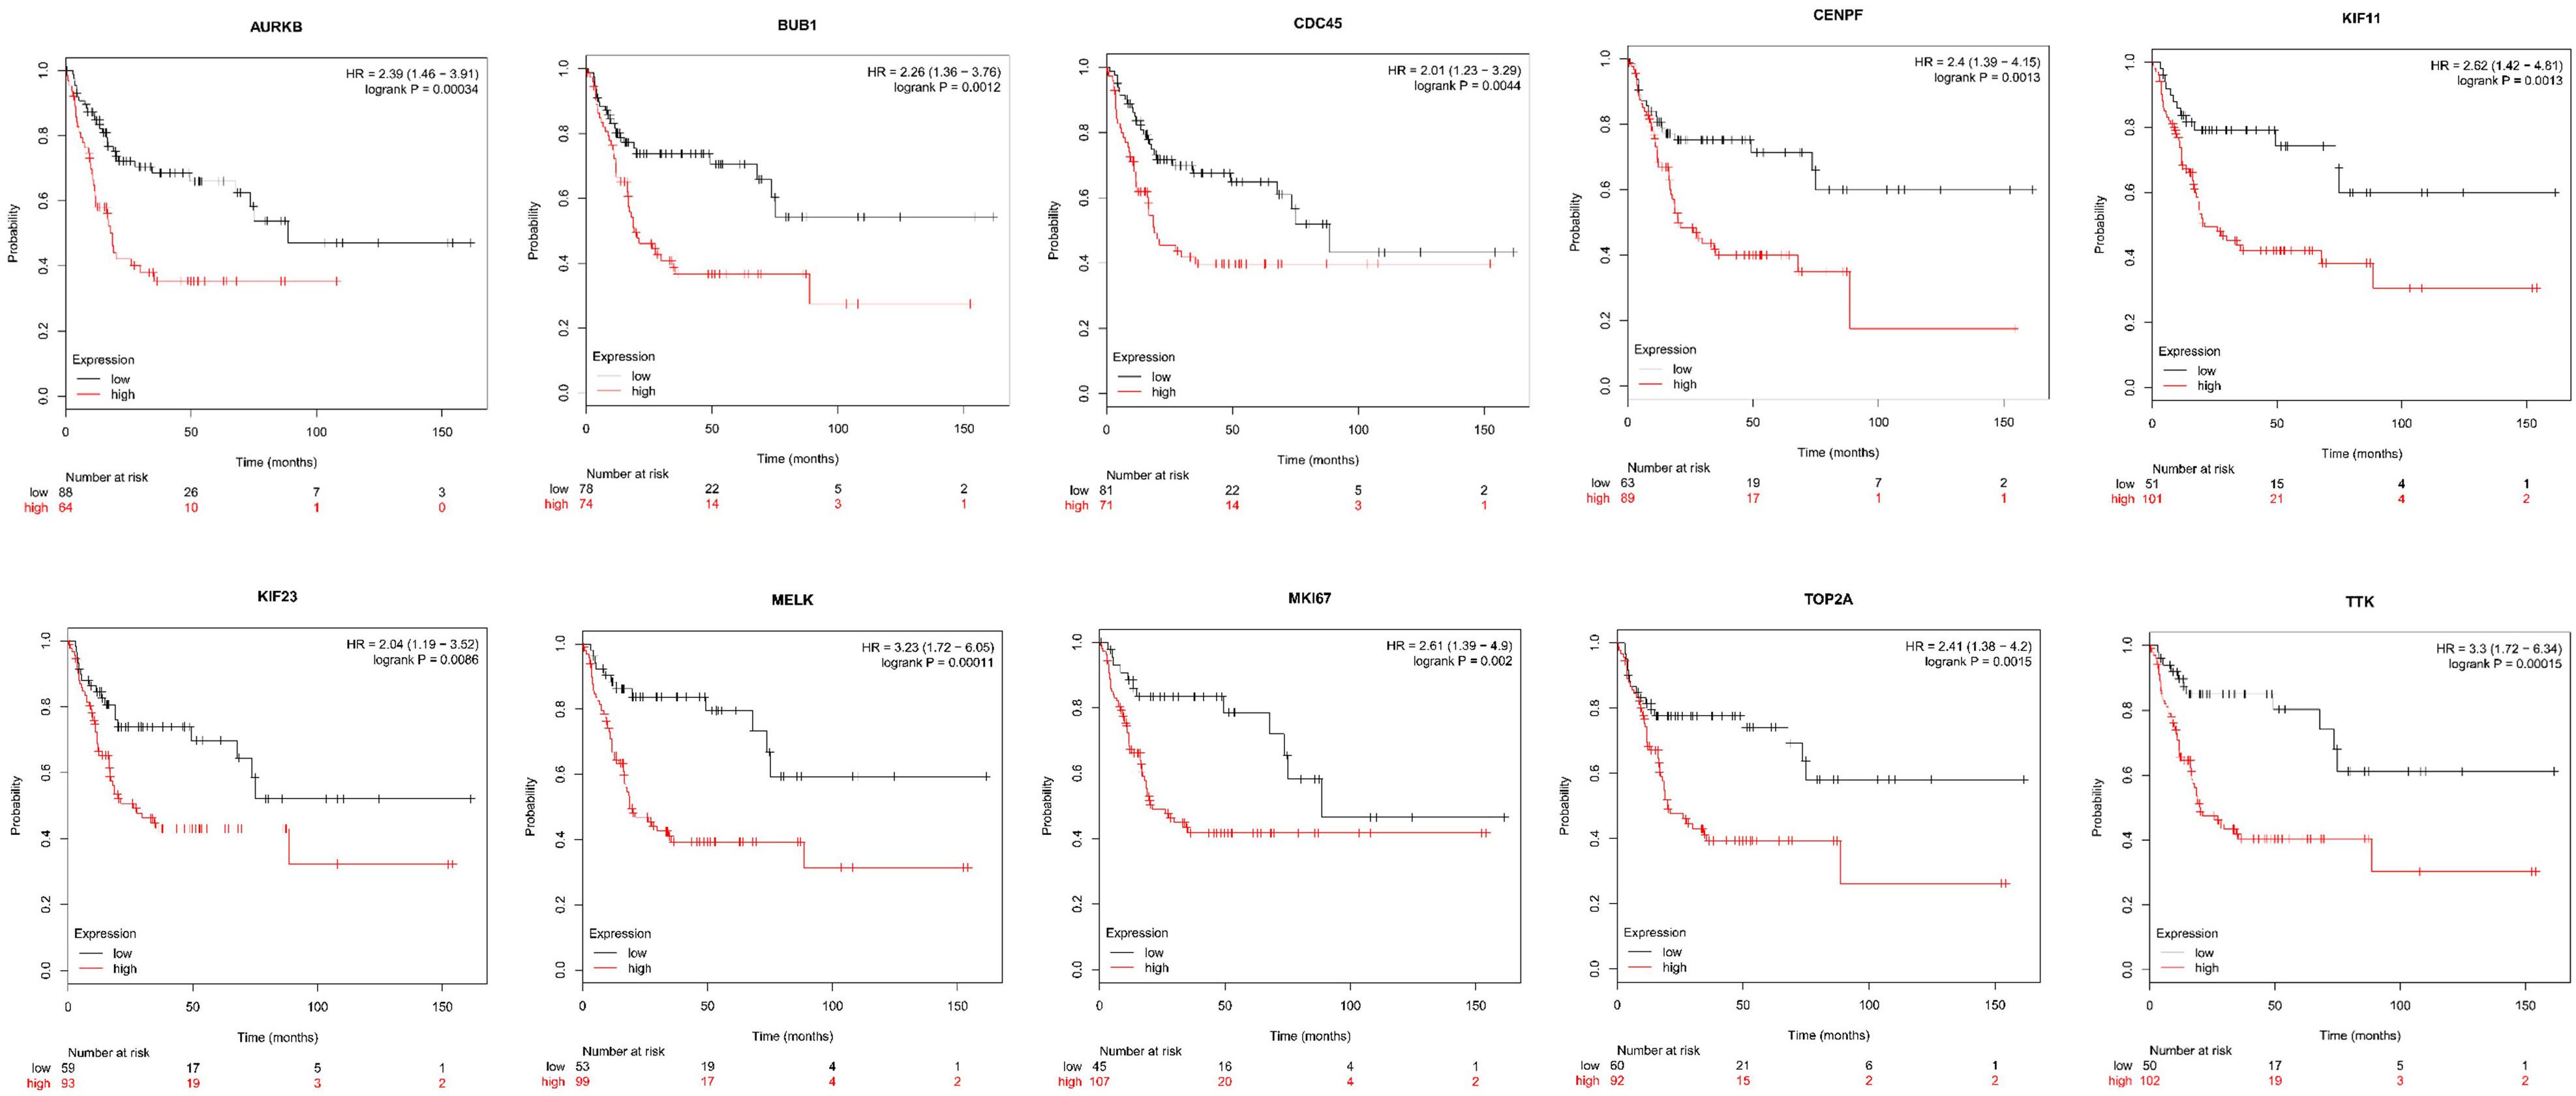
Figure 9. Kaplan Meier curves for recurrence-free survival analysis of the 10 hub genes in SS patients. Red line represented the high expression group, whereas black line denoted the low expression group.
Discussion
Here, we identified 213 DEGs that were associated with SS metastasis from the GSE40018 and GSE40021 datasets, including 109 upregulated and 104 downregulated genes. According to GO and KEGG pathway enrichment analyses of the 213 DEGs, DEGs were found to be significantly enriched in mitosis, cell division and cell cycle pathway. Through a PPI network, we identified a key module containing 77 nodes and 2650 edges. More importantly, based on this key module, we screened 10 hub genes, which were further demonstrated to be closely related to the progression and prognosis of SS.
Hub genes, namely CENPF, KIF11, KIF23, TTK, MKI67, TOP2A, CDC45, MELK, AURKB and BUB1, were screened based on the PPI network of DEGs, suggesting the 10 hub genes may play key roles in SS metastasis. As a cell cycle-associated nuclear antigen, CENPF is involved in chromosome segregation during mitosis, and found to be related to tumor growth in many human malignancies. CENPF has been reported to be frequently expressed at high levels in hepatocellular carcinoma, and suppression of CENPF leads to growth inhibition and cell cycle arrest (Dai et al., 2013). Knockdown of CENPF attenuates the cell growth and invasion of gastric cancer (Chen et al., 2019). Increased expression of CENPF in prostate cancer suggests poor prognosis of patients (Zhuo et al., 2015). Furthermore, CENPF collaborates with FOXM1 to synergistically induce target gene expression and leads to activation of crucial signaling pathways correlated with tumor malignancy (Aytes et al., 2014).
KIF11, belonging to the kinesin-5 family, is involved in the tetrameric microtubule cross-linkage, cell mitosis, the cell cycle, and differentiation (Roostalu et al., 2011). Studies have shown that KIF11 is overexpressed in many cancers, such as gastric cancer (Imai et al., 2017), breast cancer (Zhou et al., 2019), oral cancer (Daigo et al., 2018), renal cell (Sun et al., 2013), and astrocytic cancers (Liu et al., 2016). Similarly, KIF23, as a key regulator of cytokinesis, is also found to be correlated with poor prognosis for patients with hepatocellular carcinoma (Sun et al., 2015), glioma (Sun et al., 2016), gastric cancer (Li et al., 2019), and non-small-cell lung cancer (Vikberg et al., 2017).
Previous studies have revealed that TTK is highly expressed in several malignant tumors, and its increased expression indicates a poor prognosis. TTK contributes to the proliferation and invasion of tumor cells via regulating the mitotic process (Yang et al., 2010). MKI67, also known as Ki-67, acts as a biological surfactant to disperse mitotic chromosomes (Cuylen et al., 2016), which has been demonstrated in various carcinomas, including gastric, esophageal, colonic, rectal, and esophageal squamous cell carcinoma (Volkweis et al., 2012). Currently, a high MKI67 expression predicts for poor prognosis in patients with retroperitoneal soft tissue sarcomas (Morizawa et al., 2016). TOP2A gene, residing on chromosome 17 (17q21-q22), can regulate DNA replication, chromosome segregation, and cell cycle progression (Zeng et al., 2019). An elevated TOP2A expression is observed in many tumor tissues, and significantly associated with MKI67 expression as well as tumor aggressiveness and poor outcome (Brase et al., 2010).
Numerous evidences have shown that CDC45 is required during the process of DNA replication, and CDC45 overexpression is also associated with cancer cell proliferation (Pollok et al., 2007). MELK, as a member of kinases family which is directly regulated by the FOXM1 transcription factor, has been proven to function as an oncogenic gene that is closely associated with mitotic progression as well as the proliferation in multiple human cancers (Wang et al., 2014, 2016). AURKB is highly expressed in many cancers. By regulating the cell cycle progression and mitosis, AURKB is thus involved in tumorigenesis and predicts poor prognosis in numerous human tumors (Wan et al., 2019). BUB1, a mitotic checkpoint serine/threonine kinase, regulates chromosome segregation, and indicates a poor clinical outcome in many cancers (Han et al., 2015). Taken together, our data revealed that almost all the 10 hub genes were correlated with cell cycle and mitosis.
Although the 10 hub genes have critical roles in the process of a variety of tumors, they are not reported to participate in SS progression. Based on the functions of the above identified 10 hub genes, it is established that the 10 hub genes promote tumor progression mainly by regulating the cell cycle or chromatin replication. Recent studies have showed that in the process of carcinogenesis, the cell cycle is critical and dysregulated cell cycle may cause uncontrolled cell proliferation, survival and differentiation which are essential for the early stages of carcinogenesis (Scott et al., 2015). Consisted with the above researches, our data from GO and KEGG enrichment as well as GSEA analyses indicated that most DEGs were involved in cell cycle, thus supporting the contribution of cell cycle to SS progression and metastasis. In order to further validate our results, the expression levels and the survival analysis of the 10 hub genes in SS were assessed using GEPIA and the Kaplan-Meier plotter database. As expected, all these hub gens were significantly higher in SS samples compared to normal samples, suggesting their crucial roles in carcinogenesis. More importantly, in agreement with the above reports, the survival analysis revealed that the 10 hub genes also had high prognostic values for SS, which would provide novel prognostic biomarkers for therapeutic targets for SS treatment.
Metastasis is a complex multistep process, characterized by a high rate of local invasion and early distant metastasis (Ren et al., 2017). Genetic and epigenetic alterations that occur in tumor cells are likely to contribute to tumor cell invasion and metastasis (Gibson et al., 2016). Recent evidences have revealed a key role of cell cycle arrest in cancer invasion and metastasis. Iwasaki et al. (1995) demonstrated that hepatocellular carcinoma cells acquire the ability to metastasize in the G1 phase of the cell cycle. In prostate cancer, by inhibiting the G1-to-S phase transition of the cell cycle, Runx2 promotes the invasiveness and bone metastasis (Baniwal et al., 2010). Also, the significant relationship between invasive cells and the G1/G0 cell cycle state is observed in breast cancer metastasis (Qian et al., 2013). However, to date, there were few researches regarding the effect of cell cycle on tumor cell metastasis in SS. Herein, this study reported that the identified 10 hub genes were mostly enriched in cell cycle regulation, indicating their roles as prognostic markers in SS metastasis.
In our study, a major limitation is that the expression and the survival analyses of the identified 10 hub genes were validated not in synovial sarcoma specifically, but for all sarcomas (GEPIA dataset does not have subdivisions into sarcoma types). However, despite this limitation, considering the data of GEPIA are from The Cancer Genome Atlas (TCGA), and because the expression of the 10 hub genes in Sarcoma-TCGA dataset is higher than normal tissues (data not shown), the results are still significant. For survival analysis, because only nine SS tissue samples were found in Sarcoma-TCGA dataset, the sample size is too small to supply meaningful statistical results. For this reason, the survival analyses were performed in all sarcoma dataset. When the amount of available SS samples will become large enough, the survival analyses of the identified 10 hub genes should be performed. Therefore, additional confirmation of our findings should be reserved for future studies.
Conclusion
In summary, based on the bioinformatics analysis of DEGs in SS metastasis samples and non-metastasis samples, this research successfully identified 10 hub genes (CENPF, KIF11, KIF23, TTK, MKI67, TOP2A, CDC45, MELK, AURKB, and BUB1). The critical pathway enriched in the 10 hub genes was cell cycle, which would uncover mechanistic insights into SS metastasis, thus promoting the development for the treatment of SS.
Data Availability Statement
Publicly available datasets were analyzed in this study, these can be found in the Gene Expression Omnibus database (GEO, https://www.ncbi.nlm.nih.gov/geo/) (GSE40018 and GSE40021).
Author Contributions
YS and CP conceived and designed the study. YS wrote the manuscript. CP and GC revised and polished the manuscript. XL, FW, and XW performed the analysis and interpretation of data. All authors read and approved the final manuscript.
Funding
The study was supported by the Key Research and Development Plan of Shandong Province (No. 2018GSF118084), the Jinan Clinical Medicine Science and Technology Innovation Plan (No. 201907059), the Youth Foundation of the Second Hospital of Shandong University (No. 2018YT28), and the National Natural Science Foundation of China (No. 81773790).
Conflict of Interest
The authors declare that the research was conducted in the absence of any commercial or financial relationships that could be construed as a potential conflict of interest.
Supplementary Material
The Supplementary Material for this article can be found online at: https://www.frontiersin.org/articles/10.3389/fgene.2020.530892/full#supplementary-material
FIGURE S1 | GSEA analysis of DEGs in GSE40021 dataset. (A) Biological processes, (B) cellular components, (C) molecular functions, (D) the signaling pathways.
FIGURE S2 | Function annotation of DEGs in the most significant module using Cytoscape plugins ClueGO and CluePedia. (A) Biological processes, (B) cellular components, (C) molecular functions. Different node colors represented different functional groups.
Footnotes
- ^ https://www.ncbi.nlm.nih.gov/geo/
- ^ http://www.ncbi.nlm.nih.gov/geo/geo2r
- ^ http://bioinfogp.cnb.csic.es/tools/venny/
- ^ https://david.ncifcrf.gov/
- ^ https://www.gsea-msigdb.org/gsea/index.jsp
- ^ https://string-db.org/
- ^ http://www.webgestalt.org/
- ^ http://gepia.cancer-pku.cn/index.html
- ^ http://kmplot.com/
References
Aytes, A., Mitrofanova, A., Lefebvre, C., Alvarez, M. J., Castillo-Martin, M., Zheng, T., et al. (2014). Cross-species regulatory network analysis identifies a synergistic interaction between FOXM1 and CENPF that drives prostate cancer malignancy. Cancer Cell. 25, 638–651. doi: 10.1016/j.ccr.2014.03.017
Bader, G. D., and Hogue, C. W. (2003). An automated method for finding molecular complexes in large protein interaction networks. BMC Bioinform. 4:2. doi: 10.1186/1471-2105-4-2
Baniwal, S. K., Khalid, O., Gabet, Y., Shah, R. R., Purcell, D. J., Mav, D., et al. (2010). Runx2 transcriptome of prostate cancer cells: insights into invasiveness and bone metastasis. Mol Cancer. 9:258. doi: 10.1186/1476-4598-9-258
Benassi, M. S., Pazzaglia, L., Novello, C., Quattrini, I., Pollino, S., Magagnoli, G., et al. (2015). Tissue and serum IGFBP7 protein as biomarker in high-grade soft tissue sarcoma. Am. J. Cancer Res. 5, 3446–3454.
Bindea, G., Galon, J., and Mlecnik, B. (2013). CluePedia Cytoscape plugin: pathway insights using integrated experimental and in silico data. Bioinformatics 29, 661–663. doi: 10.1093/bioinformatics/btt019
Bindea, G., Mlecnik, B., Hackl, H., Charoentong, P., Tosolini, M., Kirilovsky, A., et al. (2009). ClueGO: a Cytoscape plug-in to decipher functionally grouped gene ontology and pathway annotation networks. Bioinformatics 25, 1091–1093. doi: 10.1093/bioinformatics/btp101
Brase, J. C., Schmidt, M., Fischbach, T., Sultmann, H., Bojar, H., Koelbl, H., et al. (2010). ERBB2 and TOP2A in breast cancer: a comprehensive analysis of gene amplification, RNA levels, and protein expression and their influence on prognosis and prediction. Clin. Cancer Res. 16, 2391–2401. doi: 10.1158/1078-0432.CCR-09-2471
Chen, E. B., Qin, X., Peng, K., Li, Q., Tang, C., Wei, Y. C., et al. (2019). HnRNPR-CCNB1/CENPF axis contributes to gastric cancer proliferation and metastasis. Aging (Albany NY). 11, 7473–7491. doi: 10.18632/aging.102254
Cho, Y. J., Kim, S. H., Kim, E. K., Han, J. W., Shin, K. H., Hu, H., et al. (2018). Prognostic implications of polycomb proteins ezh2, suz12, and eed1 and histone modification by H3K27me3 in sarcoma. BMC Cancer 18:158. doi: 10.1186/s12885-018-4066-4066
Cuylen, S., Blaukopf, C., Politi, A. Z., Muller-Reichert, T., Neumann, B., Poser, I., et al. (2016). Ki-67 acts as a biological surfactant to disperse mitotic chromosomes. Nature 535, 308–312. doi: 10.1038/nature18610
Dai, Y., Liu, L., Zeng, T., Zhu, Y. H., Li, J., Chen, L., et al. (2013). Characterization of the oncogenic function of centromere protein F in hepatocellular carcinoma. Biochem. Biophys. Res. Commun. 436, 711–718. doi: 10.1016/j.bbrc.2013.06.021
Daigo, K., Takano, A., Thang, P. M., Yoshitake, Y., Shinohara, M., Tohnai, I., et al. (2018). Characterization of KIF11 as a novel prognostic biomarker and therapeutic target for oral cancer. Int. J. Oncol. 52, 155–165. doi: 10.3892/ijo.2017.4181
Deng, W., Wang, Y., Liu, Z., Cheng, H., and Xue, Y. (2014). HemI: a toolkit for illustrating heatmaps. PLoS One 9:e111988. doi: 10.1371/journal.pone.0111988
Desar, I. M. E., Fleuren, E. D. G., and van der Graaf, W. T. A. (2018). Systemic treatment for adults with synovial sarcoma. Curr. Treat Options Oncol. 19:13. doi: 10.1007/s11864-018-0525-521
Feng, Q., Guo, P., Wang, J., Zhang, X., Yang, H. C., and Feng, J. G. (2018). High expression of SDF-1 and VEGF is associated with poor prognosis in patients with synovial sarcomas. Exp. Ther. Med. 15, 2597–2603. doi: 10.3892/etm.2018.5684
Gibson, W. J., Hoivik, E. A., Halle, M. K., Taylor-Weiner, A., Cherniack, A. D., Berg, A., et al. (2016). The genomic landscape and evolution of endometrial carcinoma progression and abdominopelvic metastasis. Nat. Genet. 48, 848–855. doi: 10.1038/ng.3602
Han, J. Y., Han, Y. K., Park, G. Y., Kim, S. D., and Lee, C. G. (2015). Bub1 is required for maintaining cancer stem cells in breast cancer cell lines. Sci. Rep. 5:15993. doi: 10.1038/srep15993
Imai, T., Oue, N., Nishioka, M., Mukai, S., Oshima, T., Sakamoto, N., et al. (2017). Overexpression of KIF11 in gastric cancer with intestinal mucin Phenotype. Pathobiology 84, 16–24. doi: 10.1159/000447303
Iwasaki, T., Shinkai, K., Mukai, M., Yoshioka, K., Fujii, Y., Nakahara, K., et al. (1995). Cell-cycle-dependent invasion in vitro by rat ascites hepatoma cells. Int. J. Cancer 63, 282–287.
Kawauchi, S., Goto, Y., Liu, X. P., Furuya, T., Oga, A., Oda, Y., et al. (2001). Low expression of p27(Kip1), a cyclin-dependent kinase inhibitor, is a marker of poor prognosis in synovial sarcoma. Cancer 91, 1005–1012.
Krieg, A. H., Hefti, F., Speth, B. M., Jundt, G., Guillou, L., Exner, U. G., et al. (2011). Synovial sarcomas usually metastasize after >5 years: a multicenter retrospective analysis with minimum follow-up of 10 years for survivors. Ann. Oncol. 22, 458–467. doi: 10.1093/annonc/mdq394
Li, X. L., Ji, Y. M., Song, R., Li, X. N., and Guo, L. S. (2019). KIF23 promotes gastric cancer by stimulating cell proliferation. Dis. Markers 2019:9751923. doi: 10.1155/2019/9751923
Liberzon, A., Birger, C., Thorvaldsdottir, H., Ghandi, M., Mesirov, J. P., and Tamayo, P. (2015). The Molecular Signatures Database (MSigDB) hallmark gene set collection. Cell Syst. 1, 417–425. doi: 10.1016/j.cels.2015.12.004
Liu, L., Liu, X., Mare, M., Dumont, A. S., Zhang, H., Yan, D., et al. (2016). Overexpression of Eg5 correlates with high grade astrocytic neoplasm. J. Neurooncol. 126, 77–80. doi: 10.1007/s11060-015-1954-1953
Liu, Z., He, Y., Lian, X., Zou, H., Huang, Y., Wang, N., et al. (2019). Prognostic role of upregulated P300 expression in human cancers: a clinical study of synovial sarcoma and a meta-analysis. Exp. Ther. Med. 18, 3161–3171. doi: 10.3892/etm.2019.7906
Maekawa, A., Kohashi, K., Kuda, M., Iura, K., Ishii, T., Endo, M., et al. (2016). Prognostic significance of FOXM1 expression and antitumor effect of FOXM1 inhibition in synovial sarcomas. BMC Cancer 16:511. doi: 10.1186/s12885-016-2542-2544
Martin-Broto, J., Gutierrez, A. M., Ramos, R. F., Lopez-Guerrero, J. A., Ferrari, S., Stacchiotti, S., et al. (2014). MRP1 overexpression determines poor prognosis in prospectively treated patients with localized high-risk soft tissue sarcoma of limbs and trunk wall: an ISG/GEIS study. Mol. Cancer Ther. 13, 249–259. doi: 10.1158/1535-7163.MCT-13-0406
Morizawa, Y., Miyake, M., Shimada, K., Hori, S., Tatsumi, Y., Nakai, Y., et al. (2016). Extended resection including adjacent organs and Ki-67 labeling index are prognostic factors in patients with retroperitoneal soft tissue sarcomas. World J. Surg. Oncol. 14:43. doi: 10.1186/s12957-016-0810-z
Nagai, M., Tanaka, S., Tsuda, M., Endo, S., Kato, H., Sonobe, H., et al. (2001). Analysis of transforming activity of human synovial sarcoma-associated chimeric protein SYT-SSX1 bound to chromatin remodeling factor hBRM/hSNF2 alpha. Proc. Natl. Acad. Sci. U S A. 98, 3843–3848. doi: 10.1073/pnas.061036798
Oda, Y., Sakamoto, A., Saito, T., Kinukawa, N., Iwamoto, Y., and Tsuneyoshi, M. (2000). Expression of hepatocyte growth factor (HGF)/scatter factor and its receptor c-MET correlates with poor prognosis in synovial sarcoma. Hum. Pathol. 31, 185–192. doi: 10.1016/s0046-8177(00)80218-x
Peng, C., Zhao, H., Song, Y., Chen, W., Wang, X., Liu, X., et al. (2017). SHCBP1 promotes synovial sarcoma cell metastasis via targeting TGF-beta1/Smad signaling pathway and is associated with poor prognosis. J. Exp. Clin. Cancer Res. 36:141. doi: 10.1186/s13046-017-0616-z
Pollok, S., Bauerschmidt, C., Sanger, J., Nasheuer, H. P., and Grosse, F. (2007). Human Cdc45 is a proliferation-associated antigen. FEBS J. 274, 3669–3684. doi: 10.1111/j.1742-4658.2007.05900.x
Przybyl, J., Jurkowska, M., Rutkowski, P., Debiec-Rychter, M., and Siedlecki, J. A. (2012). Downstream and intermediate interactions of synovial sarcoma-associated fusion oncoproteins and their implication for targeted therapy. Sarcoma 2012:249219. doi: 10.1155/2012/249219
Qian, X., Hulit, J., Suyama, K., Eugenin, E. A., Belbin, T. J., Loudig, O., et al. (2013). p21CIP1 mediates reciprocal switching between proliferation and invasion during metastasis. Oncogene 32, 2292–2303. doi: 10.1038/onc.2012.249
Ren, X., Yang, X., Cheng, B., Chen, X., Zhang, T., He, Q., et al. (2017). HOPX hypermethylation promotes metastasis via activating SNAIL transcription in nasopharyngeal carcinoma. Nat. Commun. 8:14053. doi: 10.1038/ncomms14053
Roostalu, J., Hentrich, C., Bieling, P., Telley, I. A., Schiebel, E., and Surrey, T. (2011). Directional switching of the kinesin Cin8 through motor coupling. Science 332, 94–99. doi: 10.1126/science.1199945
Saito, T., Oda, Y., Sakamoto, A., Tamiya, S., Kinukawa, N., Hayashi, K., et al. (2000). Prognostic value of the preserved expression of the E-cadherin and catenin families of adhesion molecules and of beta-catenin mutations in synovial sarcoma. J. Pathol. 192, 342–350.
Scott, R. E., Ghule, P. N., Stein, J. L., and Stein, G. S. (2015). Cell cycle gene expression networks discovered using systems biology: significance in carcinogenesis. J. Cell Physiol. 230, 2533–2542. doi: 10.1002/jcp.24990
Subramanian, A., Tamayo, P., Mootha, V. K., Mukherjee, S., Ebert, B. L., Gillette, M. A., et al. (2005). Gene set enrichment analysis: a knowledge-based approach for interpreting genome-wide expression profiles. Proc. Natl. Acad. Sci. U S A. 102, 15545–15550. doi: 10.1073/pnas.0506580102
Sun, D., Lu, J., Ding, K., Bi, D., Niu, Z., Cao, Q., et al. (2013). The expression of Eg5 predicts a poor outcome for patients with renal cell carcinoma. Med. Oncol. 30:476. doi: 10.1007/s12032-013-0476-470
Sun, L., Zhang, C., Yang, Z., Wu, Y., Wang, H., Bao, Z., et al. (2016). KIF23 is an independent prognostic biomarker in glioma, transcriptionally regulated by TCF-4. Oncotarget 7, 24646–24655. doi: 10.18632/oncotarget.8261
Sun, X., Jin, Z., Song, X., Wang, J., Li, Y., Qian, X., et al. (2015). Evaluation of KIF23 variant 1 expression and relevance as a novel prognostic factor in patients with hepatocellular carcinoma. BMC Cancer 15:961. doi: 10.1186/s12885-015-1987-1981
Sun, Y., Sun, B., Wang, J., Cai, W., Zhao, X., Zhang, S., et al. (2009). Prognostic implication of SYT-SSX fusion type, and clinicopathological parameters for tumor-related death, recurrence, and metastasis in synovial sarcoma. Cancer Sci. 100, 1018–1025. doi: 10.1111/j.1349-7006.2009.01134.x
Svejstrup, J. Q. (2013). Synovial sarcoma mechanisms: a series of unfortunate events. Cell 153, 11–12. doi: 10.1016/j.cell.2013.03.015
Tang, Z., Li, C., Kang, B., Gao, G., Li, C., and Zhang, Z. (2017). GEPIA: a web server for cancer and normal gene expression profiling and interactive analyses. Nucleic Acids Res. 45, W98–W102. doi: 10.1093/nar/gkx247
Vikberg, A. L., Vooder, T., Lokk, K., Annilo, T., and Golovleva, I. (2017). Mutation analysis and copy number alterations of KIF23 in non-small-cell lung cancer exhibiting KIF23 over-expression. Onco Targets Ther. 10, 4969–4979. doi: 10.2147/OTT.S138420
Volkweis, B. S., Gurski, R. R., Meurer, L., Pretto, G. G., Mazzini Gda, S., and Edelweiss, M. I. (2012). Ki-67 antigen overexpression is associated with the metaplasia-adenocarcinoma sequence in barrett’s esophagus. Gastroenterol. Res. Pract. 2012:639748. doi: 10.1155/2012/639748
Wan, B., Huang, Y., Liu, B., Lu, L., and Lv, C. (2019). AURKB: a promising biomarker in clear cell renal cell carcinoma. PeerJ 7:e7718. doi: 10.7717/peerj.7718
Wang, Y., Begley, M., Li, Q., Huang, H. T., Lako, A., Eck, M. J., et al. (2016). Mitotic MELK-eIF4B signaling controls protein synthesis and tumor cell survival. Proc. Natl. Acad. Sci. U S A. 113, 9810–9815. doi: 10.1073/pnas.1606862113
Wang, Y., Lee, Y. M., Baitsch, L., Huang, A., Xiang, Y., Tong, H., et al. (2014). MELK is an oncogenic kinase essential for mitotic progression in basal-like breast cancer cells. Elife 3:e01763. doi: 10.7554/eLife.01763
Yalcinkaya, U., Ugras, N., Ozgun, G., Ocakoglu, G., Deligonul, A., Cetintas, S. K., et al. (2017). Enhancer of zeste homologue 2 (EZH2) expression in synovial sarcomas as a promising indicator of prognosis. Bosn J. Basic Med. Sci. 17, 302–308. doi: 10.17305/bjbms.2017.1938
Yang, C. H., Kasbek, C., Majumder, S., Yusof, A. M., and Fisk, H. A. (2010). Mps1 phosphorylation sites regulate the function of centrin 2 in centriole assembly. Mol. Biol. Cell 21, 4361–4372. doi: 10.1091/mbc.E10-04-0298
Zeng, S., Liu, A., Dai, L., Yu, X., Zhang, Z., Xiong, Q., et al. (2019). Prognostic value of TOP2A in bladder urothelial carcinoma and potential molecular mechanisms. BMC Cancer 19:604. doi: 10.1186/s12885-019-5814-y
Zhou, J., Chen, W. R., Yang, L. C., Wang, J., Sun, J. Y., Zhang, W. W., et al. (2019). KIF11 functions as an oncogene and is associated with poor outcomes from breast cancer. Cancer Res. Treat 51, 1207–1221. doi: 10.4143/crt.2018.460
Keywords: synovial sarcoma (SS), bioinformatics analysis, differentially expressed genes (DEGs), protein-protein interaction (PPI), hub genes, survival analysis
Citation: Song Y, Liu X, Wang F, Wang X, Cheng G and Peng C (2020) Identification of Metastasis-Associated Biomarkers in Synovial Sarcoma Using Bioinformatics Analysis. Front. Genet. 11:530892. doi: 10.3389/fgene.2020.530892
Received: 02 February 2020; Accepted: 13 August 2020;
Published: 11 September 2020.
Edited by:
Chun Liang, Miami University, United StatesReviewed by:
Ancha Baranova, George Mason University, United StatesHamed Bostan, North Carolina State University, United States
Copyright © 2020 Song, Liu, Wang, Wang, Cheng and Peng. This is an open-access article distributed under the terms of the Creative Commons Attribution License (CC BY). The use, distribution or reproduction in other forums is permitted, provided the original author(s) and the copyright owner(s) are credited and that the original publication in this journal is cited, in accordance with accepted academic practice. No use, distribution or reproduction is permitted which does not comply with these terms.
*Correspondence: Changliang Peng, cGVuZ2NoYW5nbGlhbmd2aXBAMTYzLmNvbQ==