 Chenchen Xiong
 Shaoping Sun
 Weili Jiang
 Lei Ma
 Junpeng Zhang
- 1Faculty of Information Engineering and Automation, Kunming University of Science and Technology, Kunming, China
- 2Department of Medical Engineering, People’s Hospital of Yuxi City, Yuxi, China
- 3School of Engineering, Dali University, Dali, China
Autism spectrum disorder (ASD) is a class of neurodevelopmental disorders characterized by genetic and environmental risk factors. The pathogenesis of ASD has a strong genetic basis, consisting of rare de novo or inherited variants among a variety of multiple molecules. Previous studies have shown that microRNAs (miRNAs) are involved in neurogenesis and brain development and are closely associated with the pathogenesis of ASD. However, the regulatory mechanisms of miRNAs in ASD are largely unclear. In this work, we present a stepwise method, ASDmiR, for the identification of underlying pathogenic genes, networks, and modules associated with ASD. First, we conduct a comparison study on 12 miRNA target prediction methods by using the matched miRNA, lncRNA, and mRNA expression data in ASD. In terms of the number of experimentally confirmed miRNA–target interactions predicted by each method, we choose the best method for identifying miRNA–target regulatory network. Based on the miRNA–target interaction network identified by the best method, we further infer miRNA–target regulatory bicliques or modules. In addition, by integrating high-confidence miRNA–target interactions and gene expression data, we identify three types of networks, including lncRNA–lncRNA, lncRNA–mRNA, and mRNA–mRNA related miRNA sponge interaction networks. To reveal the community of miRNA sponges, we further infer miRNA sponge modules from the identified miRNA sponge interaction network. Functional analysis results show that the identified hub genes, as well as miRNA-associated networks and modules, are closely linked with ASD. ASDmiR is freely available at https://github.com/chenchenxiong/ASDmiR.
Introduction
Autism spectrum disorder (ASD) encompasses a variety of complex inheritable neurodevelopment disorders that usually occur before 3 years old and last throughout a person’s life (Fregeac et al., 2016; Quesnel-Vallieres et al., 2019). ASD patients are characterized by controlled social interactions, restricted activities, and repetitive behavior (Chen et al., 2015). The current diagnosis of ASD is mainly based on behavioral characteristics (Gillian et al., 2003), which may cause misdiagnosis or delay treatment. Previous transcriptomic studies (Voineagu et al., 2011; Gupta et al., 2014; Ansel et al., 2016; Quesnel-Vallieres et al., 2019) have reported that ASD has strong genetic complexity, and many genes are involved in the ASD-related biological processes, including neuronal activity (Voineagu et al., 2011), immune response (Gupta et al., 2014; Ansel et al., 2016), and signaling pathways (Quesnel-Vallieres et al., 2019). Although great progress has been made to study the pathogenesis of ASD, the gene regulation in ASD is largely unknown because of the heterogeneity and complexity of ASD. Therefore, it is necessary to investigate the pathogenesis and molecular mechanisms underlying ASD for improving the diagnosis and therapeutic strategies of patients.
At the genetic level, microRNAs (miRNAs) are important regulators of brain function and neuronal development (Rajman and Schratt, 2017; Shen et al., 2019). By binding with messenger RNAs (mRNAs) at the post-transcriptional level, miRNAs as tiny non-coding RNA molecules (∼22 nucleotides) can induce repression or translational inhabitation of mRNAs (Ambros, 2004). Previous studies (Ander et al., 2015; Hu et al., 2017; Shen et al., 2016) have elucidated that miRNAs participate in several biological processes that are closely associated with ASD, including synaptic plasticity and neuronal development (Hu et al., 2017), immune response (Ander et al., 2015), and signaling pathways (Shen et al., 2016). These studies have also indicated that miRNAs and their corresponding targets could help to uncover ASD pathogenesis.
Long non-coding RNAs (LncRNAs) are transcripts with a length of more than 200 nucleotides, and they play critical roles in the progression of neuropsychiatric disorders including ASD (Hosseini et al., 2019). In the developmental processes of ASD, lncRNAs take part in several important biological processes, including neuronal architecture and immune response (Kerin et al., 2012), synaptic and neuronal excitatory dysfunction (Noor et al., 2010), neurite elaboration (Wang et al., 2015), and alternative splicing (Parikshak et al., 2016). These studies have demonstrated the potential contribution of lncRNAs on revealing the molecular mechanisms of ASD.
According to competing endogenous RNA hypothesis (Salmena et al., 2011), coding and non-coding RNA transcripts compete with each other by base pairing with miRNA-recognition elements (MREs). These transcripts are also known as miRNA sponges, including mRNAs (Tay et al., 2011), lncRNAs (Cesana et al., 2011), pseudogenes (Poliseno et al., 2010), and circular RNAs (circRNAs) (Hansen et al., 2013). All types of miRNA sponges crosstalk with other through MREs and form a large-scale miRNA sponge interaction network (Salmena et al., 2011). Although accumulating miRNA sponges have been experimentally identified and are closely relevant to various cancers (Le et al., 2017), the roles of miRNA sponges in ASD are largely unknown. To uncover potential roles of miRNA sponges in ASD, we focus on investigating lncRNA and mRNA related miRNA sponge interaction networks in ASD in this work.
There have been growing computational methods to effectively explore miRNA functions based on gene expression data. However, current bioinformatics research on miRNA regulatory mechanisms related to ASD is still in its infancy. In this work, we propose a novel stepwise method, ASDmiR, to uncover miRNA regulation in ASD. ASDmiR has two main contributions as follows. First, ASDmiR can be used to study ASD-related miRNA regulation at both the network and module level. Secondly, ASDmiR can help to explore both direct and indirect miRNA regulation in ASD. At the network level, we identify two types of ASD-related networks: miRNA–target regulatory network and miRNA sponge interaction network. Meanwhile, at the module level, we infer two types of ASD-related modules: miRNA–target regulatory modules and miRNA sponge modules. Topological analysis and functional analysis have shown that the identified miRNA-associated networks and modules are highly implicated in ASD.
Materials and Methods
Data Acquisition and Preprocessing
Differential Expression Analysis
Previous studies (Mohr and Liew, 2007; Segura et al., 2015; Ansel et al., 2016) have discovered that peripheral blood samples are more accessible than brain tissue samples in the transcriptomic study of ASD. In this work, we obtained the matched miRNA, lncRNA, and mRNA expression profiles of ASD from Kong et al. (2012). The samples of gene expression profiles are from peripheral blood samples and are categorized as ASD (104 samples) and normal (82 samples). We apply the miRBaseConverter (Xu et al., 2018) R package to convert miRNA names into the latest version of miRBase. To discover the differentially expressed miRNAs, lncRNAs, and mRNAs between ASD samples and normal samples, we conduct differential expression analysis using the limma R package (Ritchie et al., 2015). In the ASD dataset, the changes in mRNA expression level between ASD samples and normal samples are large, while the changes in the case of miRNAs and lncRNAs are small. To cover important ASD-related miRNAs and lncRNAs and to have a moderate number of mRNAs for ASDmiR, we select top 100 miRNAs, 300 lncRNAs, and 4,000 mRNAs ranked by adjusted p-values (adjusted by the Benjamini and Hochberg method) in the differential gene expression analysis for subsequent analysis. The detailed results of differentially expressed miRNAs, lncRNAs, and mRNAs can be seen in Supplementary Table 1.
MiRNA-Target Interactions
For putative miRNA–mRNA interactions, we have obtained 762,540 unique interactions between 2,600 miRNAs and 21,538 mRNAs from miRTarBase v8.0 (Chou et al., 2018) and TarBase v8.0 (Karagkouni et al., 2018) databases. By combining the interactions from LncBase v2.0 (Paraskevopoulou et al., 2016) and NPInter v4.0 (Teng et al., 2020) databases, we have collected 138,951 unique miRNA–lncRNA interactions between 1,044 miRNAs and 13,243 lncRNAs. The obtained miRNA–target interactions could be seen in Supplementary Table 2.
ASD-Related Genes
In this work, we collect a list of miRNAs, lncRNAs, and mRNAs associated with ASD to investigate ASD-related miRNA regulation. In total, we have obtained a list of 141 ASD-related miRNAs from HMDD v3.2 (Huang et al., 2019) and MNDR v2.0 (Cui et al., 2018), a list of 117 ASD-related lncRNAs from LncRNADisease v2.0 (Bao et al., 2019) and MNDR v2.0 (Cui et al., 2018), and a list of 1,658 ASD-related mRNAs from the Simons Foundation Autism Research Initiative (SFARI)1 and DisGeNET v7.0 (Pinero et al., 2020). The obtained ASD-related miRNAs, lncRNAs, and mRNAs could be seen in Supplementary Table 2.
Methods
Overview of ASDmiR
In Figure 1, the workflow of ASDmiR includes three major steps for identifying miRNA-associated networks and modules related to ASD. In the first step, by using the matched miRNA, lncRNA, and mRNA expression profiles, we conduct a comparison study of 12 commonly used miRNA target prediction methods from Le et al. (2015). In terms of the number of experimentally validated miRNA–mRNA interactions, we select the best performing method to identify miRNA–target regulatory network in ASD dataset. Furthermore, we infer miRNA–target regulatory modules based on the identified miRNA–target regulatory network. In the second step, we use the well-cited sensitivity partial Pearson correlation (SPPC) method (Paci et al., 2014) to identify miRNA sponge interaction network by integrating putative miRNA–target interactions and gene expression data. Moreover, the Markov cluster (MCL) algorithm (Enright et al., 2002) is used to discover miRNA sponge modules for investigating the community of miRNA sponges. In the final step, we conduct functional analysis of the identified miRNA-associated networks and modules. In the following, we will describe the details of these steps.
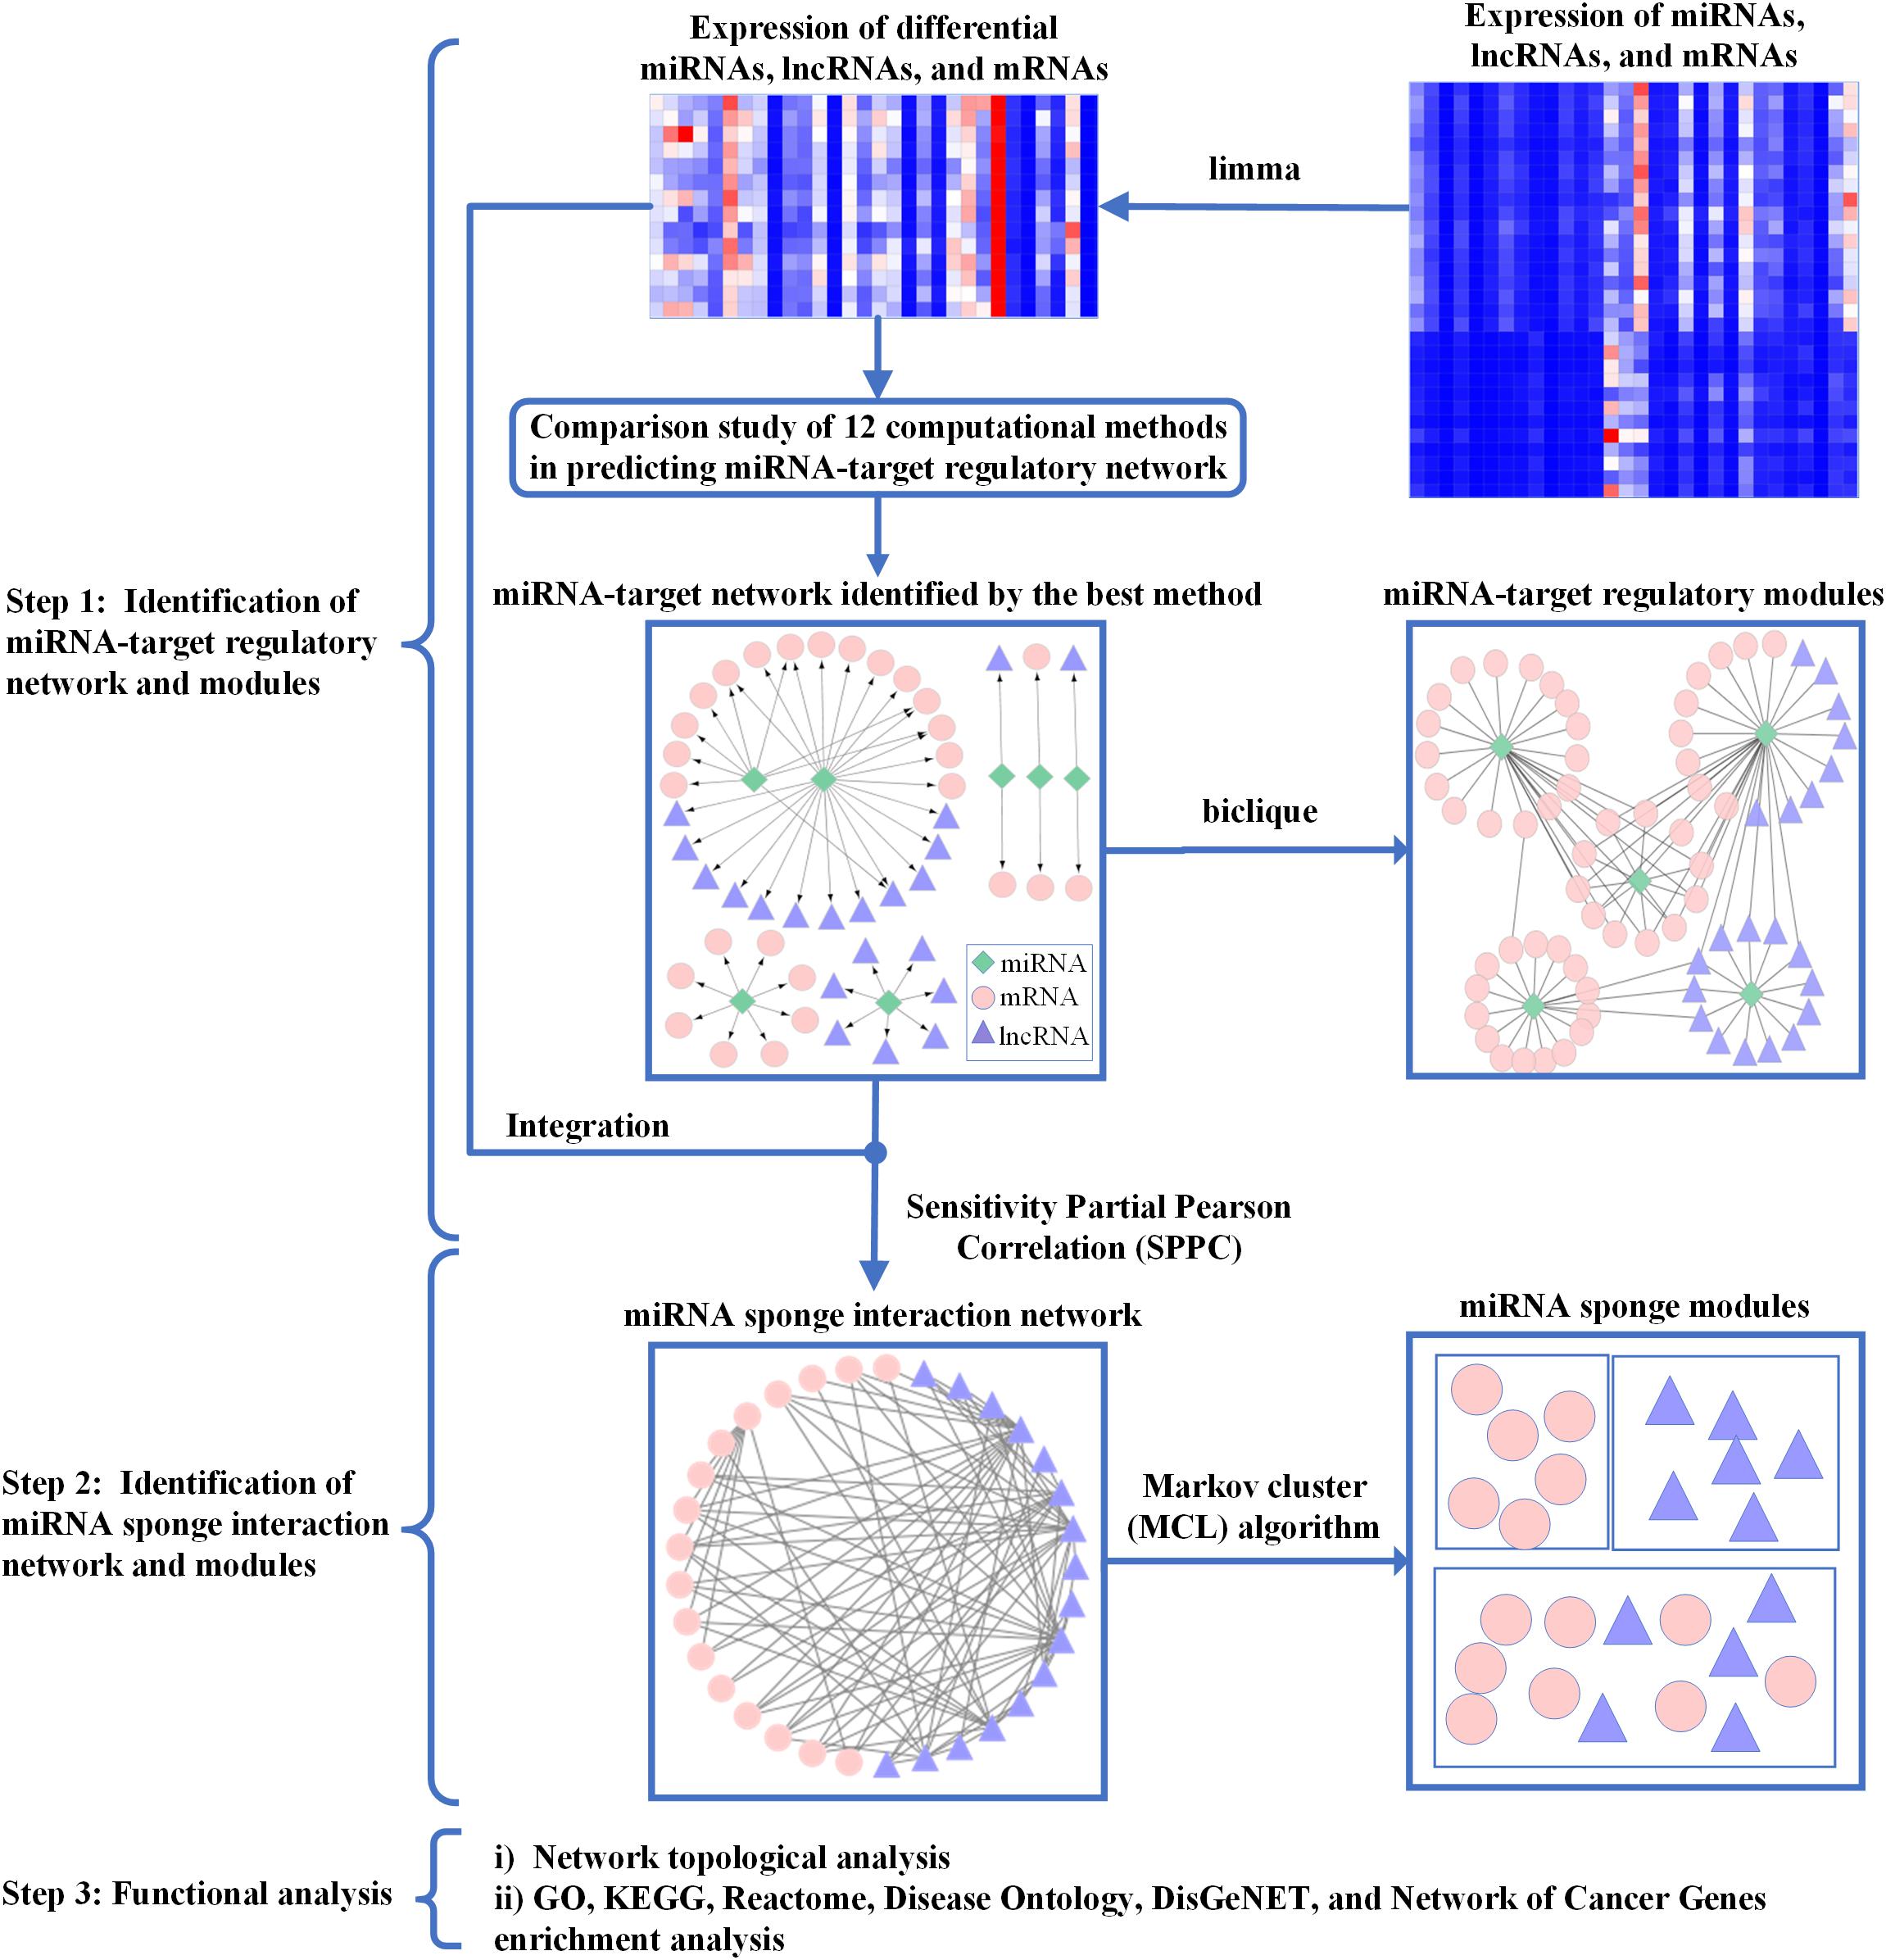
Figure 1. The workflow of ASDmiR. In Step 1, by integrating expression data of differential miRNAs, lncRNAs, and mRNAs and putative miRNA–target interactions, we identify miRNA–target regulatory networks using 12 existing computational methods. The miRNA–target regulatory network predicted by the best method is used for identifying miRNA–target regulatory modules. In Step 2, based on putative miRNA–mRNA interactions and gene expression data, we infer miRNA sponge interaction network using the sensitivity partial Pearson correlation method. Furthermore, we identify miRNA sponge modules from the identified miRNA sponge interaction network by using the Markov cluster algorithm. In Step 3, we conduct functional analysis of the identified miRNA-associated networks and modules. Green rhombic, pink circle, and purple triangle nodes represent miRNAs, mRNAs, and lncRNAs, respectively.
Identification of miRNA-Target Regulatory Network and Modules
To identify miRNA–target interactions, we use 12 existing computational methods implemented in the miRLAB R package (Le et al., 2015). These miRNA target prediction methods could be categorized into four types: correlation methods, regression methods, causal inference methods, and other methods. The first type of computational methods, including Pearson (Pearson, 1920), Spearman (Spearman, 1904), Kendall (Kendall, 1938), Distance correlation (Székely et al., 2007), and Hoeffding’s D measure (Hoeffding, 1948), could calculate linear correlation relationships between miRNAs and targets. To capture non-linear relationships between miRNAs and targets, the randomized dependence coefficient (Lopez-Paz et al., 2013) and Mutual Information (MI) (Moon et al., 1995) methods are utilized. For the second type of computational methods, Lasso (Tibshirani, 1996) and Elastic-net (Zou and Hastie, 2005) are used to identify the associations between miRNAs and targets. As for the third type of computational methods, the IDA (Intervention calculus when the Directed acyclic graph is Absent) method (Maathuis et al., 2009) is selected to estimate the causal effects that miRNAs have on mRNAs. For the fourth type of computational methods, Z score (Prill et al., 2010) and probabilistic MiRNA–mRNA Interaction Signature (ProMISe) (Li et al., 2014) are used. The Z score method is commonly used in gene-knockdown experiments to estimate the effect of knocking out a miRNA on mRNAs, and the ProMISe method estimates the probability of a miRNA targeting each mRNA by considering the competition among mRNAs and the competition among miRNAs. In this work, miRNAs are upstream variables, and targets (lncRNAs and mRNAs) are downstream variables. For each computational method, we use experimentally validated miRNA–target interactions as the ground truth to validate top 50, 100, 150, 200 predicted targets of each miRNA. The more the number of miRNA–target interactions validated by the ground truth is, the better the computational method performs.
It is known that genes tend to implement a specific biological process in the form of a community or module (Choobdar et al., 2019). Therefore, we further identify miRNA–target regulatory modules based on the identified miRNA–target regulatory network. Different from other biological networks (i.e., protein-protein interaction network), the miRNA–target regulatory network is a bipartite network. Consequently, the generated miRNA–target modules are actually bicliques where every miRNA of the miRNA set is connected to each target gene of the target gene set (Yoon et al., 2019). In this work, we utilize the R package biclique (Zhang et al., 2014) to enumerate all bicliques from the identified miRNA–target bipartite network. Here, a biclique corresponds to a miRNA–target regulatory module, and we only consider the bicliques with at least 3 miRNAs and 3 targets.
Identification of MiRNA Sponge Interaction Network and Modules
In this section, we apply the SPPC method (Paci et al., 2014) implemented in the miRspongeR R package (Zhang et al., 2019) to infer miRNA sponge interactions. The SPPC method takes miRNA, lncRNA, and mRNA expression data into account for identifying miRNA sponge interactions, and quantitatively evaluates the effect of sharing miRNAs on each miRNA sponge interaction pair at the expression level. This method uses three constraints (significant sharing of common miRNAs, significant positive correlation, and adequate sensitivity correlation) to evaluate whether a candidate RNA–RNA pair (lncRNA–lncRNA, lncRNA–mRNA, and mRNA–mRNA pair) is a miRNA sponge interaction or not. Given two competing RNAs (RNAi and RNAj), the significance p-value of sharing miRNAs and positive correlation is usually set to be 0.05. The Sensitive Correlation (SC) between the RNAi–RNAj pair is calculated as follows:
Where ρij denotes Pearson correlation (Pearson, 1920) between RNAi and RNAj, and ρij|n is partial Pearson correlation between RNAi and RNAj on the condition of n sharing miRNAs. In this work, the cutoff of SC is set to be 0.25 (see “The Identified MiRNA-Associated Modules Are Functional” for details). After assembling the identified miRNA sponge interactions, we could gain three types of networks, including lncRNA–lncRNA, lncRNA–mRNA, and mRNA–mRNA related miRNA sponge interaction networks. At the module level, we further infer miRNA sponge modules by using the Markov cluster (MCL) algorithm (Enright et al., 2002). For each module, the number of miRNA sponges (lncRNAs or mRNAs) is at least 3.
Functional Analysis
The hub genes may play key roles in the characteristics and development of complex diseases (Zhang et al., 2018). Consequently, at the network level, we focus on identifying hub genes from both the identified miRNA–target regulatory network and miRNA sponge interaction network. Empirically, we choose top 20% miRNAs or miRNA sponges with the largest degree as hub miRNAs or hub miRNA sponges. Furthermore, we use the miEAA (Kern et al., 2020) online tool to conduct functional enrichment analysis of hub miRNAs, and the miRspongeR (Zhang et al., 2019) R package for functional enrichment analysis of hub miRNA sponges.
At the module level, to know the potential diseases, biological processes, and pathways associated with the identified miRNA-associated modules, we conduct functional enrichment analysis using the well-cited clusterProfiler (Yu et al., 2012) R package. The third-party databases for functional enrichment analysis include Gene Ontology database (GO)2, Kyoto Encyclopedia of Genes and Genomes Pathway database (KEGG)3, Reactome Pathway database (Reactome)4, Disease Ontology database5, DisGeNET database6, and Network of Cancer Genes database7. The enriched term (GO, KEGG, Reactome, Disease Ontology, DisGeNET, or Network of Cancer Genes term) with adjusted p < 0.05 (adjusted by the Benjamini and Hochberg method) is regarded as a significantly enriched term.
Results
MiRNA-Associated Networks Are Scale-Free Networks
We first follow Step 1 to obtain miRNA–target interactions predicted by each of the 12 computational methods (details in the section “Methods”). The aim of comparing the performance of these methods is to select the best prediction method to identify miRNA–target regulatory network in ASD. For each method, we select top 50, 100, 150, and 200 targets of each miRNA for the comparison. The method of predicting the largest number of experimentally validated miRNA–target interactions is used to identify miRNA–target regulatory network in ASD. As displayed in Figure 2, the ProMISe method performs the best in terms of the number of experimentally validated miRNA–target interactions. Thus, we merge top 200 targets of each miRNA identified by the ProMISe method as our final predicted miRNA–target regulatory network (consisting of 20,000 miRNA–lncRNA interactions and 20,000 miRNA–mRNA interactions). In total, we obtain a list of 1,679 validated miRNA–target interactions, consisting of 241 validated miRNA–lncRNA interactions and 1,438 validated miRNA–mRNA interactions. We further analyze the node degree distribution of the identified miRNA–target regulatory network using the Network Analyzer plugin (Assenov et al., 2008) in Cytoscape (Shannon, 2003), and discover that our identified miRNA–target regulatory network follows power law distribution well in the form of P(k) = 67.593k–1.022 with R2 = 0.783, where P(k) represents the number of nodes with the node degree k. A higher R2 (range from 0 to 1) indicates that the identified miRNA–target regulatory network is more likely to be a scale-free network that occurs in the real world. The detailed results of the identified miRNA–target regulatory network can be found in Supplementary Table 3.
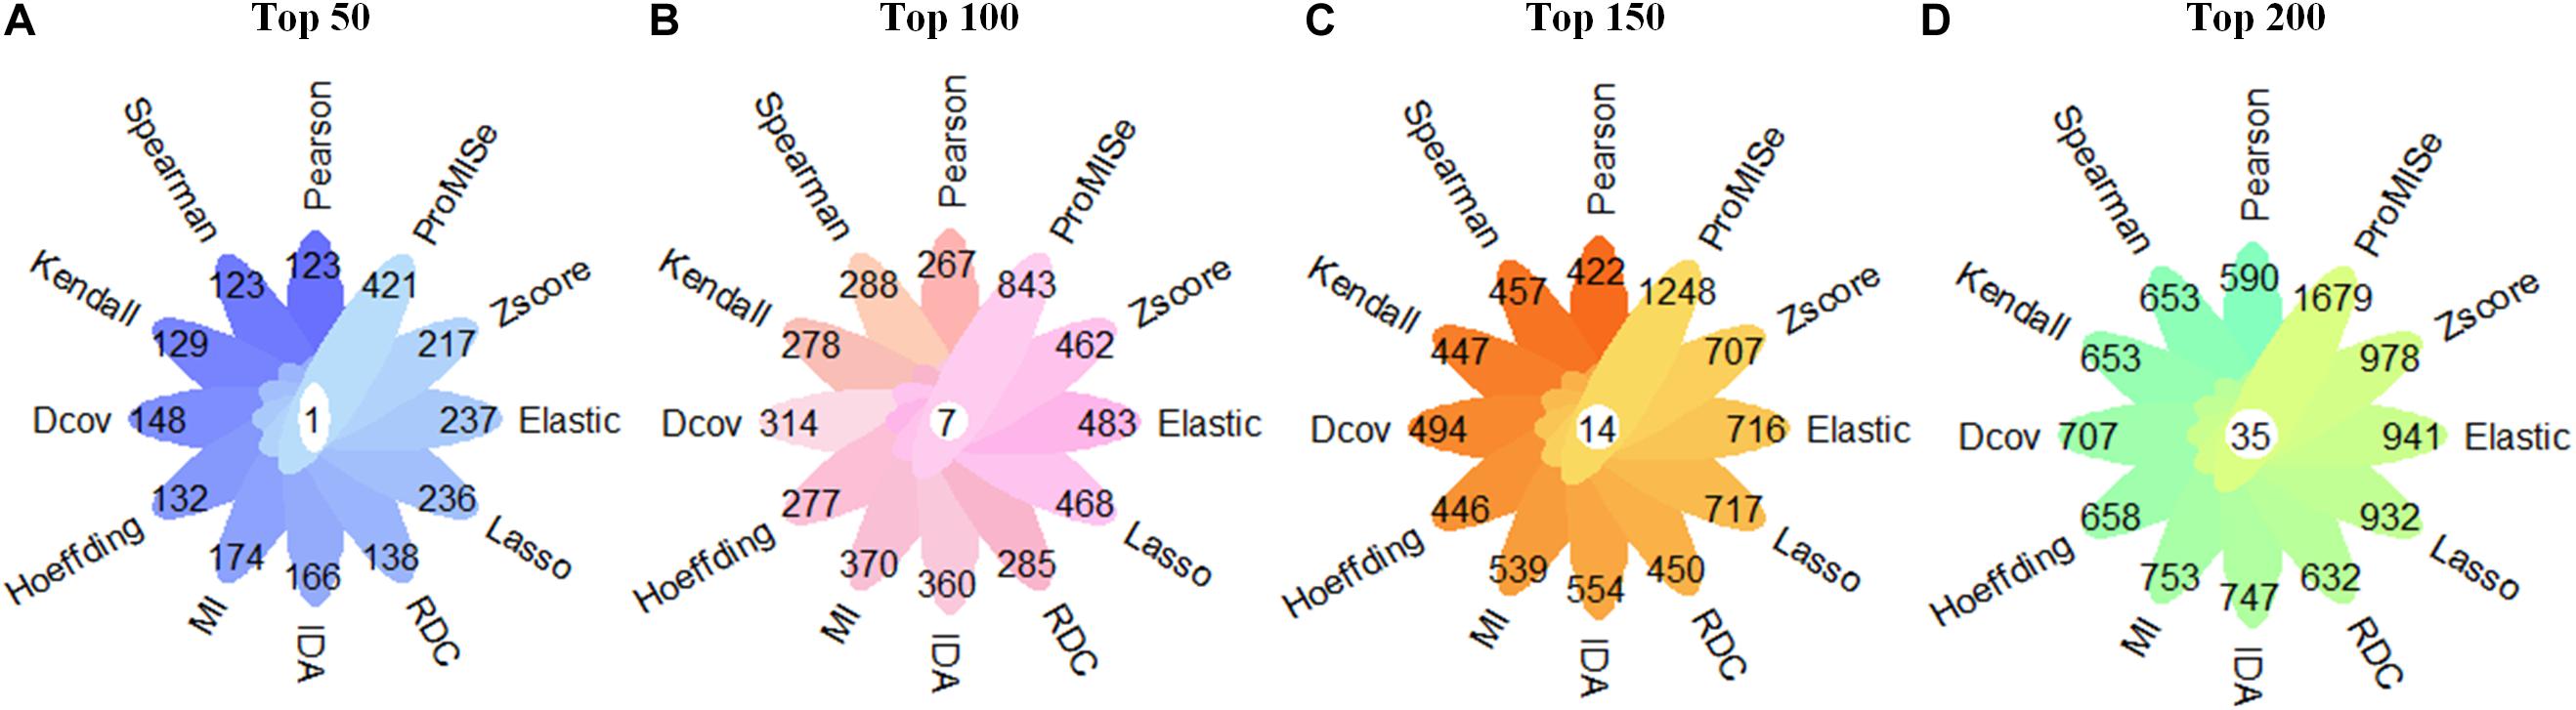
Figure 2. Comparison in terms of the number of confirmed miRNA–target interactions using 12 miRNA–target prediction methods. (A) The number of validated miRNA–target interactions in the case of top 50 miRNA–target interactions of each miRNA. (B) The number of validated miRNA–target interactions in the case of top 100 miRNA–target interactions of each miRNA. (C) The number of validated miRNA–target interactions in the case of top 150 miRNA–target interactions of each miRNA. (D) The number of validated miRNA–target interactions in the case of top 200 miRNA–target interactions of each miRNA. The numbers in the white circle denote the overlap of validated miRNA–target interactions by 12 computational methods.
By following Step 2, we use different SC cutoffs from 0.1 to 0.3 with a step of 0.05, to infer the miRNA sponge interaction network with better power law distribution. Under different SC cutoffs, we use R2 value to evaluate the goodness of power law degree distribution for the identified miRNA sponge interaction network. If a miRNA sponge interaction network with higher R2 value, the network is more likely to be a real biological network. As shown in Figure 3, according to the principle of the largest R2 value, we select the SC cutoff as 0.25 to infer miRNA sponge interaction network (containing 156 miRNA sponge interactions) that fits power law distribution well in the form of P(k) = 26.127k–1.176 with R2 = 0.815. The detailed results of the identified miRNA sponge interaction network can be found in Supplementary Table 3.
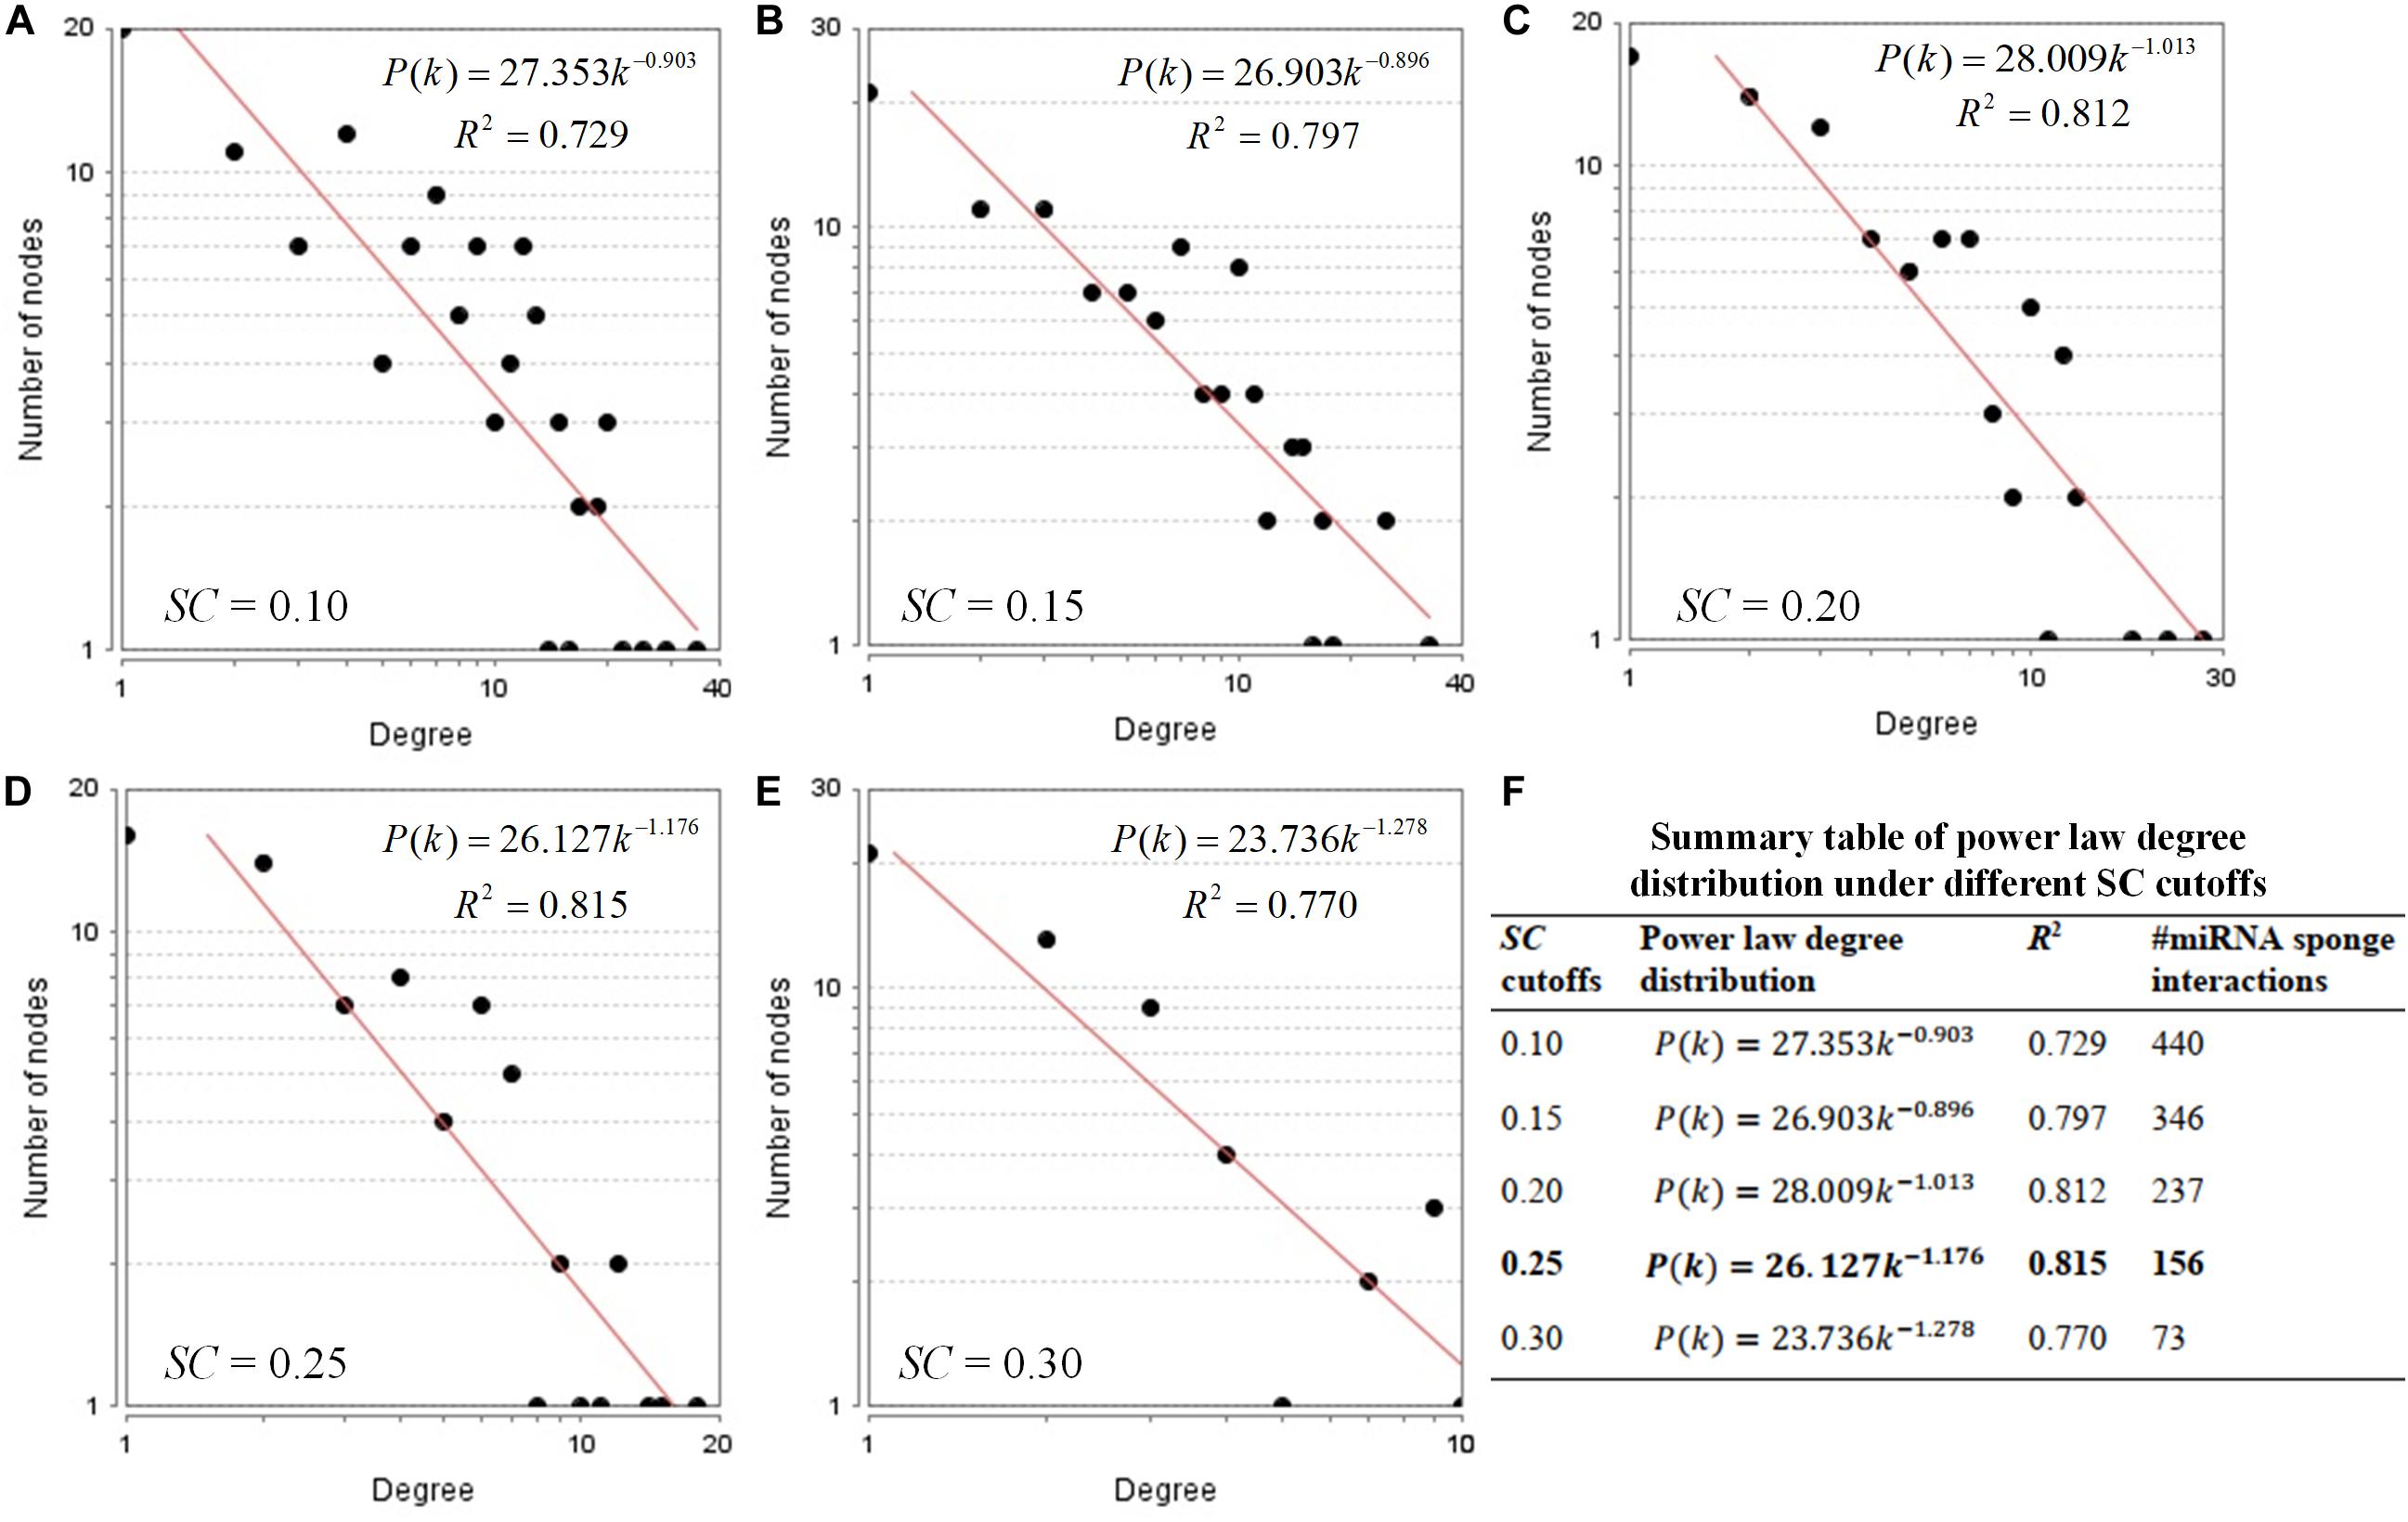
Figure 3. Power law degree distribution of the identified miRNA sponge interaction networks. (A–E) Node degree distribution of the identified miRNA sponge interaction networks using different SC cutoffs from 0.1 to 0.3 with a step of 0.05. (F) Summary table of power law degree distribution under different SC cutoffs.
Hub Genes Are Closely Associated With ASD
In this work, we have identified 12 hub miRNAs (hsa-miR-195-5p, hsa-miR-15a-5p, hsa-miR-26b-5p, hsa-miR-23a-3p, hsa-miR-93-5p, hsa-miR-210-3p, hsa-miR-25-3p, hsa-miR-30b-5p, hsa-miR-148b-3p, hsa-miR-149-5p, hsa-miR-200c-3p, and hsa-miR-147a) and 15 hub miRNA sponges (SLC38A2, SHOC2, DDX6, WSB1, PURB, DDX5, DLEU2, USP15, C6orf62, ADAM10, STK4, LBR, PNISR, ANKRD44, and SERINC1). It is noted that four hub miRNAs (hsa-miR-148b-3p, hsa-miR-15a-5p, hsa-miR-23a-3p, and hsa-miR-93-5p) and two hub miRNA sponges (DLEU2 and USP15) are experimentally validated ASD-related hub genes.
In Figure 4A, we discover that 12 hub miRNAs are highly connected with their target genes, and several hub miRNAs synergistically regulate their target genes. To investigate the underlying biological implications of these hub miRNAs, we conduct functional 1enrichment analysis of the target genes of these hub miRNAs. Functional enrichment analysis results show that 439 GO terms and 128 KEGG pathways are significantly associated with the target genes of the hub miRNAs. Moreover, several significantly enriched GO biological processes and KEGG pathways, including Cell cycle arrest (GO: 0007050), Regulation of immune response (GO: 0050776) (Gupta et al., 2014) (Ander et al., 2015), Nervous system development (GO:0007399) (Hu et al., 2017), NF-kappa B signaling pathway (hsa04064) (Malik et al., 2011), Long-term depression (hsa04730) (Monday et al., 2018), Wnt signaling pathway (hsa04310) (Shen et al., 2016), and gastric cancer (hsa05226) (Wasilewska and Klukowski, 2015) are closely associated with the progression and development of ASD (Figure 4B). As for the identified hub miRNA sponges, functional enrichment analysis results indicate that they are significantly enriched in SMAD binding (GO: 0046332). A previous study (Avazzadeh et al., 2019) has demonstrated that SMAD binding is closely related to ASD. Altogether, the above functional enrichment analysis results imply that the identified hub genes are closely associated with the occurrence and development of ASD. The functional enrichment analysis results of hub genes can be found in Supplementary Table 4.
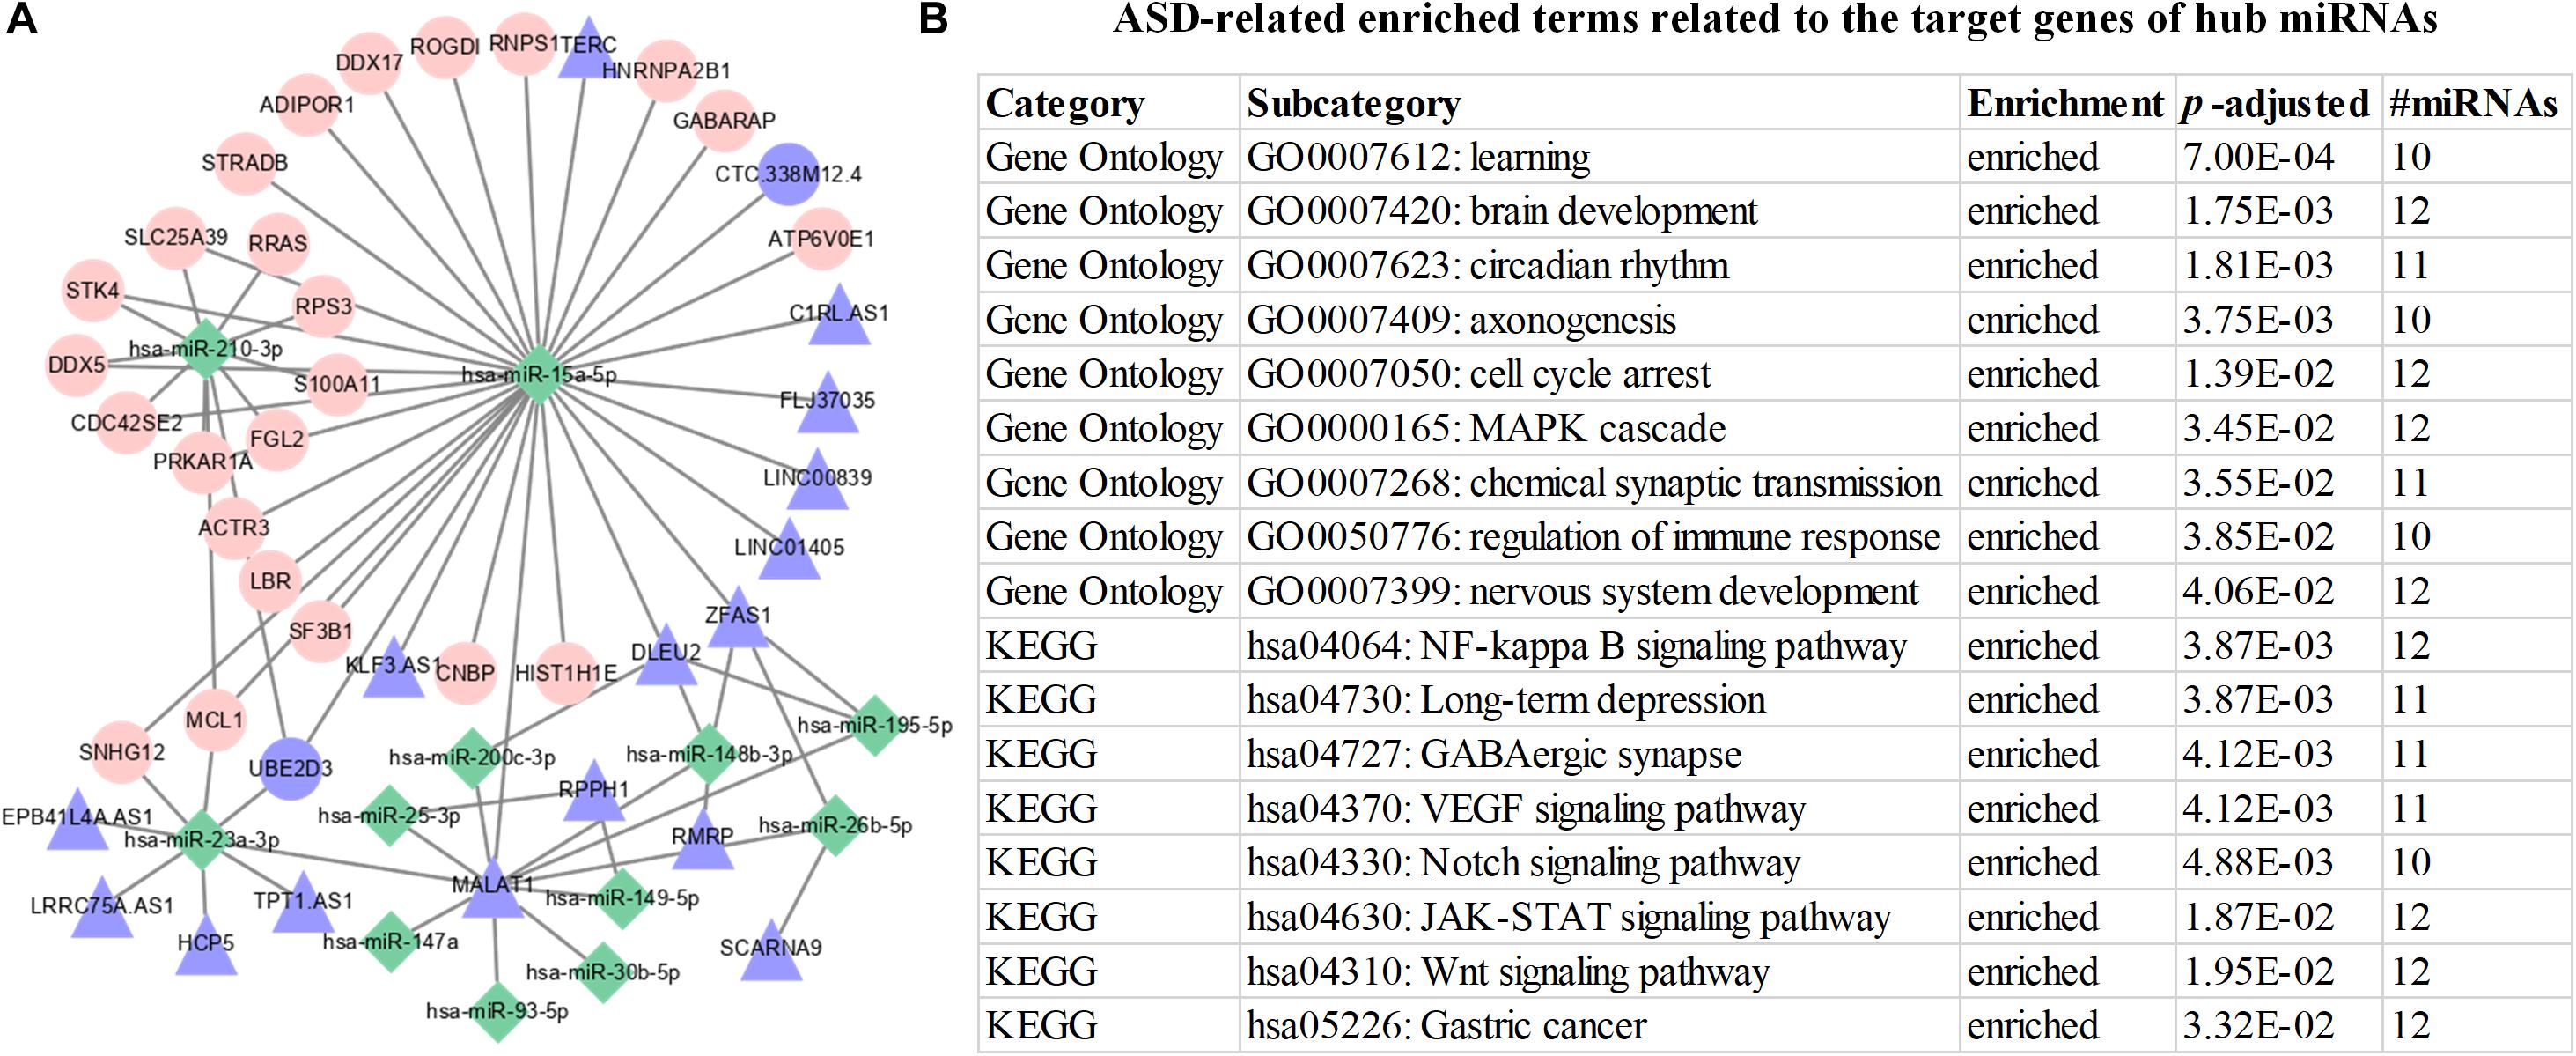
Figure 4. Visualization and functional enrichment analysis of hub miRNA regulatory network. (A) Hub miRNA regulatory network. Green rhombic, pink circle, and purple triangle nodes denote miRNAs, mRNAs, and lncRNAs, respectively. (B) ASD-related enriched terms related to the target genes of hub miRNAs.
The Identified MiRNA-Associated Modules Are Functional
Based on the identified miRNA–target network, we have identified 9,625 miRNA–target regulatory modules. In this work, we are only interested in studying the potential biological functions of top 20 largest miRNA–target regulatory modules. Moreover, we have obtained 10 miRNA sponge modules from the identified miRNA sponge interaction network. Disease and functional enrichment analysis indicate that the top 20 largest miRNA–target regulatory modules are significantly enriched in 397 GO terms, 3 KEGG pathways, 12 Reactome pathways, and 69 DisGeNET terms. Specifically, several biological processes, pathways, and diseases, including anxiety disorder (umls: C0003469) (White et al., 2009), Alternative mRNA splicing (GO: 0000380) (Quesnel-Vallieres et al., 2019), circadian rhythm (GO: 0007623) (Hu et al., 2017), and mTOR signaling pathway (R-HSA-165159) (Khlebodarova et al., 2018) are closely related to ASD (Table 1).
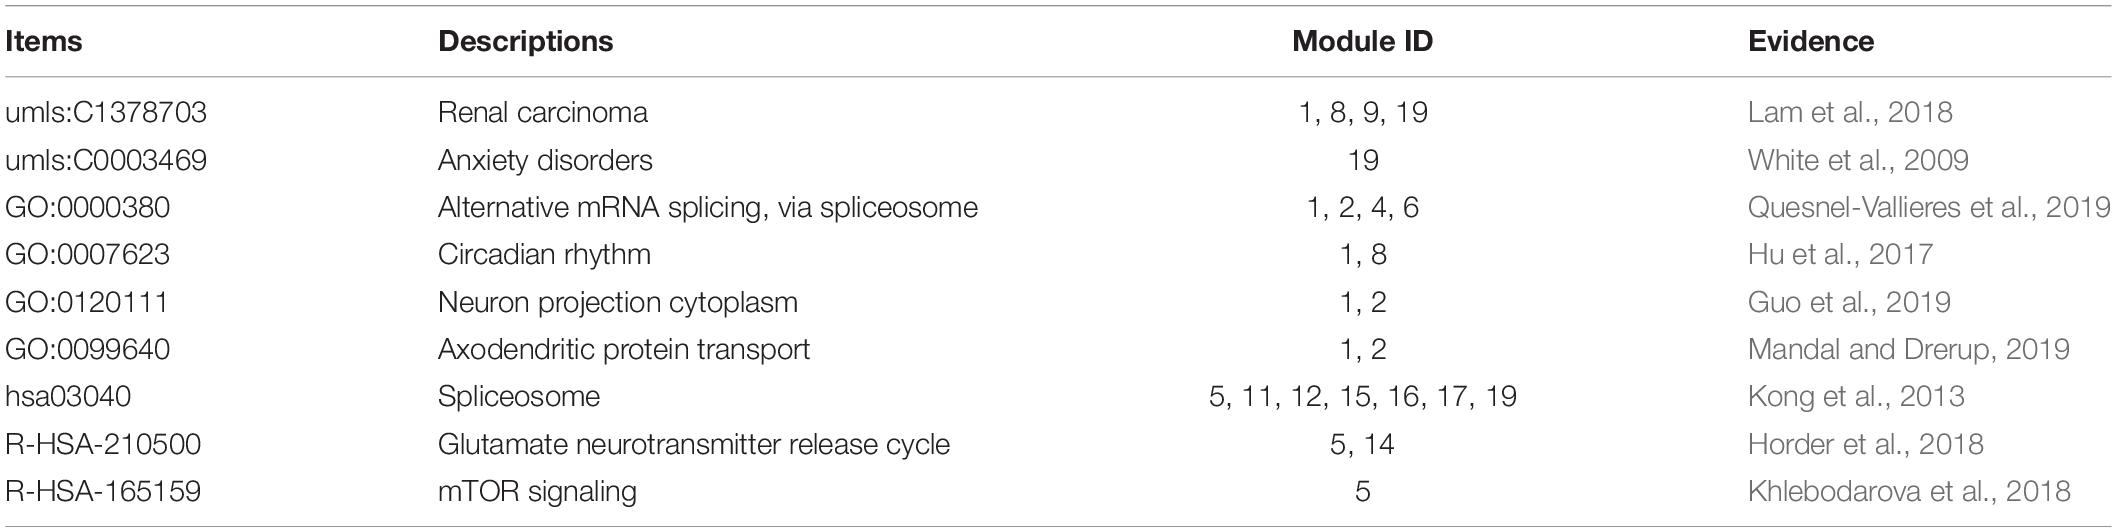
Table 1. Disease and functional enriched terms of top 20 largest miRNA–target regulatory modules related to ASD.
Furthermore, the identified 10 miRNA sponge modules are significantly enriched in 711 GO terms, 23 KEGG pathways, 117 Reactome pathways, 22 Disease Ontology terms, and 157 DisGeNET terms. In Table 2, several GO, KEGG, Reactome, Disease Ontology, DisGeNET, and Network of Cancer Genes terms are closely associated with ASD. For instance, severe depression (umls: C0588008) (Hedley et al., 2018), Mild cognitive disorder (umls: C1270972) (Leekam, 2016), acute gastroenteritis (umls: C0267446) (Wasilewska and Klukowski, 2015), Focal adhesion (GO: 0005925) (Ander et al., 2015), long-term memory (GO: 0007616) (Toichi and Kamio, 2002), and spliceosome (hsa03040) (Kong et al., 2013) are experimentally confirmed to be ASD-related terms. Taken together, the above enrichment analysis results indicate that the identified miRNA-associated modules are functional. The disease and functional enrichment analysis results of miRNA-associated modules can be seen in Supplementary Table 5.
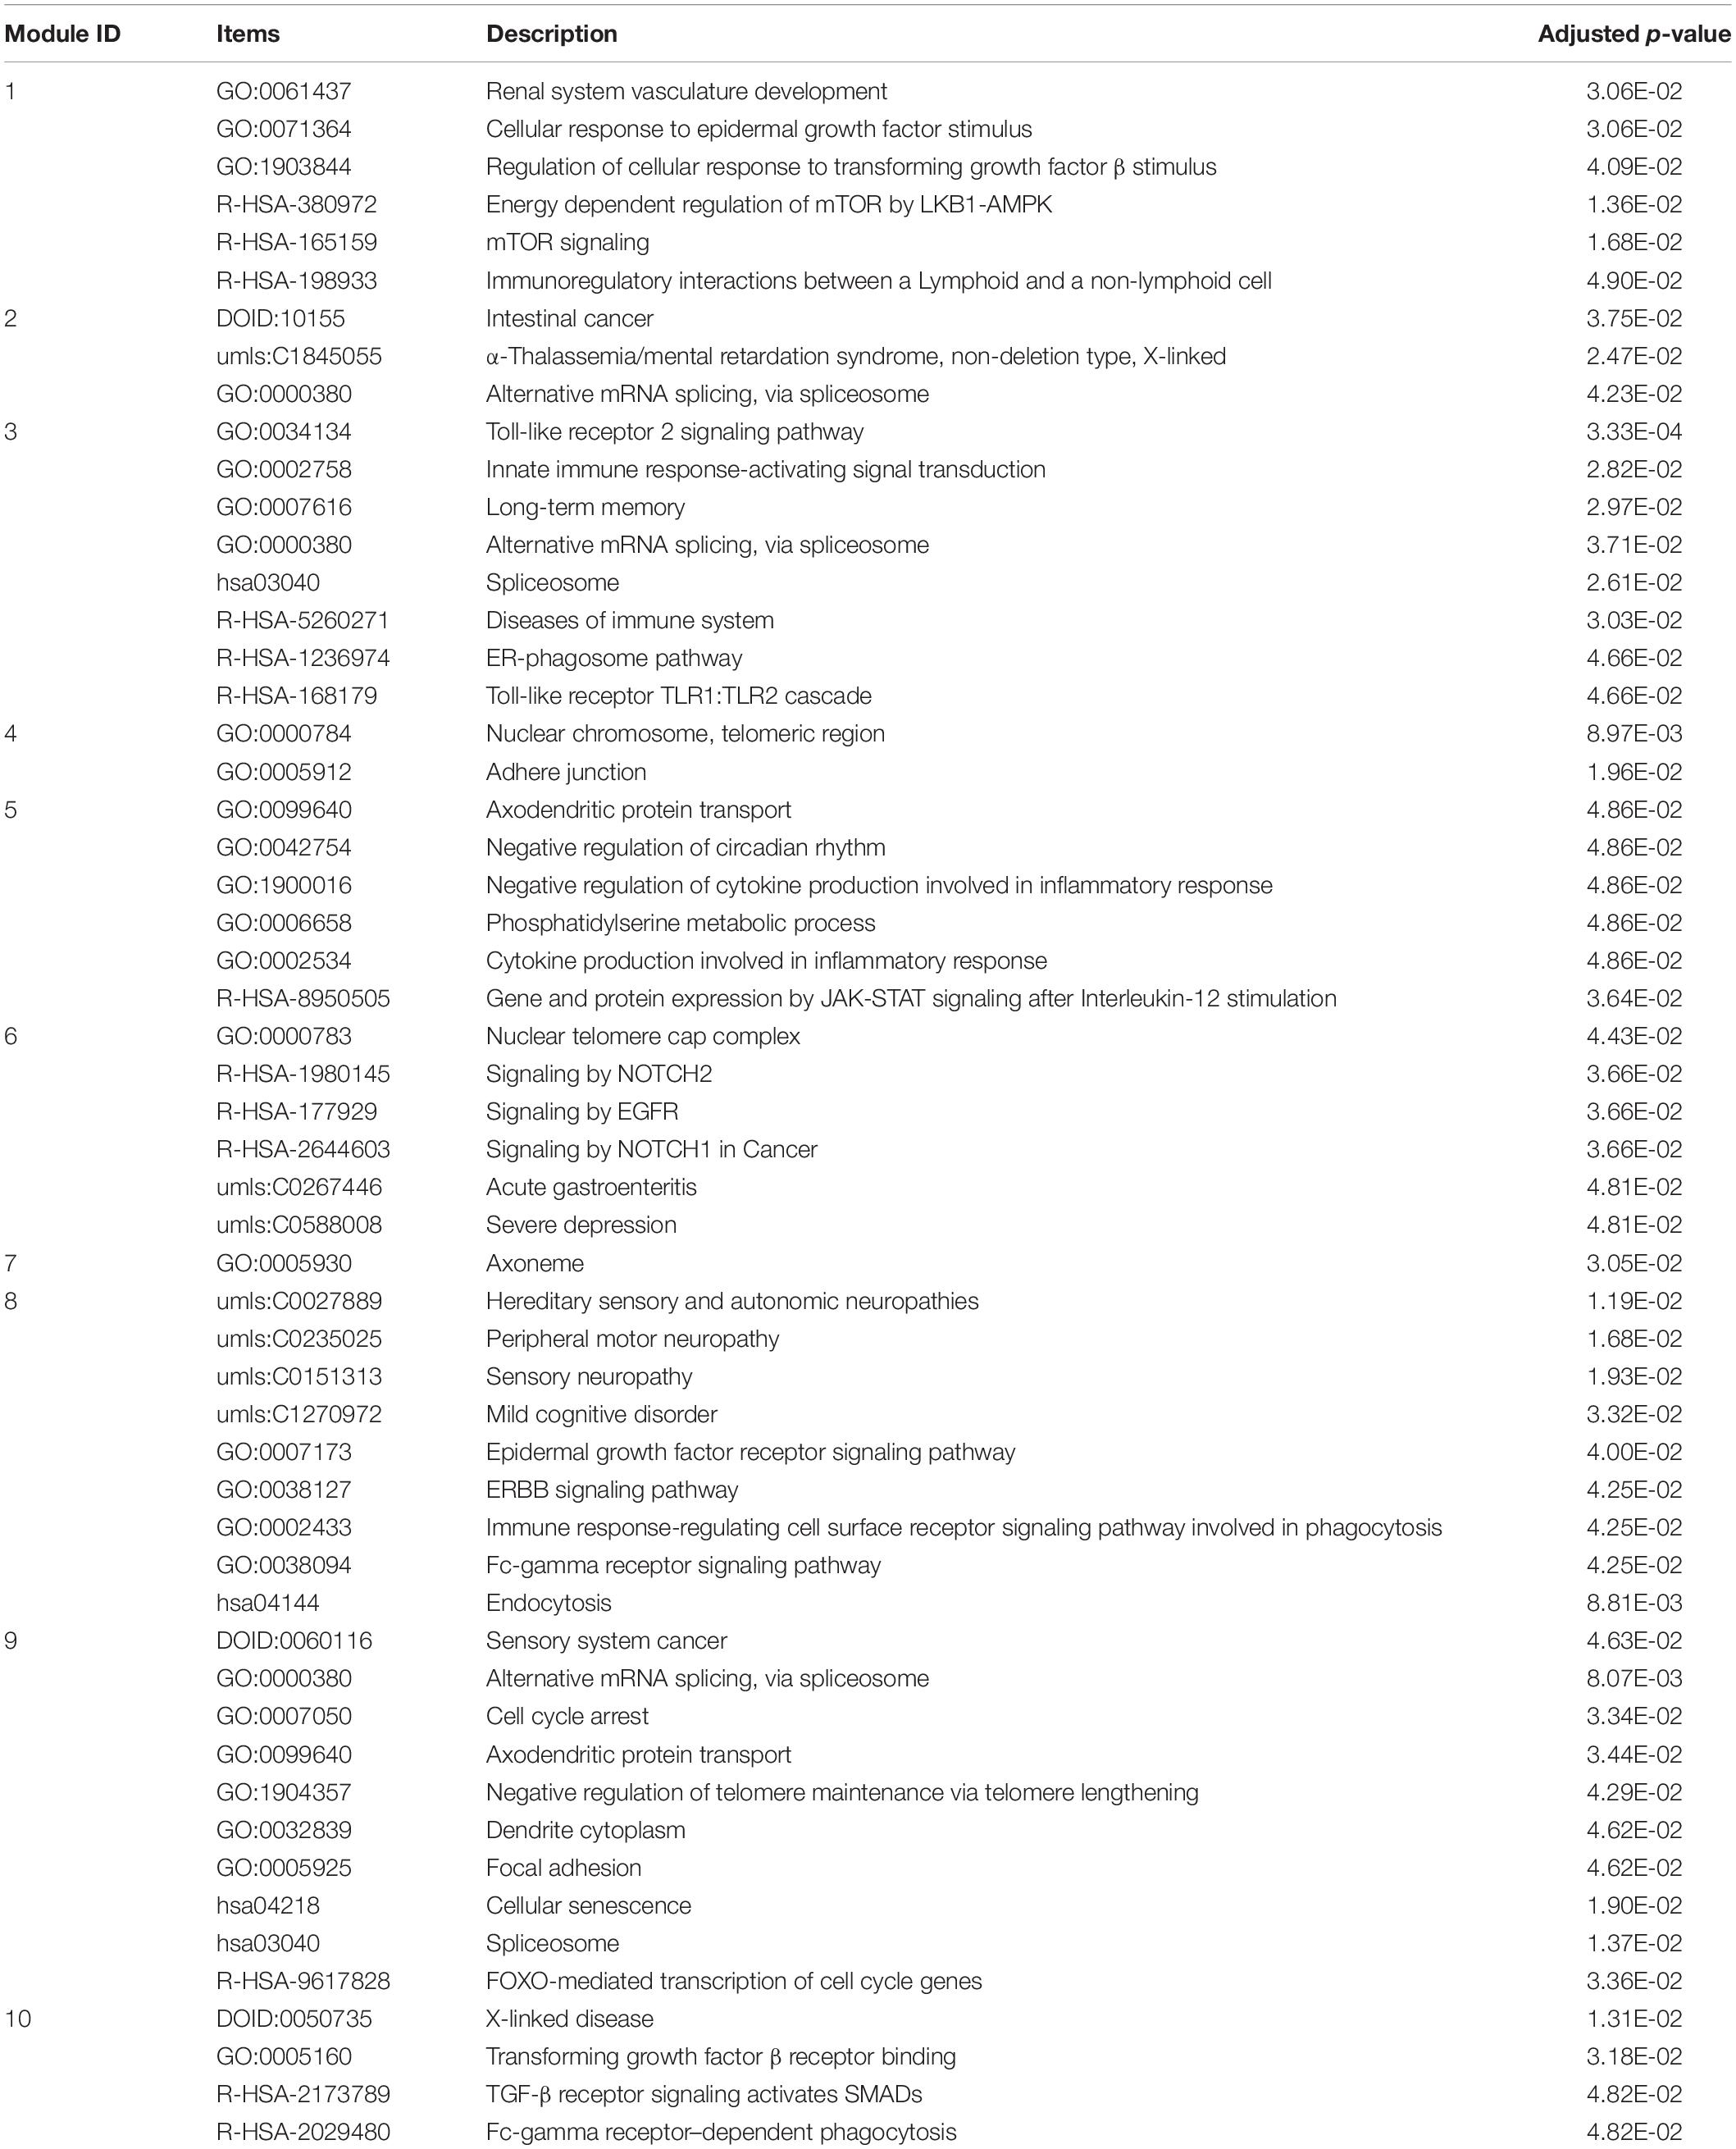
Table 2. Disease and functional enriched terms of miRNA sponge modules related to ASD.
Discussion and Conclusion
Given the high prevalence rate of ASD, it becomes more and more urgent to reveal the underlying molecular mechanisms associated with ASD. Growing evidence (Fregeac et al., 2016; Shen et al., 2016; Hu et al., 2017) has revealed that miRNA dysregulation has made a great contribution to the pathology of ASD. However, there is still a lack of computational methods to uncover miRNA regulation in ASD at both the network and module level.
In this work, we propose a stepwise method, ASDmiR, to reveal miRNA regulation in ASD. The comparison study suggests that the ProMISe method is the best miRNA target prediction method for identifying miRNA–target regulatory network in ASD dataset. Network topological analysis indicates that the identified miRNA–target network and miRNA sponge interaction network are all scale-free networks. Moreover, functional enrichment analysis shows that hub miRNAs and hub miRNA sponges are closely associated with ASD. As functional units, the identified miRNA-associated modules are found to be significantly enriched in several important ASD-related terms.
ASDmiR can be improved in the following aspects. First, ASD-related samples can be obtained from peripheral blood, post-mortem brain, gastrointestinal tissue, adult olfactory stem cells, and scalp hair follicles (Ansel et al., 2016). In future, we will apply ASDmiR into other types of ASD-related datasets. Second, we will conduct a more comprehensive comparison to identify miRNA–target regulatory network by considering more miRNA target prediction methods. Third, we will cover other types of miRNA sponges (e.g., circRNAs, pseudogenes) to further uncover the potential roles of miRNA sponges in ASD. Finally, a previous study (Iakoucheva et al., 2019) has shown that de novo mutations (e.g., structure variants, protein-altering point mutations) and genetic variants (e.g., copy number variations, single nucleotide polymorphisms) could also contribute to the occurrence of ASD. Therefore, to further understand the molecular mechanisms of ASD, it is necessary to integrate these heterogeneous data to explore miRNA regulation.
Data Availability Statement
The datasets presented in this study can be found in online repositories. The names of the repository/repositories and accession number(s) can be found in the article/Supplementary Material. The source codes for this study can be found at: https://github.com/chenchenxiong/ASD.
Author Contributions
CX and JZ designed the methods. CX wrote the codes. CX, SS, and WJ analyzed the data with supervision from LM and JZ. CX, SS, and JZ wrote the manuscript. All authors read and approved the final manuscript.
Funding
This work was supported by the National Natural Science Foundation of China (Grant Nos. 61702069 and 61963001).
Conflict of Interest
The authors declare that the research was conducted in the absence of any commercial or financial relationships that could be construed as a potential conflict of interest.
Supplementary Material
The Supplementary Material for this article can be found online at: https://www.frontiersin.org/articles/10.3389/fgene.2020.562971/full#supplementary-material
Supplementary Table 1 | Differentially expressed miRNAs, lncRNAs, and mRNAs.
Supplementary Table 2 | miRNA-target interactions and ASD-related miRNAs, lncRNAs, and mRNAs collected in relevant databases.
Supplementary Table 3 | The Identified miRNA-target interactions and miRNA sponge interactions.
Supplementary Table 4 | The enriched GO terms and KEGG pathways associated with hub genes.
Supplementary Table 5 | The enriched disease and functional terms associated with miRNA-associated modules.
Footnotes
- ^ https://www.sfari.org/
- ^ http://www.geneontology.org/
- ^ http://www.genome.jp/kegg
- ^ http://reactome.org/
- ^ http://disease-ontology.org/
- ^ http://www.disgenet.org/
- ^ http://ncg.kcl.ac.uk/
References
Ander, B. P., Barger, N., Stamova, B., Sharp, F. R., and Schumann, C. M. (2015). Atypical miRNA expression in temporal cortex associated with dysregulation of immune, cell cycle, and other pathways in autism spectrum disorders. Mol. Aut. 6:37. doi: 10.1186/s13229-015-0029-9
Ansel, A., Rosenzweig, J. P., Zisman, P. D., Melamed, M., and Gesundheit, B. (2016). Variation in gene expression in autism spectrum disorders: an extensive review of transcriptomic studies. Front Neurosci. 10:601. doi: 10.3389/fnins.2016.00601
Assenov, Y., Ramirez, F., Schelhorn, S. E., Lengauer, T., and Albrecht, M. (2008). Computing topological parameters of biological networks. Bioinformatics 24, 282–284. doi: 10.1093/bioinformatics/btm554
Avazzadeh, S., McDonagh, K., Reilly, J., Wang, Y., Boomkamp, S. D., McInerney, V., et al. (2019). Increased Ca2+ signaling in NRXN1α+/− neurons derived from ASD induced pluripotent stem cells. Mol. Aut. 10:52. doi: 10.1186/s13229-019-0303-3
Bao, Z., Yang, Z., Huang, Z., Zhou, Y., Cui, Q., and Dong, D. (2019). LncRNADisease 2.0: an updated database of long non-coding RNA-associated diseases. Nucleic Acids Res. 47, D1034–D1037. doi: 10.1093/nar/gky905
Cesana, M., Cacchiarelli, D., Legnini, I., Santini, T., Sthandier, O., Chinappi, M., et al. (2011). A long noncoding RNA controls muscle differentiation by functioning as a competing endogenous RNA. Cell 147, 358–369. doi: 10.1016/j.cell.2011.09.028
Chen, J. A., Penagarikano, O., Belgard, T. G., Swarup, V., and Geschwind, D. H. (2015). The emerging picture of autism spectrum disorder: genetics and pathology. Annu. Rev. Pathol. 10, 111–144. doi: 10.1146/annurev-pathol-012414-040405
Choobdar, S., Ahsen, M. E., Crawford, J., Tomasoni, M., Fang, T., Lamparter, D., et al. (2019). Assessment of network module identification across complex diseases. Nat. Methods 16, 843–852. doi: 10.1038/s41592-019-0509-5
Chou, C. H., Shrestha, S., Yang, C. D., Chang, N. W., Lin, Y. L., Liao, K. W., et al. (2018). miRTarBase update 2018: a resource for experimentally validated microRNA-target interactions. Nucleic Acids Res. 46, D296–D302. doi: 10.1093/nar/gkx1067
Cui, T., Zhang, L., Huang, Y., Yi, Y., Tan, P., Zhao, Y., et al. (2018). MNDR v2.0: an updated resource of ncRNA-disease associations in mammals. Nucleic Acids Res. 46, D371–D374. doi: 10.1093/nar/gkx1025
Enright, J., Van Donges, S., and Bouzoukis, C. A. (2002). An efficient algorithm for largescale detection of protein families. Nucleic Acids Res. 30, 1575–1584. doi: 10.1093/nar/30.7.1575
Fregeac, J., Colleaux, L., and Nguyen, L. S. (2016). The emerging roles of MicroRNAs in autism spectrum disorders. Neurosci. Biobehav. Rev. 71, 729–738. doi: 10.1016/j.neubiorev.2016.10.018
Gillian, B., Hilary, C. S., and Slonims, V. (2003). Diagnosis of autism. BMJ 327, 488–493. doi: 10.1136/bmj.327.7413.488
Guo, H., Li, Y., Shen, L., Wang, T., Jia, X., Liu, L., et al. (2019). Disruptive variants of CSDE1 associate with autism and interfere with neuronal development and synaptic transmission. Sci. Adv. 5:eaax2166. doi: 10.1126/sciadv.aax2166
Gupta, S., Ellis, S. E., Ashar, F. N., Moes, A., Bader, J. S., Zhan, J., et al. (2014). Transcriptome analysis reveals dysregulation of innate immune response genes and neuronal activity-dependent genes in autism. Nat. Commun. 5:5748. doi: 10.1038/ncomms6748
Hansen, T. B., Jensen, T. I., Clausen, B. H., Bramsen, J. B., Finsen, B., Damgaard, C. K., et al. (2013). Natural RNA circles function as efficient microRNA sponges. Nature 495, 384–388. doi: 10.1038/nature11993
Hedley, D., Uljarevic, M., Foley, K. R., Richdale, A., and Trollor, J. (2018). Risk and protective factors underlying depression and suicidal ideation in Autism Spectrum Disorder. Depress Anxiety 35, 648–657. doi: 10.1002/da.22759
Hoeffding, W. (1948). A non-parametric test of independence. Ann. Math. Stat. 19, 546–557. doi: 10.2307/2236021
Horder, J., Petrinovic, M. M., Mendez, M. A., Bruns, A., Takumi, T., Spooren, W., et al. (2018). Glutamate and GABA in autism spectrum disorder—a translational magnetic resonance spectroscopy study in man and rodent models. Transl. Psychiatry 8:106. doi: 10.1038/s41398-018-0155-1
Hosseini, E., Bagheri-Hosseinabadi, Z., De Toma, I., Jafarisani, M., and Sadeghi, I. (2019). The importance of long non-coding RNAs in neuropsychiatric disorders. Mol. Aspects Med. 70, 127–140. doi: 10.1016/j.mam.2019.07.004
Hu, Y., Ehli, E. A., and Boomsma, D. I. (2017). MicroRNAs as biomarkers for psychiatric disorders with a focus on autism spectrum disorder: current progress in genetic association studies, expression profiling, and translational research. Autism Res. 10, 1184–1203. doi: 10.1002/aur.1789
Huang, Z., Shi, J., Gao, Y., Cui, C., Zhang, S., Li, J., et al. (2019). HMDD v3.0: a database for experimentally supported human microRNA-disease associations. Nucleic Acids Res. 47, D1013–D1017. doi: 10.1093/nar/gky1010
Iakoucheva, L. M., Muotri, A. R., and Sebat, J. (2019). Getting to the cores of autism. Cell 178, 1287–1298. doi: 10.1016/j.cell.2019.07.037
Karagkouni, D., Paraskevopoulou, M. D., Chatzopoulos, S., Vlachos, I. S., Tastsoglou, S., Kanellos, I., et al. (2018). DIANA-TarBase v8: a decade-long collection of experimentally supported miRNA-gene interactions. Nucleic Acids Res. 46, D239–D245. doi: 10.1093/nar/gkx1141
Kendall, M. G. (1938). A new measure of rank correlation. Biometrika 30, 81–93. doi: 10.1093/biomet/30.1-2.81
Kerin, T., Ramanathan, A., Rivas, K., Grepo, N., and Campbell, D. B. (2012). A noncoding RNA antisense to moesin at 5p14.1 in autism. Sci. Transl. Med. 4:128ra40. doi: 10.1126/scitranslmed.3003479
Kern, F., Fehlmann, T., Solomon, J., Schwed, L., Backes, C., Meese, E., et al. (2020). miEAA 2.0: integrating multi-species microRNA enrichment analysis and workflow management systems. Nucleic Acids Res. 48, W521–W528. doi: 10.1101/2020.03.05.978890
Khlebodarova, T. M., Kogai, V. V., Trifonova, E. A., and Likhoshvai, V. A. (2018). Dynamic landscape of the local translation at activated synapses. Mol. Psychiatry 23, 107–114. doi: 10.1038/mp.2017.245
Kong, S. W., Collins, C. D., Shimizu-Motohashi, Y., Holm, I. A., Campbell, M. G., Lee, I. H., et al. (2012). Characteristics and predictive value of blood transcriptome signature in males with autism spectrum disorders. PLoS One 7:e49475. doi: 10.1371/journal.pone.0049475
Kong, S. W., Shimizu-Motohashi, Y., and Campbell, M. G. (2013). Peripheral blood gene expression signature differentiateschildren with autism from unaffected siblings. Neurogenetics 14, 143–152. doi: 10.1007/s10048-013-0363-z
Lam, H. C., Siroky, B. J., and Henske, E. P. (2018). Renal disease in tuberous sclerosis complex: pathogenesis and therapy. Nat. Rev. Nephrol. 14, 704–716. doi: 10.1038/s41581-018-0059-6
Le, T. D., Zhang, J., Liu, L., and Li, J. (2017). Computational methods for identifying miRNA sponge interactions. Brief Bioinform. 18, 577–590. doi: 10.1093/bib/bbw042
Le, T. D., Zhang, J., Liu, L., Liu, H., and Li, J. (2015). miRLAB: an R based dry lab for exploring miRNA-mRNA regulatory relationships. PLoS One 10:e0145386. doi: 10.1371/journal.pone.0145386
Leekam, S. (2016). Social cognitive impairment and autism: what are we trying to explain? Philos. Trans. R. Soc. Lond. B Biol. Sci. 371:20150082. doi: 10.1098/rstb.2015.0082
Li, Y., Liang, C., Wong, K. C., Jin, K., and Zhang, Z. (2014). Inferring probabilistic miRNA-mRNA interaction signatures in cancers: a role-switch approach. Nucleic Acids Res. 42:e76. doi: 10.1093/nar/gku182
Lopez-Paz, D., Hennig, P., and Schölkopf, B. (2013). The randomized dependence coefficient. Adv. Neural Inform. Process. Syst. 1, 1–9.
Maathuis, M. H., Kalisch, M., and Bühlmann, P. (2009). Estimating high-dimensional intervention effects from observational data. Ann. Stat. 37, 3133–3164. doi: 10.1214/09-aos685
Malik, M., Tauqeer, Z., Sheikh, A. M., Wen, G., Nagori, A., Yang, K., et al. (2011). NF-kappaB signaling in the brain of autistic subjects. Mediat. Inflamm. 2011:785265. doi: 10.1155/2011/785265
Mandal, A., and Drerup, C. M. (2019). Axonal transport and mitochondrial function in neurons. Front. Cell Neurosci. 13:373. doi: 10.3389/fncel.2019.00373
Mohr, S., and Liew, C. C. (2007). The peripheral-blood transcriptome: new insights into disease and risk assessment. Trends Mol. Med. 13, 422–432. doi: 10.1016/j.molmed.2007.08.003
Monday, H. R., Younts, T. J., and Castillo, P. E. (2018). Long-term plasticity of neurotransmitter release: emerging mechanisms and contributions to brain function and disease. Annu. Rev. Neurosci. 41, 299–322. doi: 10.1146/annurev-neuro-080317-062155
Moon, Y. I., Rajagopalan, B., and Lall, U. (1995). Estimation of mutual information using kernel density estimators. Phys. Rev. E Stat. Phys. Plasmas Fluids Relat. Interdiscip. Top. 52, 2318–2321. doi: 10.1103/physreve.52.2318
Noor, A., Whibley, A., Marshall, C. R., Gianakopoulos, P. J., Piton, A., Carson, A. R., et al. (2010). Disruption at the PTCHD1 locus on Xp22.11 in autism spectrum disorder and intellectual disability. Sci. Transl. Med. 2:49ra68. doi: 10.1126/scitranslmed.3001267
Paci, P., Colombo, T., and Farina, L. (2014). Computational analysis identifies a sponge interaction network between long non-coding RNAs and messenger RNAs in human breast cancer. BMC Syst. Biol. 8:83. doi: 10.1186/1752-0509-8-83
Paraskevopoulou, M. D., Vlachos, I. S., Karagkouni, D., Georgakilas, G., Kanellos, I., Vergoulis, T., et al. (2016). DIANA-LncBase v2: indexing microRNA targets on non-coding transcripts. Nucleic Acids Res. 44, D231–D238. doi: 10.1093/nar/gkv1270
Parikshak, N. N., Swarup, V., Belgard, T. G., Irimia, M., Ramaswami, G., Gandal, M. J., et al. (2016). Genome-wide changes in lncRNA, splicing, and regional gene expression patterns in autism. Nature 540, 423–427. doi: 10.1038/nature20612
Pearson, K. (1920). Notes on the history of correlation. Biometrika 13, 25–45. doi: 10.1093/biomet/13.1.25
Pinero, J., Ramirez-Anguita, J. M., Sauch-Pitarch, J., Ronzano, F., Centeno, E., Sanz, F., et al. (2020). The DisGeNET knowledge platform for disease genomics: 2019 update. Nucleic Acids Res. 48, D845–D855. doi: 10.1093/nar/gkz1021
Poliseno, L., Salmena, L., Zhang, J., Carver, B., Haveman, W. J., and Pandolfi, P. P. (2010). A coding-independent function of gene and pseudogene mRNAs regulates tumour biology. Nature 465, 1033–1038. doi: 10.1038/nature09144
Prill, R. J., Marbach, D., Saez-Rodriguez, J., Sorger, P. K., Alexopoulos, L. G., Xue, X., et al. (2010). Towards a rigorous assessment of systems biology models: the DREAM3 challenges. PLoS One 5:e9202. doi: 10.1371/journal.pone.0009202
Quesnel-Vallieres, M., Weatheritt, R. J., Cordes, S. P., and Blencowe, B. J. (2019). Autism spectrum disorder: insights into convergent mechanisms from transcriptomics. Nat. Rev. Genet. 20, 51–63. doi: 10.1038/s41576-018-0066-2
Rajman, M., and Schratt, G. (2017). MicroRNAs in neural development: from master regulators to fine-tuners. Development 144, 2310–2322. doi: 10.1242/dev.144337
Ritchie, M. E., Phipson, B., Wu, D., Hu, Y., Law, C. W., Shi, W., et al. (2015). limma powers differential expression analyses for RNA-sequencing and microarray studies. Nucleic Acids Res. 43:e47. doi: 10.1093/nar/gkv007
Salmena, L., Poliseno, L., Tay, Y., Kats, L., and Pandolfi, P. P. (2011). A ceRNA hypothesis: the Rosetta Stone of a hidden RNA language? Cell 146, 353–358. doi: 10.1016/j.cell.2011.07.014
Segura, M., Pedreno, C., Obiols, J., Taurines, R., Pamias, M., Grunblatt, E., et al. (2015). Neurotrophin blood-based gene expression and social cognition analysis in patients with autism spectrum disorder. Neurogenetics 16, 123–131. doi: 10.1007/s10048-014-0434-9
Shannon, P. (2003). Cytoscape: a software environment for integrated models of biomolecular interaction networks. Genome Res. 13, 2498–2504. doi: 10.1101/gr.1239303
Shen, L., Lin, Y., Sun, Z., Yuan, X., Chen, L., and Shen, B. (2016). Knowledge-guided bioinformatics model for identifying autism spectrum disorder diagnostic MicroRNA biomarkers. Sci. Rep. 6:39663. doi: 10.1038/srep39663
Shen, L., Zhao, Y., Zhang, H., Feng, C., Gao, Y., Zhao, D., et al. (2019). Advances in biomarker studies in autism spectrum disorders. Adv. Exp. Med. Biol. 1118, 207–233. doi: 10.1007/978-3-030-05542-4_11
Spearman, C. (1904). general intelligence, objectively determined and measured. Am. J. Psychol. 15, 201–292. doi: 10.2307/1412107
Székely, G. J., Rizzo, M. L., and Bakirov, N. K. (2007). Measuring and testing dependence by correlation of distances. Ann. Stat. 35, 2769–2794. doi: 10.1214/009053607000000505
Tay, Y., Kats, L., Salmena, L., Weiss, D., Tan, S. M., Ala, U., et al. (2011). Coding-independent regulation of the tumor suppressor PTEN by competing endogenous mRNAs. Cell 147, 344–357. doi: 10.1016/j.cell.2011.09.029
Teng, X., Chen, X., Xue, H., Tang, Y., Zhang, P., Kang, Q., et al. (2020). NPInter v4.0: an integrated database of ncRNA interactions. Nucleic Acids Res. 48, D160–D165. doi: 10.1093/nar/gkz969
Tibshirani, R. (1996). Regression shrinkage and selection via the lasso. J. R. Stat. Soc. Ser. B 58, 267–288. doi: 10.1111/j.2517-6161.1996.tb02080.x
Toichi, M., and Kamio, Y. (2002). Long-term memory and levels-of-processing in autism. Neurogenetics 40, 964–969. doi: 10.1016/s0028-3932(01)00163-4
Voineagu, I., Wang, X., Johnston, P., Lowe, J. K., Tian, Y., Horvath, S., et al. (2011). Transcriptomic analysis of autistic brain reveals convergent molecular pathology. Nature 474, 380–384. doi: 10.1038/nature10110
Wang, Y., Zhao, X., Ju, W., Flory, M., Zhong, J., Jiang, S., et al. (2015). Genome-wide differential expression of synaptic long noncoding RNAs in autism spectrum disorder. Transl. Psychiatry. 5:e660. doi: 10.1038/tp.2015.144
Wasilewska, J., and Klukowski, M. (2015). Gastrointestinal symptoms and autism spectrum disorder: links and risks - a possible new overlap syndrome. Pediatr. Health Med. Ther. 6, 153–166. doi: 10.2147/PHMT.S85717
White, S. W., Oswald, D., Ollendick, T., and Scahill, L. (2009). Anxiety in children and adolescents with autism spectrum disorders. Clin. Psychol. Rev. 29, 216–229. doi: 10.1016/j.cpr.2009.01.003
Xu, T., Su, N., Liu, L., Zhang, J., Wang, H., Zhang, W., et al. (2018). miRBaseConverter: an R/Bioconductor Package for Converting and Retrieving miRNA Name, Accession, Sequence and Family Information in Different Versions of miRBase. BMC Bioinform. 19, (Suppl. 19):514. doi: 10.1101/407148
Yoon, S., Nguyen, H. C. T., Jo, W., Kim, J., Chi, S. M., Park, J., et al. (2019). Biclustering analysis of transcriptome big data identifies condition-specific microRNA targets. Nucleic Acids Res. 47:e53. doi: 10.1093/nar/gkz139
Yu, G., Wang, L. G., Han, Y., and He, Q. Y. (2012). clusterProfiler: an R package for comparing biological themes among gene clusters. OMICS 16, 284–287. doi: 10.1089/omi.2011.0118
Zhang, J., Liu, L., Li, J., and Le, T. D. (2018). LncmiRSRN: identification and analysis of long non-coding RNA related miRNA sponge regulatory network in human cancer. Bioinformatics 34, 4232–4240. doi: 10.1093/bioinformatics/bty525
Zhang, J., Liu, L., Xu, T., Xie, Y., Zhao, C., Li, J., et al. (2019). miRspongeR: an R/Bioconductor package for the identification and analysis of miRNA sponge interaction networks and modules. BMC Bioinform. 20:235. doi: 10.1186/s12859-019-2861-y
Zhang, Y., Phillips, C. A., Rogers, G. L., Baker, E. J., Chesler, E. J., and Langston, M. A. (2014). On finding bicliques in bipartite graphs: a novel algorithm and its application to the integration of diverse biological data types. BMC Bioinform. 15:110. doi: 10.1186/1471-2105-15-110
Keywords: miRNA, lncRNA, mRNA, miRNA regulation, autism spectrum disorder
Citation: Xiong C, Sun S, Jiang W, Ma L and Zhang J (2020) ASDmiR: A Stepwise Method to Uncover miRNA Regulation Related to Autism Spectrum Disorder. Front. Genet. 11:562971. doi: 10.3389/fgene.2020.562971
Received: 17 May 2020; Accepted: 31 August 2020;
Published: 14 October 2020.
Edited by:
Cheng Peng, Yunnan University, ChinaReviewed by:
Guoli Ji, Xiamen University, ChinaYuriy L. Orlov, First Moscow State Medical University, Russia
Copyright © 2020 Xiong, Sun, Jiang, Ma and Zhang. This is an open-access article distributed under the terms of the Creative Commons Attribution License (CC BY). The use, distribution or reproduction in other forums is permitted, provided the original author(s) and the copyright owner(s) are credited and that the original publication in this journal is cited, in accordance with accepted academic practice. No use, distribution or reproduction is permitted which does not comply with these terms.
*Correspondence: Lei Ma, cm95X211cnJheUBxcS5jb20=; Junpeng Zhang, emhhbmdqdW5wZW5nXzQxMUB5YWhvby5jb20=
†These authors have contributed equally to this work