 Yi Shen
 Yi Shao
 Chen Niu
 Xiaoli Ruan
 Zhaoping Zang
 Rena Nakyeyune
 Fen Liu
- Department of Epidemiology and Health Statistics, School of Public Health, Beijing Municipal Key Laboratory of Clinical Epidemiology, Capital Medical University, Beijing, China
Background: Circular RNAs (circRNAs) are described as endogenous non-coding RNAs that have been reported to play important roles in the development and progression of cancers. This study aimed to reveal the circRNA-related regulatory mechanism in esophageal squamous cell carcinoma (ESCC).
Methods: A genome-wide circRNA microarray assay was performed to profile the expression of circRNAs in the blood of preoperative ESCC patients and healthy controls. A systematic method of data mining was performed to identify the differentially expressed miRNAs (DEmiRs) and differentially expressed genes (DEGs) based on the metaMA and RankProd analysis. Bioinformatics analyses and multiple tools were employed to construct the potential circRNA–miRNA–mRNA regulatory network.
Results: Thirty-three differentially expressed circRNAs were identified in the ESCC blood, including 31 downregulated and two upregulated circRNAs in the blood of ESCC patients compared with the healthy controls. Twenty-three DEmiRs and 2,220 DEGs were obtained by the integration of microarray datasets. An ESCC-associated circRNA–miRNA–mRNA network was constructed based on 31 circRNAs, 3 DEmiRs, and 190 DEGs. Enrichment analyses indicated that the DEGs were associated with a series of biological processes and cancer-related pathways. The protein–protein interaction (PPI) network was generated by the 190 DEGs, with 10 hub genes verified in the network. Subsequently, a sub-network was established for ESCC, which included 29 circRNAs, 2 miRNAs, and 10 hub genes.
Conclusion: Our study provided a novel clue to help understand the circRNA–miRNA–mRNA regulatory mechanism, highlighting the potential roles of circRNAs in the pathogenesis and development of ESCC.
Introduction
Esophageal cancer is the seventh most common malignancy and the sixth leading cause of cancer-related deaths in the world (Bray et al., 2018). In China and most other Asian countries, esophageal squamous cell carcinoma (ESCC) is the predominant histologic subtype. The highest incidence of ESCC is found in certain areas surrounding the Taihang Mountains in North Central China (Chen et al., 2016). ESCC is frequently diagnosed at advanced stages and presents a poor prognosis. Despite the rapid advances in clinical diagnosis and treatment, the 5-year survival of patients with metastatic ESCC is still only 30.0% (Zeng et al., 2018). As a multifactorial disease, the complex genetic etiology and incomprehensive molecular pathogenesis may account for the clinical dilemma of ESCC. The specific molecular expression profiles will probably generate new clues for the diagnosis and treatment of cancers (Qu et al., 2017). Therefore, further exploration of novel molecular markers and their underlying mechanisms is extremely necessary to detect early ESCC and thus improve the prognosis for esophageal cancer patients.
Circular RNAs (circRNAs) are particular endogenous non-coding RNAs that are evolutionarily conserved across eukaryotic species and widely expressed in human cells with high abundance (Jeck et al., 2013). The closed loop structure makes circRNAs more stable and protects them from degradation by RNase R. With the increase in use of high-throughput sequencing and microarray technologies (Kristensen et al., 2018), more and more circRNAs have been shown to be associated with various diseases, especially cancer. Subsequent studies have discovered dysregulated circRNAs in the tissues from patients with different tumors (Vo et al., 2019). More importantly, they could function as microRNA (miRNA) sponges, protein decoys, and transporters to regulate gene expression (Qu et al., 2017). Current evidence has revealed that circRNAs are involved in tumor pathogenesis and progression by the competing endogenous RNA (ceRNA) regulatory network (Kristensen et al., 2018). Regarding ESCC, circRNA expression profiles have been investigated in cancerous tissues and esophageal cancer cells (Li et al., 2015a; Su et al., 2016; Xia et al., 2016; Sun et al., 2017; Wang et al., 2019). Some circRNAs have shown the ability to serve as diagnostic and prognostic biomarkers for ESCC (Niu et al., 2019). However, the functional roles and mechanisms of circRNAs in the development of ESCC remain unclear.
Therefore, the aim of this study was to explore the potential mechanisms of circRNA regulatory network in ESCC. We performed a genome-wide circRNA microarray assay and employed a comprehensive strategy to investigate differentially expressed circRNAs (DECs) and their potential mechanisms in ESCC. As the flow chart shows (Figure 1), to explore the sponge function of circRNAs in ESCC, we investigated the blood circRNAs expression profiles of patients with ESCC using circRNA microarray and collected the related circRNA–miRNA and miRNA–mRNA interactions by using the available databases, constructing a circRNA–miRNA–mRNA network. We then integrated ESCC-related microarray expression profiles from the Gene Expression Omnibus (GEO) database, obtaining differentially expressed miRNAs (DEmiRs) and genes (DEGs) by metaMA and RankProd method. Gene Oncology (GO) and Kyoto Encyclopedia of Genes and Genomes (KEGG) enrichment analyses for the target mRNAs were conducted to discover their potential functions. This provided a novel insight into the circRNAs and their functional mechanism in ESCC.
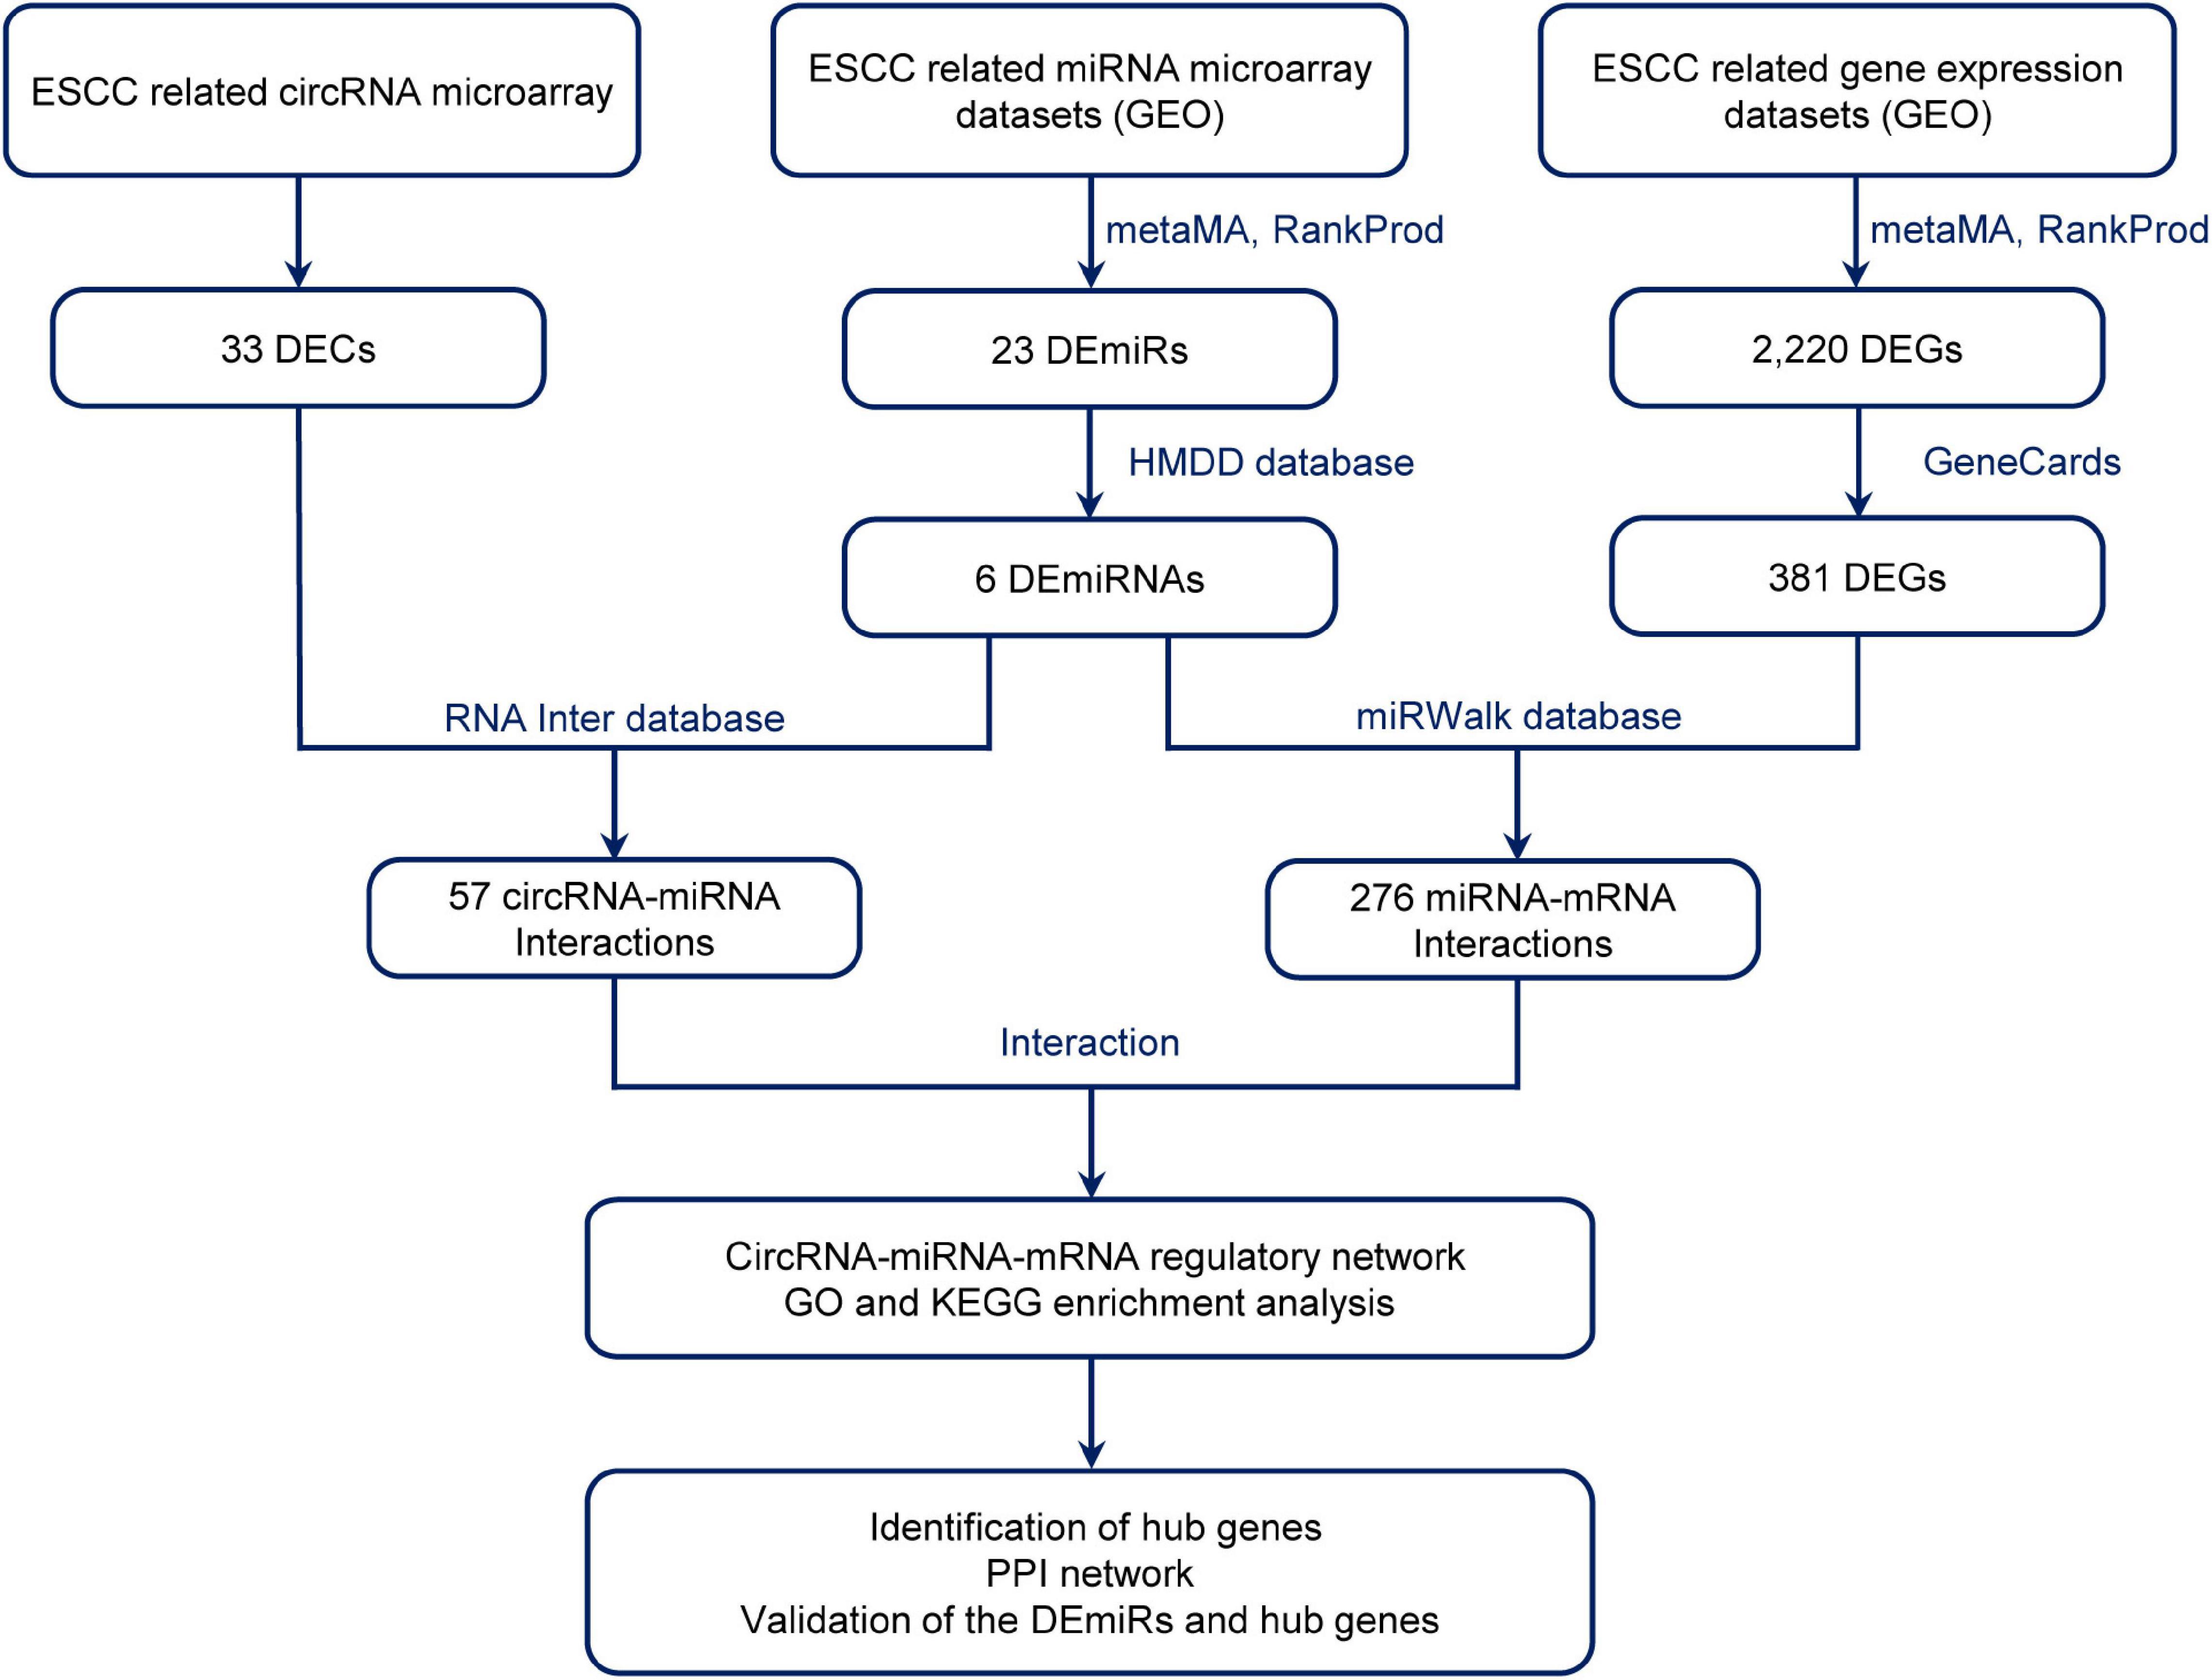
Figure 1. Flow diagram of the design and approaches of the present study. DECs, differentially expressed circular RNAs; DEmiRs, differentially expressed mircoRNAs; ESCC, esophageal squamous cell carcinoma; DEGs, differentially expressed genes; GEO, Gene Expression Omnibus; PPI, protein–protein interaction.
Materials and Methods
Study Subjects and Blood Sample Processing
Peripheral blood samples were collected from preoperative ESCC patients who underwent endoscopic submucosal dissection at the Cancer Hospital, Linzhou City, Henan Province in China, one of the high-risk areas of esophageal cancer, in January 2017. None of the patients received medical treatment before endoscopic examination or surgery. Each patient was diagnosed histopathologically. Frequency-matched healthy controls were selected from a cohort of attendees of the esophageal cancer early screening program during the same period (Table 1). This study was approved by the Ethics Committee of Capital Medical University (No. 2017SY22, Beijing, China). All recruited subjects provided written informed consent before participation. A double-blind approach was used throughout the entire research process. Five milliliters of venous blood (usually in the morning) was collected from each participant in an ethylenediaminetetraacetic acid (EDTA) tube. Blood samples were allowed to stand for 1 h at room temperature or kept at 4°C and processed within 24 h after collection. The blood samples were separated and then transferred into new tubes and stored at −80°C until use.
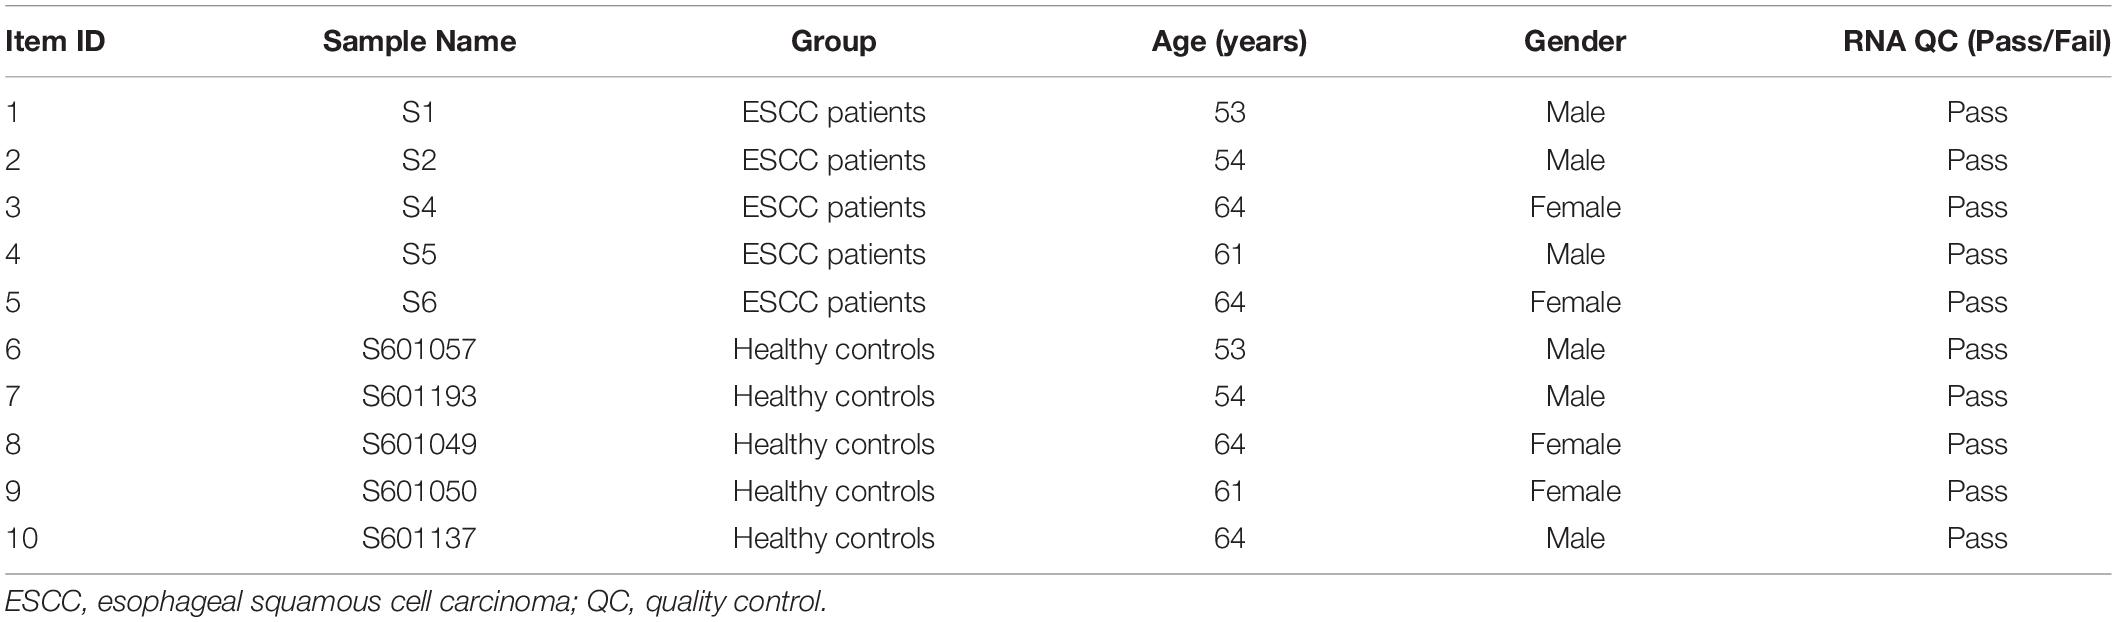
Table 1. Characteristics of ESCC patients and healthy controls.
RNA Extraction
Total RNA was isolated from 1 ml of blood using TRIzol reagent (Invitrogen, Carlsbad, CA, United States) according to the manufacturer’s protocol. The integrity of RNA was evaluated by 1% denaturing agarose gel electrophoresis. The concentration and purity of total RNA was then measured with the NanoDrop ND-1000 spectrophotometer (Thermo Fisher Scientific, Wilmington, DE, United States).
CircRNA Microarray
Total RNA from each sample was digested using Ribonuclease R (RNase R; Epicenter, Madison, WI, United States) to remove linear RNAs and to enrich circular RNAs. The Super RNA Labeling Kit (Arraystar, Rockville, MD, United States) was then used to amplify and transcribe the circRNAs into fluorescently labeled cRNAs by using random primers. The fluorescently labeled cRNAs were then purified with an RNeasy Mini Kit (Qiagen, Hilden, Germany). The concentrations of fluorescently labeled cRNAs (pmol Cy3/μg cRNA) were then measured with a NanoDrop ND-1000 spectrophotometer (Thermo Fisher Scientific, Wilmington, DE, United States). Based on calculated concentrations, 1 μg of fluorescently labeled cRNA for each sample was fragmented by incubation with 10 × blocking agent (5 μl) and 25 × fragmentation buffer (1 μl) at 60°C for 30 min. Next, 2 × hybridization buffer (25 μl) was added to the reaction. The resulting hybridization solution (50 μl) was placed in a gasket slide, which was then assembled with the Arraystar Human CircRNA Microarray Slides V2.0 (8 × 15K; Arraystar), with a total of 13,617 circRNA probes on the microarray, according to the kit’s instructions. The slides were then incubated in an Agilent Hybridization Oven at 65°C for 17 h. The hybridized microarrays were then washed, fixed, and scanned with an Agilent G2505C Scanner (Agilent Technologies, Santa Clara, United States).
Microarray Data Analysis
The acquired array images were imported into Agilent Feature Extraction software (version 11.0.1.1; Agilent Technologies) for raw data extraction. Quantile normalization of raw data and subsequent data processing were performed by using the “limma” package of R software (R software package, version 3.1.2)1. DECs with statistical significance [fold change (FC) > 2 and P-value < 0.05] between two groups were identified through fold change filtering or Volcano plot filtering. Hierarchical clustering was performed to show the distinguishable circRNA expression pattern among samples. The microarray raw data in this study were deposited in the GEO database2 and are accessible by the GEO accession number GSE112496.
DEmiRs and DEGs in ESCC
Microarray datasets of miRNA and gene expression profiles of ESCC were obtained from the GEO database. Eligible datasets had to meet the inclusion criteria: (1) microarray profile studies on patients with ESCC; (2) using cancerous tissues and normal tissues for comparison; (3) indicating the classification of each biological sample (tumor or normal); (4) including annotated information (gene symbol or miRNA ID) for each probe in the microarray. We obtained four miRNA expression profiles (GSE59973, GSE97049, GSE114110, and GSE145198) and four gene expression profiles (GSE29001, GSE20347, GSE38129, and GSE23400) of ESCC from GEO database, respectively. All the expression data were normalized and log2 transformed. Next, all microarray probe IDs were converted to miRNA IDs/or Entrez Gene IDs. When multiple probes had identical miRNA IDs/or Entrez Gene IDs, we selected the probe that presented the mean interquartile range to represent the miRNA IDs/or Entrez Gene IDs. We integrated the different microarray datasets using the R-based “metaMA” package (Marot et al., 2009) and “RankProd” package (Carratore et al., 2017). “metaMA” package can be applied to multiple microarray datasets to extract differentially expressed genes. MetaMA provided a method to calculate combined P-values obtained from limma procedures (Marot et al., 2009), while RankProd identified the differentially expressed genes by a non-parametric rank product method (Carratore et al., 2017). The overlapping miRNAs and genes from the metaMA (combined P-value < 0.05) and RankProd (P-value < 0.05, FC > 1.5) methods were identified as DEmiRs and DEGs.
Furthermore, we manually searched the Human MicroRNA Disease Database (HMDD) and GeneCards database. HMDD database is a comprehensive database that provides evidence of miRNA–disease associations supported by published literature. It is freely accessible at http://www.cuilab.cn/hmdd (Lu et al., 2008). GeneCards integrates comprehensive information on all annotated and predicted human genes. A search engine at the top of the GeneCards homepage provides access to detailed information about genes using a keyword query (Stelzer et al., 2016). The associations between ESCC and miRNAs based on literature-derived evidence code were downloaded directly from the HMDD database. Also, the ESCC-associated genes were retrieved from the results of the key word “esophageal squamous cell carcinoma” OR “ESCC” query term. We then determined the ESCC-related DEmiRs and DEGs by intersecting the identified DEmiRs and DEGs with the known ESCC-associated miRNAs and genes in HMDD and GeneCards databases.
Prediction of miRNAs for circRNAs and Target Genes for DEmiRs
The circRNA–miRNA interactions were predicted by using the RNA Interactome Database (RNAInter)3, which provides accurate prediction of RNA–RNA interactions by the input sequence of DECs and DEmiRs (Lin et al., 2020). RNAInter is a comprehensive RNA interaction database that recruits experimental and computational prediction RNA-associated interactions from literature and 35 other resources, including more than 41 million RNA–RNA interactions in 154 species. We filtered the circRNA–miRNA interactions with more than 7 base pairs in the seed. The target genes of miRNAs were derived by using miRWalk 3.0, an integrated database that provides miRNA–target gene interactions (Sticht et al., 2018). We predicted the target genes that were combined in the seed area and selected the miRNA–target gene interactions with a cutoff score of 0.95.
Construction of circRNA–miRNA–mRNA Network in ESCC and Functional Analysis
To further investigate the potential regulatory mechanism, we extracted the circRNA–miRNA–mRNA competitive binding relationships. The circRNA–miRNA and miRNA–mRNA interactions obtained from the databases were intersected with the ESCC-related DEmiRs and DEGs, and the overlapping DEmiRs and DEGs were retained for further network analysis. The selected DECs, DEmiRs, and DEGs were then mapped to construct a circRNA–miRNA–mRNA interaction network, which was visualized using Cytoscape 3.8.2 software4.
Functional Enrichment Analysis
For further insight into the putative gene functions and pathways of the target genes, we performed the GO and KEGG pathway enrichment analyses using Metascape Bioinformatics Resources5 (Zhou et al., 2019). All the significant GO terms and KEGG pathways were identified with the adjusted P-values (adj. P-values) < 0.05, which were corrected by the Benjamini–Hochberg method. We then calculated the −log10 (adj. P-values) for the significant GO terms and KEGG pathways. The higher the −log10 (adj. P-values) were, the more significant the terms.
Identification of Hub Genes in the Protein–Protein Interaction (PPI) Network
After the intersection of the circRNA–miRNA, miRNA–mRNA interactions and the ESCC-related DEmiRs and DEGs, we obtained a series of overlapping DEmiRs and DEGs. To evaluate the protein–protein interaction (PPI) relationships among overlapping DEGs, we calculated the interaction scores of the DEGs and constructed a PPI network by using Search Tool for the Retrieval of Interacting Genes/Proteins (STRING)6. The DEGs with an interaction score >0.4 were included in the PPI network. In addition, Maximal Clique Centrality (MCC) and degree algorithms were applied to identify the hub genes in the PPI network. We selected the top 10 DEGs with highest MCC and degree scores as hub genes in the network.
Validation of the DEmiRs and DEGs in the Hub Network
MiRCancer7 is a miRNA cancer association database that comprehensively collects miRNA expression profiles in human cancers from published literature. The database of Differentially Expressed MiRNAs in human Cancers (dbDEMC 2.0) is an integrated database that stores and displays aberrant miRNAs in human cancers detected by high-throughput methods8. We searched the DEmiRs in miRCancer and dbDEMC databases to validate their differential expression.
The gene expression data were downloaded from The Cancer Genome Atlas (TCGA) database using UCSC Xena9, which is an online database for analyzing gene expression profiles from the TCGA and the genotype-tissue expression (GTEx) projects. We validated the expression levels of hub genes in esophageal cancer (EC) tissues and esophageal normal tissues using the gene expression data from TCGA and GTEx databases. Furthermore, we obtained the survival map of the hub genes from GEPIA10, which is an online database that contains gene expression profiles from the TCGA and GTEx databases as well as provides survival analyses for gene expression profiles in cancers. The Cox proportional hazard ratios (HRs) were calculated to compare the risk of death between patients with high gene expression and low gene expression group (as reference), which were divided by medians.
Results
Overview of circRNA Expression Profiles
The blood circRNA expression profiles of ESCC patients and healthy controls were quantified by a high-throughput human circRNA microarray platform that comprises 13,617 probes. In total, 33 significant differentially expressed circRNAs were identified (FC > 2.0 and P-value < 0.05), among which two (6.06%) were upregulated and the other 31 (93.94%) were downregulated in ESCC patients (Table 2), which suggested that downregulated circRNAs were more prevalent than upregulated ones in the microarray data. A scatter plot (Figure 2A) and a volcano plot (Figure 2B) of all detectable circRNAs were used to better demonstrate the significantly and differentially expressed circRNAs. Hierarchical clustering showed that expression levels of DECs were consistent within each group but evidently different between the ESCC patients and control groups (Figure 2C). Moreover, most of the downregulated circRNAs were transcribed from the protein encoding sequences located in chr1, chr16, and chr19, while the two upregulated ones were located in chr3 and chr19, respectively (Figure 2D).
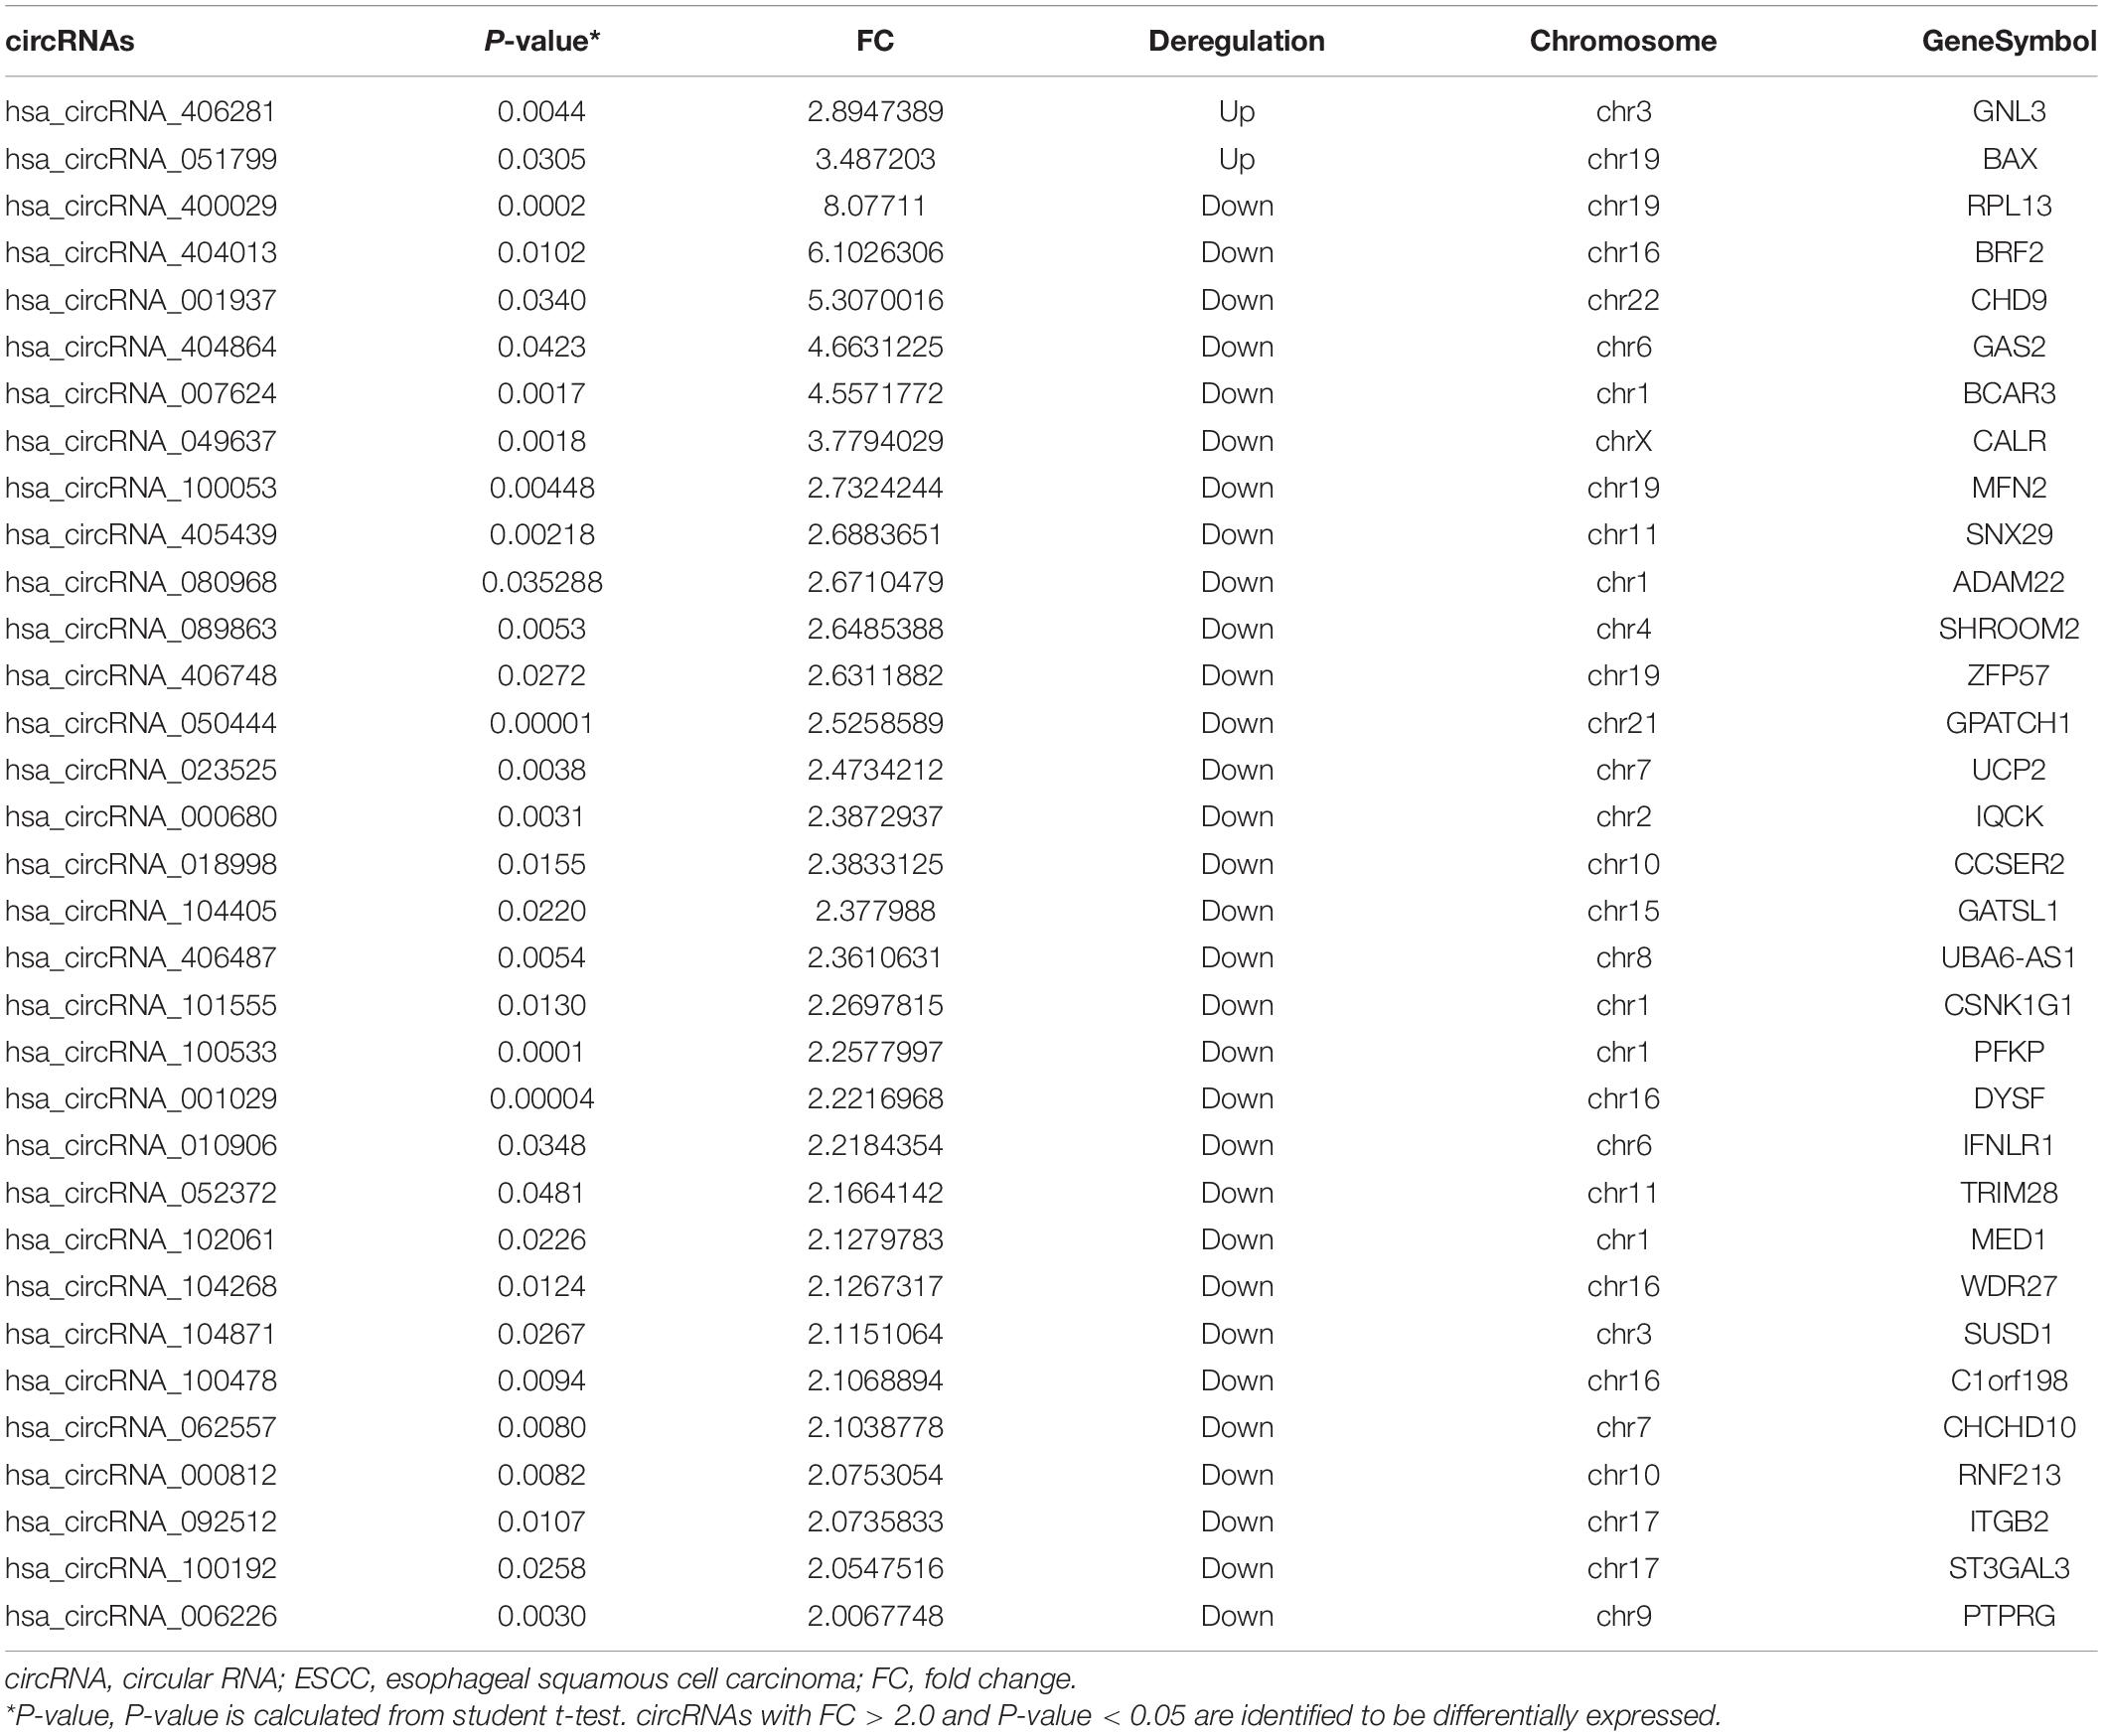
Table 2. Differentially expressed circRNAs in the plasma of ESCC patients.
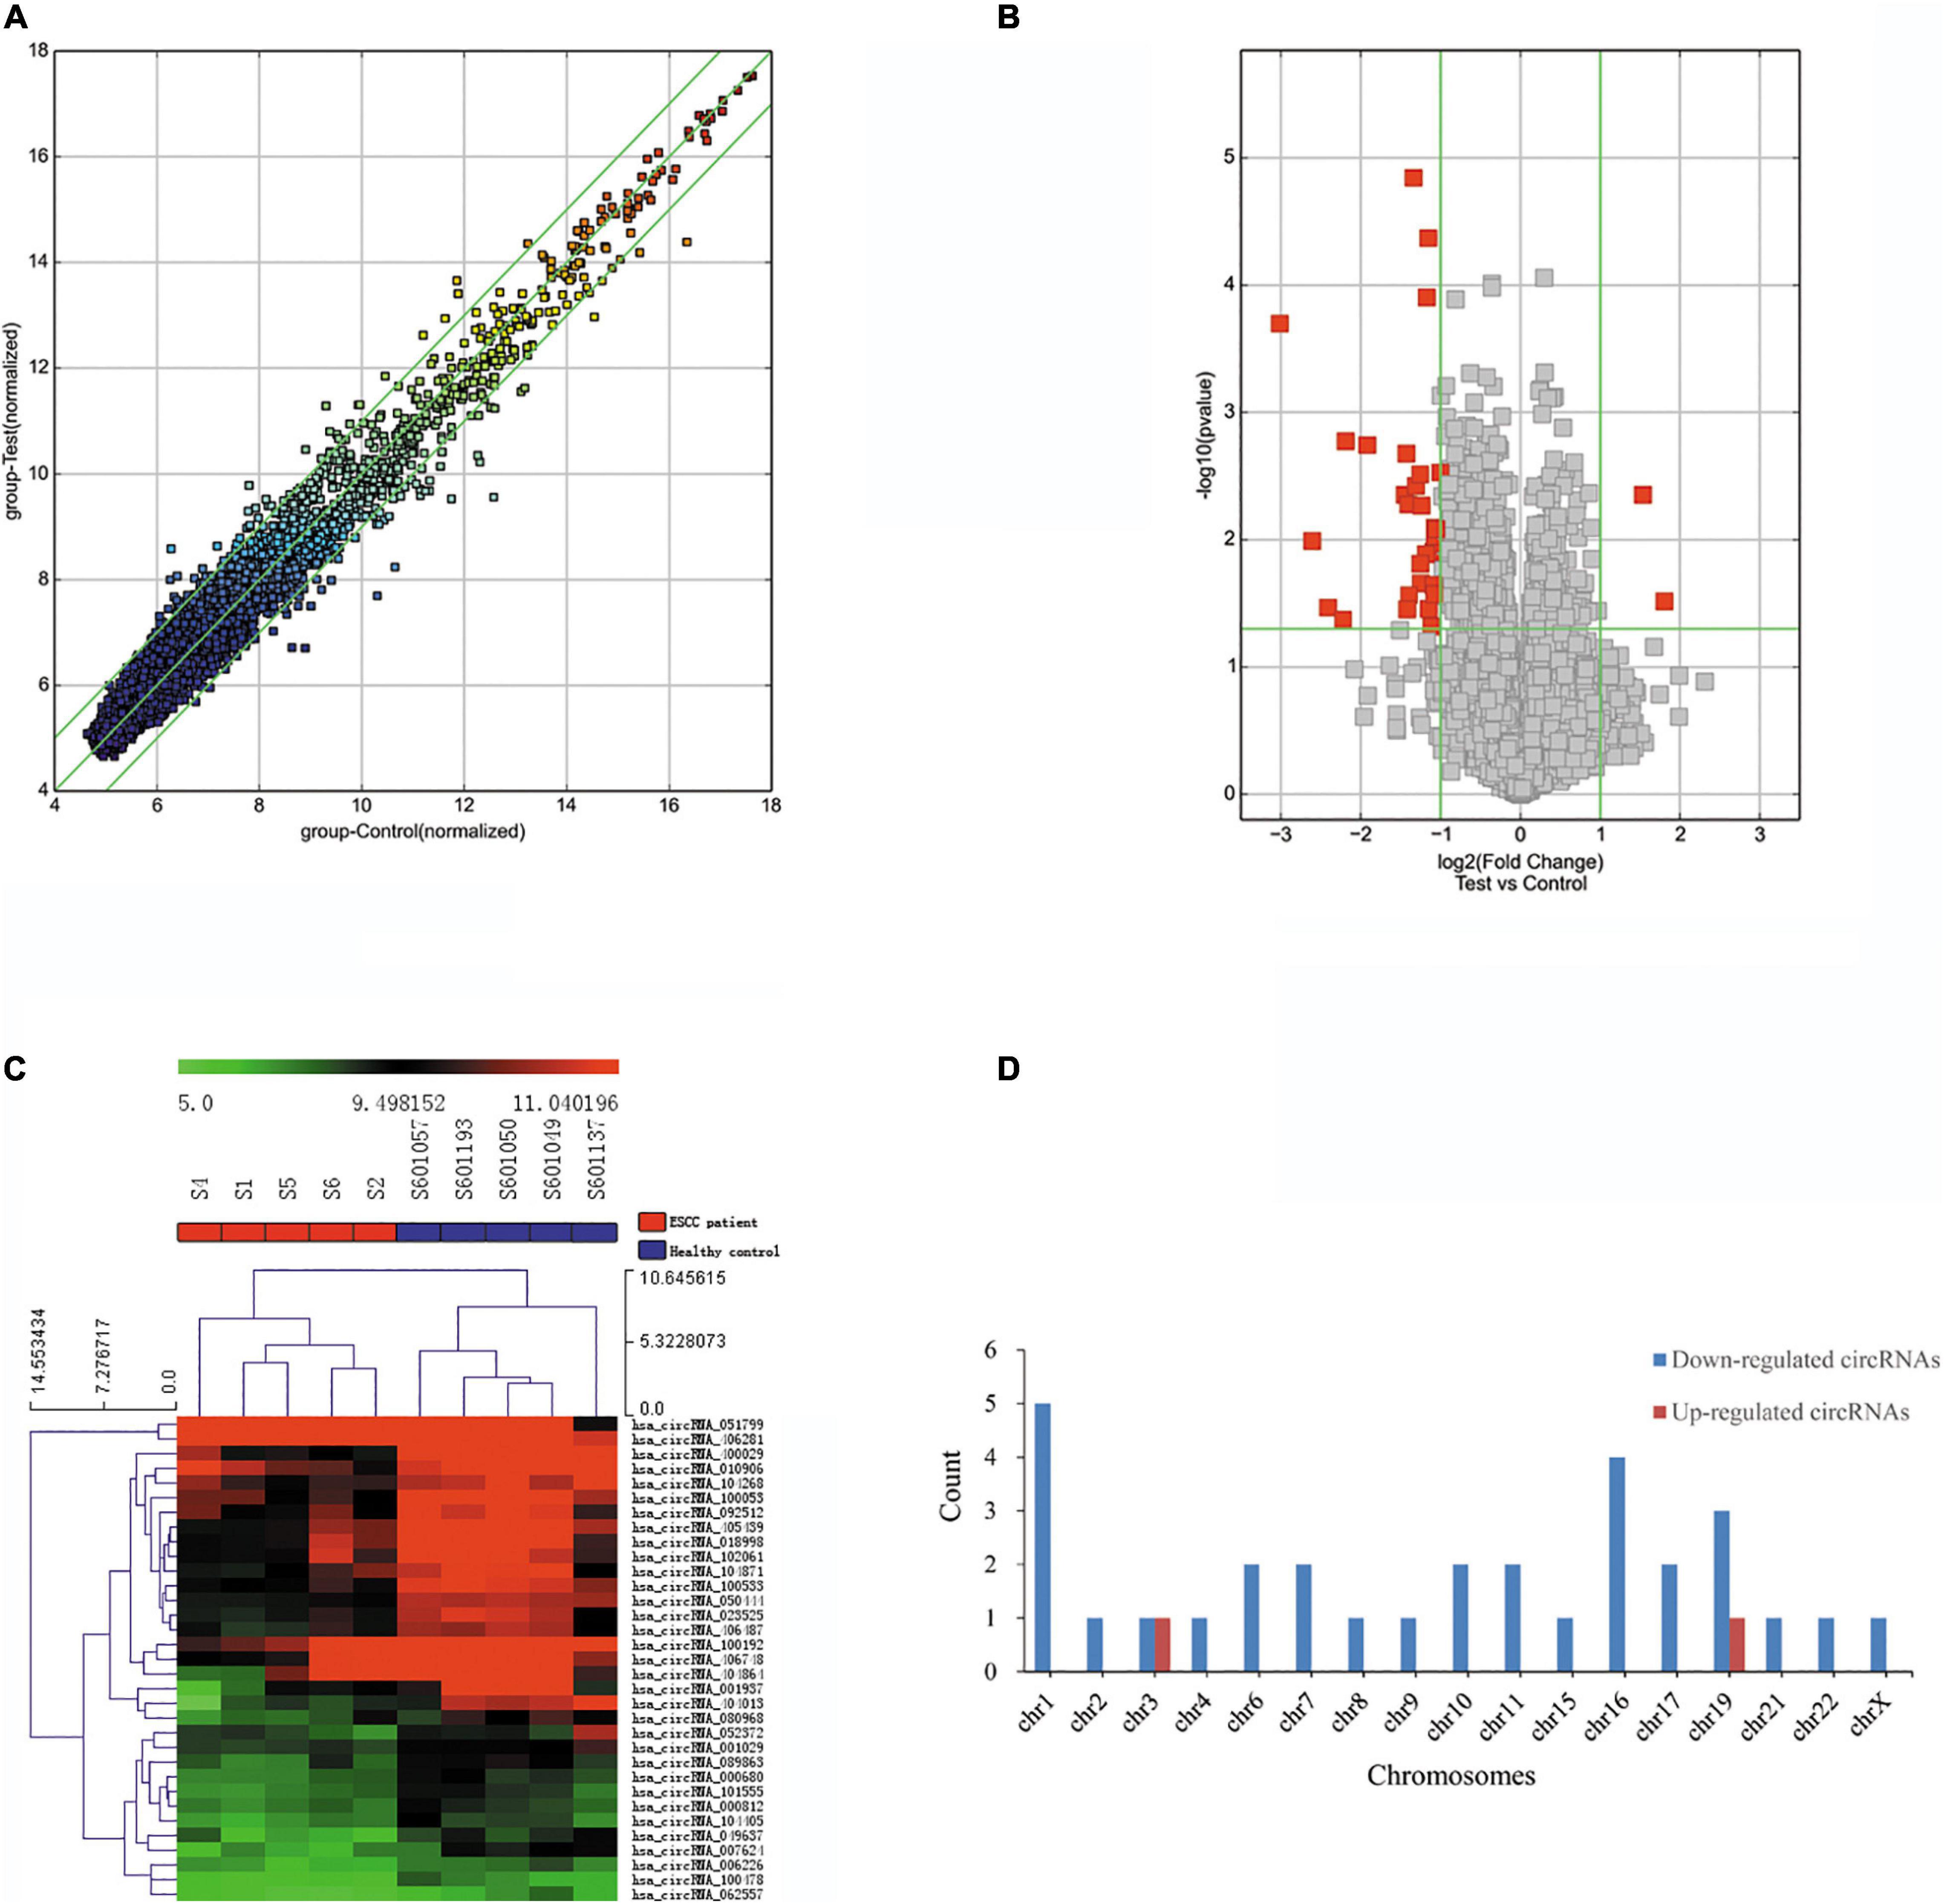
Figure 2. Differentially expressed circRNAs in ESCC patients. (A) The scatter plot of differentially expressed circRNAs. Green lines represent fold change of 2.0. (B) Volcano plot of differentially expressed circRNAs. The green vertical lines correspond to a fold change of 2.0, and the green horizontal line corresponds to a P-value of 0.05. (C) Hierarchical clustering of differentially expressed circRNAs. Each column represents a sample and each row represents a circRNA. The color reflects the expression level of circRNAs and changes from red (high) to black (medium) to green (low). (D) Bar plot shows the distributions of the differentially expressed circRNAs in human chromosomes.
Identification of DEmiRs and DEGs in ESCC
Four miRNA microarray datasets (GSE59973, GSE97049, GSE114110, and GSE145198) and four gene expression profiles (GSE29001, GSE20347, GSE38129, and GSE23400) were, respectively, integrated in our study. All these expression profiles were investigated in the samples of ESCC tissues and normal tissues from Chinese populations. Also, several of the datasets (GSE145198, GSE29001, GSE20347, GSE38129, and GSE23400) were obtained from populations in high ESCC incidence regions of China. The microarray assays were generated from the Agilent platform and Affymetrix platform. Detailed information of the four datasets is presented in Supplementary Table 1. Normalization of raw expression data was performed before further analyses. Boxplots of normalized expression data for all datasets are shown in Supplementary Figure 1. A total of 23 DEmiRs were determined by metaMA (combined P-value < 0.05) and RankProd (P-value < 0.05, FC > 1.5) methods, including 10 upregulated and 13 downregulated DEmiRs. The detailed information of DEmiRs is shown in Supplementary Table 2 and Supplementary Figure 2.
As for the gene expression profiles (GSE29001, GSE20347, GSE38129, and GSE23400), 2,220 DEGs were identified through the metaMA and RankProd method, including 1,209 upregulated and 1,011 downregulated DEmiRs. The detailed information of DEGs is shown in the Supplementary Table 3 and Supplementary Figure 2. The identified DEmiRs and DEGs were further selected from HMDD and GeneCards databases. After the intersection with the known ESCC-associated miRNAs and genes in the databases, six ESCC-related DEmiRs (three upregulated DEmiRs and three downregulated DEmiRs) and 381 DEGs (104 upregulated DEGs and 277 downregulated DEGs) were determined.
Identification of circRNA–miRNA and miRNA–mRNA Interactions
We collected the interacted circRNAs and mRNAs for the six ESCC-related DEmiRs from two online databases, RNA Inter and miRWalk. There were 57 circRNA–miRNA interactions in the RAID database and 423 miRNA–mRNA interactions in the miRWalk database. These miRNA–mRNA interactions were intersected with the 381 ESCC-related DEGs, and 190 overlapping DEGs were extracted for further network analysis in our study.
Construction of circRNA–miRNA–mRNA Network
Based on the identified circRNA–miRNA and miRNA–mRNA interactions, we constructed a circRNA–miRNA–mRNA network to visualize the interactions between the selected circRNAs, the ESCC-related DEmiRs, and DEGs. The miRNA-connected regulatory relationship depended on the number of shared DEmiRs. As shown in Figure 3, this regulatory network included 31 DECs, 6 DEmiRs and 190 DEGs. Hsa-let-7c and hsa-miR-133b exhibited the highest number of circRNA and mRNA binding sites, indicating that they may be competitively sponged by circRNAs and thus exert essential roles in the regulatory network. The details of the interaction network are listed in Supplementary Table 4.
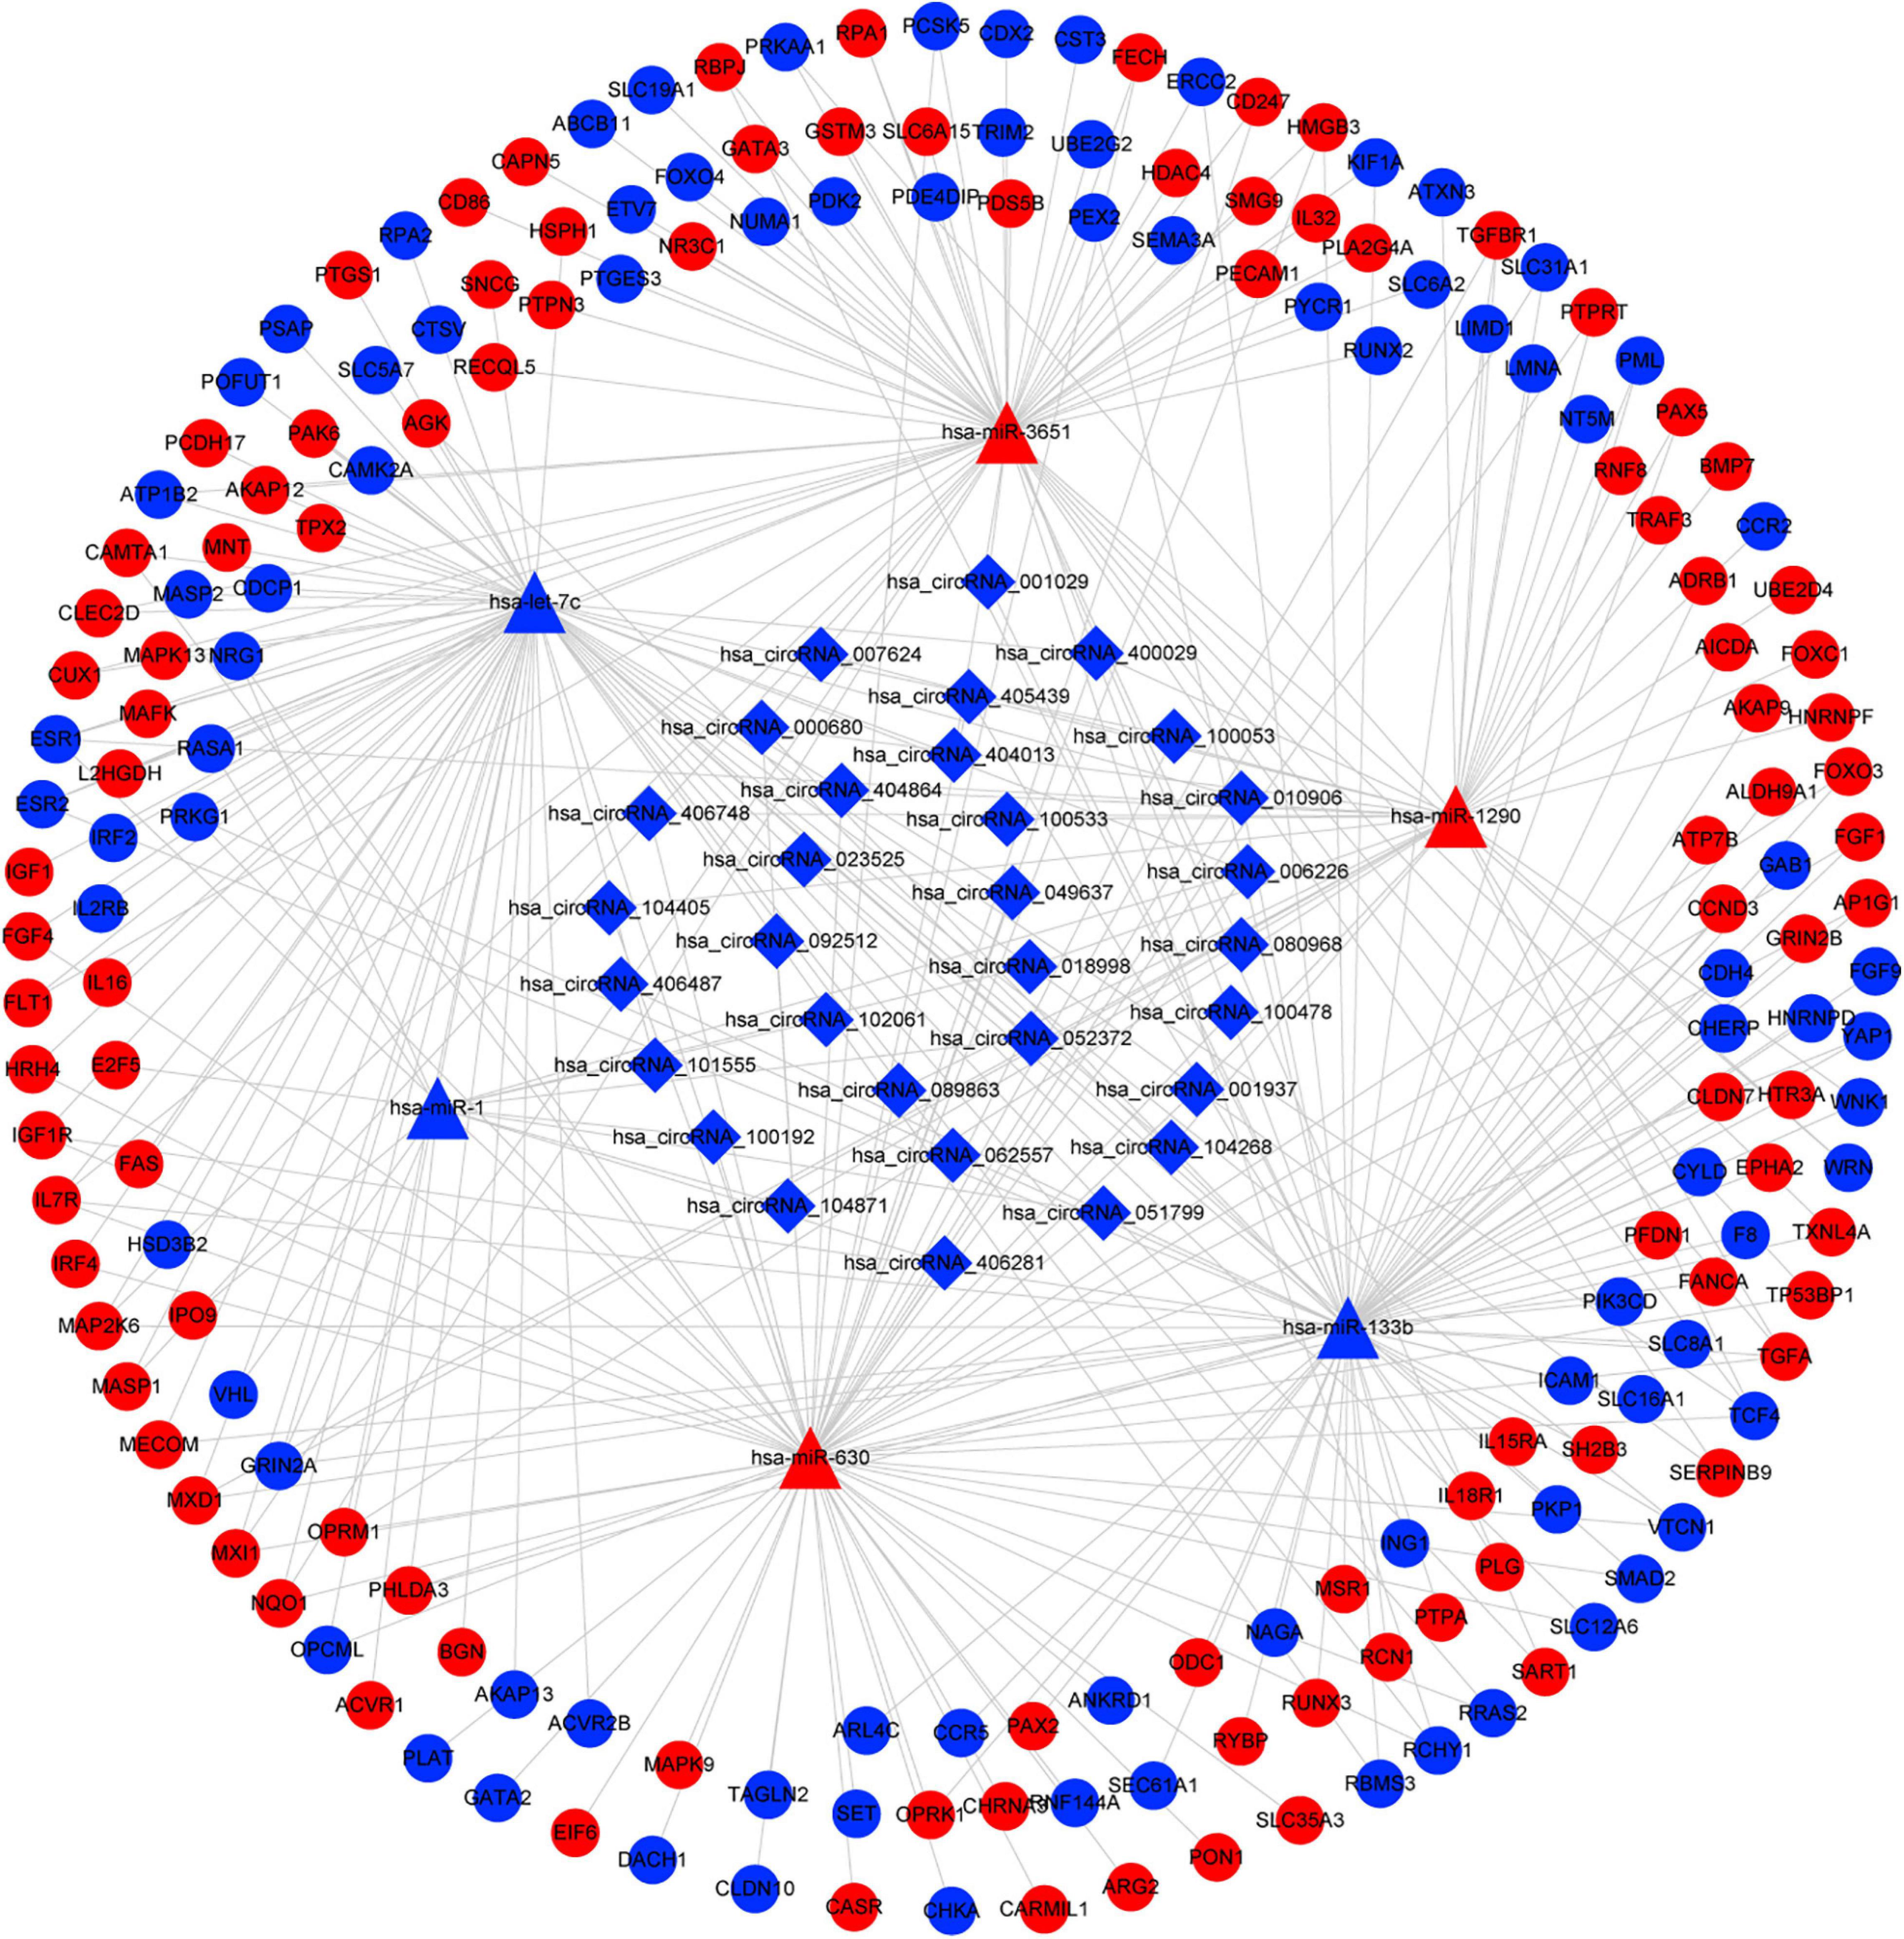
Figure 3. CircRNA–miRNA–mRNA interaction network in ESCC. CircRNAs are represented by diamonds; miRNAs are shown as triangles; the DEGs are represented by ellipses. Red represents upregulated expression, and blue color represents downregulated expression. circRNA, circular RNA; miRNA, microRNA; ESCC, esophageal squamous cell carcinoma; DEGs, differentially expressed genes.
Functional Analysis
Gene Oncology and KEGG pathway enrichment analyses were then performed to further explore the potential functions of the 190 target DEGs involved in the network. According to the GO enrichment results, the overlapping target genes were significantly enriched in biological processes including positive regulation of locomotion, positive regulation of cell motility, positive regulation of cell migration, positive regulation of cellular component movement, and so on (Figure 4A). Results of KEGG pathway enrichment analysis revealed that the target genes were enriched in several cancer-related signaling pathways, namely, Ras signaling pathway, MAPK signaling pathway, FoxO signaling pathway, PI3K-Akt signaling pathway, TNF signaling pathway, gastric cancer, melanoma, and hepatocellular carcinoma (Figure 4B). More information on the enrichment analyses is presented in Supplementary Table 5.
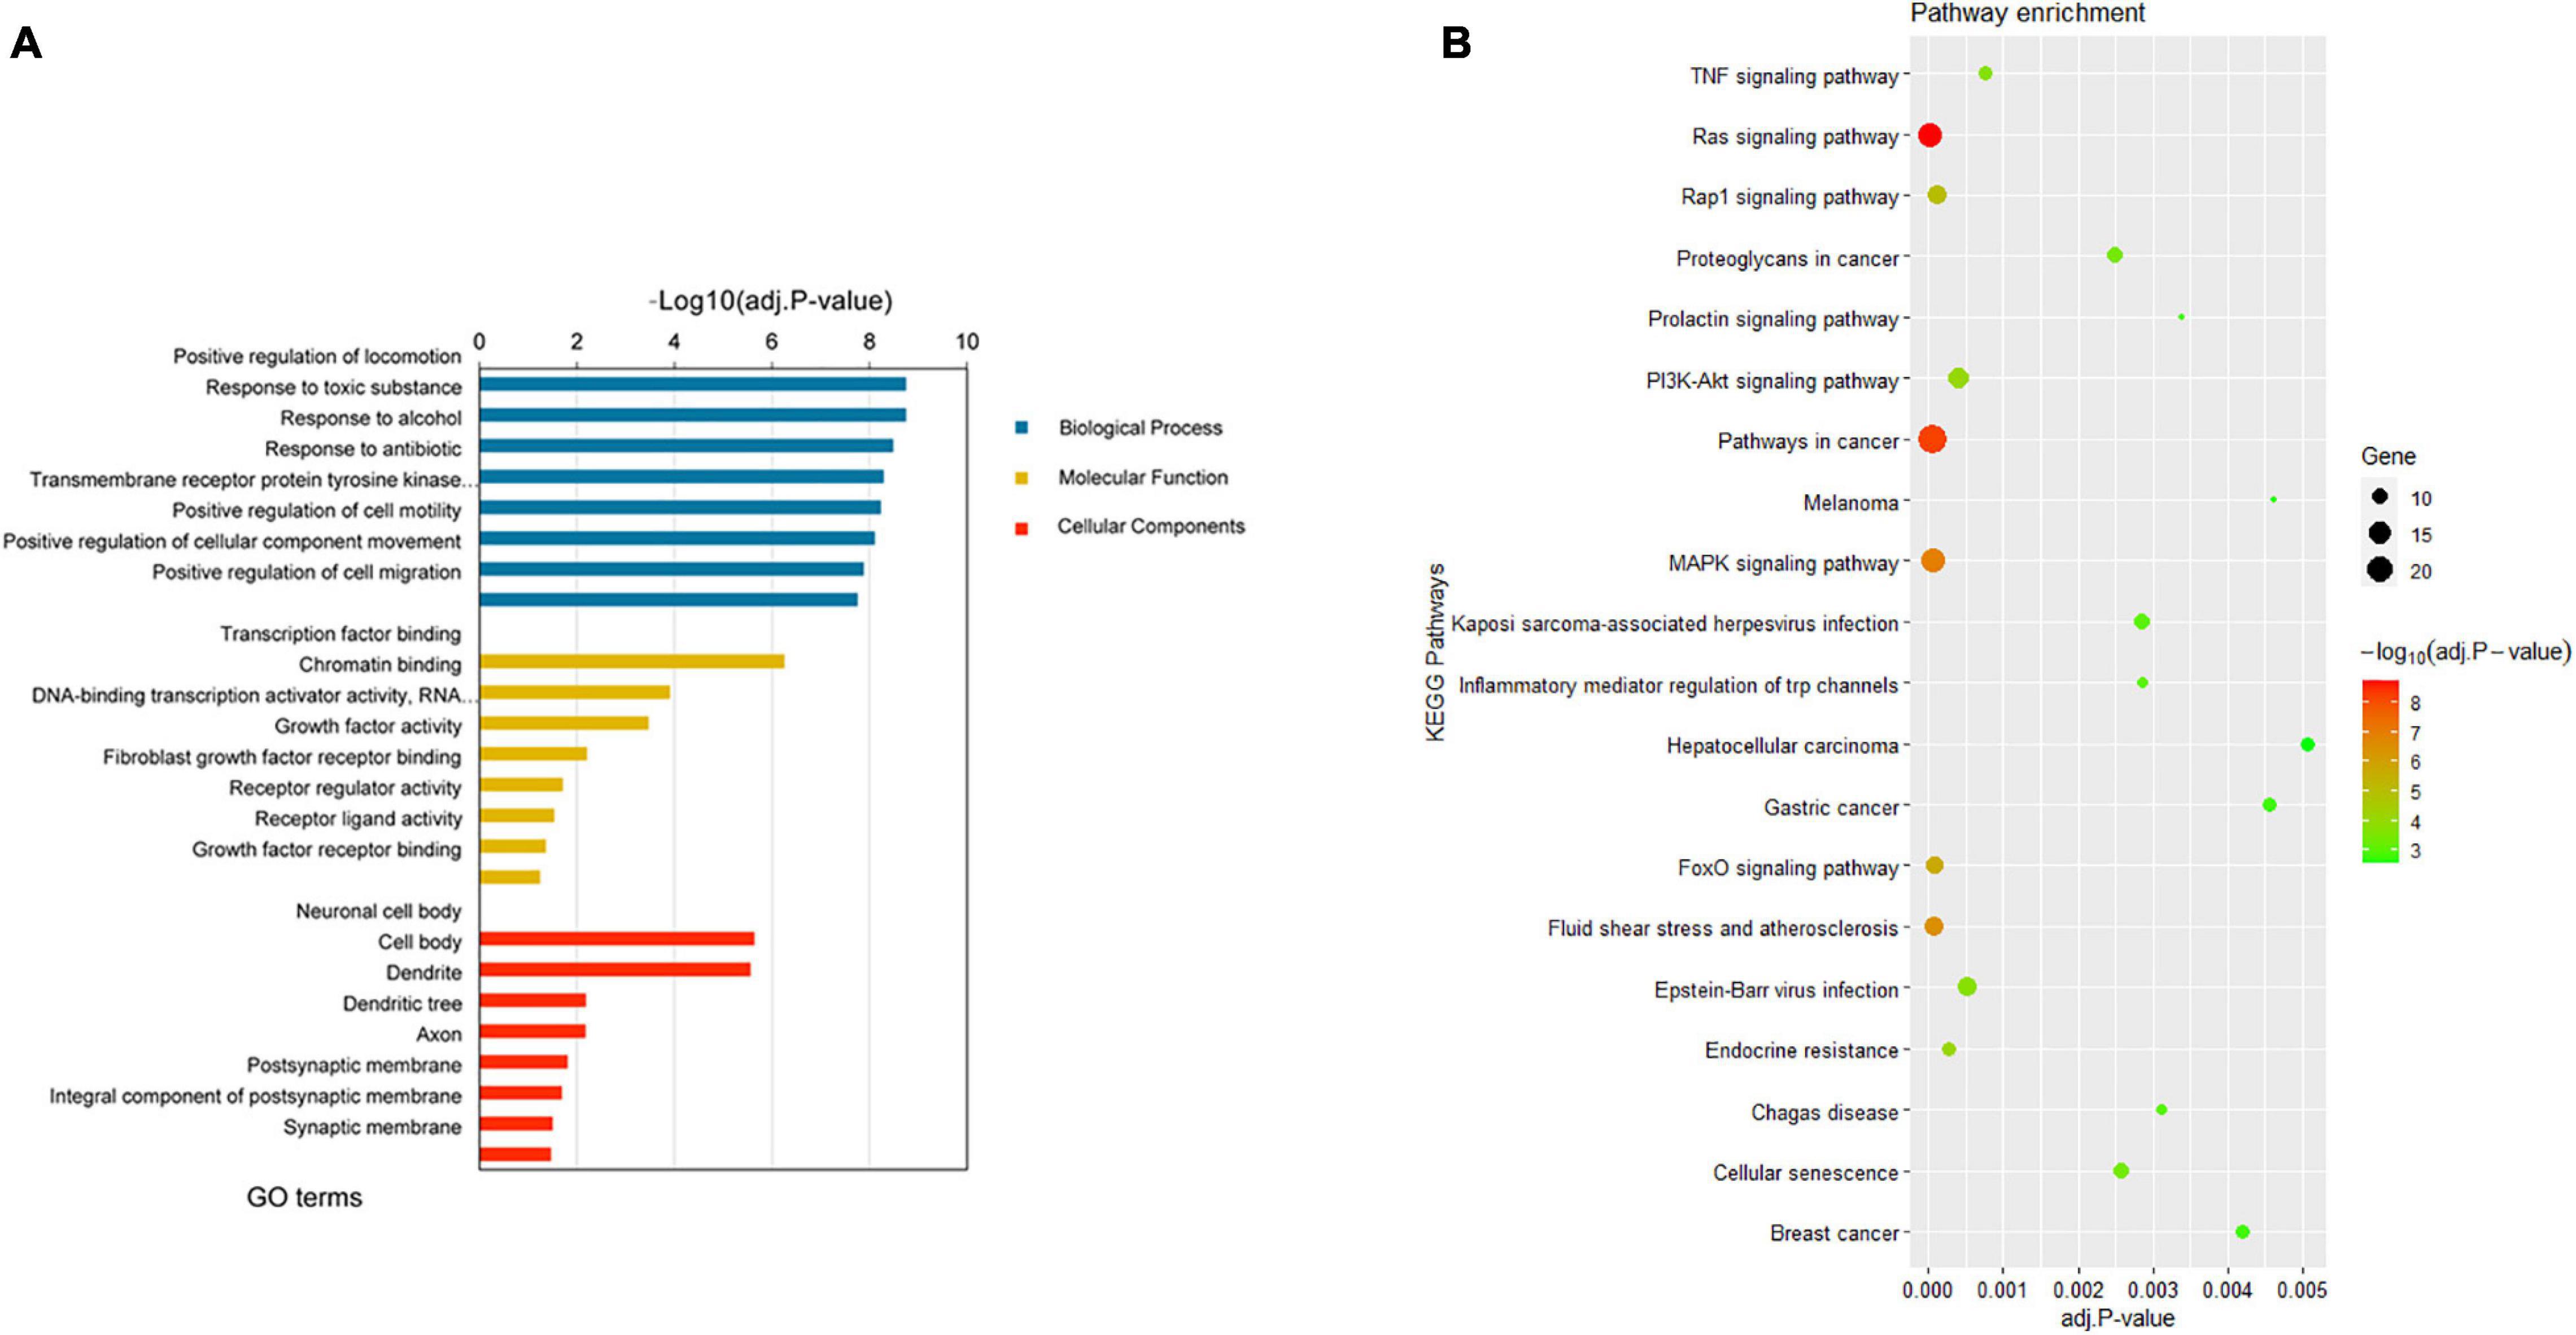
Figure 4. Enrichment analyses results of the DEGs from the network. (A) Top 8 enriched GO terms (biological process, cellular component, and molecular function) of DEGs. (B) Top 20 enriched KEGG pathway of DEGs. DEGs, differentially expressed genes; GO, gene ontology; KEGG, Kyoto Encyclopedia of Genes and Genomes.
Validation of the DEmiRs and Hub Genes in the Hub Network
According to the search results from miRCancer and dbDEMC databases, three DEmiRs (hsa-miR-1, hsa-let-7c, and hsa-miR-133b) were significantly downregulated in EC, while two DEmiRs showed significant overexpression in EC (Table 3), which was consistent with the results of the metaMA and RankProd analyses from the GEO datasets.
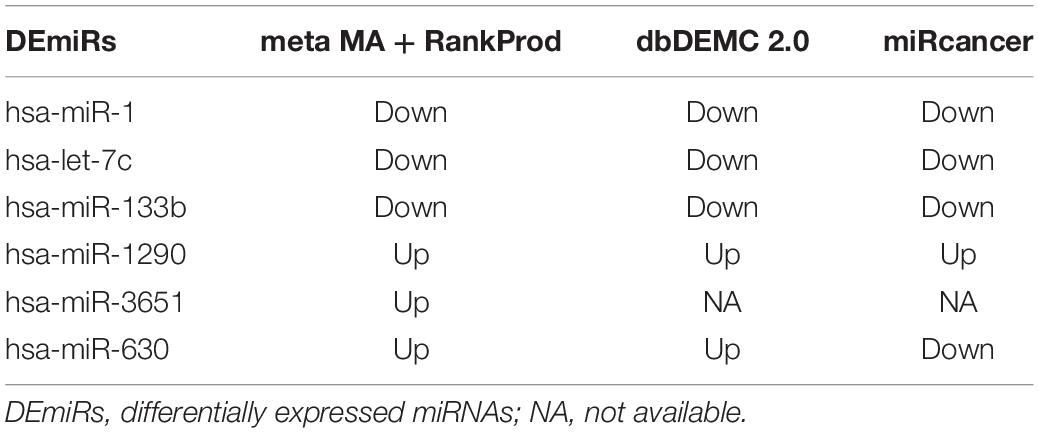
Table 3. Validation of DEmiRs in the public databases.
Based on the aforementioned investigation, we established a PPI network consisting of 160 nodes and 296 edges to excavate the interrelationship among the 190 DEGs (Figure 5A). A module consists of 10 hub genes with the highest MCC and degree scores, which is shown in Figure 5B. We validated the expression levels of the 10 hub genes using gene expression data from TCGA and GTEx databases. Two of the hub genes (ESR1 and IGF1) were confirmed to be under-expressed in EC tissues, and five of the hub genes (PECAM1, GATA3, IGF1R, FOXO3, and TP53BP1) were validated to be over-expressed in EC tissues (Figure 6). Furthermore, a survival plot showed that the high expression of some hub genes (FOXO3, CCR5, PECAM1, ESR1, and SMAD2) was associated with high risk of death in patients with esophageal carcinoma and other squamous cell carcinomas (Figure 7). A sub-network was then constructed to delineate the interactions among DECs, validated DEmiRs, and validated hub genes (Figure 8). There were four regulatory modules found according to the sub-network, including 29 DECs, 4 DEmiRs, and 5 DEGs.
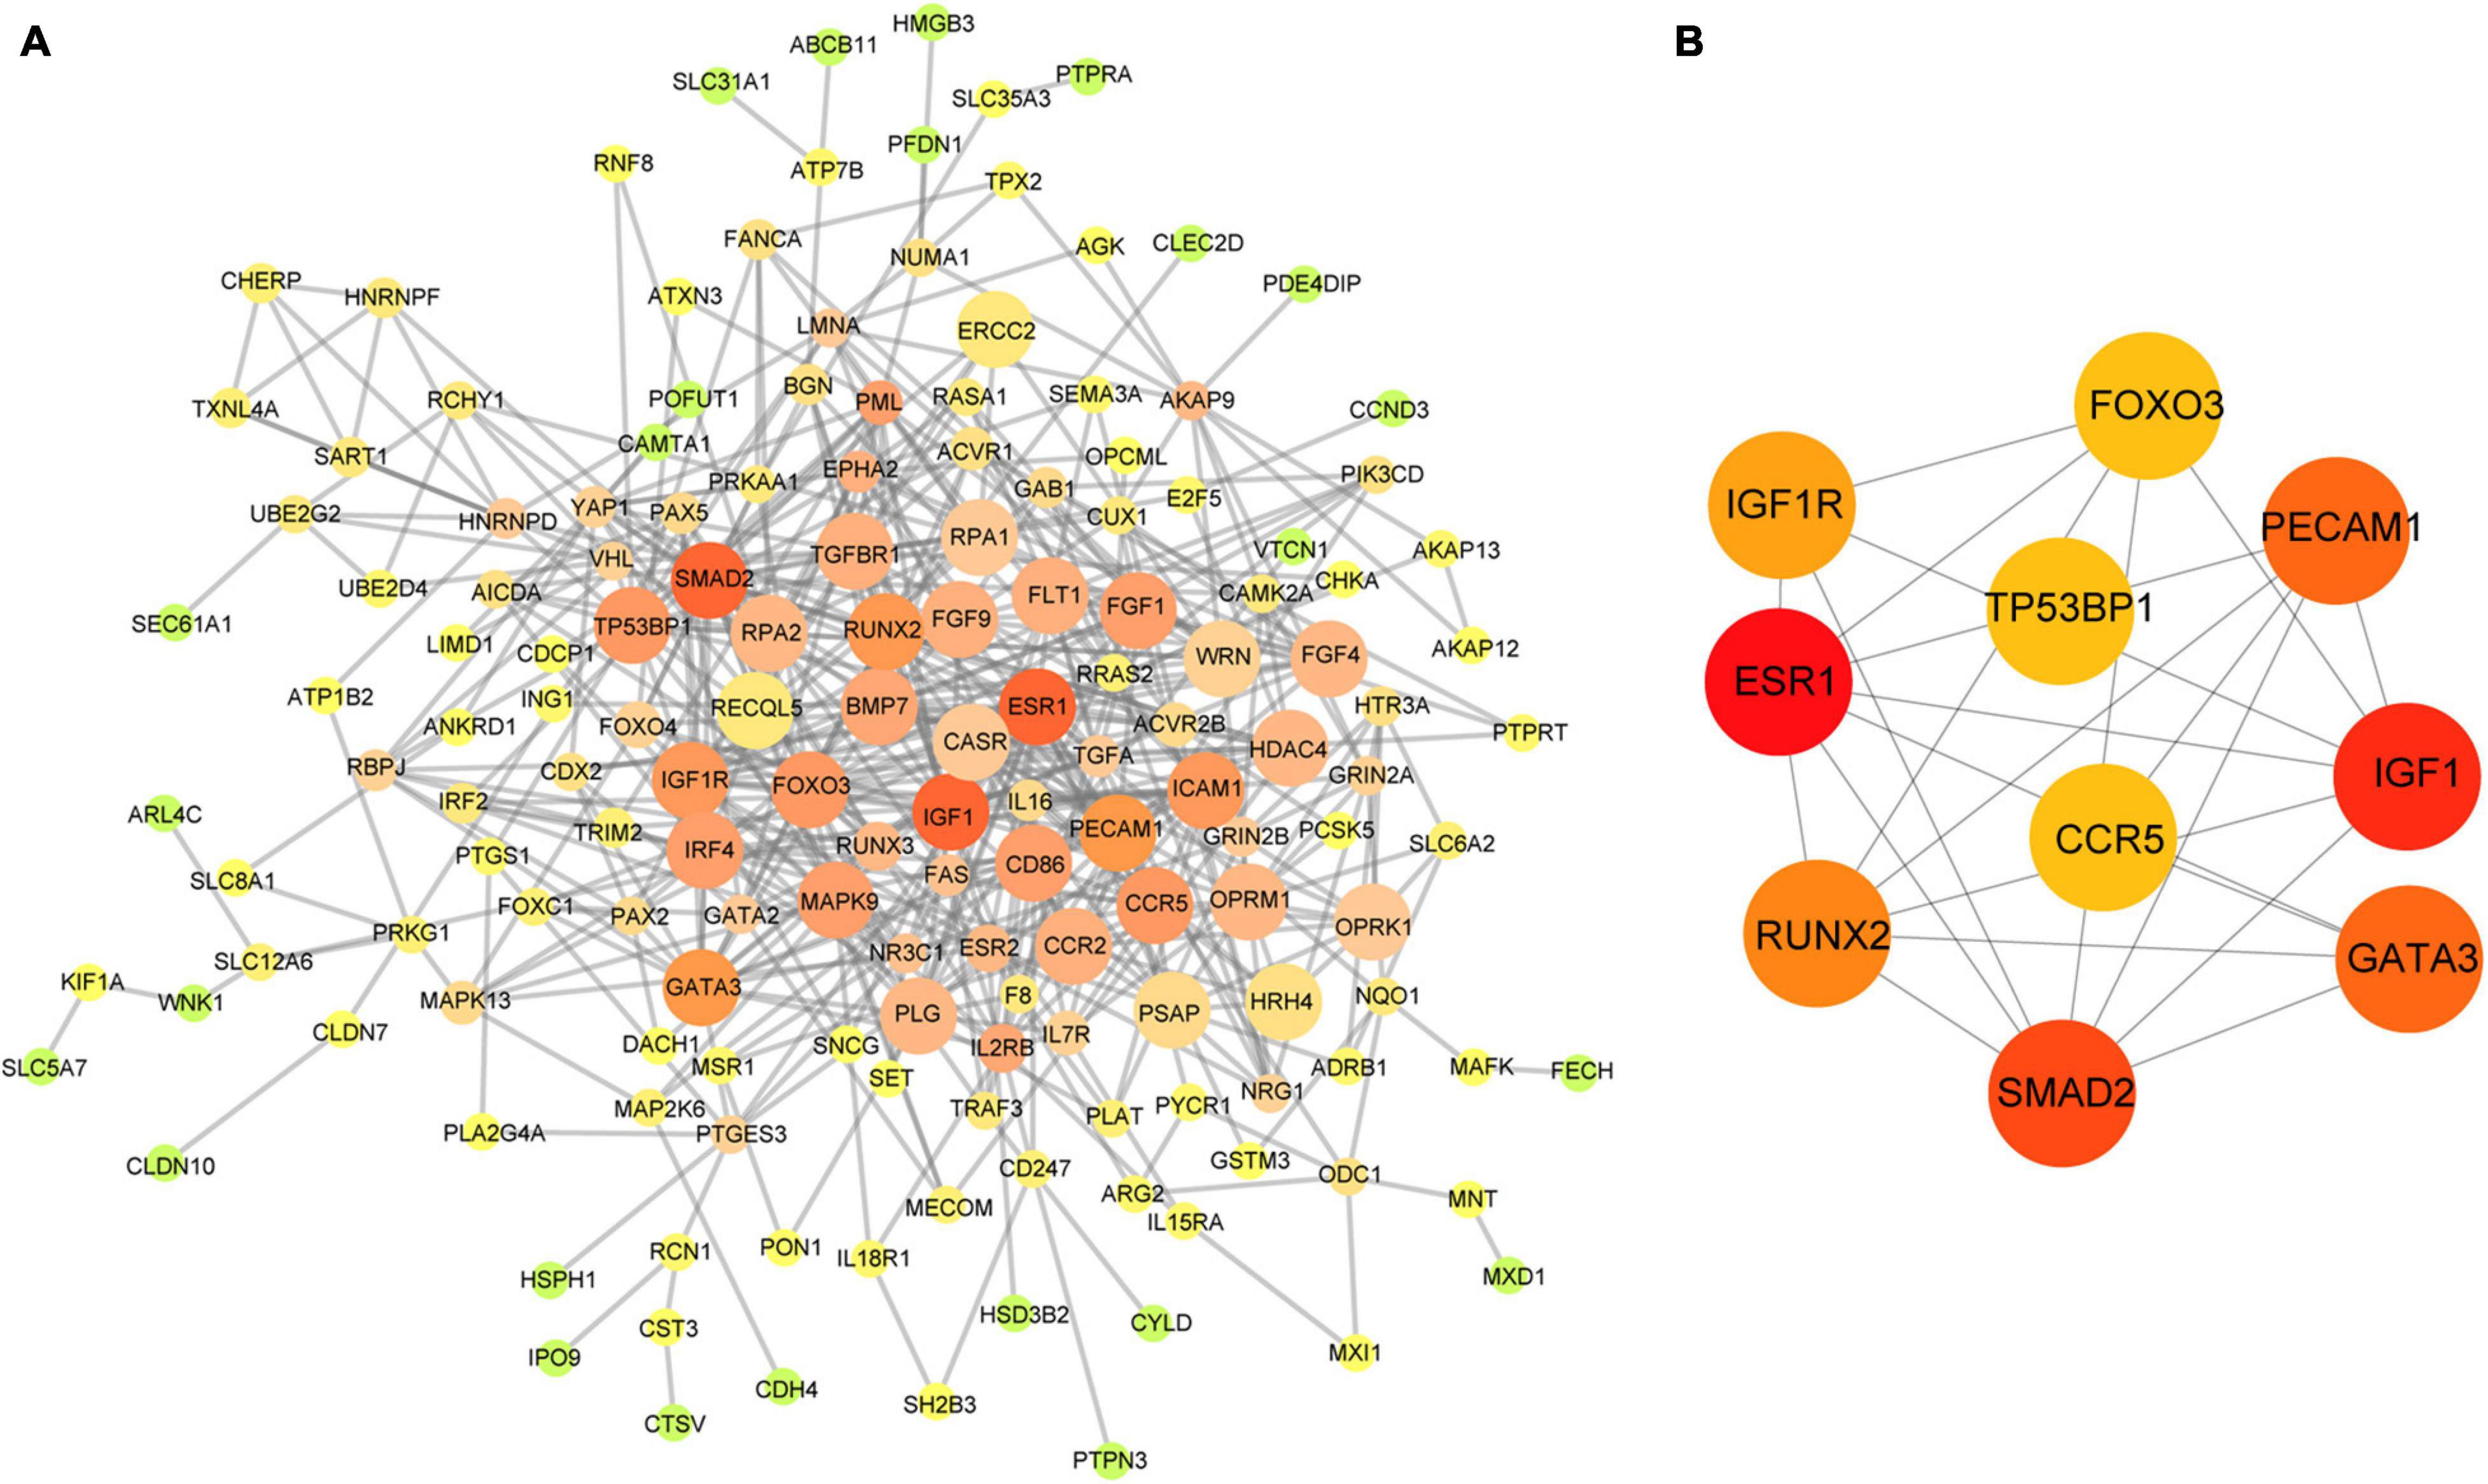
Figure 5. Identification of hub genes from the PPI network. (A) The PPI network of 190 DEGs in the network; the edge size and color change gradually in ascending order according to the degree of the genes. (B) The 10 hub genes identified by MCC and degree scores. PPI, protein–protein interaction; DEGs, differentially expressed genes; MCC, Maximal Clique Centrality.
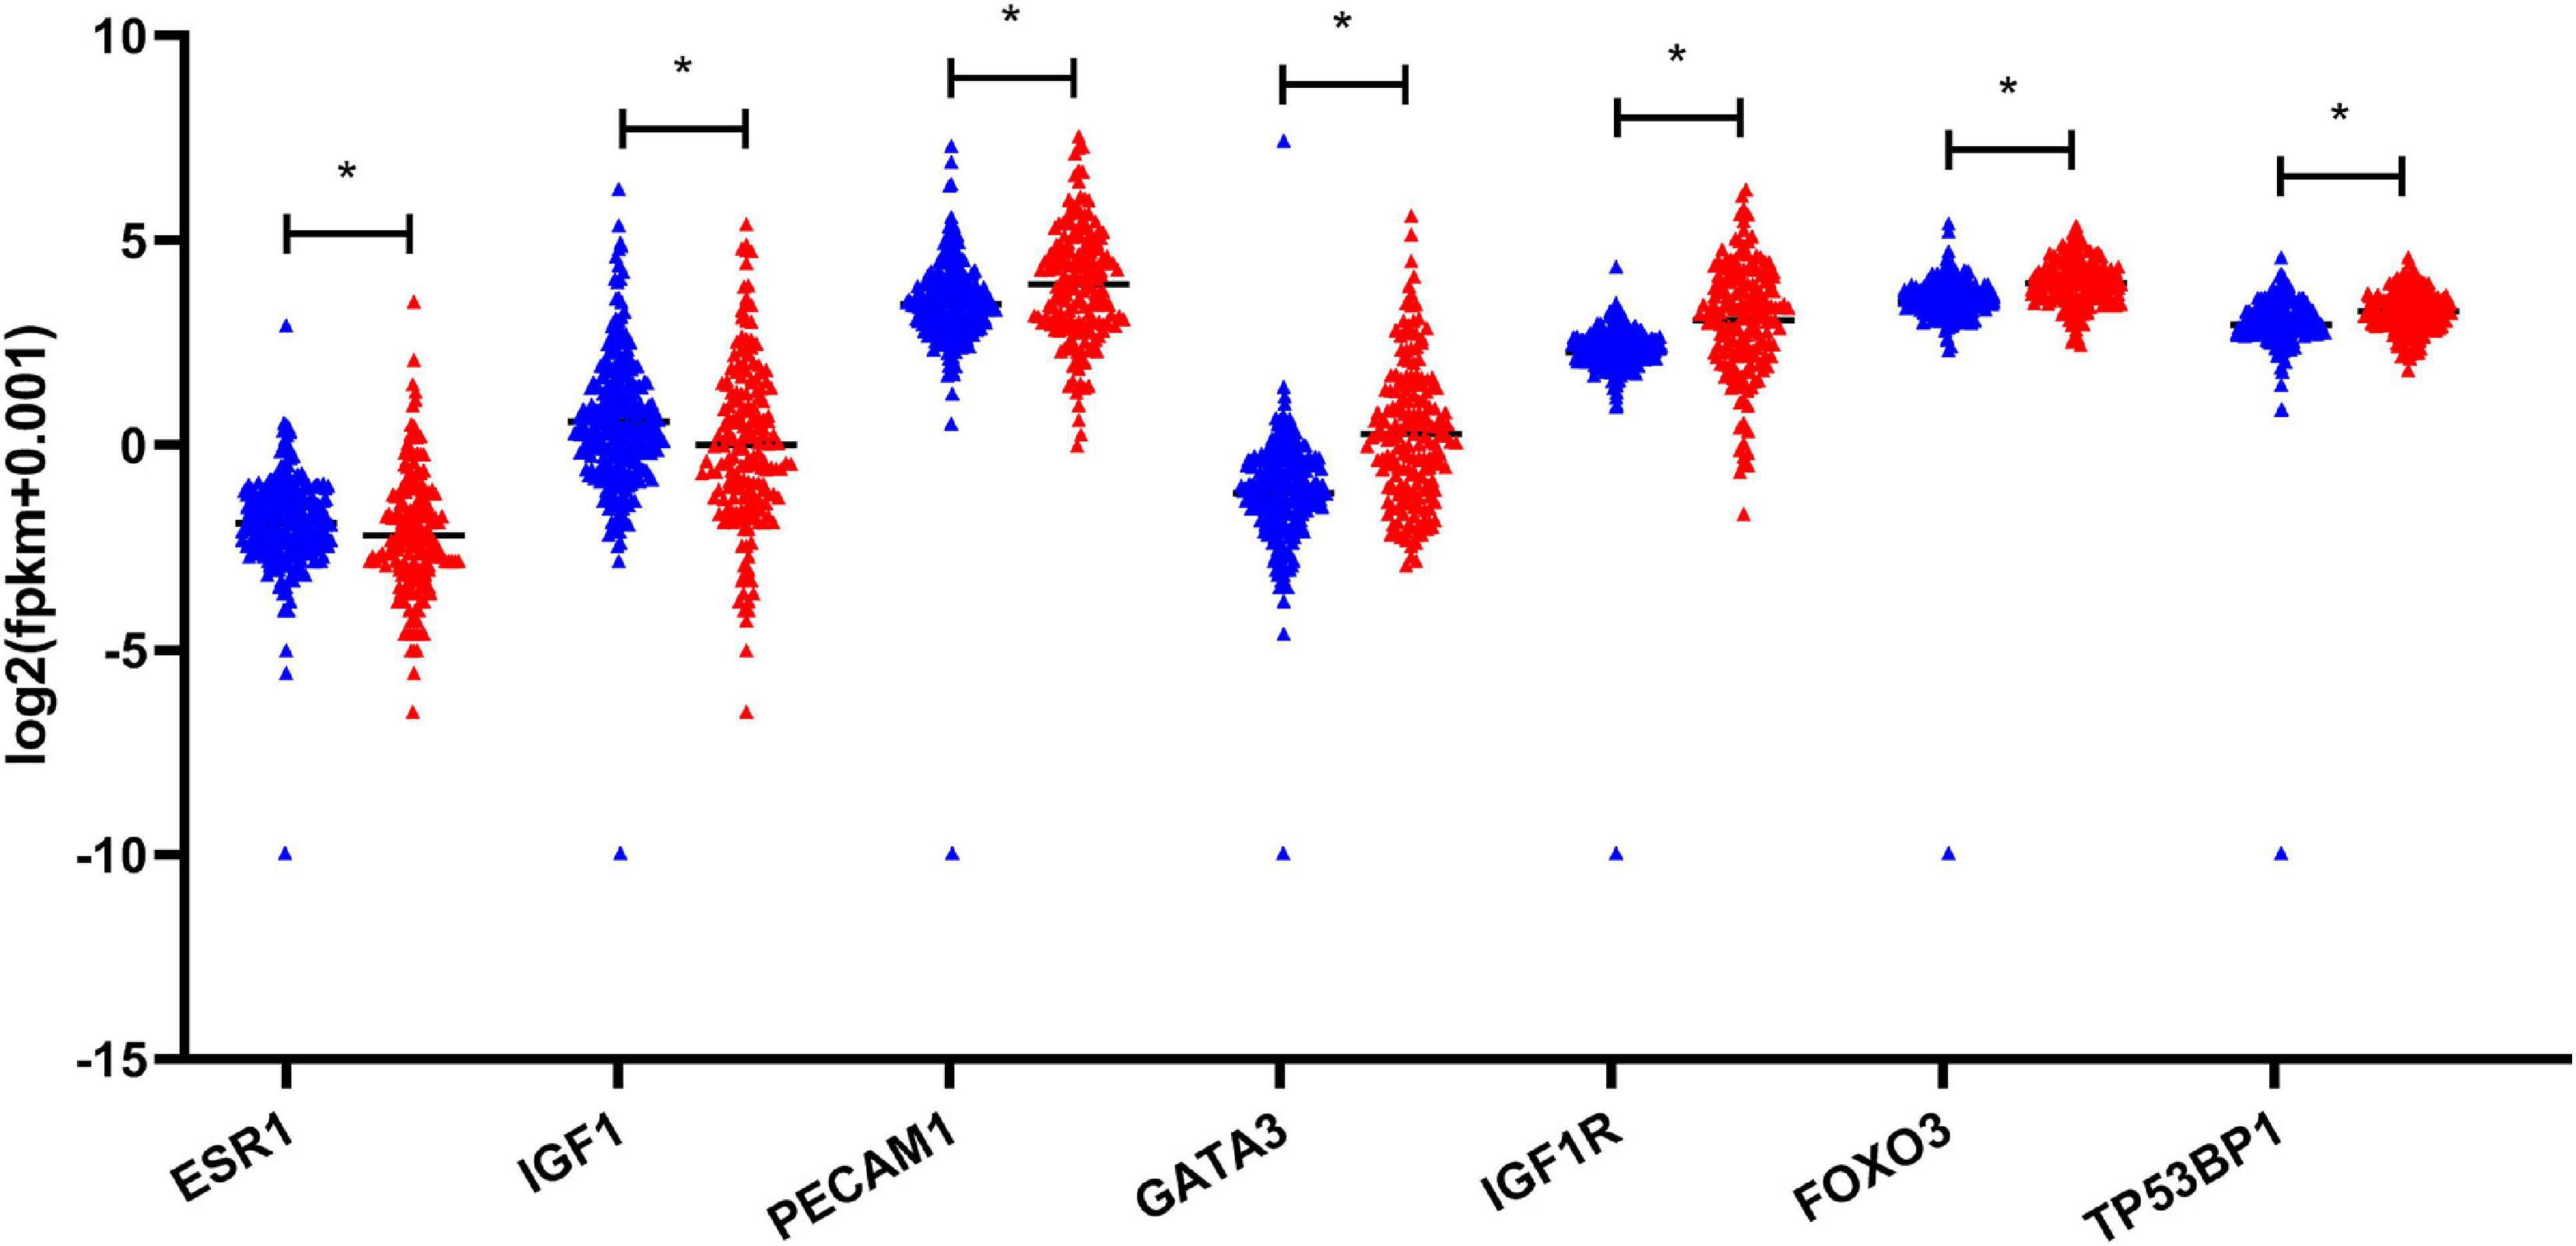
Figure 6. Validation of the expression of hub genes based on TCGA and GTEx database. *P-value < 0.05. EC, esophageal carcinoma; TCGA, The Cancer Genome Atlas; GTEx, the genotype-tissue expression projects.
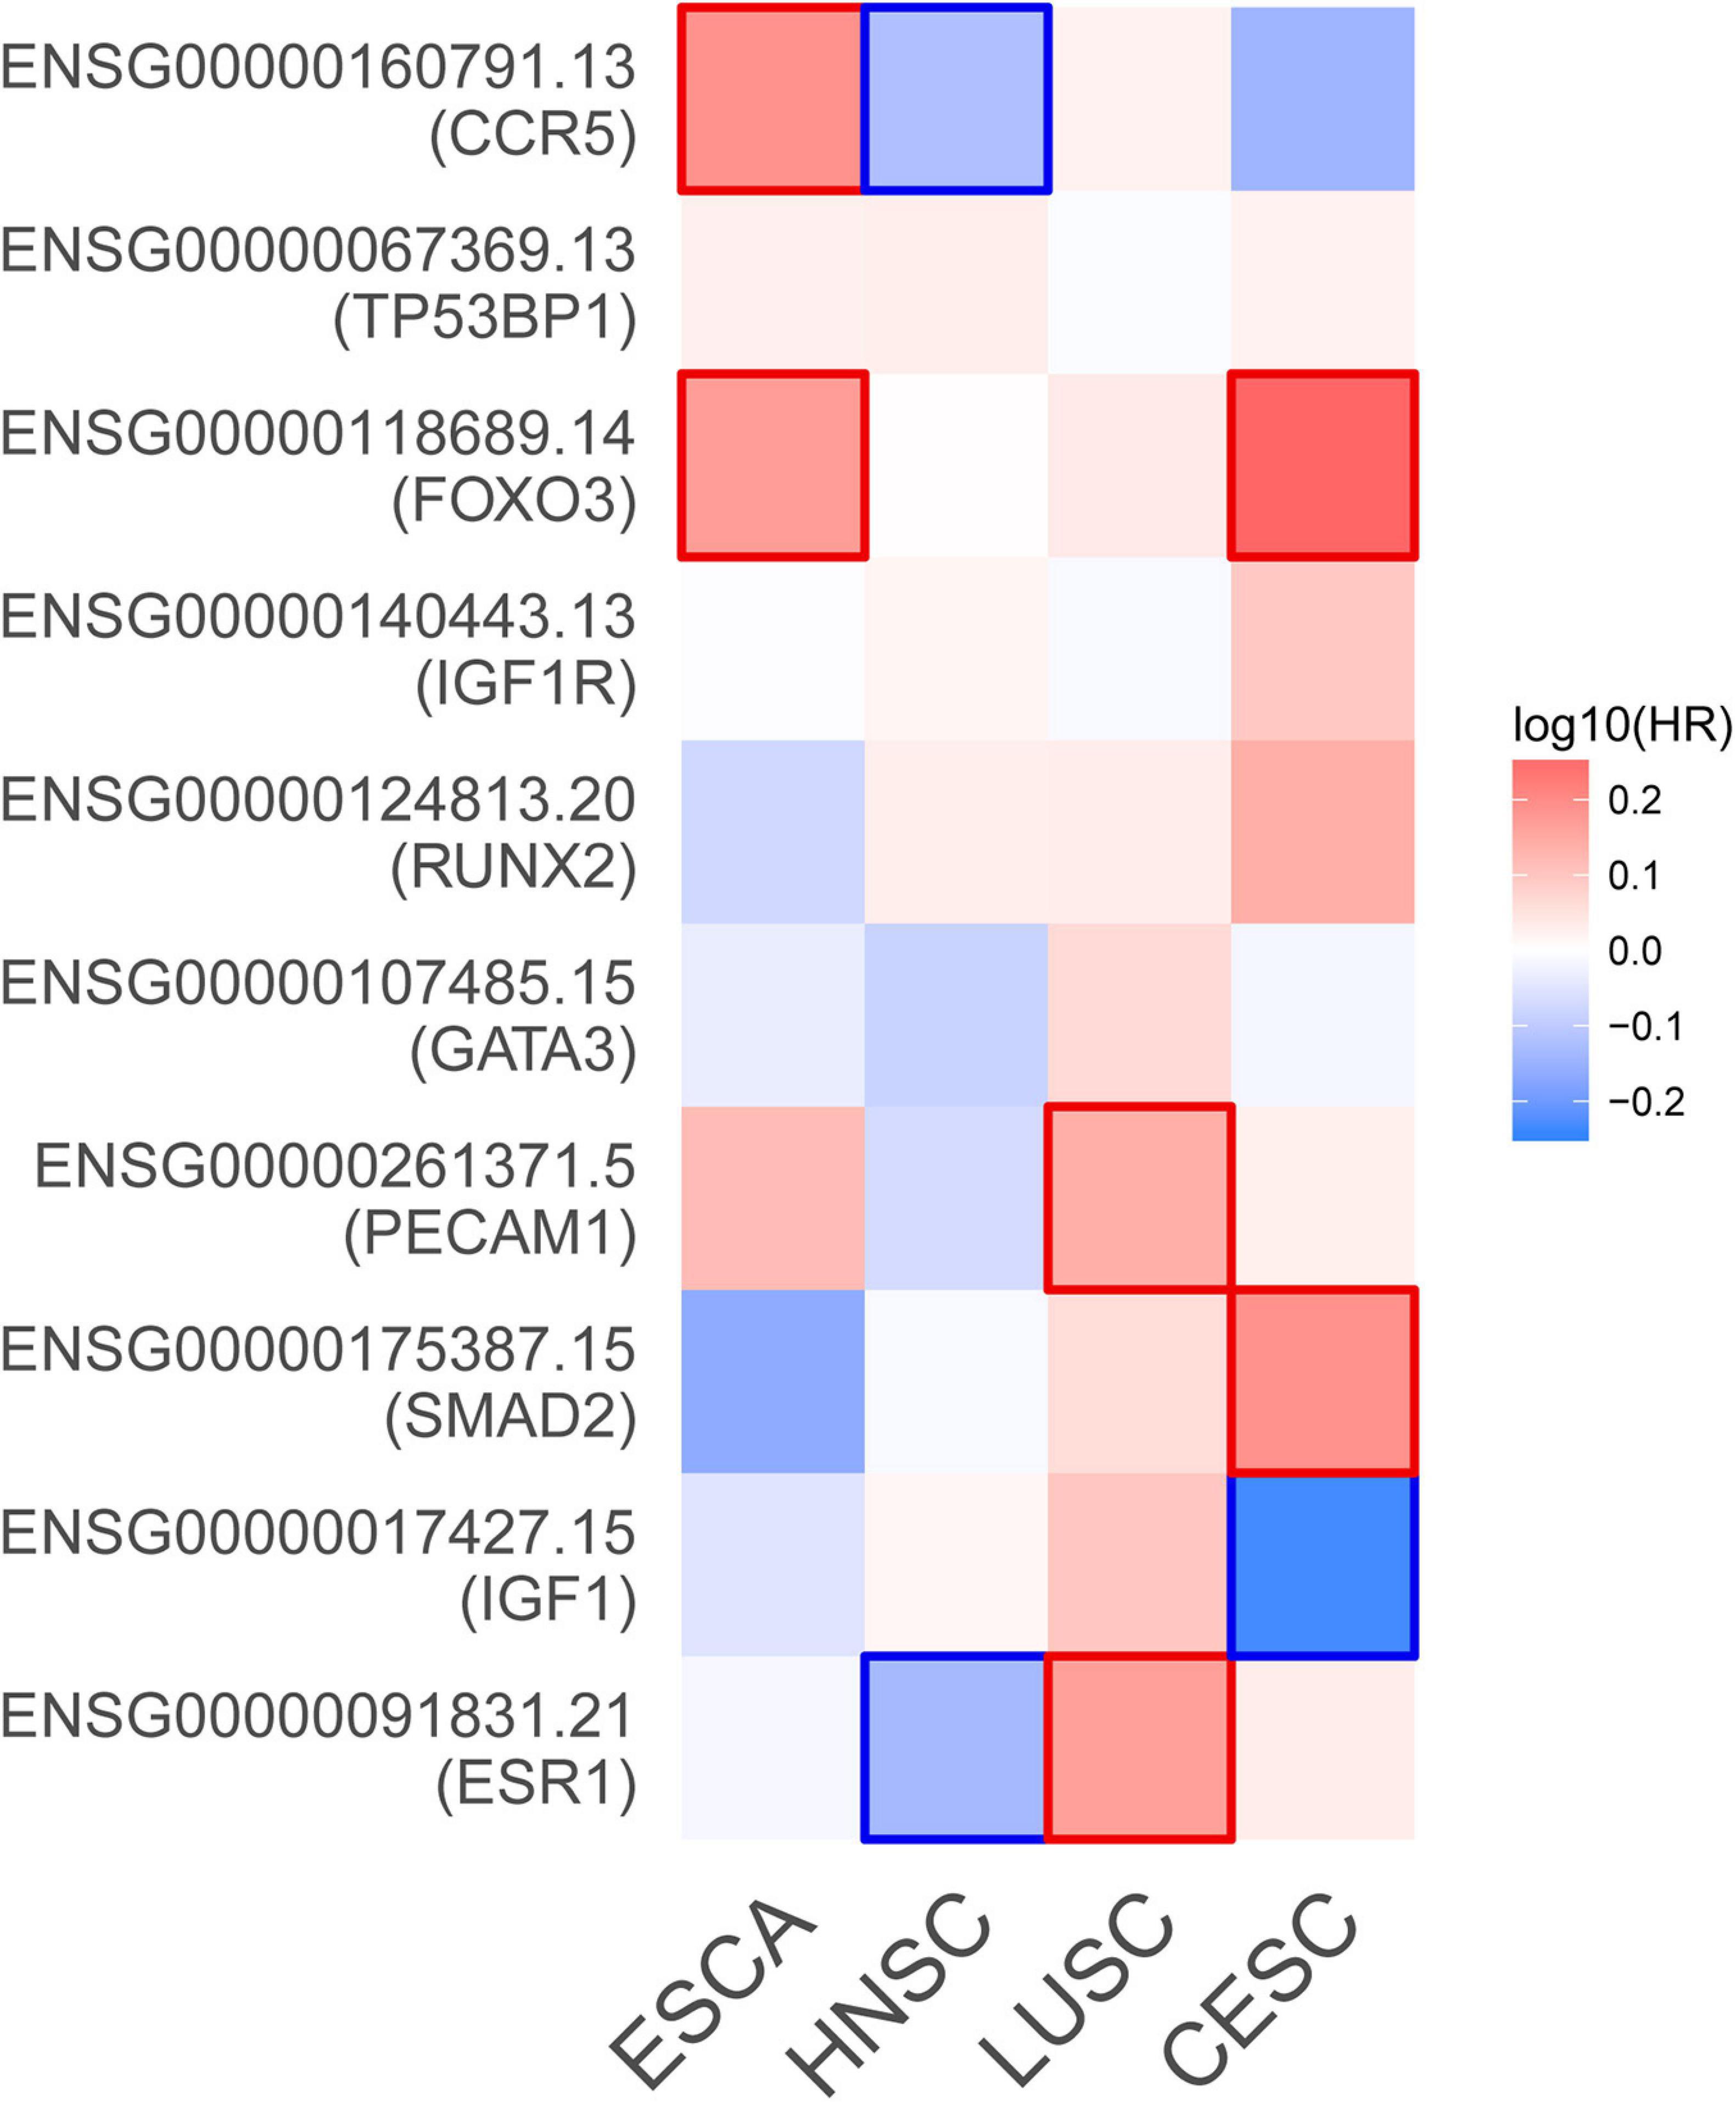
Figure 7. Survival map of the hazard ratios. The significant results (P-value < 0.05) of hub genes are marked in the map. CESC, cervical squamous cell carcinoma and endocervical adenocarcinoma; ESCA, esophageal carcinoma; HNSC, head and neck squamous cell carcinoma; LUSC, lung squamous cell carcinoma.
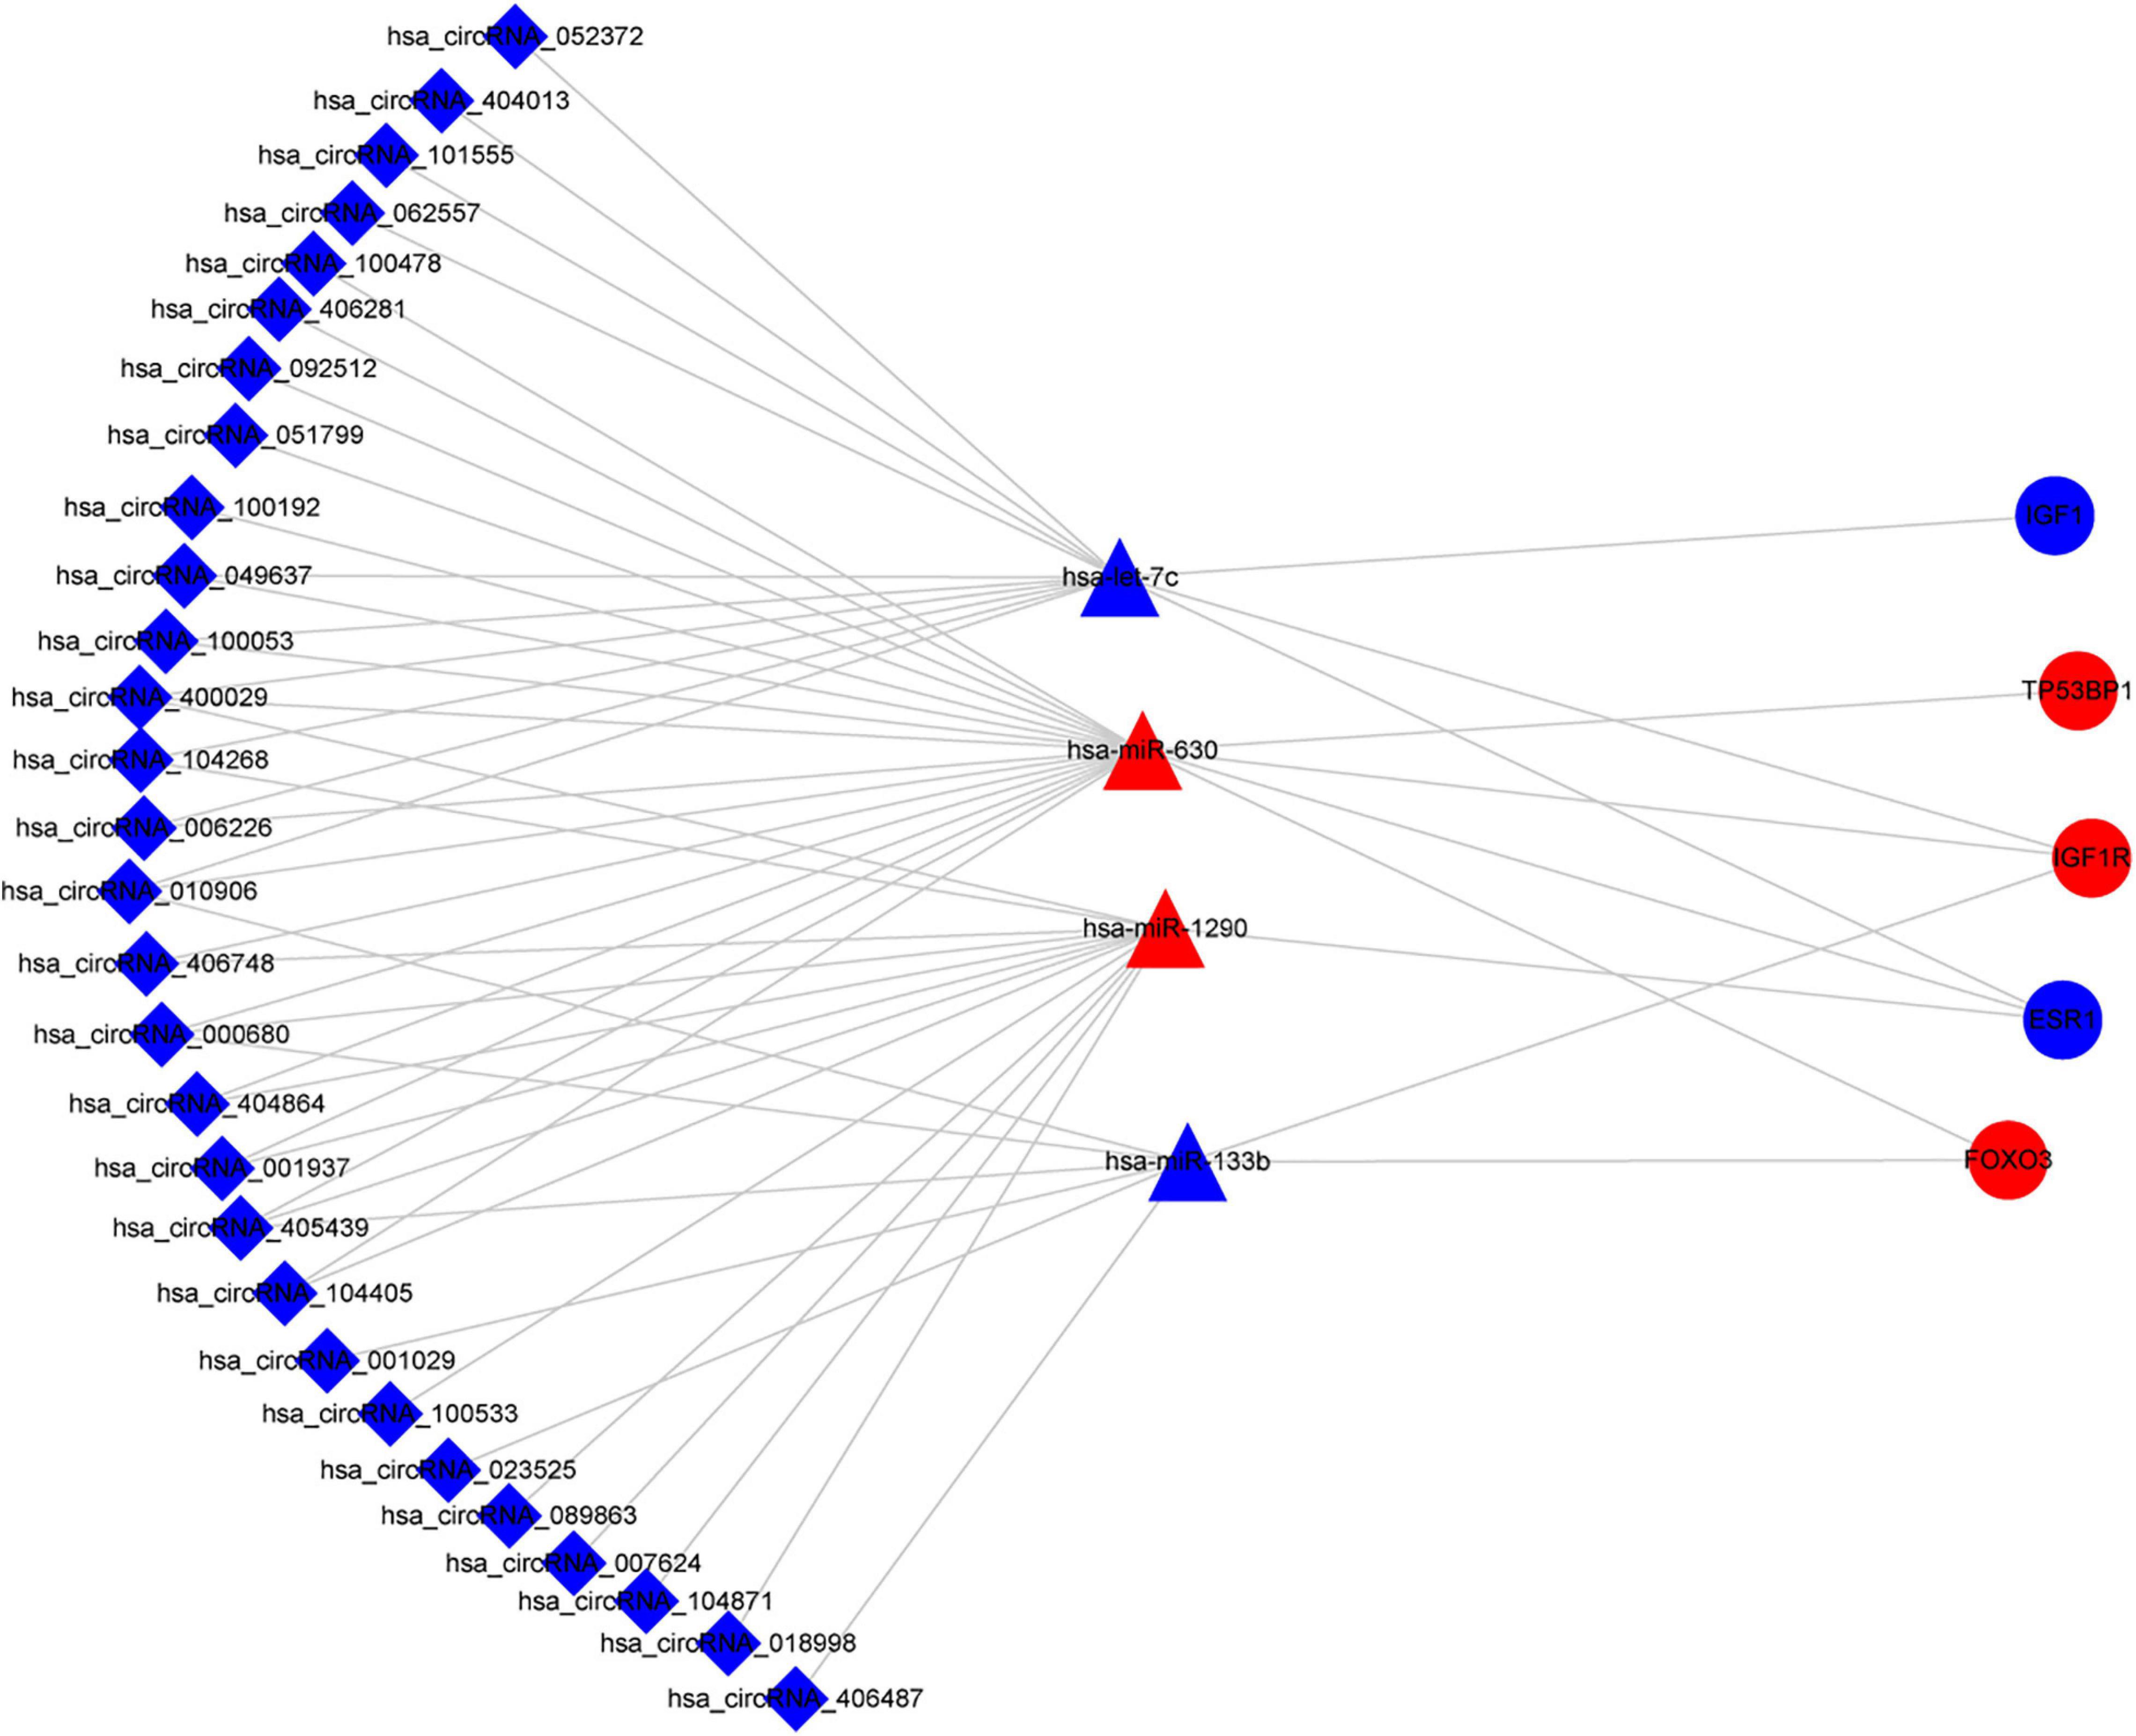
Figure 8. Sub-network of circRNAs, miRNAs, and hub genes. circRNAs are represented by diamonds; miRNAs are shown as triangles; hub genes are represented by ellipses. Red represents upregulated expression, and blue color represents downregulated expression. circRNA, circular RNA; miRNA, microRNA.
Discussion
As a special class of covalently closed RNA molecules, circRNAs have been revealed more stable than linear RNAs and have multiple functions in the pathogenesis of different conditions. It has been well accepted that circRNAs could act as the endogenous miRNA “sponge” to competitively absorb miRNAs and thus play important roles in post-transcriptional regulation. Recently, research has focused on the dysregulated circRNAs and their functions in the development of esophageal cancer (Li et al., 2015a; Xia et al., 2016; Fan et al., 2019). Several circRNAs were involved in multiple biological processes of ESCC, such as cell proliferation, proliferation, migration, and invasion (Rong et al., 2018; Sang et al., 2018; Hu et al., 2019; Wang et al., 2019; Xing et al., 2020). However, the functional mechanism of circRNAs in ESCC still remains largely unknown and needs to be investigated. In this study, we first identified a comprehensively dysregulated expression profile of blood circRNAs in ESCC. A total of 33 aberrantly expressed circRNAs (FC > 2.0 and P-value < 0.05) were identified using a microarray-based assay, including 2 upregulated and 31 downregulated circRNAs (Table 2). Moreover, we identified the circRNA-associated ceRNA network in ESCC through a comprehensively integrated strategy. Microarray expression profiles in different platforms were collected from the GEO database. In addition, metaMA and RankProd analyses were performed to identify the DEmiRs and DEGs in ESCC tissues and normal tissues. Based on the circRNA microarray profiles and the public microarray datasets, the circRNA–miRNA–mRNA regulatory network was constructed, which could provide clues for the ceRNA mechanism in ESCC. Furthermore, we explored the functions and pathways of DEGs in the network through the application of bioinformatics analysis tools.
In our study, most of the differentially expressed circRNAs are transcribed from the human protein-coding exons. Hsa_circRNA_007624 was the most downregulated circRNA and transcribed from the BCAR3 gene, which encodes proteins to induce the resistance to antiestrogens of breast cancer cells (van Agthoven et al., 1998). We speculated that hsa_circRNA_007624 might be involved in the initiation and development of cancer. We also identified two DEmiRs (hsa-let-7c and hsa-miR-1290) that were associated with ESCC, which exhibited consistency with previous studies. Downregulation of hsa-let-7c has been shown to be correlated with poor prognosis of ESCC patients (Sugimura et al., 2012). The aberrant expression of hsa-miR-1290 has been previously reported in ESCC tissue samples, which was associated with the cell proliferation and metastasis in ESCC (Li et al., 2015b; Mao et al., 2015). However, further validation is necessary to detect the expression pattern of these circRNAs and miRNAs in ESCC.
Based on the integrated expression data and target gene predication, we next explored the potential functions and pathways of the 190 ESCC-related DEGs. GO analysis suggested that the target genes were involved in a series of processes, including regulation of cell motility, cell migration, and cellular component movement (Figure 4A). For the results of KEGG enrichment analysis, these ESCC-related DEGs were significantly involved in gastric cancer, melanoma, and hepatocellular carcinoma pathways (Figure 4B). In addition, the FoxO signaling pathway regulates a broad range of cellular functions that are crucial to tumorigenesis, including cell proliferation and apoptosis (Myatt and Lam, 2007). It has been reported that the MAPK signaling pathway plays an important role in cancer cell proliferation (Qiu et al., 2020) and tumor metastasis (Cheng et al., 2020). The PI3K-Akt signaling pathway is known as an oncogenic pathway and is associated with tumor angiogenesis, growth, and survival (Noorolyai et al., 2019).
To further clarify the regulatory mechanism of the circRNA–miRNA–mRNA network, we identified the 10 hub genes from the PPI network of 190 DEGs and then constructed the circRNA–miRNA–hub gene interaction network (Figure 5). Several of the hub genes (GATA3, IGF1R, and FOXO3) have been reported to be associated with the tumor progression of ESCC in previous studies. GATA3 was observed to directly regulate the transcriptional repression of androgen receptor, which exerted oncogenic functions in ESCC (Huang et al., 2020). FOXO3 was known as an inhibitor of cancer-related cell cycle progression and also contributed to the proliferation and metastasis of ESCC cells (Lu et al., 2018). IGF1R was significantly associated with the inhibition of the proliferation, migration, and invasion in ESCC cells (Mei et al., 2017). In addition, CCR5 showed a high expression pattern in ESCC tissues and was associated with poor prognosis (Kodama et al., 2020). Moreover, our enrichment analysis revealed that the aforementioned genes were all enriched in the cancer-related signaling pathway. Therefore, according to the sub-network, we suspected that some circRNA–miRNA–mRNA axes, such as hsa_circRNA_007624–hsa-miR-1290–ESR1, hsa_circRNA_100053–has-let-7c–ESR1/IGF1/IGF1R, and hsa_circRNA_100053–hsa-miR-630–ESR1/TP53BP1/IGF1R/FOXO3, indicated a competitive interaction network of circRNAs in ESCC. The aforementioned evidence might provide insights into the regulatory mechanism in the development of ESCC at the molecular level. However, these findings are based on microarray profiles and public databases. Additional experiments, such as qRT-PCR, luciferase reporter assay, and the main effects of key circRNAs on biological processes are indispensable to further validate the possible roles of the regulatory network in ESCC.
There is an increasing amount of available microarray research on ESCC, although most datasets were performed independently and with relatively small samples. One of the strengths of our study is that it systematically integrated different microarray data to better identify the differentially expressed miRNAs and genes utilizing metaMA and RankProd analyses. This increased the sensitivity to reveal the deregulated miRNA and genes in ESCC. However, several limitations still needed to be clarified in this study. First, this study was based on a comprehensive strategy of differential expression profiles but did not confirm the expression levels of the circRNAs, miRNAs, and mRNAs in the same samples, thus validation in large cohorts is necessary to verify their co-expression patterns in ESCC. Second, although we have predicted the regulatory functions and pathways for the ceRNA network based on the multiple reliable algorithms, more vivo or vitro studies are required to investigate the oncogenic or tumor-suppressed functions of circRNAs in the development of ESCC.
Conclusion
Our study constructed a potential circRNA–miRNA–mRNA network in ESCC based on the integration of microarray datasets and bioinformatics analysis. This regulatory network suggests that circRNAs may be involved in the cancer-related signaling pathways through functioning as miRNA sponges. These findings will serve as a basis for the diagnostic and therapeutic application of circRNAs in ESCC. Further research is needed to evaluate the potential diagnostic value of circulating circRNAs in ESCC and further reveal its underlying mechanism.
Data Availability Statement
The data included in our study can be found in the Gene Expression Omnibus (GEO) repository by the GEO accession number GSE112496.
Ethics Statement
The studies involving human participants were reviewed and approved by the Ethics Committee of Capital Medical University (No. 2017SY22, Beijing, China). The patients/participants provided their written informed consent to participate in this study.
Author Contributions
FL conceived and designed the study, reviewed and revised the article, and made the decision to submit for publication. YShe, XR, ZZ, and RN collected the data. YShe, YSha, and CN analyzed the data. YShe, FL, and XG drafted the article. All authors have read the article and approved the submitted version.
Funding
This work was supported by grants from the National Natural Science Foundation of China (81874277 and 81473056).
Conflict of Interest
The authors declare that the research was conducted in the absence of any commercial or financial relationships that could be construed as a potential conflict of interest.
Supplementary Material
The Supplementary Material for this article can be found online at: https://www.frontiersin.org/articles/10.3389/fgene.2021.580390/full#supplementary-material
Supplementary Figure 1 | Box plots for miRNA and gene expression datasets after normalization.
Supplementary Figure 2 | Venn diagrams of DEmiRs and DEGs from metaMA analysis. Different colors represent the different datasets. The crossed areas indicate the overlapping molecules. The circles in the Venn diagram represent each individual dataset and combined datasets for metaMA analysis. The values in the dataset circles show the numbers of DEmiRs and DEGs identified from each individual dataset and combined metaMA analysis. (A) Identified DEmiRs from the GEO datasets: GSE59973, GSE97049, GSE114110, and GSE145198. (B) Identified DEGs from the GEO datasets: GSE29001, GSE20347, GSE38129, and GSE23400. DEmiRs, differentially expressed microRNAs; DEGs, differentially expressed genes; GEO, Gene Expression Omnibus.
Supplementary Table 1 | Detailed information of the microarray datasets from GEO database.
Supplementary Table 2 | Differentially expressed miRNAs identified by metaMA and RankProd analysis.
Supplementary Table 3 | Differentially expressed genes identified by metaMA and RankProd analysis.
Supplementary Table 4 | Interactions of circRNA–miRNA–mRNA network.
Supplementary Table 5 | Enrichment analyses results of the DEGs from the network.
Footnotes
- ^ http://www.r-project.org/
- ^ https://www.ncbi.nlm.nih.gov/geo/info/linking.html
- ^ http://www.rna-society.org/rnainter/
- ^ http://www.cytoscape.org/
- ^ https://metascape.org/
- ^ https://string-db.org/
- ^ http://mircancer.ecu.edu/
- ^ https://www.picb.ac.cn/dbDEMC/index.html
- ^ http://xena.ucsc.edu/
- ^ http://gepia.cancer-pku.cn/
References
Bray, F., Ferlay, J., Soerjomataram, I., Siegel, R. L., Torre, L. A., and Jemal, A. (2018). Global cancer statistics 2018: GLOBOCAN estimates of incidence and mortality worldwide for 36 cancers in 185 countries. CA Cancer J. Clin. 68, 394–424. doi: 10.3322/caac.21492
Carratore, F., Jankevics, A., Eisinga, R., Heskes, T., Hong, F., and Breitling, R. (2017). RankProd 2.0: a refactored bioconductor package for detecting differentially expressed features in molecular profiling datasets. Bioinformatics 33, 2774–2775. doi: 10.1093/bioinformatics/btx292
Chen, W., Zheng, R., Baade, P. D., Zhang, S., Zeng, H., Bray, F., et al. (2016). Cancer statistics in China, 2015. CA Cancer J. Clin. 66, 115–132. doi: 10.3322/caac.21338
Cheng, C., Mao, Q., Shi, M., Lu, H., Shen, B., and Xiao, T. et al. (2020). miR-125b prevent the progression of esophageal squamous cell carcinoma through the p38-MAPK signaling pathway. J. Gastrointest. Oncol. 11, 1113–1122. doi: 10.21037/jgo-20-546
Fan, L., Cao, Q., Liu, J., Zhang, J., and Li, B. (2019). Circular RNA profiling and its potential for esophageal squamous cell cancer diagnosis and prognosis. Mol. Cancer 18:16. doi: 10.1186/s12943-018-0936-4
Hu, X., Wu, D., He, X., Zhao, H., He, Z., Lin, J., et al. (2019). circGSK3β promotes metastasis in esophageal squamous cell carcinoma by augmenting β-catenin signaling. Mol. Cancer 18, 160–160. doi: 10.1186/s12943-019-1095-y
Huang, F., Chen, H., Zhu, X., Gong, T., Li, X., Hankey, W., et al. (2020). The oncogenomic function of androgen receptor in esophageal squamous cell carcinoma is directed by GATA3. Cell Res. Preprint. doi: 10.1038/s41422-020-00428-y
Jeck, W. R., Sorrentino, J. A., Wang, K., Slevin, M. K., Burd, C. E., Liu, J., et al. (2013). Circular RNAs are abundant, conserved, and associated with ALU repeats. RNA 19, 141–157. doi: 10.1261/rna.035667.112
Kodama, T., Koma, Y., Arai, N., Kido, A., Urakawa, N., Nishio, M., et al. (2020). CCL3-CCR5 axis contributes to progression of esophageal squamous cell carcinoma by promoting cell migration and invasion via Akt and ERK pathways. Lab. Invest. 100, 1140–1157. doi: 10.1038/s41374-020-0441-4
Kristensen, L. S., Hansen, T. B., Venø, M. T., and Kjems, J. (2018). Circular RNAs in cancer: opportunities and challenges in the field. Oncogene 37, 555–565. doi: 10.1038/onc.2017.361
Li, F., Zhang, L., Li, W., Deng, J., Zheng, J., An, M., et al. (2015a). Circular RNA ITCH has inhibitory effect on ESCC by suppressing the Wnt/β-catenin pathway. Oncotarget 6:3469. doi: 10.18632/oncotarget.3469
Li, M., He, X.-Y., Zhang, Z.-M., Li, S., Ren, L.-H., Cao, R.-S., et al. (2015b). MicroRNA-1290 promotes esophageal squamous cell carcinoma cell proliferation and metastasis. World J. Gastroenterol. 21, 3245–3255. doi: 10.3748/wjg.v21.i11.3245
Lin, Y., Liu, T., Cui, T., Wang, Z., Zhang, Y., Tan, P., et al. (2020). RNAInter in 2020: RNA interactome repository with increased coverage and annotation. Nucleic Acids Res. 48, D189–D197. doi: 10.1093/nar/gkz804
Lu, M., Zhang, Q., Deng, M., Miao, J., Guo, Y., Gao, W., et al. (2008). An analysis of human microRNA and disease associations. PLoS One 3:3420–3420e. doi: 10.1371/journal.pone.0003420
Lu, Y.-F., Yu, J.-R., Yang, Z., Zhu, G.-X., Gao, P., Wang, H., et al. (2018). Promoter hypomethylation mediated upregulation of MicroRNA-10b-3p targets FOXO3 to promote the progression of esophageal squamous cell carcinoma (ESCC). J. Exp. Clin. Cancer Res. 37:301. doi: 10.1186/s13046-018-0966-1
Mao, Y., Liu, J., Zhang, D., and Li, B. (2015). MiR-1290 promotes cancer progression by targeting nuclear factor I/X(NFIX) in esophageal squamous cell carcinoma (ESCC). Biomed. Pharmacother. 76, 82–93. doi: 10.1016/j.biopha.2015.10.005
Marot, G., Foulley, J.-L., Mayer, C.-D., and Jaffrézic, F. (2009). Moderated effect size and P-value combinations for microarray meta-analyses. Bioinformatics 25, 2692–2699. doi: 10.1093/bioinformatics/btp444
Mei, L., Qiu, Y., Huang, M., Wang, W., Bai, J., and Shi, Z. (2017). MiR-99a suppresses proliferation, migration and invasion of esophageal squamous cell carcinoma cells through inhibiting the IGF1R signaling pathway. Cancer Biomark. 20, 527–537. doi: 10.3233/CBM-170345
Myatt, S. S., and Lam, E. W. F. (2007). The emerging roles of forkhead box (Fox) proteins in cancer. Nat. Rev. Cancer 7, 847–859. doi: 10.1038/nrc2223
Niu, C., Zhao, L., Guo, X., Shen, Y., Shao, Y., and Liu, F. (2019). Diagnostic Accuracy of circRNAs in Esophageal Cancer: A Meta-Analysis. Dis. Markers 2019, 9673129–9673129. doi: 10.1155/2019/9673129
Noorolyai, S., Shajari, N., Baghbani, E., Sadreddini, S., and Baradaran, B. (2019). The relation between PI3K/AKT signalling pathway and cancer. Gene 698, 120–128. doi: 10.1016/j.gene.2019.02.076
Qiu, D., Zhu, Y., and Cong, Z. (2020). YAP Triggers Bladder Cancer Proliferation by Affecting the MAPK Pathway. Cancer Manag. Res. 12, 12205–12214. doi: 10.2147/CMAR.S273442
Qu, S., Liu, Z., Yang, X., Zhou, J., Yu, H., Zhang, R., et al. (2017). The emerging functions and roles of circular RNAs in cancer. Cancer Lett. 414:22. doi: 10.1016/j.canlet.2017.11.022
Rong, J., Wang, Q., Zhang, Y., Zhu, D., Sun, H., Tang, W., et al. (2018). Circ-DLG1 promotes the proliferation of esophageal squamous cell carcinoma. OncoTargets Ther. 11, 6723–6730. doi: 10.2147/OTT.S175826
Sang, M., Meng, L., Sang, Y., Liu, S., Ding, P., Ju, Y., et al. (2018). Circular RNA ciRS-7 accelerates ESCC progression through acting as a miR-876-5p sponge to enhance MAGE-A family expression. Cancer Lett. 426:49. doi: 10.1016/j.canlet.2018.03.049
Stelzer, G., Rosen, N., Plaschkes, I., Zimmerman, S., Twik, M., Fishilevich, S., et al. (2016). The GeneCards Suite: From Gene Data Mining to Disease Genome Sequence Analyses. Curr. Protoc. Bioinformatics 54, 1.30.31–31.30.33. doi: 10.1002/cpbi.5
Sticht, C., De La Torre, C., Parveen, A., and Gretz, N. (2018). miRWalk: An online resource for prediction of microRNA binding sites. PLoS One 13:e0206239. doi: 10.1371/journal.pone.0206239
Su, H., Lin, F., Deng, X., Shen, L., Fang, Y., Fei, Z., et al. (2016). Profiling and bioinformatics analyses reveal differential circular RNA expression in radioresistant esophageal cancer cells. J. Transl. Med. 14:225. doi: 10.1186/s12967-016-0977-7
Sugimura, K., Miyata, H., Tanaka, K., Hamano, R., Takahashi, T., Kurokawa, Y., et al. (2012). Let-7 Expression Is a Significant Determinant of Response to Chemotherapy through the Regulation of IL-6/STAT3 Pathway in Esophageal Squamous Cell Carcinoma. Clin. Cancer Res. 18:5144. doi: 10.1158/1078-0432.CCR-12-0701
Sun, J., Yuan, X., Li, X., Wang, D., Shan, T., Wang, W., et al. (2017). Comparative transcriptome analysis of the global circular RNAs expression profiles between SHEE and SHEEC cell lines. Am. J. Transl. Res. 9, 5169–5179.
van Agthoven, T., van Agthoven, T. L., Dekker, A., van der Spek, P. J., Vreede, L., and Dorssers, L. C. (1998). Identification of BCAR3 by a random search for genes involved in antiestrogen resistance of human breast cancer cells. EMBO J. 17, 2799–2808. doi: 10.1093/emboj/17.10.2799
Vo, J. N., Cieslik, M., Zhang, Y., Shukla, S., Xiao, L., Zhang, Y., et al. (2019). The Landscape of Circular RNA in Cancer. Cell 176, 869.e–881.e. doi: 10.1016/j.cell.2018.12.021
Wang, Q., Zhang, Q., Sun, H., Tang, W., Yang, L., Xu, Z., et al. (2019). Circ-TTC17 Promotes Proliferation and Migration of Esophageal Squamous Cell Carcinoma. Digest. Dis. Sci. 64, 751–758. doi: 10.1007/s10620-018-5382-z
Xia, W., Qiu, M., Chen, R., Wang, S., Leng, X., Wang, J., et al. (2016). Circular RNA has_circ_0067934 is upregulated in esophageal squamous cell carcinoma and promoted proliferation. Sci. Rep. 6:35576. doi: 10.1038/srep35576
Xing, Y., Zha, W.-J., Li, X.-M., Li, H., Gao, F., Ye, T., et al. (2020). Circular RNA circ-Foxo3 inhibits esophageal squamous cell cancer progression via the miR-23a/PTEN axis. J. Cell. Biochem. 121, 2595–2605. doi: 10.1002/jcb.29481
Zeng, H., Chen, W., Zheng, R., Zhang, S., Ji, J. S., Zou, X., et al. (2018). Changing cancer survival in China during 2003–15: a pooled analysis of 17 population-based cancer registries. Lancet Glob. Health 6, 555–567e. doi: 10.1016/S2214-109X(18)30127-X
Keywords: esophageal squamous cell carcinoma, circular RNAs, ceRNA network, microarray, bioinformatics analysis
Citation: Shen Y, Shao Y, Niu C, Ruan X, Zang Z, Nakyeyune R, Guo X and Liu F (2021) Systematic Identification of circRNA–miRNA–mRNA Regulatory Network in Esophageal Squamous Cell Carcinoma. Front. Genet. 12:580390. doi: 10.3389/fgene.2021.580390
Received: 06 July 2020; Accepted: 25 January 2021;
Published: 03 March 2021.
Edited by:
Marcelo R. S. Briones, Federal University of São Paulo, BrazilReviewed by:
Yongyan Wu, First Hospital of Shanxi Medical University, ChinaIsana Veksler-Lublinsky, Ben-Gurion University of the Negev, Israel
Copyright © 2021 Shen, Shao, Niu, Ruan, Zang, Nakyeyune, Guo and Liu. This is an open-access article distributed under the terms of the Creative Commons Attribution License (CC BY). The use, distribution or reproduction in other forums is permitted, provided the original author(s) and the copyright owner(s) are credited and that the original publication in this journal is cited, in accordance with accepted academic practice. No use, distribution or reproduction is permitted which does not comply with these terms.
*Correspondence: Fen Liu, bGl1ZmVuMDVAY2NtdS5lZHUuY24=; bGl1ZmVubWFpbEBzaW5hLmNvbQ==