 Xupeng Zang1,2,3†
 Ting Gu1,2,3†
 Qun Hu1,2,3
 Zhiqian Xu1,2,3Yanshe Xie1,2,3
 Chen Zhou1,2,3Enqin Zheng1,2,3Sixiu Huang1,2,3Zheng Xu1,2,3Fanming Meng4Gengyuan Cai1,2,3
 Zhenfang Wu1,2,3*
 Linjun Hong1,2,3*
- 1National Engineering Research Center for Breeding Swine Industry, College of Animal Science, South China Agricultural University, Guangzhou, China
- 2Guangdong Provincial Key Laboratory of Agro-Animal Genomics and Molecular Breeding, College of Animal Science, South China Agricultural University, Guangzhou, China
- 3Lingnan Guangdong Laboratory of Modern Agriculture, Guangzhou, China
- 4Institute of Animal Science, Guangdong Academy of Agricultural Sciences, Guangzhou, China
Prenatal mortality remains a significant concern to the pig farming industry around the world. Spontaneous fetal loss ranging from 20 to 45% by term occur after fertilization, with most of the loss happening during the implantation period. Since the factors regulating the high mortality rates of early conceptus during implantation phases are poorly understood, we sought to analyze the overall gene expression changes during this period, and identify the molecular mechanisms involved in conceptus development. This work employed Illumina’s next-generation sequencing (RNA-Seq) and quantitative real-time PCR to analyze differentially expressed genes (DEGs). Soft clustering was subsequently used for the cluster analysis of gene expression. We identified 8236 DEGs in porcine conceptus at day 9, 12, and 15 of pregnancy. Annotation analysis of these genes revealed rRNA processing (GO:0006364), cell adhesion (GO:1904874), and heart development (GO:0007507), as the most significantly enriched biological processes at day 9, 12, and 15 of pregnancy, respectively. In addition, we found various genes, such as T-complex 1, RuvB-like AAA ATPase 2, connective tissue growth factor, integrins, interferon gamma, SLA-1, chemokine ligand 9, PAG-2, transforming growth factor beta receptor 1, and Annexin A2, that play essential roles in conceptus morphological development and implantation in pigs. Furthermore, we investigated the function of PAG-2 in vitro and found that PAG-2 can inhibit trophoblast cell proliferation and migration. Our analysis provides a valuable resource for understanding the mechanisms of conceptus development and implantation in pigs.
Introduction
The implantation period is critical for the development of conceptuses during the early stages of pregnancy in swine. Previous studies have reported over 30% prenatal mortality rates of pig conceptus, after ovulation and fertilization, especially at gestation day 11 to 13 (Zavy and Geisert, 1994). Unlike other animals, porcine conceptuses undergo a unique rapid transformation in morphology, between days 10 and 12 of gestation, mainly due to extensive cellular migration and reorganization (Mattson et al., 1990). These transformations are mainly manifested as changes in conceptus size and shape, and range from spherical (3 to 10 mm diameter) to tubular (10 to 50 mm long) to filamentous (>100 mm long; Perry and Rowlands, 1962; Anderson, 1978). At gestation day 15, filamentous conceptuses extend from 800 to 1000 mm in length, and start to attach to the uterine luminal epithelium (Bazer and Johnson, 2014). Elongation in the uterine horns, before conceptus implantation, simultaneously create a larger contact between the conceptus and maternal tissues, which is crucial for subsequent conceptus attachment (Keys et al., 1986; Bazer and Johnson, 2014).
Studies have implicated rapid conceptus elongation in the increase in conceptus mortality, and this follows a specific pattern of gene expression (Niemann and Wrenzycki, 2000). During this period, estrogens synthesized, and released by the conceptus appear and are considered signals for maternal recognition of pregnancy (Flint et al., 1979). Furthermore, many endometrial genes such as progesterone, glucocorticoids, prostaglandins, and interferons, that could affect uterine receptivity to implantation in pigs are stimulated by estrogens (Bazer et al., 2009). Besides, several cytokines, released by the porcine conceptus, have been implicated in the induction of physiological changes to their corresponding receptors thereby playing an important role in regulating cell proliferation, movement, adhesion, as well as establishment of the microenvironment of the uterine cavity immune response and attachment of trophectoderm to the uterine luminal epithelium (Bazer et al., 2009; Geisert et al., 2017). Although some work has been done on this front, dynamic changes during the implantation process are not fully understood necessitating a comprehensive transcriptome analysis.
In this study, we sought to understand the molecular mechanisms of conceptus development and attachment, by analyzing and comparing expression profiles of mRNAs in the porcine conceptuses across different phases of implantation (days 9, 12, and 15) using RNA-Seq technology. We identified differentially expressed genes (DEGs) at the aforementioned time points and performed a functional analysis of these genes using bioinformatic tools. In addition, we substantiated previous findings of the potential importance of PAG-2 for trophoblast cell proliferation and migration. Collectively, these results generate a better understanding of the genetic factors regulating conceptus development during the implantation stages.
Materials and Methods
Animals and Conceptus Collection
This study was approved by the Ethics Committee of the Laboratory Animal Center of South China Agricultural University. Yorkshire sows (parity 2) were obtained from the Wen’s Foodstuffs Group Co., Ltd. (Yunfu, China). The sows were checked for estrus, twice a day, then artificially inseminated with a standard dose of single Yorkshire semen following estrus. The sows were sacrificed on days 9, 12, and 15 of pregnancy (n = 3 sows/day of pregnancy), their uteri immediately removed, and each uterine horn flushed with bacteria-free PBS. The conceptuses were then collected, snap frozen, and stored at −80°C for RNA extraction.
Construction of mRNA Libraries and Sequencing
Total RNA was extracted from each sample using TRIzol Reagent (Invitrogen, Carlsbad, CA, United States) according to the manufacturer’s protocol. The RNA was quantified and qualified using an Agilent 2100 Bioanalyzer (Agilent Technologies, Palo Alto, CA, United States) and NanoDrop (Thermo Fisher Scientific, Wilmington, MA, United States). Then, 1 μg of the total RNA, with a RIN value above 7, was used for the construction of libraries according to the manufacturer’s instructions using the NEBNext® UltraTM Directional RNA Library Prep kit (Illumina®). The Ribo-ZeroTM rRNA Removal Kit (Illumina, San Diego, CA, United States) was used to deplete rRNA from total RNA. The pure RNA was then fragmented and reverse-transcribed, then libraries with different indices were multiplexed and loaded on an Illumina HiSeq 150PE (Anders et al., 2015) instrument according to the manufacturer’s instructions (Illumina, San Diego, CA, United States). Sequencing was performed using the paired-end (PE) configuration on the HiSeq instrument at the GENEWIZ (Suzhou, China) to generate 2 × 150 bp transcripts.
Analysis of RNA-Seq Data
Raw reads were first processed using Cutadapt (v1.3; Martin, 2011) before mapping and assembly. In this step, clean reads were acquired by removing adapter sequences, as well as nucleotides with q-quality scores lower than 20 or bases with N, and reads less than 75 bp after trimming. All subsequent downstream processes were performed using high-quality clean data.
Estimation of Transcript Abundance and Identification of DEGs
Aligned read files were processed by Hisat2 (v2.0.1; Daehwan et al., 2015), which uses fragment per kilobase of exon per million fragments mapped (FPKM) to measure relative abundances of the transcripts. The reference GFF annotation file (Sscrofa10.2, http://may2017.archive.ensembl.org/Sus_scrofa/Info/Index), used in Hisat2, was downloaded from the ENSEMBL database, then StringTie (v1.0.4; Mihaela et al., 2015) was used to first assemble the transcriptome. Cuffmerge (Trapnell et al., 2012) was then adopted to merge all transcripts from different replicas in a group and generate unique transcripts for further downstream differential expression analysis. Sequence information corresponding to these transcripts was obtained using Gffread (Trapnell et al., 2010). Differential gene expression analyses among samples were conducted using the DESeq tool (v1.18.0; Love et al., 2014), which is a model based on the negative binomial distribution. We performed adjustment using the Benjamini and Hochberg (1995)’s approach to control for false discovery rate, with a P < 0.01 and | log2 (fold change) | >1, for the detection of DEGs.
Quantitative Real-Time PCR
We validated the gene expression profiles across the study groups using quantitative real-time PCR (qRT-PCR). Total RNA was first extracted using the RNeasy Plus Micro Kit (Qiagen, Hilden, Germany) according to the manufacturer’s instructions, then one microgram of the RNA was reverse transcribed into cDNA using the PrimeScriptTM RT Master Mix kit (TakaRa, Dalian, China) to generate a template for PCR. qPCR was carried out on the QuantStudio 7 Flex Real-Time PCR System (Applied Biosystems, Foster city, CA, United States) using a PowerUpTM SYBRTM Green Master Mix (Thermo Fisher, United States). The reaction (10 μL) comprised 5 μL of PowerUpTM SYBRTM Green Master Mix, 2 ng/μL of cDNA, and 0.2 μM of each primer and nuclease-free water. Amplification conditions included an initial step at 94°C for 5 min, followed by 40 cycles of 94°C for 30 s, an annealing step of 60°C for 20 s, extension at 72°C for 30 s, and a final extension of 4 min at 72°C. Primers were designed by Oligo 7 (Molecular Biology Insights Inc., Colorado Springs, United States), and their sequence specificities were checked using BLAST (NCBI, Bethesda, United States). A summary of primers and their corresponding annealing temperatures is outlined in Supplementary Table 3. Analysis was performed on three biological replicates for each time-point, with three technical replicates. In addition, GAPDH was used as the internal amplification control.
Analysis of DEGs and Differentially Co-Expressed Genes
Hierarchical cluster analysis was used to assess differential expression among genes across the three stages of pregnancy. Differentially co-expressed genes were obtained from the overlap of DEGs in three stages. To expose the functions of these differentially co-expressed genes, gene ontology (GO) enrichment analysis was performed by the software DAVID (v6.8)1 andKyoto Encyclopedia of Genes and Genomes (KEGG) pathway analysis was executed by the software KOBAS2. Soft clustering, using the Mfuzz package implemented in R (Kumar and Futschik, 2007), was then performed to obtain the DEGs and reveal their expression profiles based on similar expression patterns. Transcript IDs of the DEGs from individual clusters were uploaded onto DAVID (v6.8; see text footnote 1) and used for GO analyses (Dennis et al., 2003). DEGs from various clusters were also screened using the online tool Toppcluster3 for KEGG pathway analysis, with a p-value cutoff of 0.05. Then Cytoscape (v3.7.2)4 was used to visualize the final results (Shannon et al., 2003; Kaimal et al., 2010).
Cell Culture and Transfection
The cell culture was performed as described in our previous studies (Hong et al., 2020). The small interference RNAs (siRNAs) for PAG-2 were from GenePharma (Shanghai, China). Full-length PAG-2 was amplified and inserted into the pcDNA3.1 vector (Invitrogen, Carlsbad, CA, United States) to construct a plasmid and transiently transfected with Lipofectamine 2000 (Invitrogen, Carlsbad, CA, United States) according to the manufacturer’s instructions.
Cell Counting Kit-8 Assay
PTr2 cells were seeded in 96-well plates (10,000 cells/well). After the cells were transfected for 48 h and 72 h, 10 μl of Cell Counting kit-8 (CCK-8) solution was added to the wells. The plates were incubated for 1 h, and the absorbance of each well was collected by a microplate reader (Tecan, Switzerland) at 450 nm.
5-Ethynyl-2’-Deoxyuridine Assay
PTr2 cells were seeded in 24-well plates (50,000 cells/well), and after being cultured overnight, they were transfected with pcDNA3.1(+), pcDNA3.1(+)-PAG-2, siRNA-NC, or siRNA-PAG-2. After transfection for 48 h and 72 h, PTr2 cells were exposed to EdU (BeyoClick, China) for 3 h at 37°C. Subsequently, the cells were fixed in 4% paraformaldehyde for 15 min, were wiped with washing solution, and then permeabilized by adding 0.3% Triton X-100. Next, plates were washed with PBS, 0.3 ml of Click was added and the cells were incubated at room temperature in the dark for 30 min. The nuclear stain DAPI was then added, and a confocal laser scanning microscope (Leica, Germany) was used to photograph and visualize the number of EdU-stained cells.
Wound Healing Assay
PTr2 cells were seeded in 6-well plates and cultivated until they reached confluence. Wounds were generated in the cell monolayer by making a scratch with a sterile pipette tip. Plates were washed three times with PBS, and then added to serum-free medium and cultured in a 37°C 5% CO2 cell incubator. The plates were photographed after 0 and 24 h of cultivation.
Transwell Migration and Invasion Assay
Approximately 60,000 PTr2 cells were suspended in serum-free medium and seeded in the upper chambers with 8 μm (Corning, New York, NY, United States). For this assay, medium containing 10% FBS was added to the lower chambers and incubated for a further 24 h. The non-migrated or non-invaded cells were then wiped with PBS. The cells that had invaded through the membrane to the lower surface were fixed with 4% paraformaldehyde for 10 min and followed by crystal violet staining for 10 min. Then, random fields were photographed and counted by using a light microscope.
Statistical Analysis
GraphPad Prism 8.0 (GraphPad Software, San Diego, CA, United States) was used to statistically analyze the transfection efficiency of PAG-2 overexpression or inhibition in PTr2 cells, the cell viability through CCK-8 assays, the cell proliferation rate of the 5-Ethynyl-2’-Deoxyuridine (EDU) staining assays, and the cell migration rate of the wound healing and Transwell assays. The values are presented as the mean ± standard error of mean (SEM). Where applicable, student’s t-tests were performed to test the statistical significance of the data. P < 0.05 was considered to be statistically significant, and P < 0.01 was considered to be extremely significant.
Results
RNA-Seq Data for the Porcine Conceptus During Days 9, 12, and 15 of Pregnancy
We generated RNA sequence data at 9, 12, and 15 of pregnancy and performed a transcriptomics analysis to comprehensively understand changes in expression levels across these time points. Summarily, we obtained 79,500,512 to 112,359,702 quality-filtered reads from 79,756,340 and 112,640,612 raw reads per sample, respectively (Table 1). We used Hisat2 (v2.0.1) to index reference genome sequences, and aligned 85.3076–86.2598% of reads to genome sequences at ENSEMBL, whereof 74.602–76.4987% of reads had a unique genomic site. Thereafter, a total of 547,885 transcripts were assembled using Cuffcompare.
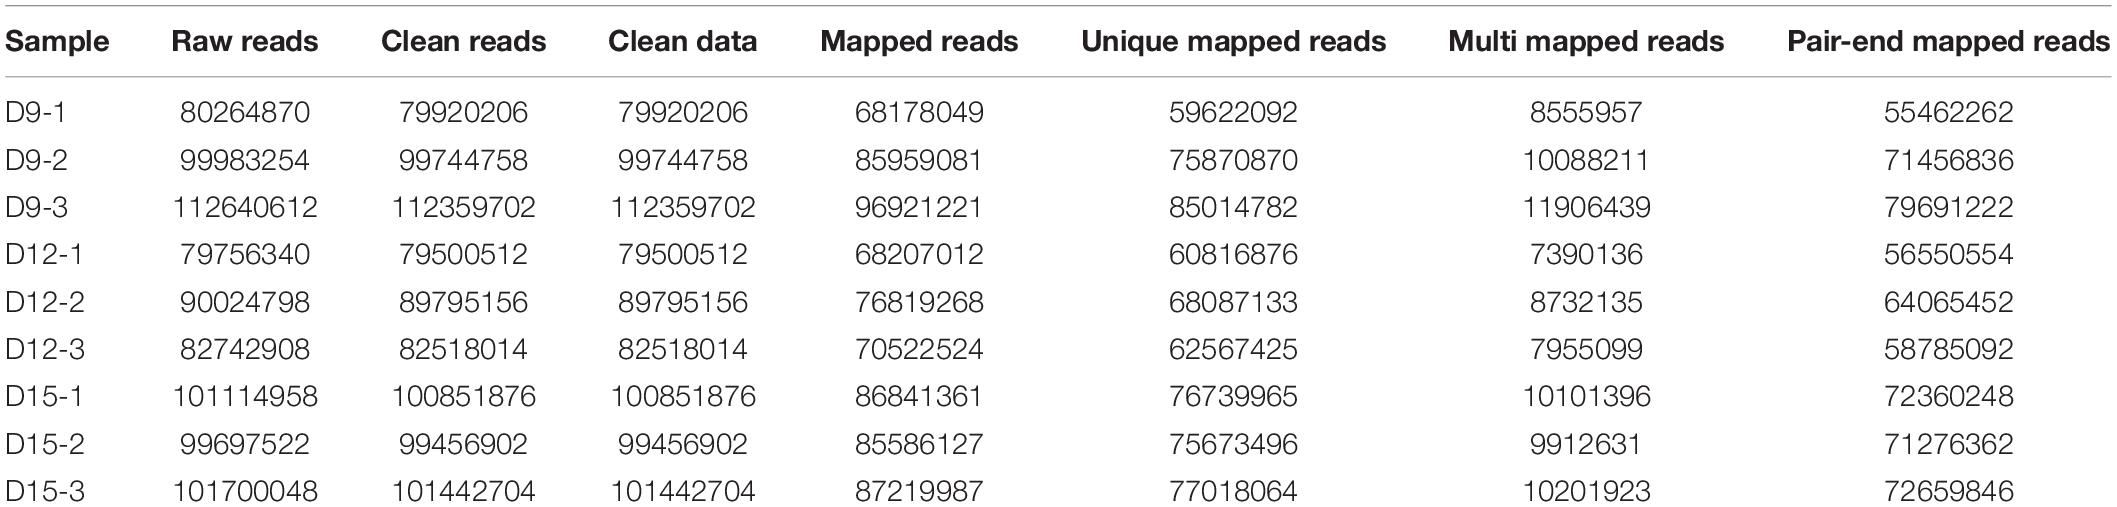
Table 1. Summary of RNA-Seq alignment.
Distribution and identity of the three triplicate samples were analyzed by correlation, with Pearson’s correlation coefficient among transcriptomes across porcine conceptus phases on days 9, 12, and 15 revealing a good correlation of biological replicates (Figure 1). A summary of Pearson’s correlation coefficients is shown in Supplementary Table 1.
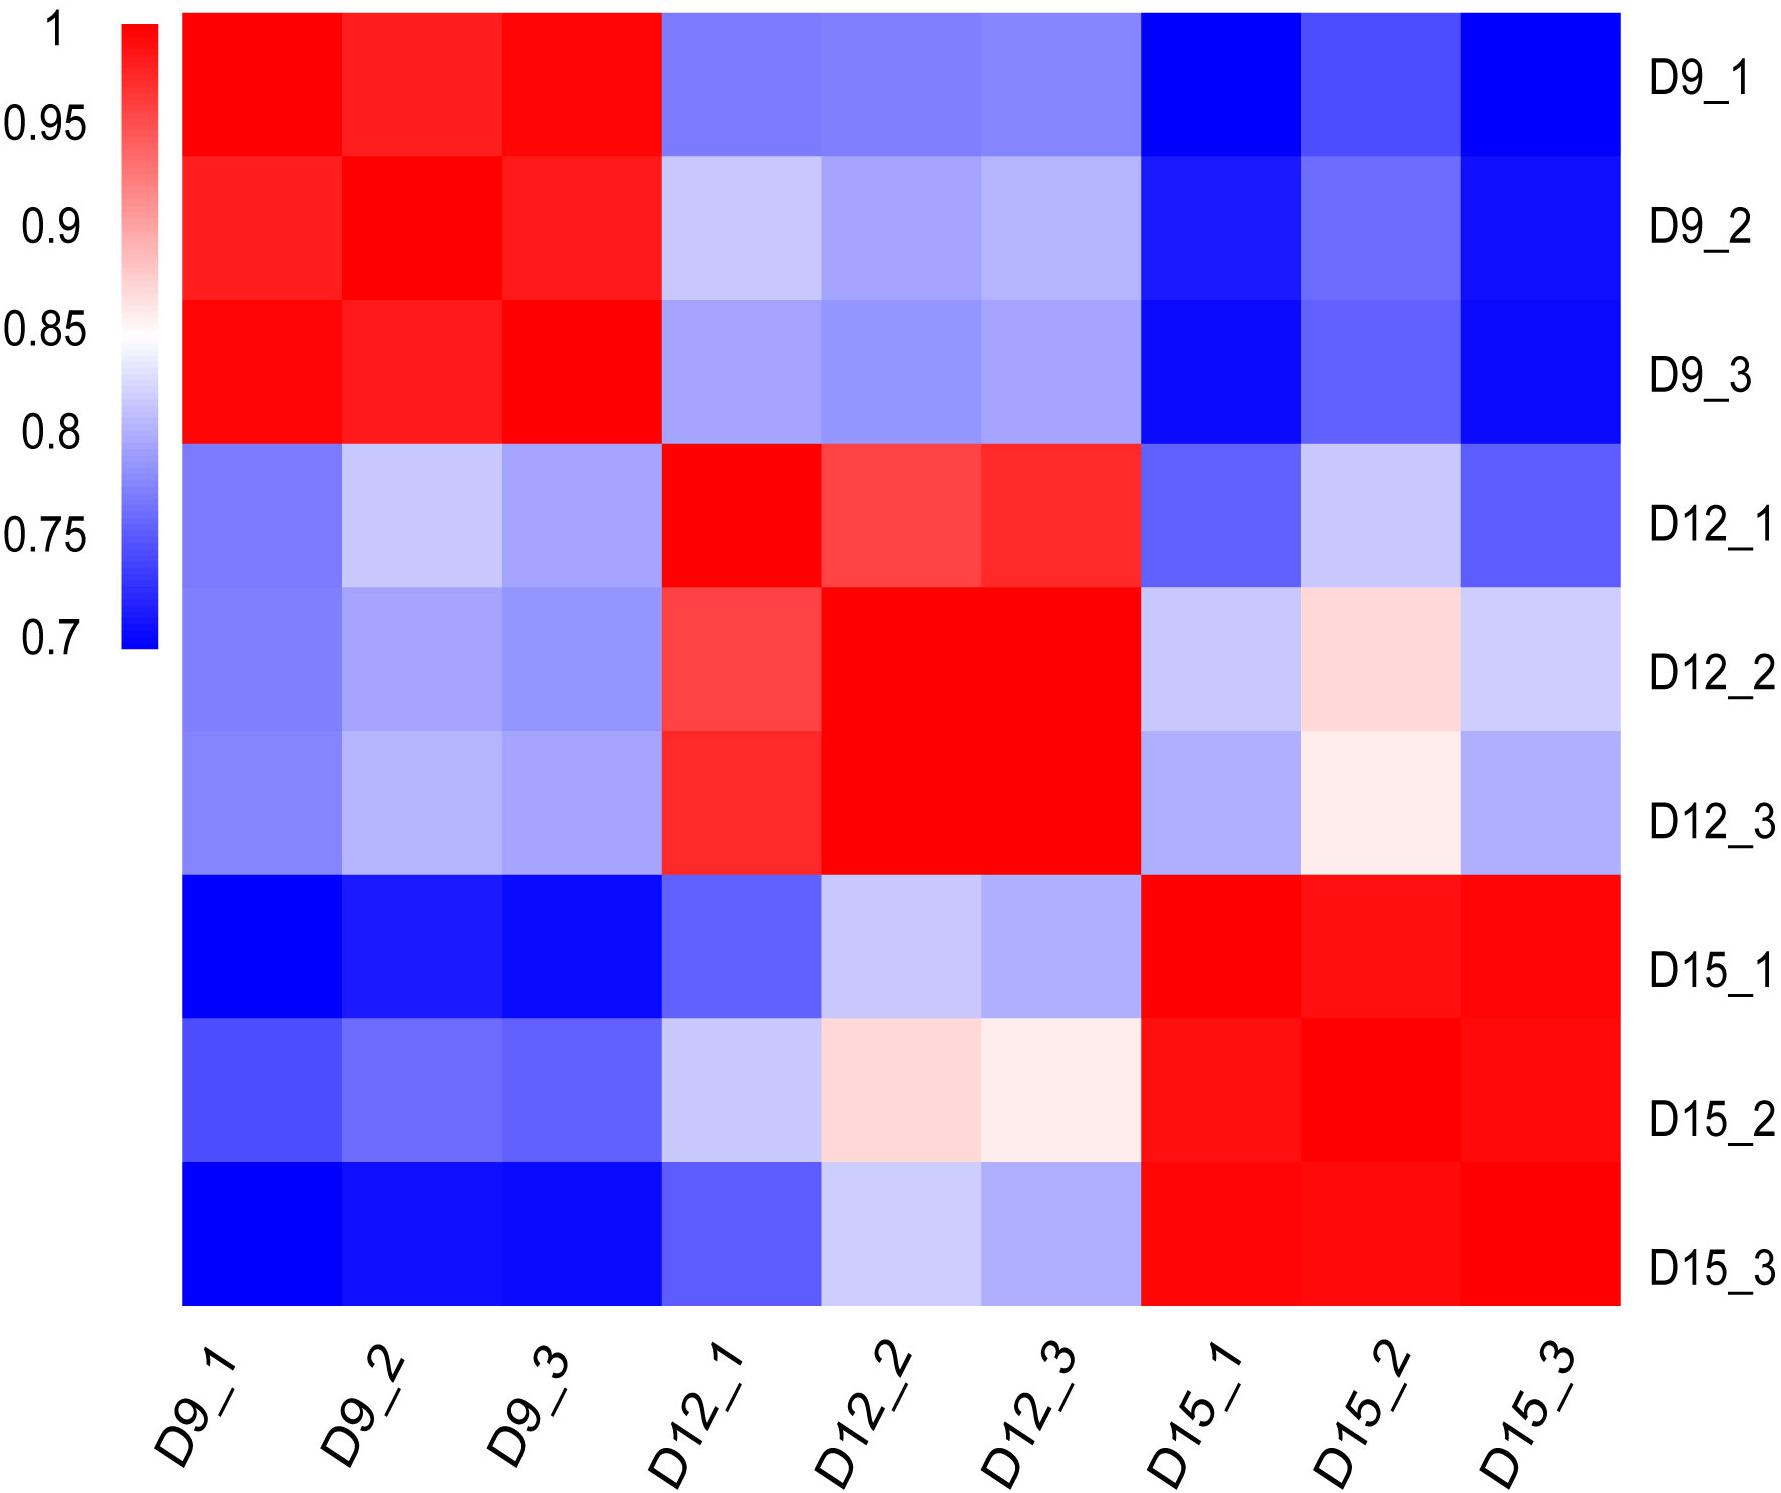
Figure 1. Matrix of Pearson’s correlation coefficient among transcriptomes across three different porcine conceptus phases on days 9, 12, and 15 of pregnancy. The color scale is from 0.7 (blue) to 1.0 (red). Red represents high correlation between biological repeats.
DEGs Across the Phases During the Implantation Periods
We generated 848 million PE reads of 150 bp in length. Thus, the depth of our sequencing was adequate for detecting transcripts expressed at low levels. To identify the DEGs across different implantation phases, we performed comparisons between transcripts at days 9 and 12, 9 and 15, and 12 and 15. The analysis revealed a total number of 4881 DEGs between days 9 and 12, and 2228 between days 12 and 15, and 7137 between days 9 and 15 (FDR < 0.01, log2 fold change > 1; Figure 2A). The total number of DEGs across all comparisons (8236) was used for analysis of normalized expression profiles across the three developmental phases. Hierarchical cluster analysis was used to present an overview of the expression profiles, with all DEGs showing lower or higher expression during the three phases of pregnancy (Figure 2B and Supplementary Table 2). Results of the 9-sample dataset indicated that the gene expression pattern was more similar from days 12 to 15 than days 9 to 12, although the biggest difference in gene expression was observed between days 9 and 15 of pregnancy.
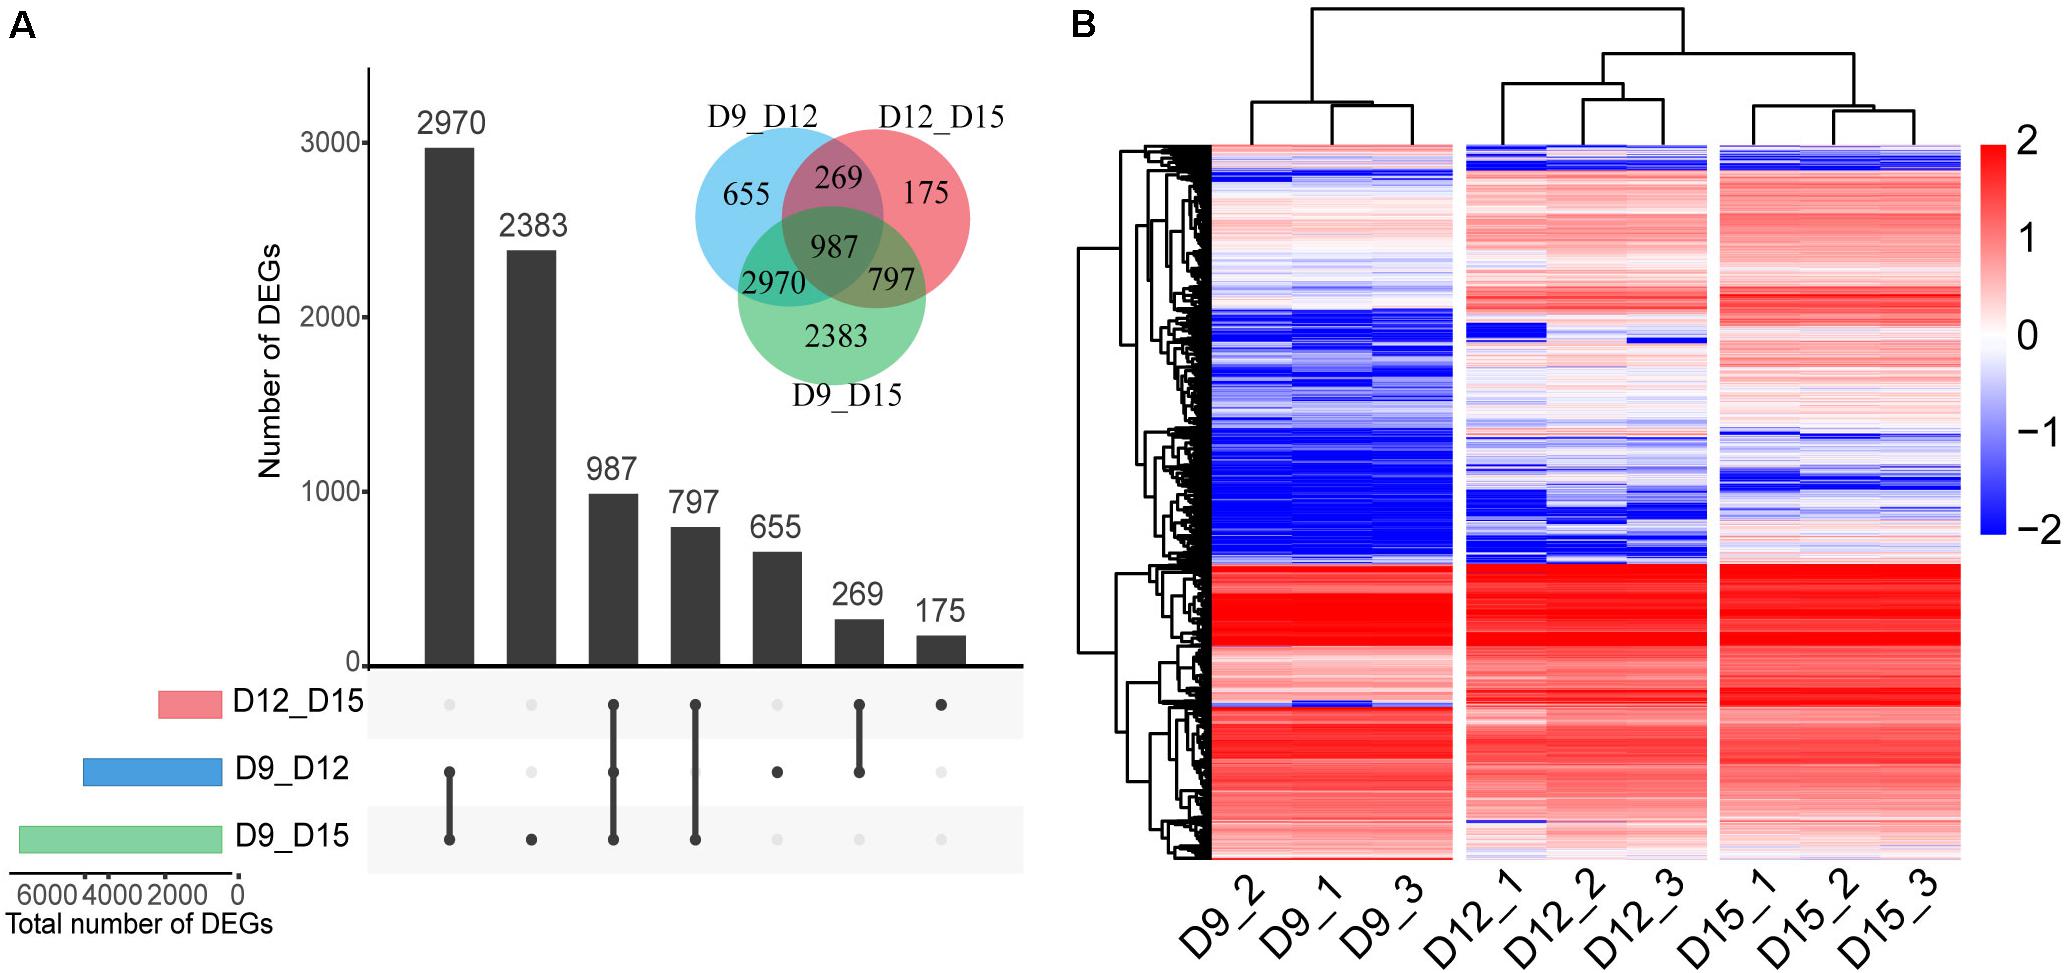
Figure 2. Differentially expressed genes (DEGs) of the porcine conceptus across three periods of pregnancy. Upset plot and Venn diagram illustrating the number of DEGs across the three developmental phases (A). Red, day 12 vs. day 15 of conceptus; blue, day 9 vs. day 12 of conceptus; and green, day 9 vs. day 15 of conceptus. Hierarchical cluster analysis of DEGs identified for three phases (B). The color scale is from -2.0 (blue, lower gene expression) to 2.0 (red, higher gene expression). Each row represents one gene, each column represents one sample.
Validation of RNA Sequence Data
To validate the RNA-seq data we performed a qRT-PCR analysis targeting eight genes, RBP4, VIM, PSAP, IL1B2, interferon gamma (IFNG), SFN, PLPP1, and CA2. These were randomly selected because they were significantly expressed in at least one contrast. Results showed good concordance in expression patterns determined by qRT-PCR and RNA-seq (Figure 3 and Supplementary Table 4).
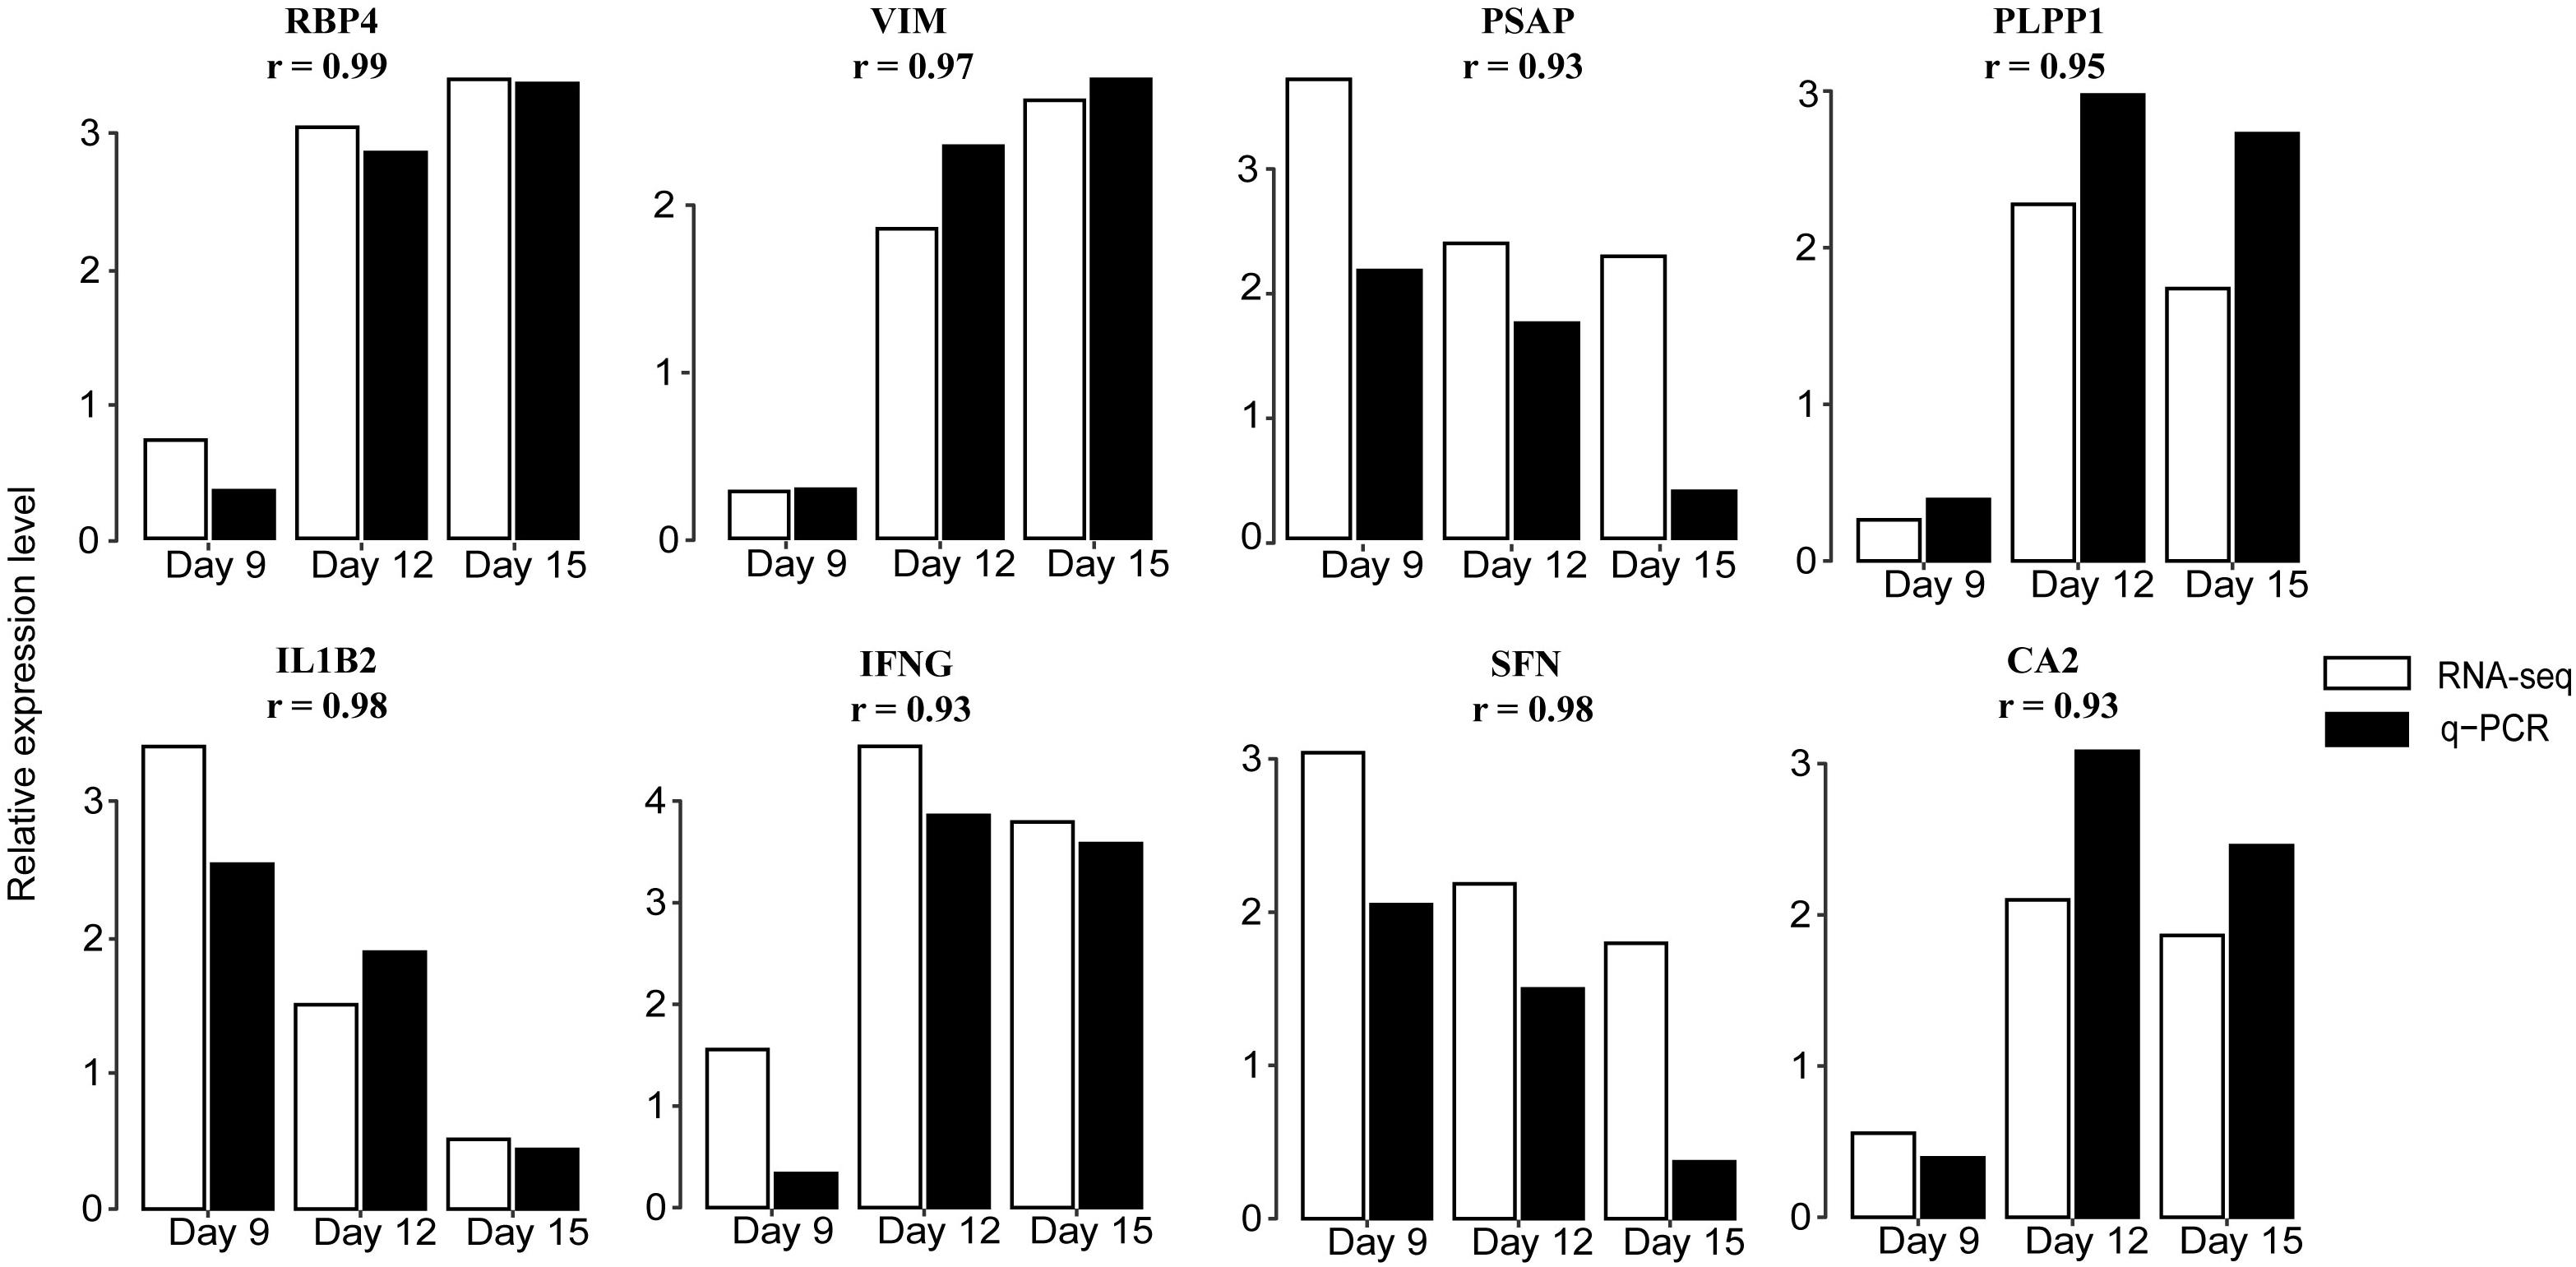
Figure 3. Validation of DEGs by qRT-PCR. Expression patterns of eight DEGs on days 9, 12, and 15 of pregnancy were determined by qRT-PCR and compared with profiles obtained by RNA-seq. White bars indicate RNA-seq expression level; black indicate q-PCR expression level. The correlation coefficient r represents a correlation between q-PCR and RNA-seq-based gene expression. Detailed results are shown in Supplementary Table 4. RBP4: retinol binding protein 4; VIM: vimentin; PSAP: prosaposin; PLPP1: phospholipid phosphatase 1; IL1B2: interleukin 1, beta 2; IFNG: interferon gamma; SFN: stratifin; and CA2: carbonic anhydrase 2.
GO and KEGG Enrichment Analysis of Differentially Co-Expressed Genes
To understand the function of 987 differentially co-expressed genes in the three stages, we performed GO enrichment and KEGG pathways analyses. The top 10 enriched GO terms in biological process, cellular component, and molecular function are listed in Figure 4A, while all the GO enrichment terms are shown in Supplementary Table 5. Notably, these biological processes were mostly associated with angiogenesis, such as regulation of blood pressure (GO:0008217), blood coagulation (GO:0007596), negative regulation of angiogenesis (GO:0016525), and angiogenesis (GO:0001525), which indicates the violent development of the vascular system during conceptus development at these stages. KEGG pathway analysis showed that several pathways were related to signal transduction, such as the MAPK signaling pathway, PI3K-Akt signaling pathway, HIF-1 signaling pathway, and Ras signaling pathway (Figure 4B and Supplementary Table 5).
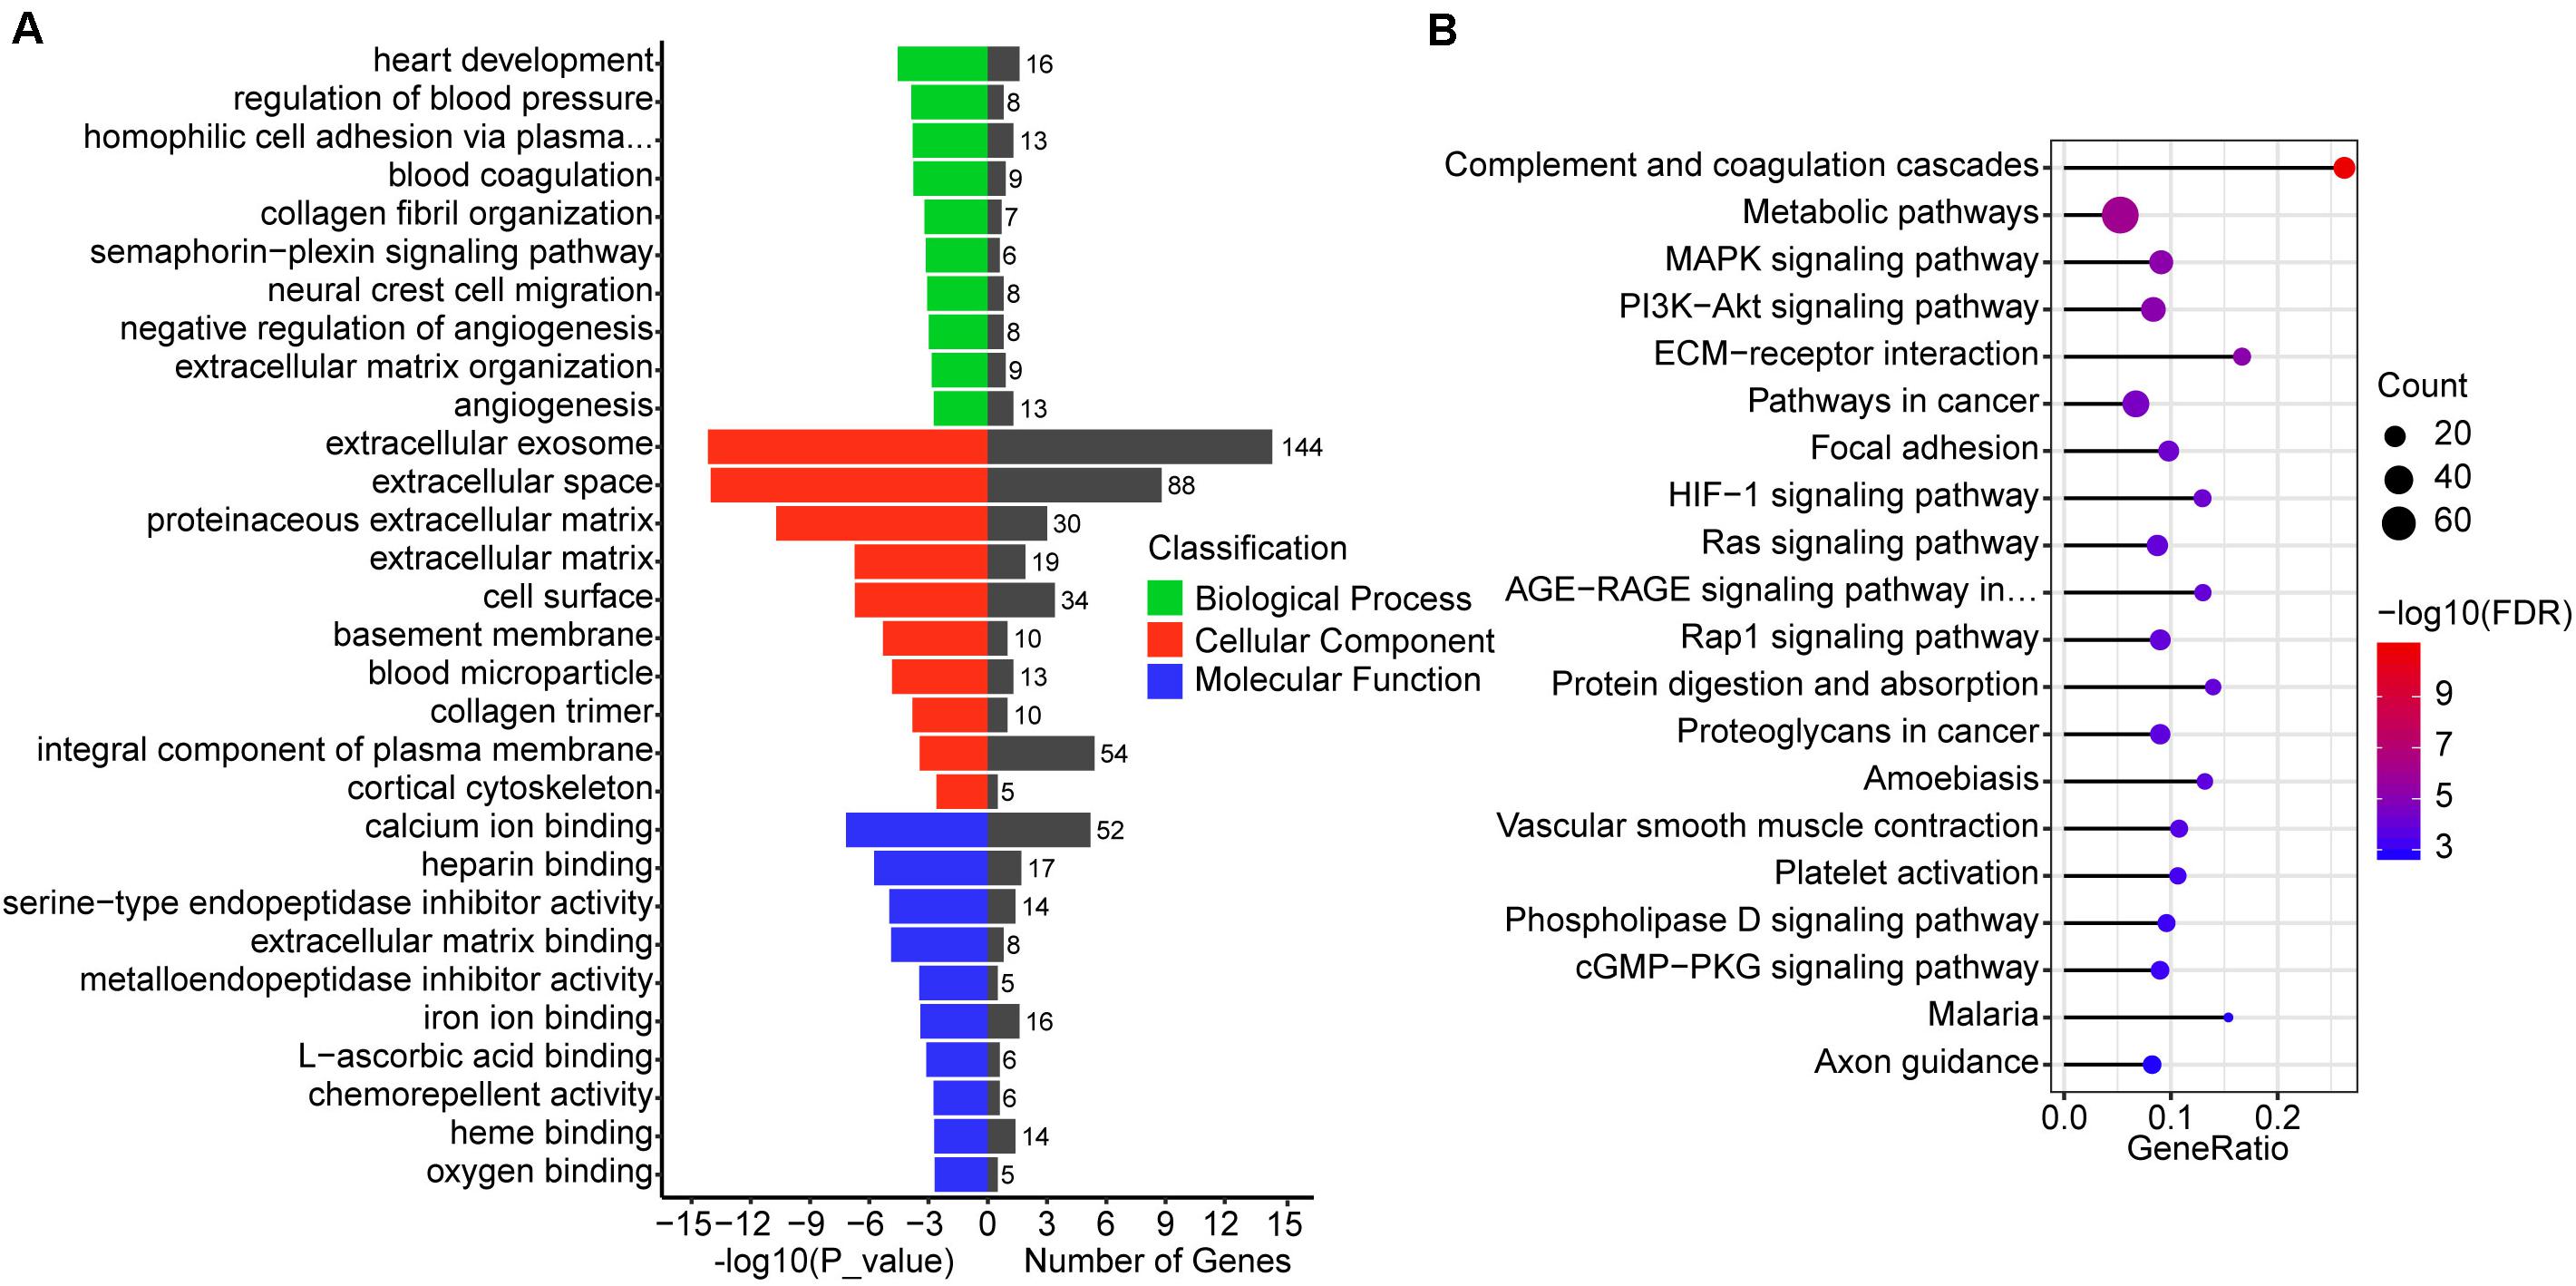
Figure 4. GO and KEGG enrichment analysis of differentially co-expressed genes. (A) GO enrichment analysis of differentially co-expressed genes, the terms include biological process, cellular component, and molecular function. (B) Top 20 KEGG pathways of differentially co-expressed genes. The size of the circle represents the number of genes enriched in the pathway and red represents more significant enrichment.
Relationship Between Gene Clusters and Biological Processes and Pathways
One of the aims of this study was to analyze the relationship between morphological and potential molecular changes during the implantation development of pig conceptus. Consequently, we used the soft partitioning clustering method of the Mfuzz package to generate three visible clusters of genes that were distributed across the three implantation stages according to their analogical expressions pattern. The first cluster showed the highest expression levels on day 9, although this was rapidly down-regulated. The second cluster exhibited the highest expression levels on day 12, whereas the last cluster showed specific highest expression levels on day 15 (Figure 5). Each gene cluster was then subjected to GO enrichment analysis (only GO terms related to biological processes were considered) to determine whether identifiable biological changes were significantly related to expression patterns. A detailed outline of the results is presented in Supplementary Table 6. Summarily, genes from the first cluster were strongly associated with rRNA processing (GO:0006364), positive regulation of telomerase RNA localization to Cajal body (GO:1904874), translation (GO:0006412), ATP hydrolysis-coupled proton transport (GO:0015991), and positive regulation of protein localization to Cajal body (GO:1904871). Representative genes in these biological processes comprised T-complex 1 (TCP1), RuvB-like AAA ATPase 2 (RUVBL2), and solute carrier family 25 member 22 (SLC25A22). On the other hand, genes in the second cluster were strongly associated with cell adhesion (GO:0007155), negative regulation of gene expression (GO:0010629), antigen processing and presentation (GO:0019882) as well as immune response (GO:0006955). Lastly, genes in the third cluster were associated with heart development (GO:0007507), homophilic cell adhesion via plasma membrane adhesion molecules (GO:0007156), and collagen fibril organization (GO:0030199). Additionally, KEGG pathway analysis of the identified DEGs using ToppCluster revealed that the PPAR signaling pathway, complement and coagulation cascades, cell adhesion molecules, and the Rap1 signaling pathway among others were significant pathways across the time points (Figure 6 and Supplementary Table 7).
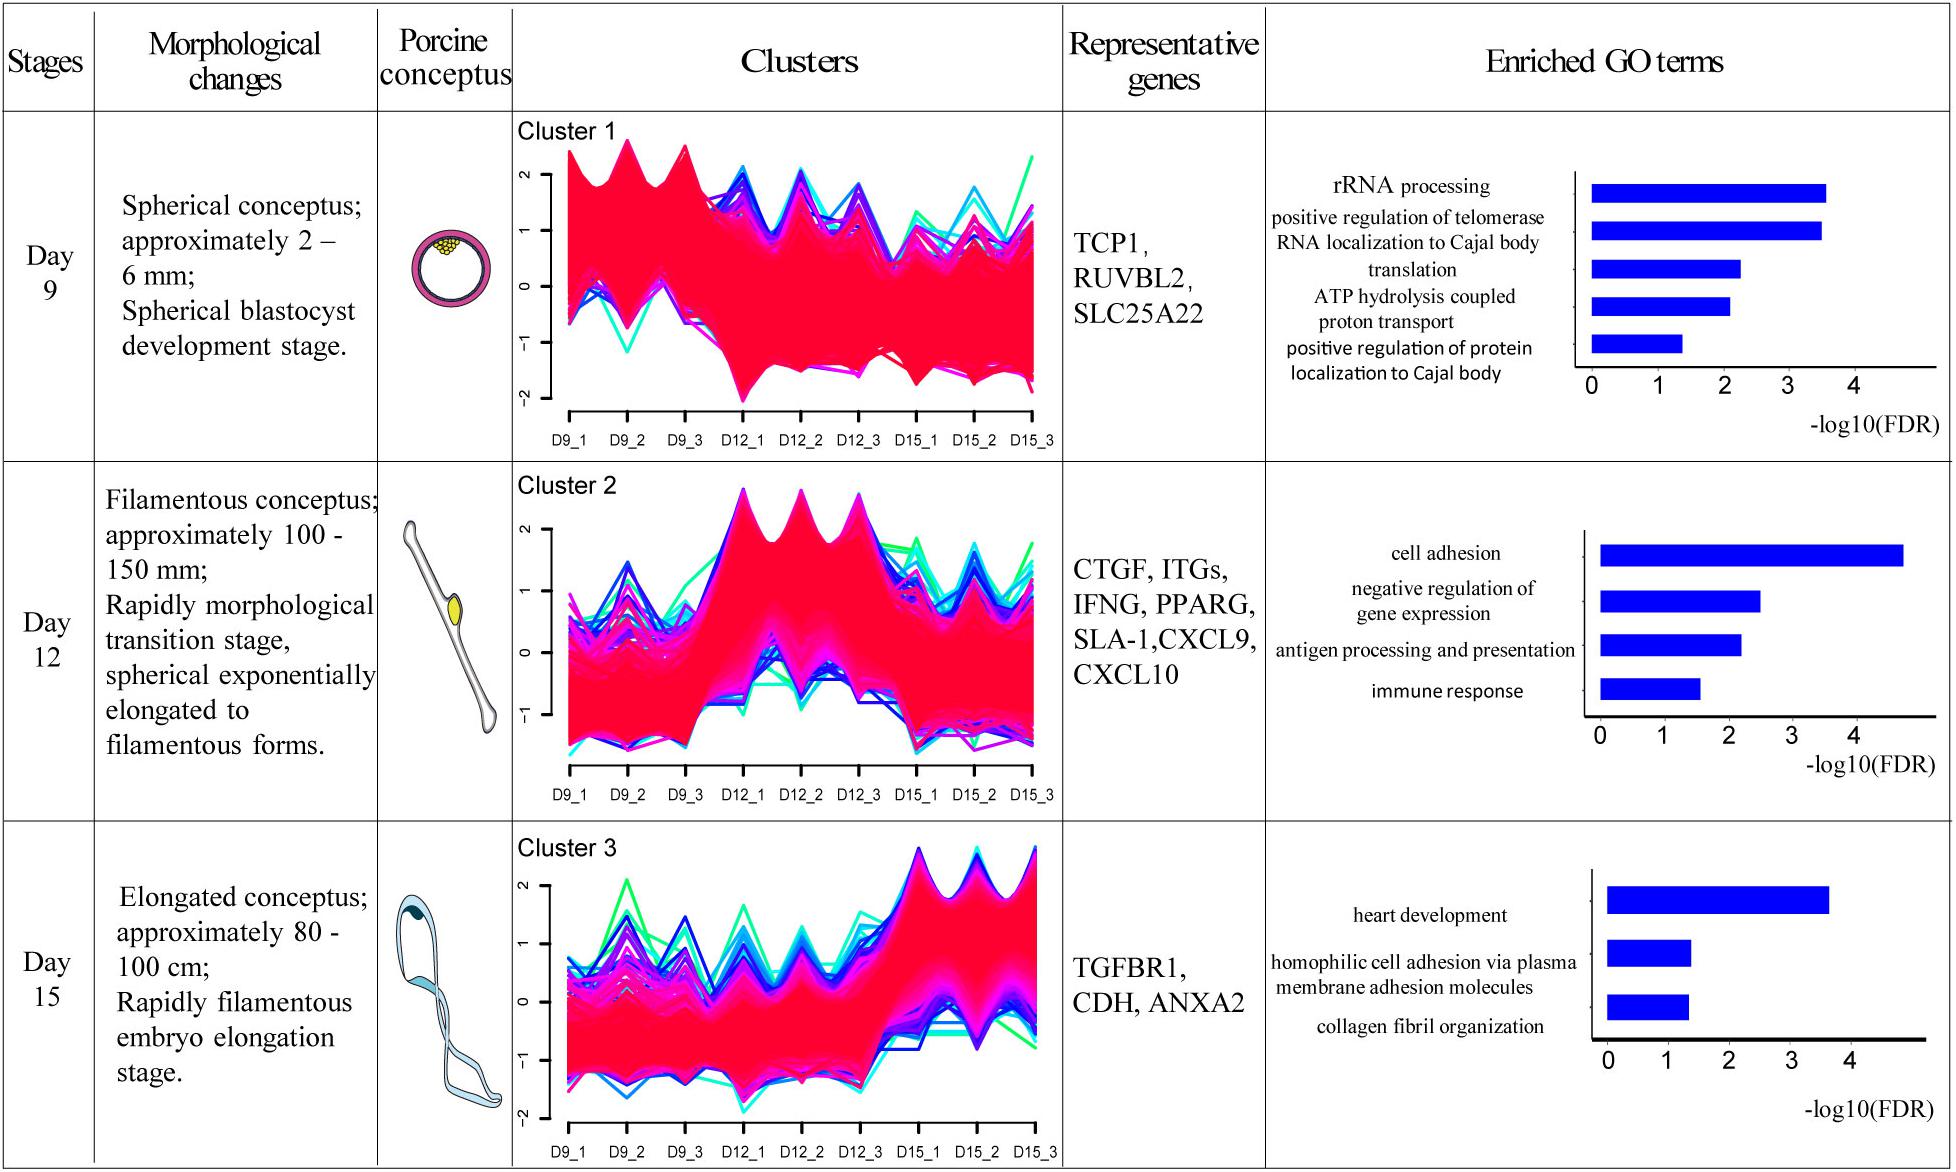
Figure 5. Transcriptome dynamics during porcine conceptus implantation development. The DEGs were clustered into three soft partitioning clusters, with distinct clusters falling into different morphological stages based on expression patterns. GO enrichment was then performed on each cluster of genes and the GO term represented was displayed (FDR < 0.05). Morphological changes briefly described the development of conceptus at this stage. Porcine conceptus represented the pattern diagrams of conceptus. TCP1: T-complex 1; RUVBL2: RuvB-like AAA ATPase 2; SLC25A22: solute carrier family 25 member 22; CTGF: connective tissue growth factor; ITGs: integrins, IFNG: interferon gamma; PPARG: peroxisome proliferator activated receptor gamma; SLA-1: MHC class I antigen 1; CXCL9: chemokine ligand 9; CXCL10: chemokine ligand 10; TGFBR1: transforming growth factor beta receptor 1; CDH: cadherin 11; and ANXA2: Annexin A2.
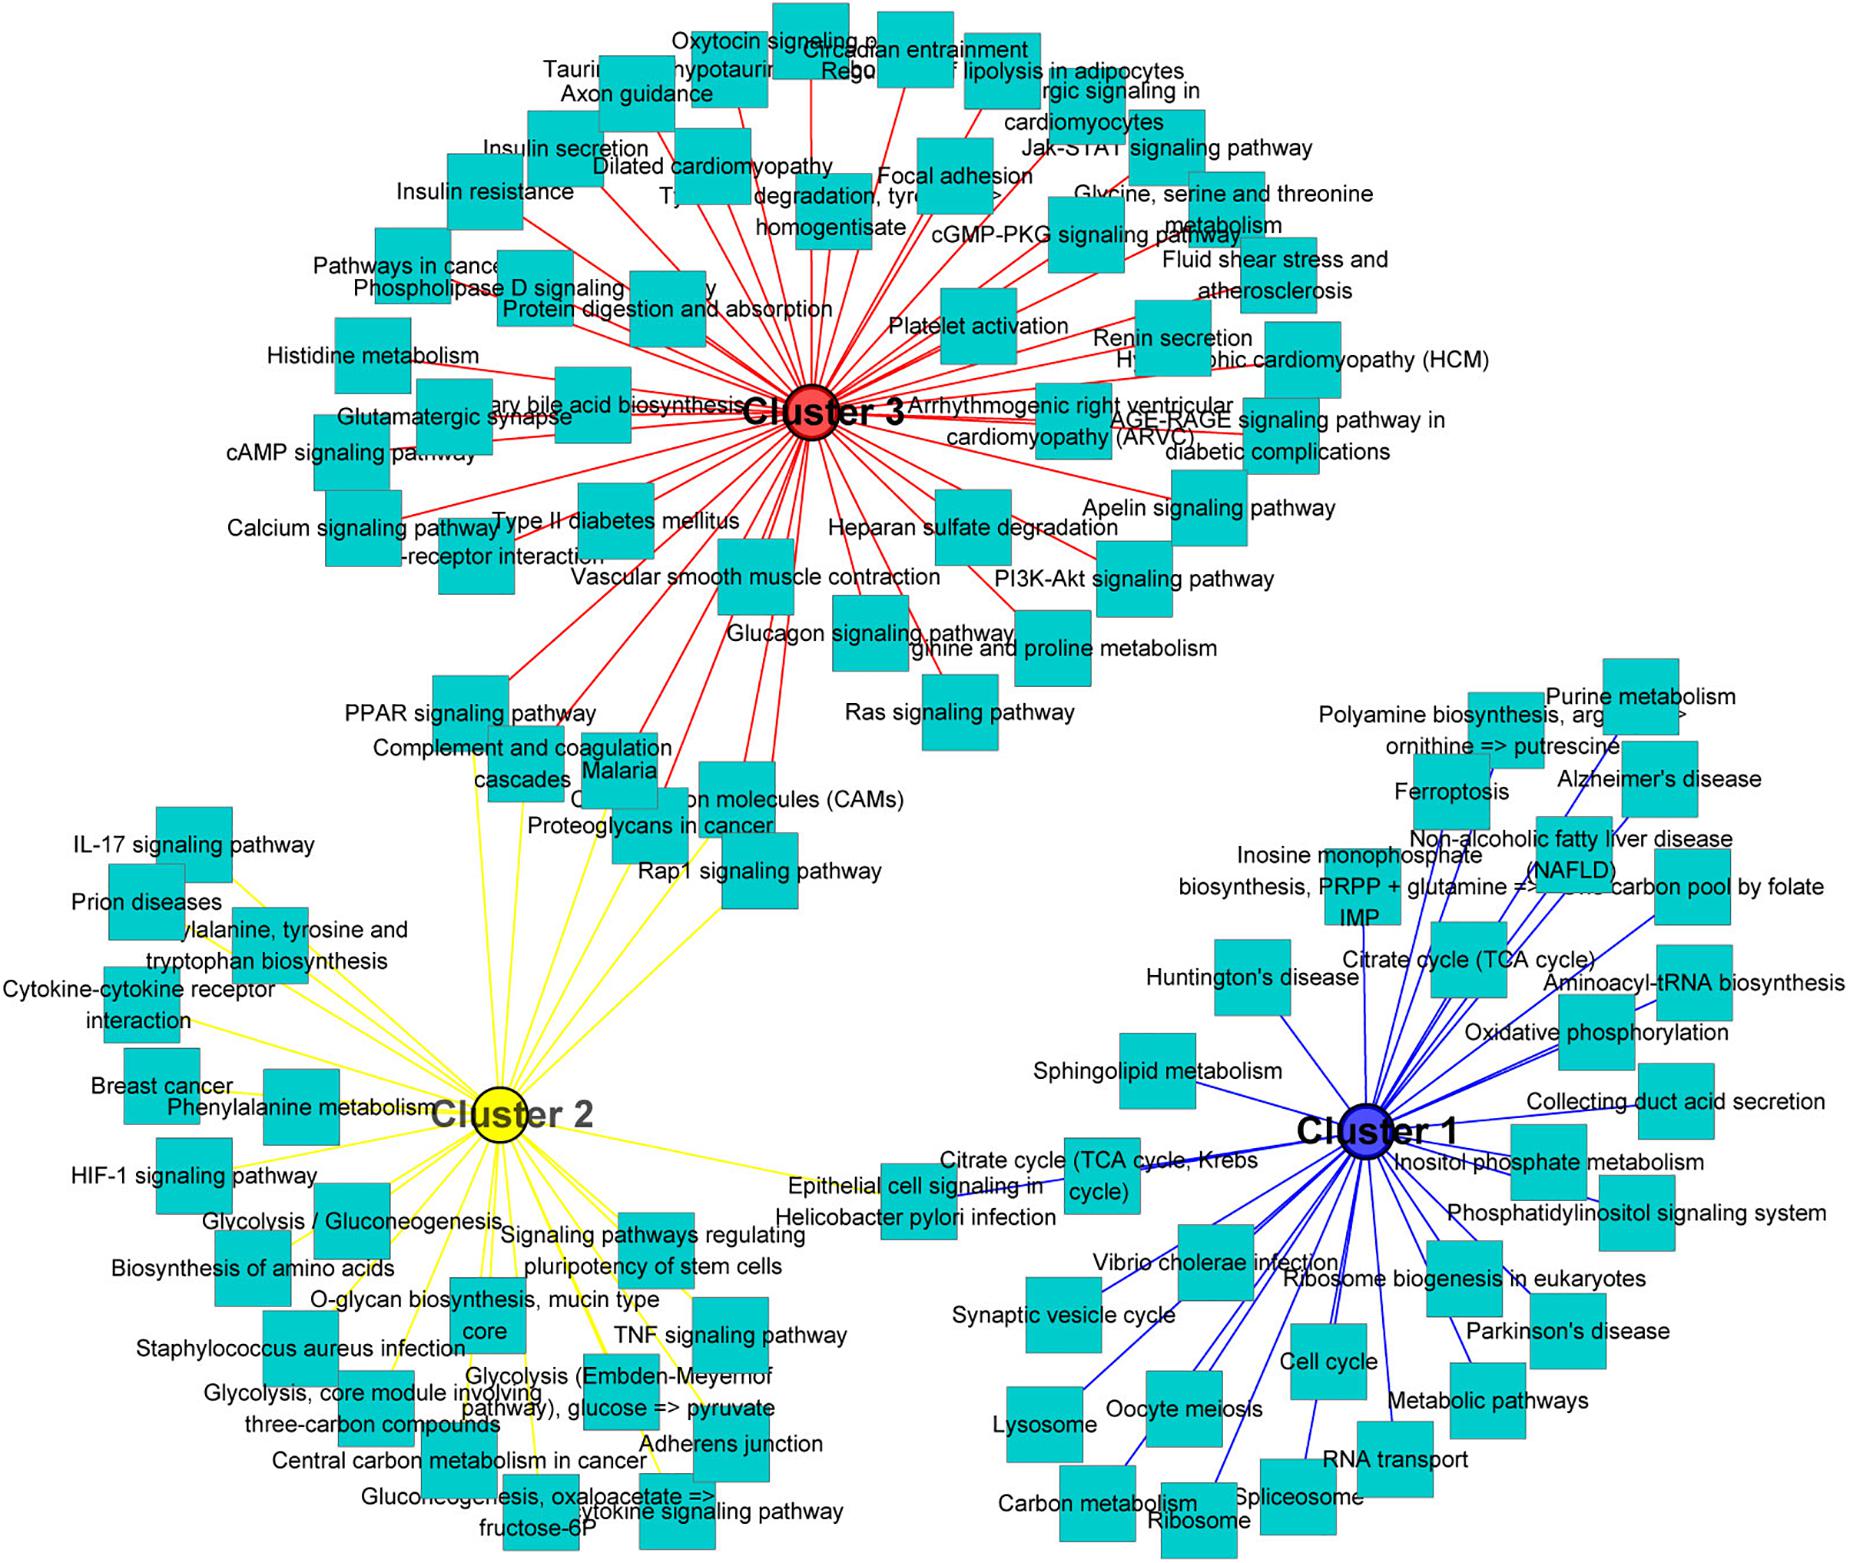
Figure 6. KEGG pathways analysis of gene clusters. All significant differentially expressed genes across the three stages were used as input for the ToppCluster. The database “KEGG pathway” was used for analysis. Then, the data were uploaded in Cytoscape (v3.7.2) to generate the network. Each square node represents a pathway. Each cluster is represented by a different color.
PAG-2 Inhibits Trophoblast Cell Proliferation and Migration
PAG-2 has been reported to have a role in the early pregnancy of water buffalo (Barbato et al., 2017), but its function during the implantation of pig conceptus has not been studied. In this study, PAG-2 was very highly up-regulated on day 12 of pregnancy, so it may play an important role during implantation (Figure 7A and Supplementary Table 2). Therefore, PAG-2 was selected as a candidate gene for regulating pig conceptus implantation.
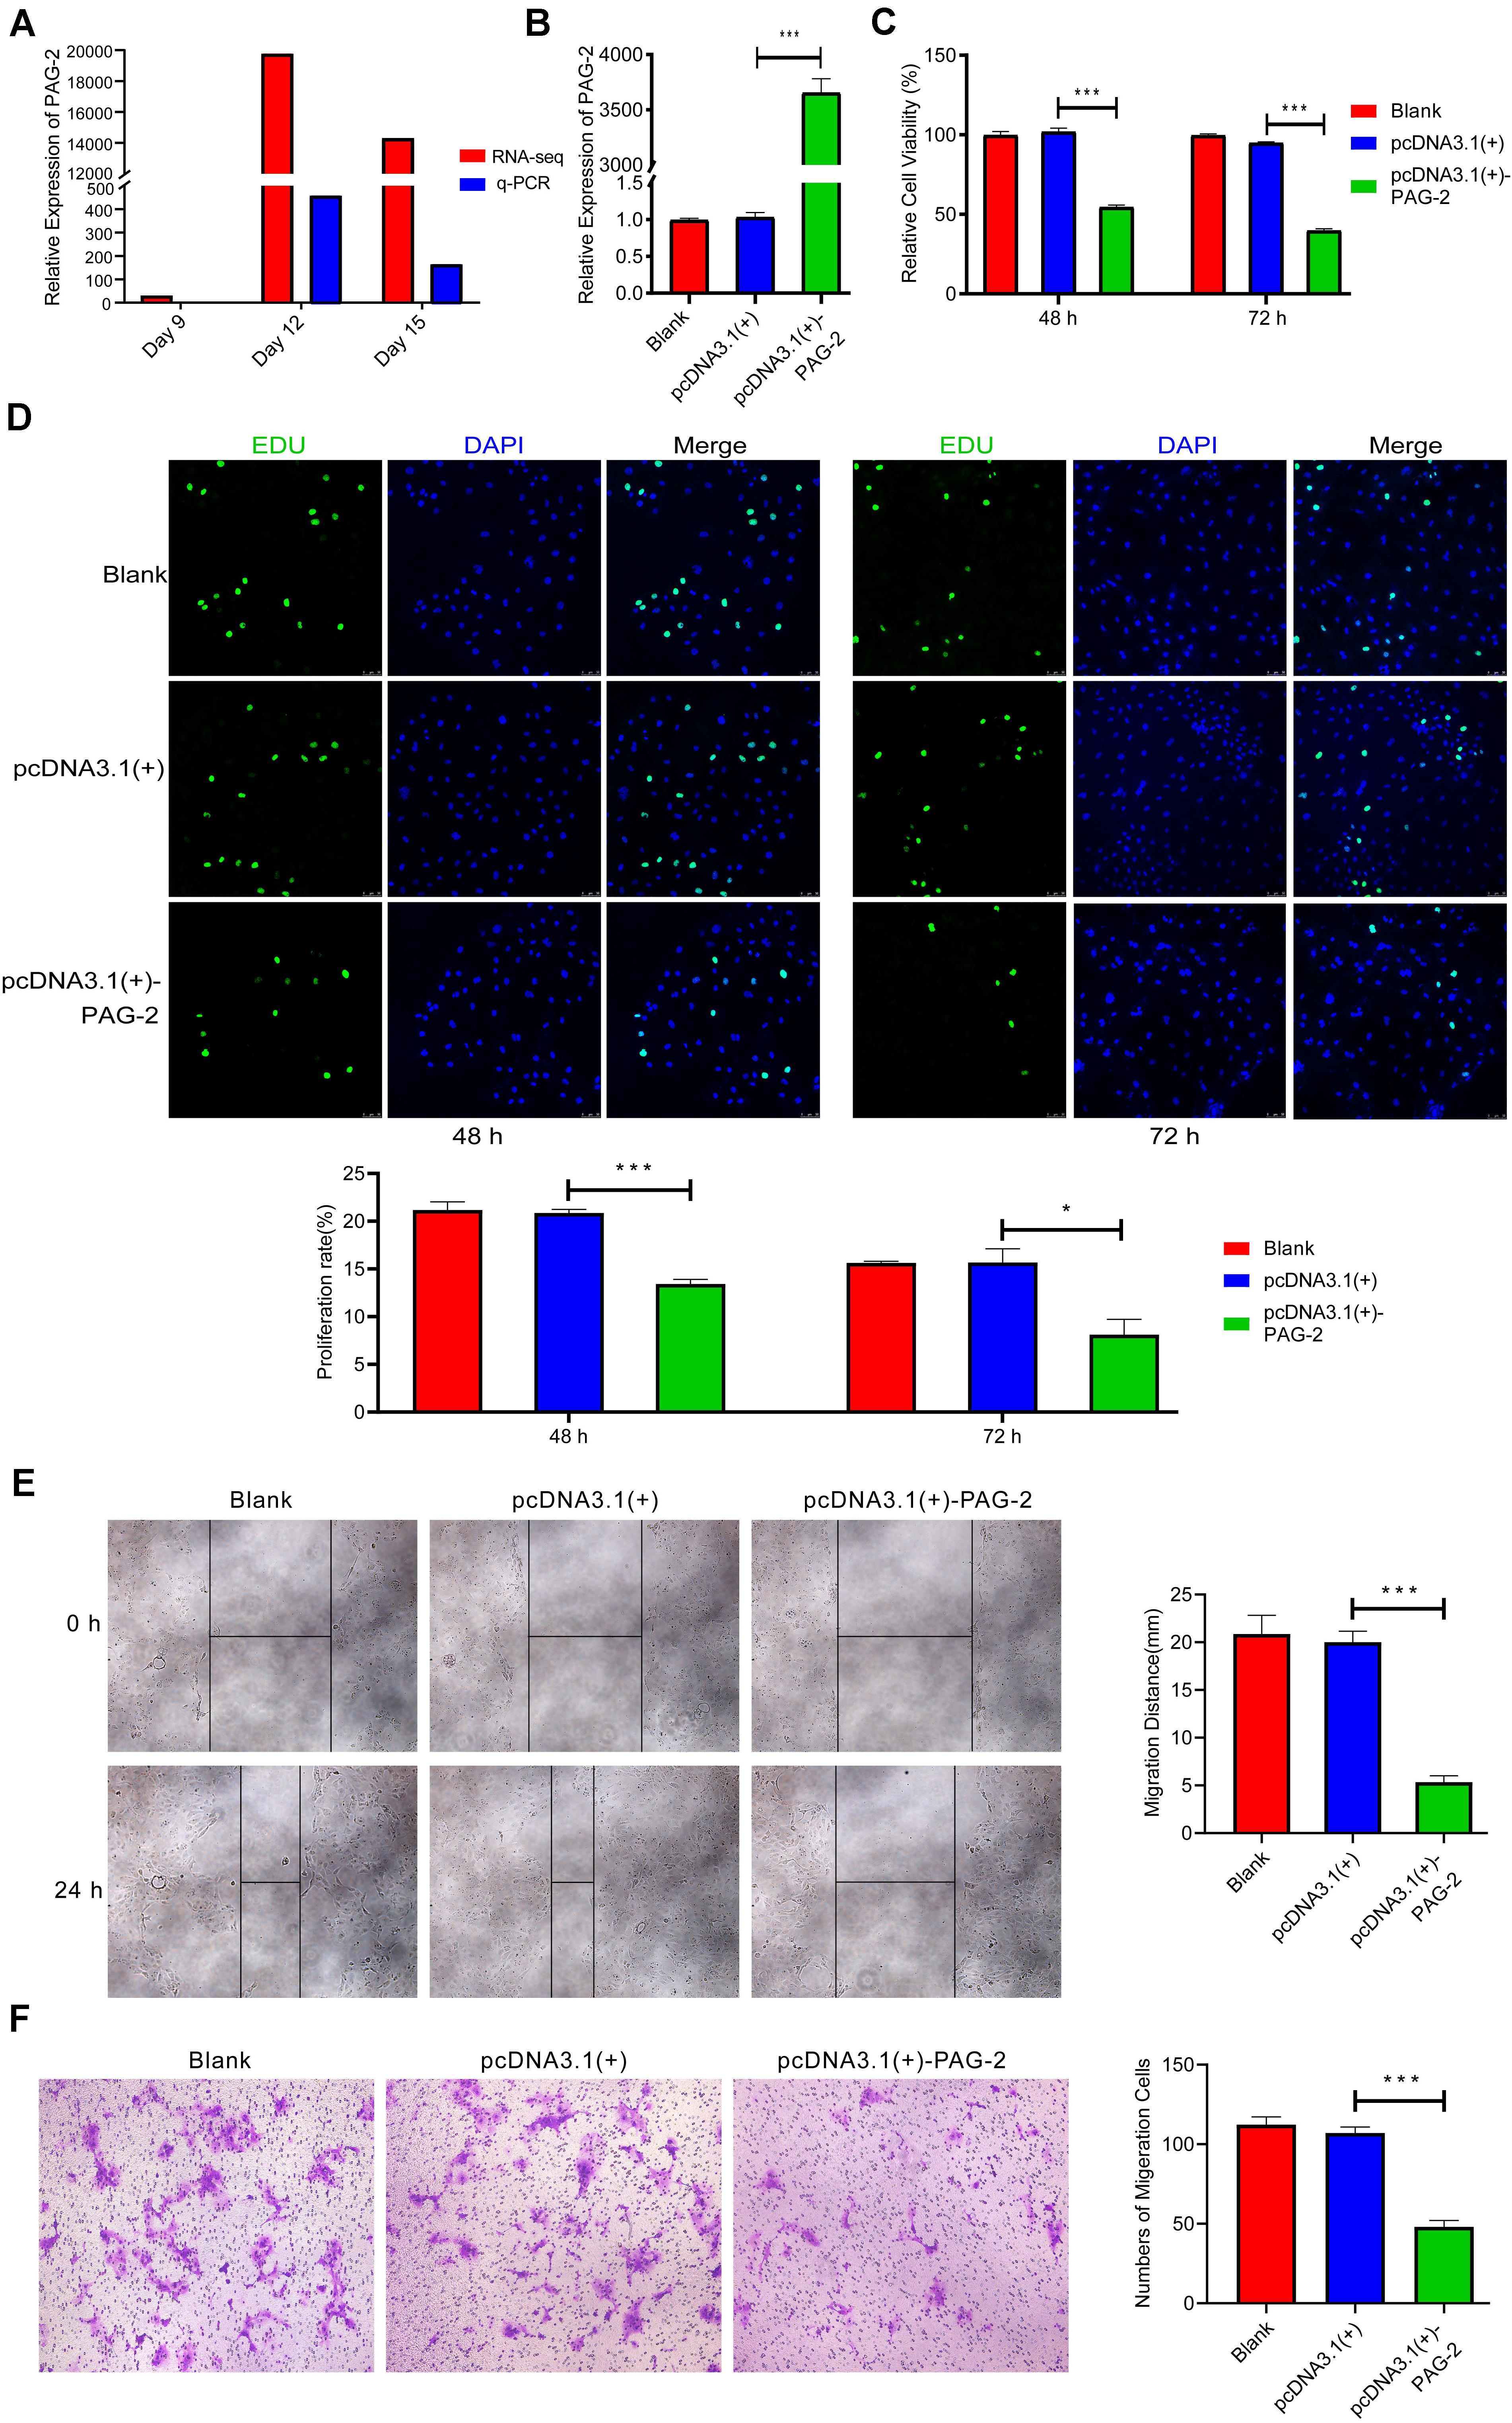
Figure 7. PAG-2 inhibits cell proliferation and migration in vitro. (A) The expression level of PAG-2 in porcine conceptus at days 9, 12, and 15 of pregnancy. (B) Transfection efficiency of PAG-2 overexpression was determined by PCR. (C) The cell viability of PTr2 cells was applied by CCK-8 assay. (D) EDU staining assay was performed to determine the cell proliferation changes after PAG-2 overexpression. (E) Wound healing assay for the evaluation of migration of PTr2 cells. (F) Transwell migration assay showed that PAG-2 overexpression reduced the cell numbers of migration. CCK8, Cell Counting Kit-8. Data are presented as mean ± SEM. *P < 0.05, ***P < 0.001, and Student’s t-test.
To study the roles of PAG-2 on pig trophoblast cells, we conducted a series of in vitro experiments. Using the plasmid vector, we succeeded in overexpressing its level in PTr2 cells (Figure 7B). The CCK-8 assay showed that overexpression of PAG-2 significantly reduced trophoblast proliferation (Figure 7C). EDU staining also demonstrated that the proliferation rate of PAG-2 overexpression cells was significantly decreased compared with that of the control cells (Figure 7D). Wound healing migration and Transwell assays revealed that PAG-2 overexpression decreased PTr2 cells migration (Figures 7E,F). Conversely, the proliferation and migration of PTr2 cells were significantly promoted after PAG-2 knockdown (Figure 8). Together, the data suggest that PAG-2 can inhibit trophoblast cell proliferation and migration in vitro.
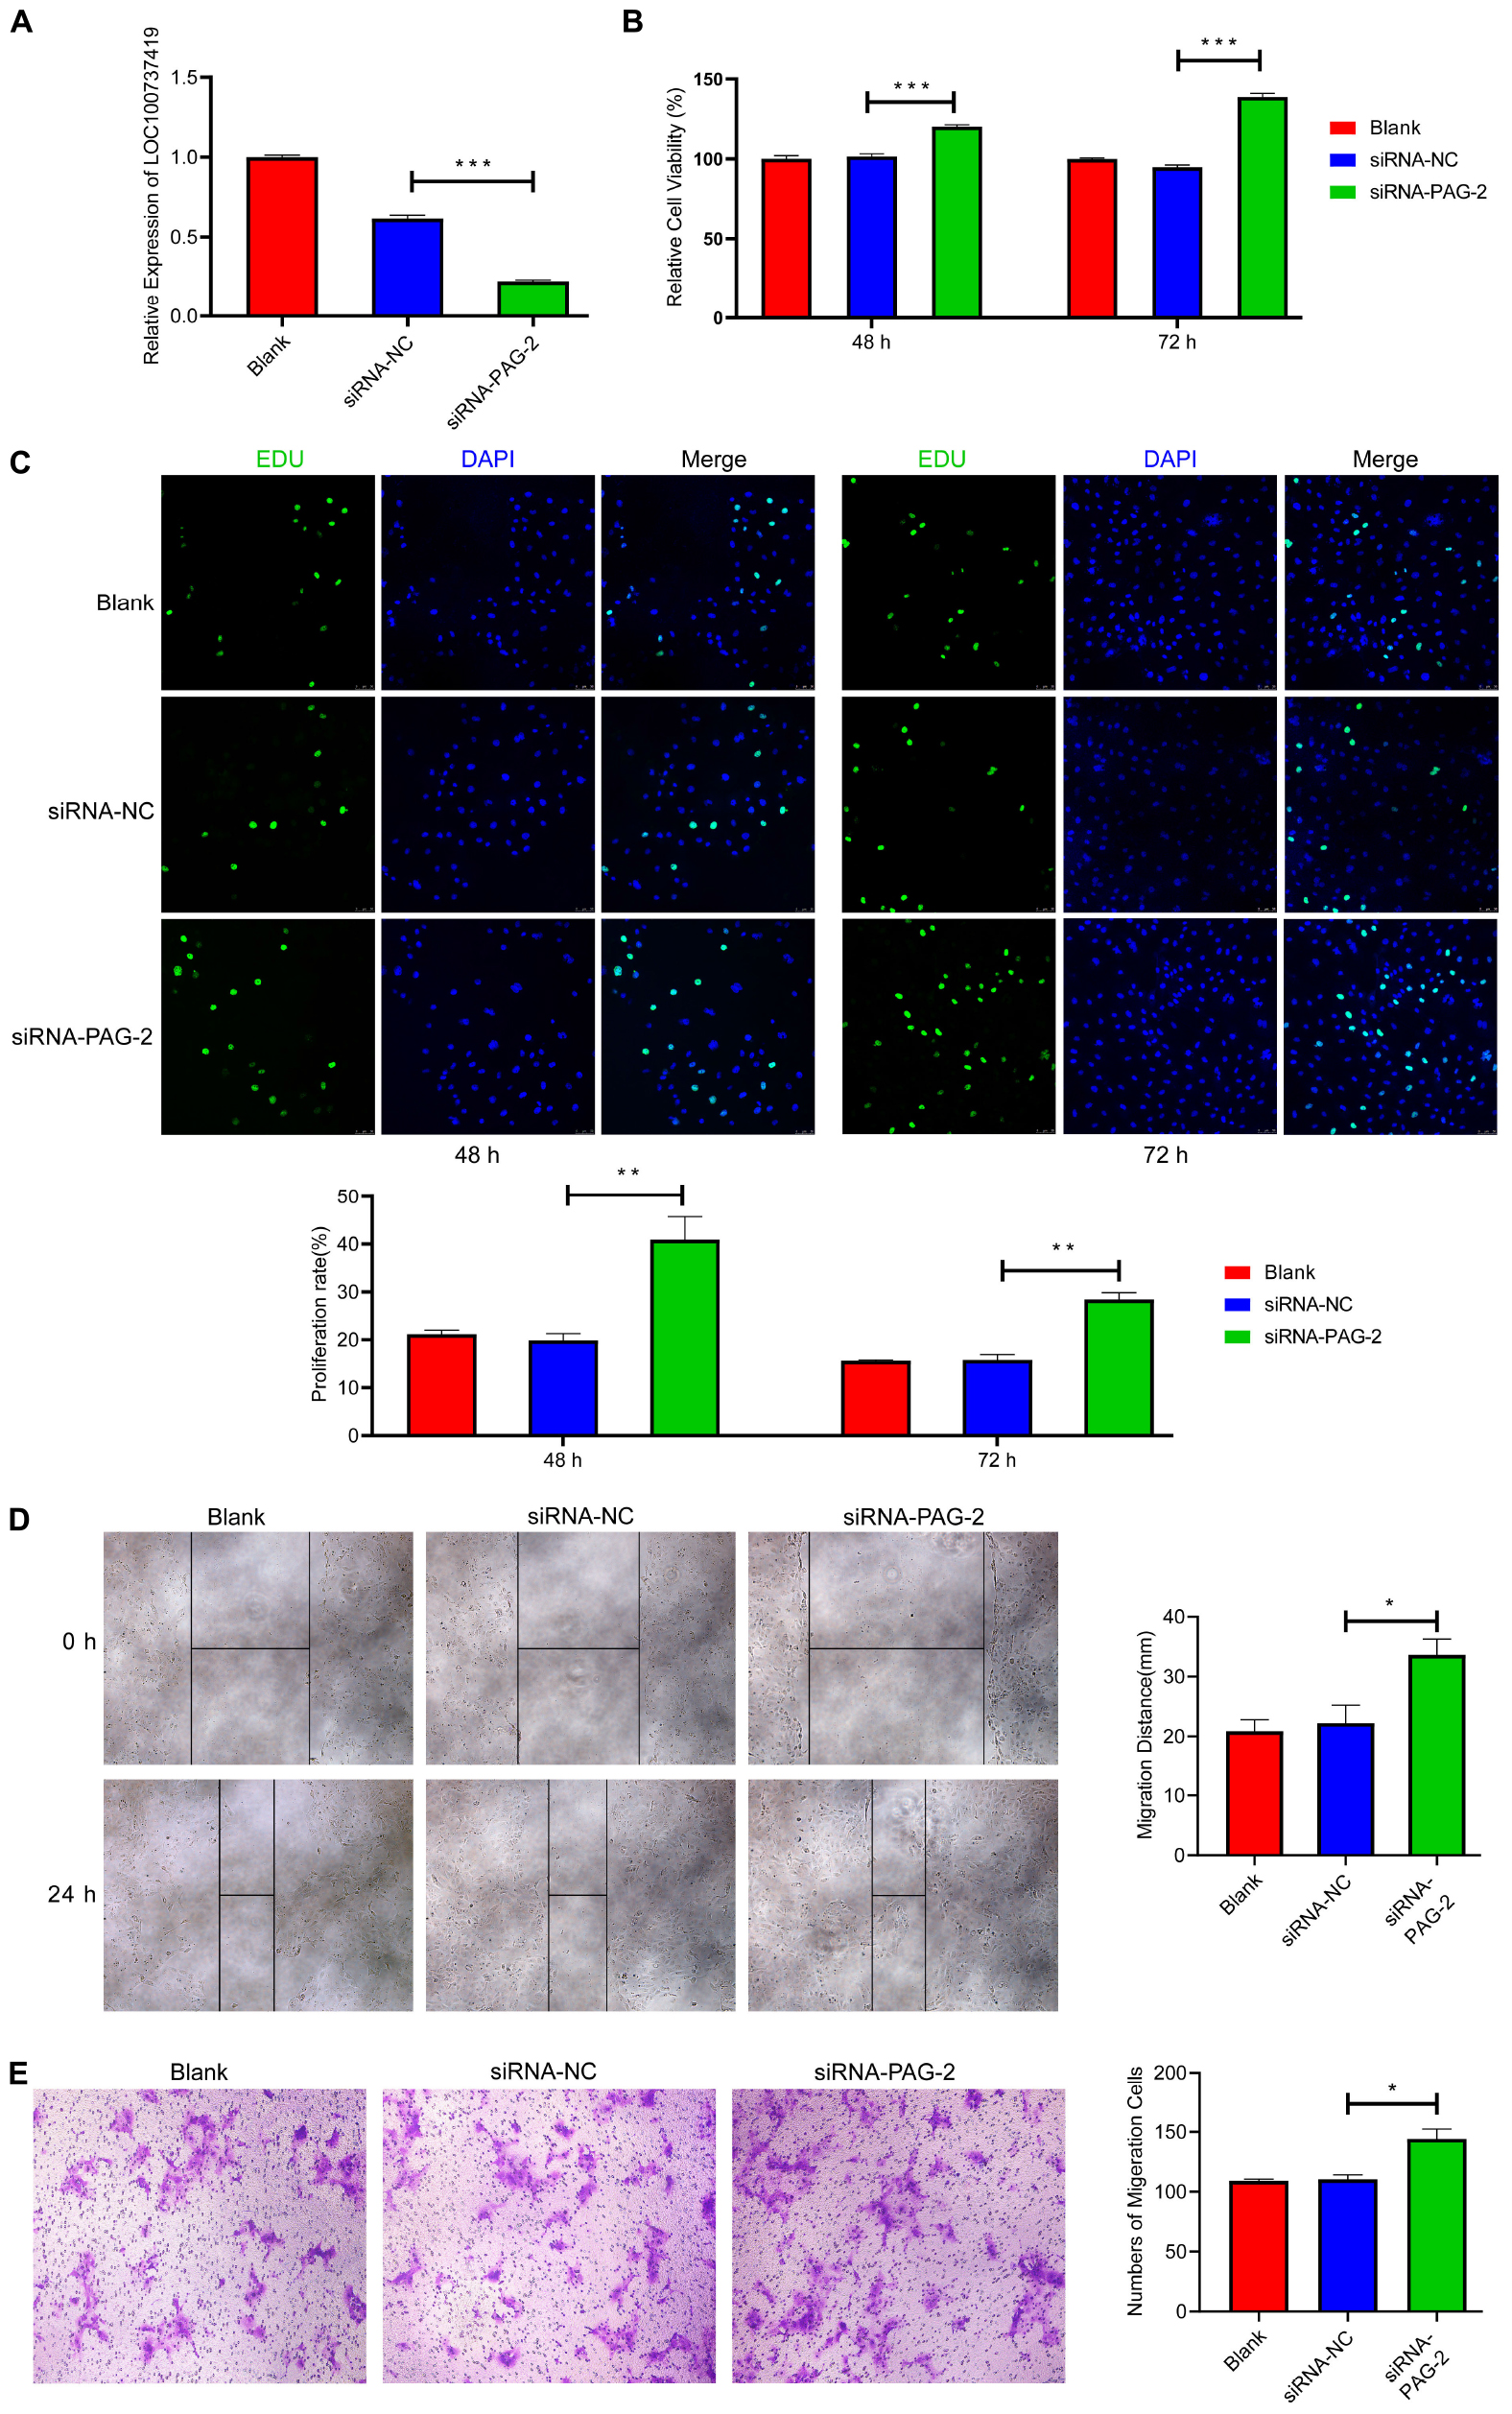
Figure 8. Knockdown of PAG-2 promotes cell proliferation and migration in vitro. (A) Transfection efficiency of PAG-2 siRNA was determined by PCR. (B) The cell viability of PTr2 cells was applied by CCK-8 assay. (C) EDU staining assay was performed to determine the cell proliferation changes after PAG-2 knockdown. (D) Wound healing assay for the evaluation of migration of PTr2 cells. (E) Transwell migration assay showed that knockdown PAG-2 increased the cell numbers of migration. CCK8, Cell Counting Kit-8. Data are presented as mean ± SEM. *P < 0.05, **P < 0.01, ***P < 0.001, and Student’s t-test.
Discussion
Recent studies have revealed that numerous genes play an important role in the development and loss of porcine conceptus, during early pregnancy stages (Franczak et al., 2018; Zeng et al., 2019). In the current study, we investigated gene expression patterns during early pregnancy stages after implantation and identified key genes that play important roles in successful implantation. A pig conceptus typically undergoes differentiation and expansion before attaching onto the surface of the maternal uterine epithelium. These rapid morphological changes can be attributed to changes in highly sophisticated and multifarious hormones and gene expression between days 9 and 12 of gestation.
On day 9 of pregnancy, porcine conceptus grows to spherical blastocysts, subsequently proliferates and differentiates through mitosis and slowly develops (Anderson, 1978). Our first gene cluster showed that the highest expression levels occurred on day 9, but this was rapidly down-regulated, indicating that genes in this cluster work mainly on day 9. GO enrichment analysis suggested that a majority of the highly expressed genes on day 9 were mainly related to rRNA processing (GO:0006364) and the positive regulation of telomerase RNA localization to Cajal body (GO:1904874). rRNA processing including cleavage, splicing, and other activities, has been reported to influence cell fate during early mammalian development (Corsini et al., 2018). On the other hand, positive regulation of telomerase RNA localization to Cajal body is known to exist in the cancer cell cycle, acting to promote the continuous proliferation of cells (Lingner et al., 1997; Zhu et al., 2004; Tomlinson et al., 2008; Musgrove et al., 2018). In addition, our GO results revealed enrichment of T-complex 1 (TCP1) and RuvB like AAA ATPase 2 (RUVBL2) for the positive regulation of telomerase RNA localization to Cajal body. Previous studies have shown that TCP1 encodes components of a multi-protein chaperone complex in the cells and promotes cell proliferation (Huang et al., 2014; Guest et al., 2015), whereas RUVBL2 has been found to function in cell cycle regulation (Venteicher et al., 2008; Jha and Dutta, 2009), and cell multiplication (Silva et al., 2018). Furthermore, RUVBL2 knockdown resulted in death of the conceptus (Arnold et al., 2012), indicating its important function for conceptus development. In our study, all these genes were highly expressed on day 9.
Day 12 of pregnancy represents a stage of exponential elongation for the porcine conceptus, from a spherical to filamentous state (Mattson et al., 1990). It has been hypothesized that genes up-regulated on day 12 (herein termed the second cluster) play an important role in the elongation stage. In the current study, we found significant enrichments of GO terms, mainly those related to cell adhesion (GO:1904874) and antigen processing as well as presentation (GO:0019882). Some genes known to be related to cell adhesion, including connective tissue growth factor (CTGF) and integrins (ITGs) were also observed. Previous studies have shown that CTGF regulates a wide range of biological activities. For instance, it has been found to play various roles in the uterus, including cell proliferation, differentiation, adhesion, chemotaxis, apoptosis, and angiogenesis (Lau and Lam, 1999; Perbal, 2001). This factor has also been implicated in endometrial extracellular matrix remodeling and angiogenesis during the critical period of conceptus attachment (Moussad et al., 2002). The extracellular matrix is composed of a complex mixture of structural and functional super molecules, such as collagens, laminins, and integrins (Bosman and Stamenkovic, 2003). Particularly, integrins, are repeatedly expressed and play a considerable role in the crosstalk between cells and extracellular matrix. On the other hand, the cell-matrix adhesion has been shown to cause cytoskeletal reorganization to stabilize adhesion, thereby regulating the attachment of trophectoderm to the uterine luminal epithelium (Albelda and Buck, 1990; Geisert et al., 2015). Moreover, this molecule has been predicted to be an important pathway for successful implantation (Wang et al., 2019).
Studies have shown that numerous immune reactions synchronously occur in the uterus during early pregnancy, to prevent immune rejection caused by the semi-allogeneic fetus and allow successful maternal recognition (Tayade et al., 2005; Trowsdale and Betz, 2006). Our results showed that genes that were highly expressed on day 12 were involved in conceptus development and maternal-uterine recognition, which is consistent with previous studies. For instance, we identified the antigen processing and presentation (GO:0019882) pathway, which has been shown to play a role in immunomodulation through a number of small proteins (Alessio et al., 2017), as well as IFNG and MHC class I antigen 1 (SLA-1). IFNG is a pro-inflammatory cytokine with extended roles in the activation of innate and adaptive immune responses, partly by up-regulating the transcription of genes involved in cell cycle regulation, apoptosis, and antigen processing/presentation (Murphy et al., 2009). It has been reported to positively influence the expression of some chemokines in endometrial cells, including chemokine ligand 9 (CXCL9) and chemokine ligand 10 (CXCL10), which are related to the recruitment of immune cells and the establishment of an immunotolerant environment (Złotkowska and Andronowska, 2019). Besides, expression of swine leukocyte antigen-DQ is induced by IFNG, and potentially regulates the immune response at the maternal-fetal interface to support the maintenance of pregnancy (Kim et al., 2012). On the other hand, SLA-1 is a polymorphic cell surface glycoprotein that binds to inhibitory and activating receptors on natural killer (NK) cells as well as other leukocytes (Davies et al., 2000). SLA-1 is specifically regulated by progesterone and IFNs, and provides an immunologically favorable environment for the survival of fetal-placental semi-allografts (Joyce et al., 2008).
In addition, PAG-2 is a member of the aspartic protease family and was originally found in the trophectoderm of fetal bovine (Xie et al., 1994), which was found to be associated with uterine immunosuppression during pregnancy (Serrano-Pérez et al., 2016). In this study, we found that PAG-2 was overexpressed on day 12 of pregnancy, and the experiments showed that it can inhibit the proliferation and migration of trophoblast cells. The elongation of the conceptus during the phase was mainly due to the remodeling of the trophoblast cells rather than proliferation, these results suggest that PAG-2 may play an important role in the process of implantation.
On day 15 of pregnancy, the filamentous conceptus further develops and begins to attach to the luminal uterine epithelium (LE; Bazer and Johnson, 2014). Our analysis revealed highly expressed genes on day 15, which play a crucial role in regulating conceptus development and attachment. For instance, we found enrichment of heart development (GO:0007507), homophilic cell adhesion via plasma membrane adhesion molecules (GO:0007156), and collagen fibril organization (GO:0030199) processes by genes specifically up-regulated on day 15 (the third cluster). Interestingly, no previous study has reported that a pig’s heart begins to develop on day 15 of pregnancy. However, our results support the hypothesis that conceptus heart may have started to develop on day 15 of pregnancy, which is meaningful for developmental biology research. Of the heart development genes identified herein, transforming growth factor beta receptor 1 (TGFBR1; GO:0007507), has been previously found to be expressed at the conceptus-maternal interface during early pregnancy stages in pigs (Jones et al., 2006). Functionally, this gene induces multiple cellular effects and has been shown to control proliferation, migration, and apoptosis, as well as promote conceptus development by increasing the proliferation of trophoblast cells (Roberts and Sporn, 1993; Blitek et al., 2013). In addition, we also identified Annexin A2, an essential gene for collagen fibril organization (GO:0030199). Previous studies have associated Annexin A2 with endometrial epithelial cell migration and trophoblast proliferation (Gerke and Moss, 1997), with its inhibition found to greatly reduce conceptus adhesion (Garrido-Gómez et al., 2012).
Conclusion
In conclusion, our findings provide dynamic transcriptome changes during the implantation phases in pigs. Moreover, we revealed the function of PAG-2 on pig trophoblast cells in vitro. The genetic factors and pathways identified herein will be helpful to guide further research on developmental biology, human medicine, and increase livestock productivity.
Data Availability Statement
The raw reads produced in this study were deposited in the NCBI Sequence Read Archive (SRA). The Accession number is PRJNA646603.
Ethics Statement
The animal study was reviewed and approved by the Ethics Committee of the Laboratory Animal Center of South China Agricultural University.
Author Contributions
XZ, TG, ZW, and LH developed and designed the research. QH, ZQX, YX, CZ, EZ, SH, ZX, and FM collected the samples and performed the experiments. XZ, TG, and GC performed the sequencing analysis and drafted the manuscript. All authors read and approved the final version of the manuscript.
Funding
This study was supported by the National Natural Science Foundation of China (31802033), the Department of Science and Technology of Guangdong Province (2019A1515011835 and 2017A010405039), the Guangdong Provincial Promotion Project on Preservation and Utilization of Local Breed of Livestock and Poultry (4300-F18260), and the Science and Technology Planning Project of Guangzhou (201904010434).
Conflict of Interest
The authors declare that the research was conducted in the absence of any commercial or financial relationships that could be construed as a potential conflict of interest.
Supplementary Material
The Supplementary Material for this article can be found online at: https://www.frontiersin.org/articles/10.3389/fgene.2021.584995/full#supplementary-material
Footnotes
- ^ https://david.ncifcrf.gov
- ^ http://kobas.cbi.pku.edu.cn/kobas3
- ^ https://toppcluster.cchmc.org
- ^ http://www.cytoscape.org
References
Albelda, S. M., and Buck, C. A. (1990). Integrins and other cell adhesion molecules. FASEB J. 4, 2868–2880. doi: 10.1007/BF01731706
Alessio, N., Özcan, S., Tatsumi, K., Murat, A., Peluso, G., Dezawa, M., et al. (2017). The secretome of MUSE cells contains factors that may play a role in regulation of stemness, apoptosis and immunomodulation. Cell Cycle 16, 33–44. doi: 10.1080/15384101.2016.1211215
Anders, S., Pyl, P. T., and Huber, W. (2015). HTSeq—a Python framework to work with high-throughput sequencing data. Bioinformatics 31, 166–169. doi: 10.1093/bioinformatics/btu638
Anderson, L. (1978). Growth, protein content and distribution of early pig embryos. Anatom. Rec. 190, 143–153. doi: 10.1002/ar.1091900112
Arnold, C. N., Pirie, E., Dosenovic, P., McInerney, G. M., Xia, Y., Wang, N., et al. (2012). A forward genetic screen reveals roles for Nfkbid, Zeb1, and Ruvbl2 in humoral immunity. Proc. Natl. Acad. Sci. U.S.A. 109, 12286–12293. doi: 10.1073/pnas.1209134109
Barbato, O., Guelfi, G., Barile, V., Menchetti, L., Tortiello, C., Canali, C., et al. (2017). Using real-time PCR to identify pregnancy-associated glycoprotein 2 (PAG-2) in water buffalo (Bubalus bubalis) blood in early pregnancy. Theriogenology 89, 106–113. doi: 10.1016/j.theriogenology.2016.09.038
Bazer, F. W., and Johnson, G. A. (2014). Pig blastocyst–uterine interactions. Differentiation 87, 52–65. doi: 10.1016/j.diff.2013.11.005
Bazer, F. W., Wu, G., Spencer, T. E., Johnson, G. A., Burghardt, R. C., and Bayless, K. (2009). Novel pathways for implantation and establishment and maintenance of pregnancy in mammals. MHR Basic Sci. Reprod. Med. 16, 135–152. doi: 10.1093/molehr/gap095
Benjamini, Y., and Hochberg, Y. (1995). Controlling the false discovery rate: a practical and powerful approach to multiple testing. J. R. Statist. Soc. Ser. B 57, 289–300. doi: 10.1111/j.2517-6161.1995.tb02031.x
Blitek, A., Morawska-Pucinska, E., Szymanska, M., Kiewisz, J., and Waclawik, A. (2013). Effect of conceptus on transforming growth factor (TGF) β1 mRNA expression and protein concentration in the porcine endometrium—in vivo and in vitro studies. J. Reprod. Dev. 59, 512–519. doi: 10.1262/jrd.2013-002
Bosman, F. T., and Stamenkovic, I. (2003). Functional structure and composition of the extracellular matrix. J. Pathol. 200, 423–428. doi: 10.1002/path.1437
Corsini, N. S., Peer, A. M., Moeseneder, P., Roiuk, M., Burkard, T. R., Theussl, H.-C., et al. (2018). Coordinated control of mRNA and rRNA processing controls embryonic stem cell pluripotency and differentiation. Cell Stem Cell 22, 543–558.e512. doi: 10.1016/j.stem.2018.03.002
Daehwan, K., Ben, L., and Salzberg, S. L. (2015). HISAT: a fast spliced aligner with low memory requirements. Nat. Methods 12, 357–360. doi: 10.1038/nmeth.3317
Davies, C., Fisher, P., and Schlafer, D. (2000). Temporal and regional regulation of major histocompatibility complex class I expression at the bovine uterine/placental interface. Placenta 21, 194–202. doi: 10.1053/plac.1999.0475
Dennis, G., Sherman, B. T., Hosack, D. A., Yang, J., Gao, W., Lane, H. C., et al. (2003). DAVID: database for annotation, visualization, and integrated discovery. Genome Biol. 4:R60. doi: 10.1186/gb-2003-4-9-r60
Flint, A., Burton, R., Gadsby, J., Saunders, P., and Heap, R. (1979). “Blastocyst oestrogen synthesis and the maternal recognition of pregnancy,” in Maternal Recognition of Pregnancy. Ciba Foundation Colloquium NS 64 (New Series), ed. J. Whelan (Amsterdam: Excerpta Medica), 209–288.
Franczak, A., Zglejc-Waszak, K., Martyniak, M., Waszkiewicz, E. M., and Kotwica, G. (2018). Peri-conceptional nutritional restriction alters transcriptomic profile in the peri-implantation pig embryos. Anim. Reprod. Sci. 197, 305–316. doi: 10.1016/j.anireprosci.2018.08.045
Garrido-Gómez, T., Dominguez, F., Quiñonero, A., Estella, C., Vilella, F., Pellicer, A., et al. (2012). Annexin A2 is critical for embryo adhesiveness to the human endometrium by RhoA activation through F-actin regulation. FASEB J. 26, 3715–3727. doi: 10.1096/fj.12-204008
Geisert, R. D., Johnson, G. A., and Burghardt, R. C. (2015). Implantation and Establishment of Pregnancy in the Pig. Berlin: Springer.
Geisert, R. D., Whyte, J. J., Meyer, A. E., Mathew, D. J., Juárez, M. R., Lucy, M. C., et al. (2017). Rapid conceptus elongation in the pig: an interleukin 1 beta 2 and estrogen-regulated phenomenon. Mol. Reprod. Dev. 84, 760–774. doi: 10.1002/mrd.22813
Gerke, V., and Moss, S. E. (1997). Annexins and membrane dynamics. Biochim. Biophys. Acta Mol.Cell Res. 1357, 129–154. doi: 10.1016/s0167-4889(97)00038-4
Guest, S. T., Kratche, Z. R., Bollig-Fischer, A., Haddad, R., and Ethier, S. P. (2015). Two members of the TRiC chaperonin complex, CCT2 and TCP1 are essential for survival of breast cancer cells and are linked to driving oncogenes. Exper. Cell Res. 332, 223–235. doi: 10.1016/j.yexcr.2015.02.005
Hong, L., He, Y., Tan, C., Wu, Z., and Yu, M. (2020). HAI-1 regulates placental folds development by influencing trophoblast cell proliferation and invasion in pigs. Gene 749:144721. doi: 10.1016/j.gene.2020.144721
Huang, X., Wang, X., Cheng, C., Cai, J., He, S., Wang, H., et al. (2014). Chaperonin containing TCP 1, subunit 8 (CCT 8) is upregulated in hepatocellular carcinoma and promotes HCC proliferation. APMIS 122, 1070–1079. doi: 10.1111/apm.12258
Jha, S., and Dutta, A. (2009). RVB1/RVB2: running rings around molecular biology. Mol. Cell 34, 521–533. doi: 10.1016/j.molcel.2009.05.016
Jones, R. L., Stoikos, C., Findlay, J. K., and Salamonsen, L. A. (2006). TGF-β superfamily expression and actions in the endometrium and placenta. Reproduction 132, 217–232. doi: 10.1530/rep.1.01076
Joyce, M. M., Burghardt, J. R., Burghardt, R. C., Hooper, R. N., Bazer, F. W., and Johnson, G. A. (2008). Uterine MHC class I molecules and β2-microglobulin are regulated by progesterone and conceptus interferons during pig pregnancy. J. Immunol. 181, 2494–2505. doi: 10.4049/jimmunol.181.4.2494
Kaimal, V., Bardes, E. E., Tabar, S. C., Jegga, A. G., and Aronow, B. J. (2010). ToppCluster: a multiple gene list feature analyzer for comparative enrichment clustering and network-based dissection of biological systems. Nucleic Acids Res. 38(Suppl._2), W96–W102. doi: 10.1093/nar/gkq418
Keys, J., King, G., and Kennedy, T. (1986). Increased uterine vascular permeability at the time of embryonic attachment in the pig. Biol. Reprod. 34, 405–411. doi: 10.1095/biolreprod34.2.405
Kim, M., Seo, H., Choi, Y., Shim, J., Bazer, F. W., and Ka, H. (2012). Swine leukocyte antigen-DQ expression and its regulation by interferon-gamma at the maternal-fetal interface in pigs. Biol. Reprod. 86, 1–11. doi: 10.1095/biolreprod.111.094011
Kumar, L., and Futschik, M. E. (2007). Mfuzz: a software package for soft clustering of microarray data. Bioinformation 2:5. doi: 10.6026/97320630002005
Lau, L. F., and Lam, S. C.-T. (1999). The CCN family of angiogenic regulators: the integrin connection. Exper. Cell Res. 248, 44–57. doi: 10.1006/excr.1999.4456
Lingner, J., Hughes, T. R., Shevchenko, A., Mann, M., Lundblad, V., and Cech, T. R. (1997). Reverse transcriptase motifs in the catalytic subunit of telomerase. Science 276, 561–567. doi: 10.1126/science.276.5312.561
Love, M., Anders, S., and Huber, W. (2014). Differential analysis of count data–the DESeq2 package. Genome Biol. 15, 10–11.
Martin, M. (2011). Cutadapt removes adapter sequences from high-throughput sequencing reads. EMBnet. J. 17, 10–12. doi: 10.14806/ej.17.1.200
Mattson, B. A., Overstrom, E. W., and Albertini, D. F. (1990). Transitions in trophectoderm cellular shape and cytoskeletal organization in the elongating pig blastocyst. Bio. Reprod. 42, 195–205. doi: 10.1095/biolreprod42.1.195
Mihaela, P., Pertea, G. M., Antonescu, C. M., Tsung-Cheng, C., Mendell, J. T., and Salzberg, S. L. (2015). StringTie enables improved reconstruction of a transcriptome from RNA-seq reads. Na. Biotechnol. 33, 290–295. doi: 10.1038/nbt.3122
Moussad, E. E. A., Rageh, M., Wilson, A., Geisert, R., and Brigstock, D. (2002). Temporal and spatial expression of connective tissue growth factor (CCN2; CTGF) and transforming growth factor β type 1 (TGF-β1) at the utero–placental interface during early pregnancy in the pig. Mol. Pathol. 55:186. doi: 10.1136/mp.55.3.186
Murphy, S. P., Tayade, C., Ashkar, A. A., Hatta, K., Zhang, J., and Croy, B. A. (2009). Interferon gamma in successful pregnancies. Biol. Reprod. 80, 848–859. doi: 10.1095/biolreprod.108.073353
Musgrove, C., Jansson, L. I., and Stone, M. D. (2018). New perspectives on telomerase RNA structure and function. Wiley Interdiscipl. Rev. RNA 9:e1456. doi: 10.1002/wrna.1456
Niemann, H., and Wrenzycki, C. (2000). Alterations of expression of developmentally important genes in preimplantation bovine embryos by in vitro culture conditions: implications for subsequent development. Theriogenology 53, 21–34. doi: 10.1016/s0093-691x(99)00237-x
Perbal, B. (2001). NOV (Nephroblastoma overexpressed) and the CCN family of genes: structural and functional issues. Mol. Pathol. 54:57. doi: 10.1136/mp.54.2.57
Perry, J., and Rowlands, I. (1962). Early pregnancy in the pig. Reproduction 4, 175–188. doi: 10.1530/jrf.0.0040175
Roberts, A. B., and Sporn, M. B. (1993). Physiological actions and clinical applications of transforming growth factor-β (TGF-β). Growth Fact. 8, 1–9. doi: 10.3109/08977199309029129
Serrano-Pérez, B., Hansen, P., Mur-Novales, R., García-Ispierto, I., de Sousa, N., Beckers, J., et al. (2016). Crosstalk between uterine serpin (SERPINA14) and pregnancy-associated glycoproteins at the fetal-maternal interface in pregnant dairy heifers experimentally infected with Neospora caninum. Theriogenology 86, 824–830. doi: 10.1016/j.theriogenology.2016.03.003
Shannon, P., Markiel, A., Ozier, O., Baliga, N. S., Wang, J. T., Ramage, D., et al. (2003). Cytoscape: a software environment for integrated models of biomolecular interaction networks. Genome Res. 13, 2498–2504. doi: 10.1101/gr.1239303
Silva, S. T., Brito, J. A., Arranz, R., Sorzano, C. ÓS., Ebel, C., Doutch, J., et al. (2018). X-ray structure of full-length human RuvB-Like 2–mechanistic insights into coupling between ATP binding and mechanical action. Sci. Rep. 8:13726. doi: 10.1038/s41598-018-31997-z
Tayade, C., Esadeg, S., Fang, Y., and Croy, B. (2005). Functions of alpha 2 macroglobulins in pregnancy. Mol. Cell. Endocrinol. 245, 60–66. doi: 10.1016/j.mce.2005.10.004
Tomlinson, R. L., Abreu, E. B., Ziegler, T., Ly, H., Counter, C. M., Terns, R. M., et al. (2008). Telomerase reverse transcriptase is required for the localization of telomerase RNA to cajal bodies and telomeres in human cancer cells. Mol. Biol. Cell 19, 3793–3800. doi: 10.1091/mbc.E08-02-0184
Trapnell, C., Roberts, A., Goff, L., Pertea, G., Kim, D., Kelley, D. R., et al. (2012). Differential gene and transcript expression analysis of RNA-seq experiments with TopHat and Cufflinks. Nat. Protoc. 7:562. doi: 10.1038/nprot.2012.016
Trapnell, C., Williams, B. A., Pertea, G., Mortazavi, A., Kwan, G., Van Baren, M. J., et al. (2010). Transcript assembly and quantification by RNA-Seq reveals unannotated transcripts and isoform switching during cell differentiation. Nat. Biotechnol. 28:511. doi: 10.1038/nbt.1621
Trowsdale, J., and Betz, A. G. (2006). Mother’s little helpers: mechanisms of maternal-fetal tolerance. Nat. Immunol. 7:241. doi: 10.1038/ni1317
Venteicher, A. S., Meng, Z., Mason, P. J., Veenstra, T. D., and Artandi, S. E. (2008). Identification of ATPases pontin and reptin as telomerase components essential for holoenzyme assembly. Cell 132, 945–957. doi: 10.1016/j.cell.2008.01.019
Wang, Y., Hua, R., Xue, S., Li, W., Wu, L., Kang, T., et al. (2019). mRNA/lncRNA expression patterns and the function of fibrinogen-like protein 2 in Meishan pig endometrium during the preimplantation phases. Mol. Reprod. Dev. 86, 354–369. doi: 10.1002/mrd.23109
Xie, S., Low, B. G., Nagel, R. J., Beckers, J.-F., and Michael Roberts, R. (1994). A novel glycoprotein of the aspartic proteinase gene family expressed in bovine placental trophectoderm. Biol. Reprod. 51, 1145–1153. doi: 10.1095/biolreprod51.6.1145
Zavy, M. T., and Geisert, R. D. (1994). Embryonic Mortality in Domestic Species. Boca Raton, FL: CRC Press.
Zeng, S., Bick, J., Kradolfer, D., Knubben, J., Flöter, V. L., Bauersachs, S., et al. (2019). Differential transcriptome dynamics during the onset of conceptus elongation and between female and male porcine embryos. BMC Genom. 20:679. doi: 10.1186/s12864-019-6044-z
Zhu, Y., Tomlinson, R. L., Lukowiak, A. A., Terns, R. M., and Terns, M. P. (2004). Telomerase RNA accumulates in Cajal bodies in human cancer cells. Mol. Biol. Cell 15, 81–90. doi: 10.1091/mbc.e03-07-0525
Keywords: pig, conceptus, implantation, development, RNA-Seq
Citation: Zang X, Gu T, Hu Q, Xu Z, Xie Y, Zhou C, Zheng E, Huang S, Xu Z, Meng F, Cai G, Wu Z and Hong L (2021) Global Transcriptomic Analyses Reveal Genes Involved in Conceptus Development During the Implantation Stages in Pigs. Front. Genet. 12:584995. doi: 10.3389/fgene.2021.584995
Received: 19 July 2020; Accepted: 08 February 2021;
Published: 24 February 2021.
Edited by:
Peter Dovc, University of Ljubljana, SloveniaReviewed by:
Merete Fredholm, University of Copenhagen, DenmarkXiangdong Ding, China Agricultural University, China
Copyright © 2021 Zang, Gu, Hu, Xu, Xie, Zhou, Zheng, Huang, Xu, Meng, Cai, Wu and Hong. This is an open-access article distributed under the terms of the Creative Commons Attribution License (CC BY). The use, distribution or reproduction in other forums is permitted, provided the original author(s) and the copyright owner(s) are credited and that the original publication in this journal is cited, in accordance with accepted academic practice. No use, distribution or reproduction is permitted which does not comply with these terms.
*Correspondence: Zhenfang Wu, d3pmZW1haWxAMTYzLmNvbQ==; Linjun Hong, TGluanVuLmhvbmdAc2NhdS5lZHUuY24=
†These authors have contributed equally to this work