 Shirin Rahimmadar1
 Mokhtar Ghaffari
 Mahdi Mokhber
 John L. Williams
- 1Department of Animal Science, Faculty of Agricultural Science, Urmia University, Urmia, Iran
- 2Davies Research Centre, School of Animal and Veterinary Sciences, University of Adelaide, Roseworthy, SA, Australia
- 3Department of Animal Science, Food and Nutrition, Università Cattolica Del Sacro Cuore, Piacenza, Italy
Linkage disequilibrium (LD) across the genome provides information to identify the genes and variations related to quantitative traits in genome-wide association studies (GWAS) and for the implementation of genomic selection (GS). LD can also be used to evaluate genetic diversity and population structure and reveal genomic regions affected by selection. LD structure and Ne were assessed in a set of 83 water buffaloes, comprising Azeri (AZI), Khuzestani (KHU), and Mazandarani (MAZ) breeds from Iran, Kundi (KUN) and Nili-Ravi (NIL) from Pakistan, Anatolian (ANA) buffalo from Turkey, and buffalo from Egypt (EGY). The values of corrected r2 (defined as the correlation between two loci) of adjacent SNPs for three pooled Iranian breeds (IRI), ANA, EGY, and two pooled Pakistani breeds (PAK) populations were 0.24, 0.28, 0.27, and 0.22, respectively. The corrected r2 between SNPs decreased with increasing physical distance from 100 Kb to 1 Mb. The LD values for IRI, ANA, EGY, and PAK populations were 0.16, 0.23, 0.24, and 0.21 for less than 100Kb, respectively, which reduced rapidly to 0.018, 0.042, 0.059, and 0.024, for a distance of 1 Mb. In all the populations, the decay rate was low for distances greater than 2Mb, up to the longest studied distance (15 Mb). The r2 values for adjacent SNPs in unrelated samples indicated that the Affymetrix Axiom 90 K SNP genomic array was suitable for GWAS and GS in these populations. The persistency of LD phase (PLDP) between populations was assessed, and results showed that PLPD values between the populations were more than 0.9 for distances of less than 100 Kb. The Ne in the recent generations has declined to the extent that breeding plans are urgently required to ensure that these buffalo populations are not at risk of being lost. We found that results are affected by sample size, which could be partially corrected for; however, additional data should be obtained to be confident of the results.
Introduction
Recognizing and protecting the genetic diversity of domestic species is important in the development of breeding strategies (Al-Mamun et al., 2015; Wultsch et al., 2016). Recent progress in the field of genome sequencing has increased the availability of genomic data, which has facilitated the assessment of the genetic diversity and population structure (Vonholdt et al., 2010; Decker et al., 2014) using parameters such as population admixture, linkage disequilibrium (LD), and effective population size (Ne) (Al-Mamun et al., 2015).
The non-random association between alleles at different loci is referred to as LD or gametic phase disequilibrium. Knowledge of the pattern of LD in a population is an important prerequisite for GWAS, exploring population structures, and implementing genomic selection (GS) (Niu et al., 2016). The pattern of LD can be used to estimate the rate of genetic drift, level of inbreeding, and the effects of evolutionary forces such as mutation, selection, and migration (Shin et al., 2013). There have been studies of LD in several livestock species, including cattle (McKay et al., 2007; Karimi et al., 2015; Biegelmeyer et al., 2016; Jemaa et al., 2019), buffalo (Mokhber et al., 2019a; Deng et al., 2019; Lu et al., 2020), pig (Badke et al., 2012; Wang et al., 2013), sheep (Meadows et al., 2008), goat (Brito et al., 2015), chicken (Qanbari et al., 2010; Fu et al., 2015), horse (Corbin et al., 2010), dog (Pfahler & Distl., 2015), and cat (Alhaddad et al., 2013).
Several statistics have been suggested to measure LD (Hill and Weir, 1994; Terwilliger, 1995; Zhao et al., 2005; Gianola et al., 2013). Evaluation of these methods has shown that r2 is less affected by allelic frequency and sample size than D' (Pritchard & Przeworski, 2001; Sved, 2009; Bohmanova et al., 2010). Even when the level of LD of populations is similar, this may still be the result of different evolutionary histories. In this regard, determining patterns of the persistency of LD phase (PLDP) is useful for genetic studies (Pritchard et al., 2000). A SNP in LD with quantitative trait loci may have one marker allele in phase with the beneficial allele for the trait in one breed, while in another breed, the phase may be different. Therefore, GS based on marker information in one population may not lead to genetic progress in another (De Roos et al., 2008). PLDP represents the amount of LD that is maintained between populations and is dependent on the divergence time of the breeds (Badke et al., 2012; Wang et al., 2013). Higher values of PLDP between populations indicate more ancestral LD in common, such that the genomic information can be more reliably inferred between them (Mokry et al., 2014). PLDP can also be used to evaluate the relationships among populations, with those having a common history showing higher PLDP (Wang et al., 2013).
LD provides information to identify the genes and variations affecting quantitative traits in genome-wide association studies (GWAS) by inferring the distribution of recombination events. LD can also be used to evaluate diversity and population structure and to identify genomic regions affected by selection (Mokry et al., 2014). The pattern of LD can reveal the genetic history and the previous demography of a population and can be used to infer the effective population size (Ne) (Qanbari, 2020). Effective population size, Ne, is considered to be one of the most important parameters in population genetics and reflects the amount of genetic diversity, inbreeding, and genetic drift in the population (Frankham, 2005; Tenesa et al., 2007). A low value of Ne indicates limited genetic diversity in a population and affects the amount of genetic progress that can be made in breeding programs (Hayes et al., 2003). Ne can be determined by assessing the amount of LD at various distances along the genome (Sved, 1971; Hayes et al., 2003). High LD at long recombination distances reflects low Ne in recent generations (Hayes et al., 2003).
Buffaloes were introduced into Egypt from India, Iran, and Iraq during the seventh B.C. (Minervino et al., 2020). The three breeds from Iran are reared in three different geographical areas with completely different climatic conditions. The Azeri breed is mainly reared in the north-west and north of Iran (West Azerbaijan, East Azerbaijan province, Ardebil, and eastern parts of Gilan provinces), which have cold, sub-zero winters with heavy snowfall and hot, dry summers with temperatures reaching 35 C, the Khuzestani breed is found in the southwest (mainly in Khuzestan province), which has very hot and occasionally humid summers, with temperatures routinely exceeding 45°C degrees, while in the winter, it can drop below freezing, and the Mazandarani breed is reared along the coast of the Caspian Sea in the Mazandaran and Golestan provinces, which have a moderate climate with occasional humidity all around the year (Mokhber et al., 2019a). The Anatolian water buffalo is widespread in Northwestern Turkey, especially along the coast of the Black Sea, the middle of Anatolia, and also in Eastern Anatolia (Soysal et al., 2007). The Egyptian buffaloes are spread along the River Nile, in the Delta Region, and at the Fayum Oasis. With more than three million head, buffalo is the most important livestock species for milk production in Egypt. The Nili-Ravi breed is the most important livestock breed in Pakistan with more than 10 million head in Punjab, while the Kundi, with more than five million head, is the second most important breed in Pakistan (Minervino et al., 2020).
The present study describes genetic diversity, LD between adjacent SNPs, the trend of LD with increasing distance, and the patterns of PLDP and Ne using genomic data from buffalo breeds of Turkey, Egypt, Pakistan, and Iran, which are genetically closer together than other water buffaloes across the world (Colli et al., 2018).
Materials and Method
Genotype Determination and Data Edition
The present study used data for 83 water buffaloes, including 14 Azeri (AZI), 11 Khuzestani (KHU), and eight Mazandarani (MAZ) from Iran, 12 Anatolian buffalo (ANA) from Turkey, nine Kundi (KUN), and 14 Nili-Ravi (NIL) from Pakistan, and 15 Egyptian buffalo (EGY) to assess LD structure and calculate Ne (Table 1).
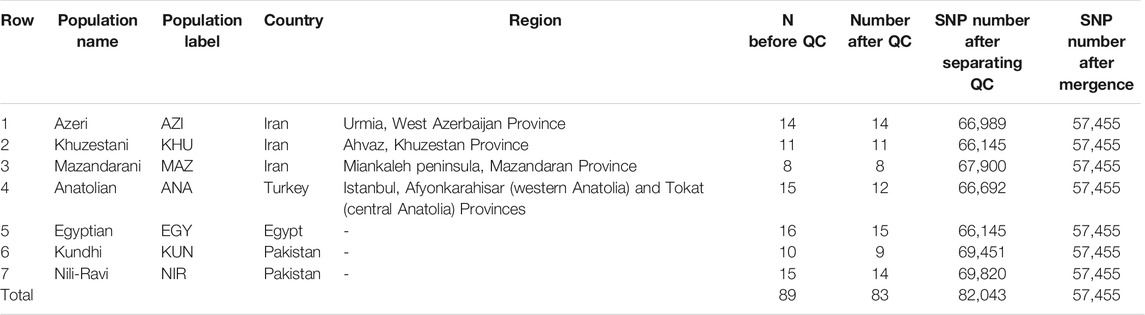
TABLE 1. Descriptive statistics for the studied buffalo populations.
The samples were genotyped using the Axiom® Buffalo Genotyping 90 K array (Affymetrix, Santa Clara, CA, United States) that were mapped to the bovine sequence (UMD3.1 Bos Taurus) (Iamartino et al., 2017). Details on the animals and the genomic data are presented in Table 1. The genotype data were edited with Plink software (Purcell et al., 2007), and animals and loci with more than 5% missing genotypes (CRIND and CRSNP), monomorphic genotypes, and genotypes with minor allele frequency (MAF) less than 5% were eliminated. MAF and missing genotypes of individuals and SNPs were filtered separately for each genotypic group. Then, the genomic data of all genetic groups were integrated, and the common genetic markers were identified. Finally, the SNPs that were not in the Hardy-Weinberg equilibrium were excluded, and the missing genotypes were imputed using BEAGLE software (Browning & Browning, 2007).
Assessment of Population Structure
Discriminant analysis principal component (DAPC), principal component analysis (PCA), Weir and Cockerham unbiased fixation index (FST), and population admixture were used to obtain a general overview of the structure of each population and identify animals falling outside their breed group. DAPC, PCA, and FST were performed using the adegenet package (Jombart and Ahmed, 2011), GeneABEL software (Price et al., 2006), and R scripts using R software (http://www.rproject.org/), respectively. Additionally, the genetic structure of the populations was evaluated using ADMIXTURE software (Alexander et al., 2009).
LD Analysis
After determining the population structure of each genetic group, the patterns of LD were estimated. The values of LD between adjacent SNP as well as paired bases at distances of 0–15 Mb were obtained in each population and evaluated using the statistics r2 (Hill and Robertson, 1968) and D′, which were calculated as follows:
where
and
where SNP pairs had alleles A and a at the first locus and B and b at the second locus, freq A, freq a, freq B, and freq b denote frequencies of alleles A, a, B, and b, respectively, and freq AB denotes frequency of the haplotype AB in the population.
The r2 statistic represents the correlation between alleles at two loci and is less dependent on allele frequencies in finite population sizes compared with other LD measures (Lewontin, 1988; Abecasis et al., 2001; Mueller, 2004) and is the preferred measure for biallelic markers (Zhao et al., 2007). Therefore, r2 was used in the Ne, LD decay, and PLDP analyses. The r2 statistic is biased by sample size, and this bias is higher for a smaller sample size. Correction methods discussed by Hui and Burt (2020), Waples et al. (2016), Villa-Angulo et al. (2009), Weir and Hill (1980), and Sved (1971) were applied to the estimate of r2 in this study. Due to the small sample size for each population, the information was corrected for the sample number and uncertainty of the gametic phase using the following equation (Weir and Hill, 1980; Corbin et al., 2012), which was implemented in SNeP software (Barbato et al., 2015).
where n is the number of individuals sampled, β = 2 when the gametic phase is known, and β = 1 if instead the phase is not known (Weir and Hill, 1980).
To determine LD decay, paired markers that were common to all populations were grouped at distances between 0 and 15 Mb at 100 Kb intervals, and the mean r2 was calculated for each group. The PLDP between populations was expressed as the correlation between the roots of the r2 calculated for adjacent markers using the formula provided by Badke et al. (2012).
where rij is the correlation of phase between rij(A) in population A and rij(B) in population B, SA and SB are the standard deviation of rij(A) and rij(B), respectively, and rA and rB are the average rij across all SNP i and j within the common set of markers.
Effective Population Size (Ne)
The corrected LD for each population was used to calculate Ne by applying the formula of
Results and Discussion
Quality of Data
Before frequency and genotyping pruning, there were 89,988 SNPs and 89 individuals. In the first step, six individuals were removed for low genotyping success (MIND >0.05), 637 markers were excluded based on HWE (p≤5.7e-007), and 7,618 SNPs for missing information (GENO >0.05). A total of 83 individuals with 82,043 SNPs passed the first step of QC; the total genotyping rate of these remaining individuals was 0.985. In the second step, MAF was assessed in each population separately, and SNPs with MAF>0.05 were removed (Table 1). Then, the populations were merged to create a common dataset of 57,426 SNP markers with MAF higher than 0.05 for each population that passed all the filters. These were used in subsequent analyses in snppLD software (Sargolzaei M, University of Guelph, Canada). These markers covered 2,646.07 Mb of the bovine genome. The mean distance between these markers was 46.07 Kb, and minimum and maximum distances were 42.4 Kb on chromosome BTA 24 and 68.2 Kb on the BTA X, respectively.
Assessment of Population Structure
Understanding of population genetic structure is important to assess population stratification for GWAS, breeding program design, and developing strategies for genetic resources preservation. DAPC, PCA, and admixture analysis results were used to assess population structure. Both PCA and DAPC methods gave similar results. In both methods, genotype data formed three distinct clusters in the first two PCs. The ANA population from Turkey was partially separated from the Iranian cluster, which includes AZI, KHU, and MAZ (Figure 1 and Supplementary Figure S1). The first two PCs in the DAPC accounted for 7.16% of the total variance, 4.12% in the first, and 3.04% in the second dimension (Figure 1). The first 10 PCs of DAPC only accounted for about 24% of the total variance (Supplementary Figure S2). In the PCA analysis, the first and second PCs explained 4% and 2% of the variance, respectively (Supplementary Figure S1). The ANA along with AZI, KHU, and MAZ formed overlapping groups with the AZI buffalo being interspersed among the KHU, MAZ, and ANA populations (Figure 1A,B). The EGY and populations from Pakistan (KUN and NIL) formed two additional distinct clusters (Figure 1). The geographic proximity of Iranian populations with the ANA in Turkey makes gene flow between these two populations likely, which would reduce the differentiation between them. In the analysis of Colli et al. (2018), the populations assessed in the present study belonged to one cluster, which is because these populations are genetically similar when compared with other more genetically distinct breeds worldwide. The results presented here are consistent with other studies focused on Iranian buffaloes where no differences (Strillacci et al., 2021) or very small genetic differentiation was observed (Rahmaninia et al., 2015; Azizi et al., 2016; Mokhber et al., 2018; Ghoreishifar et al., 2020).

FIGURE 1. A two first PCs and B first PC only of the DAPC analysis of the water buffalo populations studied. Clusters are indicated by different colors (blue, gray, and green), and populations are identified by their abbreviations AZI, KHU, MAZ, ANA, EGY, KUN, and NIL.
There were small differences in FST among the studied populations (Supplementary Table 1); in most cases, the difference between pairs of populations was less than 0.05, indicating low genetic differentiation according to Wright’s classification. The reason for this is because there was high within, compared with between-population variance. However, the FST results confirmed the DPCA and PCA analyses by separating the populations into three genetic groups. The mean FST value across populations was 0.045 and varied from 0.011 for AZI from Iran and ANA from Turkey to 0.077 for MAZ from Iran and KUN from Pakistani. The smallest genetic distance was between the Iranian buffaloes and ANA from Turkey, while the largest distance was between the Iranian buffalo and KUN and NIL from Pakistani.
Population structures were investigated using ADMIXTURE software, assuming K as ancestral populations ranging from one to seven. Based on cross-validation error criteria, K = 2 and three had suitable resolution (Figure 2). The first subdivision at K = 2 distinguished between Pakistani (KUN and NIL) and the others populations (AZI, KHU, MAZ, ANA, and EGY) (Figure 2). At K = 3, the EGY population becomes genetically distinct, giving three groups that coincide with DAPC and PCA clusters. The ADMIXTURE analysis shows that there are genetic components shared among all the populations explaining the overlap between clusters.
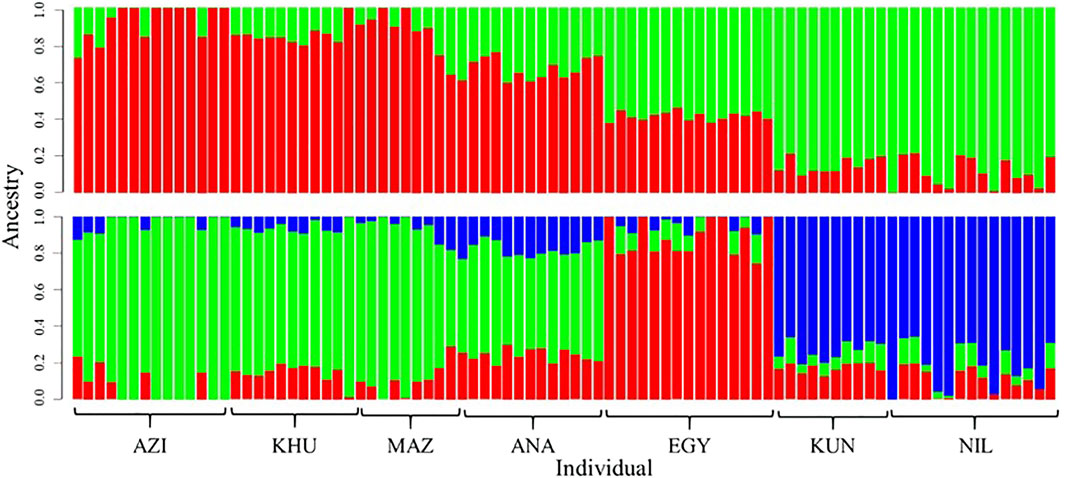
FIGURE 2. Genetic composition of buffalo breeds revealed with ADMIXTURE software at K = 2 (top) and K = 3 (bottom). Individuals are represented with vertical colored bars. Genomic components are assigned different colors.
LD Analysis
We calculated both r2 and D′ for adjacent SNPs in the populations for each chromosome (see S1 Supplementary Table S1). Because of the small sample size, uncorrected LD values were similar among breeds within clusters, in particular the Iranian breeds, AZI, KHU, and MAZ and Pakistani breeds, KUN and NIL. Results were also corrected for sample size. The values of corrected r2 for the pooled Iranian breeds (IRI), ANA, EGY, and PAK populations were 0.24, 0.28, 0.27, and 0.22, respectively (Table 2). At the chromosome level, chromosomes 25 of the PAK population and chromosomes X of the ANA had the maximum corrected r2 values, respectively (Table 2 and Supplementary Table S2). Previous studies reported that a small sample size (less than 25) leads to an overestimate of r2 (Khatkar et al., 2008; Deng et al., 2019), while Bohmanova et al. (2010) reported that at least 55 and 444 individuals were required for accurate estimation of r2 and D′, respectively. Other studies have found that D′ statistics are more affected by population size than r2 (Ardlie et al., 2002; Jemaa et al., 2019). Therefore, estimated r2 values in the present study are more reliable than the D’ statistics. Comparing uncorrected and corrected r2 for sample size revealed that the differences in smaller populations are greater. The corrected vs. uncorrected r2 values changed from 0.27 to 0.24 (around 0.02 units) in the pooled IRI, which has 33 individuals, but from 0.35 to 0.28 (around 0.07 units) in ANA with 12 individuals, 0.34 to 0.27 (around 0.07 units) in EGY with 15 individuals, and 0.27 to 0.22 (around 0.05 units) in PAK with 23 individuals (Supplementary Table S2). If Iranian and Pakistani populations were considered individually, the bias in r2 estimates increased because of the smaller sample size in the individual populations. These results show that correction of r2 for sample size is necessary.
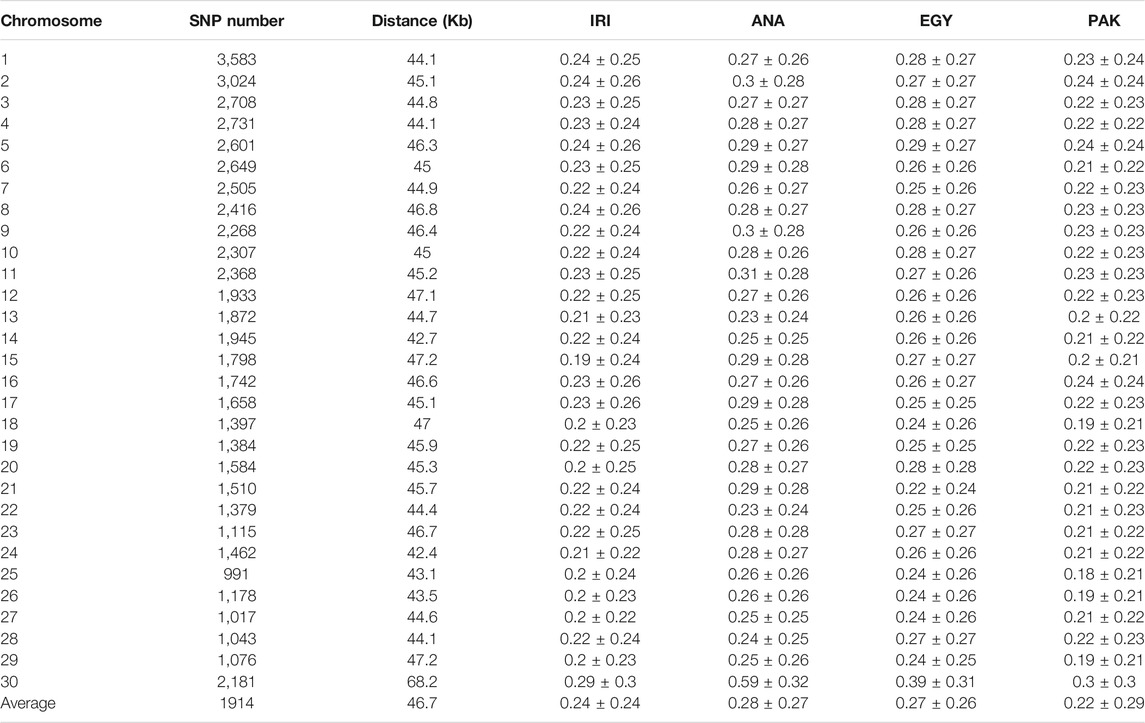
TABLE 2. Distance and linkage disequilibrium (corrected r2) between adjacent polymorphic SNPs for IRI, ANA, EGY, and PAK water buffalo populations.
The corrected average r2 values for individual populations from Iran, including AZI, KHU, and MAZ, were consistent and slightly lower than the values reported by Mokhber et al. (2019a) for AZI and KHU but not for MAZ. They found an r2 of 0.27, 0.29, and 0.32 for AZI, KHU, and MAZ, respectively, using a larger dataset for AZI and KHU, but not MAZ. The difference in r2 for MAZ was due to the correction method for average r2 values.
Much lower values that obtaining in the present study were obtained r2 values were obtained using the 90 K Buffalo SNP genotyping array in a study of 430 pure Mediterranean buffaloes and 65 Chinese crossbred buffalo, which gave an r2 of 0.13 and 0.09, respectively (Deng et al., 2019). The mean value r2 for adjacent SNPs in a study of 384 Brazilian Murrah buffaloes using the Bovine HD array in buffalo (Borquis et al., 2014), which provided 16,580 polymorphic loci from the 688,593 markers on the array, obtained and r2 of 0.29. When the 90 K Buffalo Axiom array was used with a sample of 452 Brazilian Murrah buffaloes, 58,585 SNPs were polymorphic, and the same genome-wide r2 of 0.29 was obtained, while the r2 and |D|' for each chromosome were between 0.17 and 0.33 and 0.41 and 0.80, respectively (Cardoso et al., 2015). Using genomic information for 70 Iranian native cattle belonging to seven breeds (10 samples for each breed), Karimi et al. (2015) obtained average r2 for the adjacent SNP markers of between 0.321 and 0.393.
The percentages of adjacent markers in IRI, ANA, EGY, and PAK populations with corrected r2 greater than 0.2 (0.12) were 46, 52, 51, and 47% (Supplementary Table S3). The mean r2 for adjacent markers can be used to assess their suitability for GWAS and the estimation of breeding values. An r2 higher than 0.3 is recommended for GWAS (Ardlie et al., 2002), while an LD of more than 0.2 is considered essential for estimating genomic breeding values (Meuwissen et al., 2001).
The mean and standard deviation of D′, which represents the frequency of recombination events between adjacent SNPs, was 0.74, 0.67, 0.64, and 0.72 for IRI, ANA, EGY, and PAK, respectively (see Supplementary Table S2). A D′ value close to one implies that ancestral haplotypes have not been separated by recombination over time. In general, D′ is more affected by sample size than r2 but less influenced by allele frequency. The pooled Iranian (IRI) population had the highest D' (0.74), while the EGY had the lowest (0.64).
Population history, including mutation, selection, recombination, and migration, affects the genome structure and will be reflected in the value of r2. Factors such as sample size, the threshold for the frequency of rare alleles, the density of SNP, and the distances between markers will also affect the results. Further, the way that samples are selected may distort the diversity estimated for a population. A study on pig breeds using a 50 K SNP array and a large number of samples in each genetic group identified high selection pressure and low diversity in populations as the reasons for the high LD found (Badke et al., 2012). In the present study, we pooled some populations because of the small sample size; in addition, we corrected LD estimates for sample size, and only SNPs with reasonable MAF (>0.05) were included. Because D’ is more sensitive to sample size, we used the corrected r2 values for subsequent analysis of LD decay, PLDP, and Ne.
LD Decay
As expected, the average r2 values decreased with increasing distance between pairwise SNPs for all the studied populations (Figure 3 and Supplementary Table S4). The values for IRI, ANA, EGY, and PAK were 0.367, 0.441, 0.411, and 0.432, respectively, for distances less than 10 Kb and 0.16, 0.24, 0.24, and 0.21, respectively, for distances less than 100Kb, which reduced rapidly to 0.018, 0.042, 0.059 and 0.024 (respectively) for a distance between markers of 1 Mb (Figure 3 and Supplementary Table S4). In all the populations, the LD then remained constant for distances greater than 2 Mb to the longest distance considered (15 Mb) (Supplementary Table S4). The LD decayed slowly in EGY and ANA and in individual Iranian and Pakistani breeds. The highest LD, especially at longer distances, was seen MAZ and KUN. This may be due to the rapid decline of these populations in more recent generations. The effect of correcting r2 was smaller (6–20 percent) for distances <10 kb and increased to more than 50 percent for distances >1 Mb and to 70–80 percent for distances >10 Mb. This suggests that r2 values are more affected at longer distances by population size (Supplementary Table S4). Comparing the LD for individual Iran populations (AZI, KHU, and MAZ) obtained here with Mokhber et al. (2019a), which used a larger sample size (more than 200), LD estimates at >100 Kb were similar, whereas at greater distances, the results were significantly different.
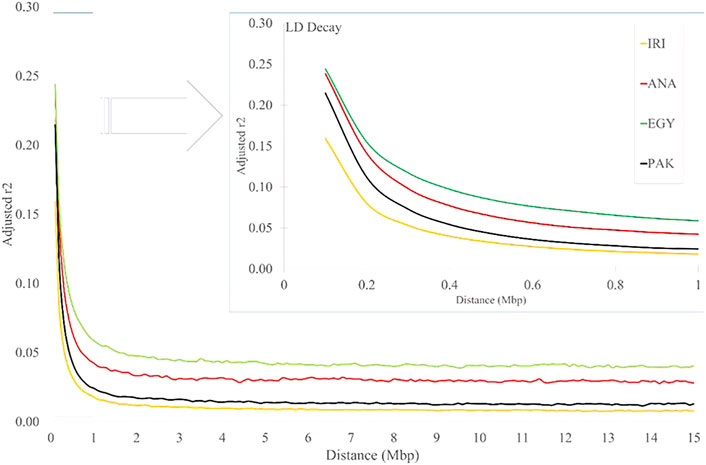
FIGURE 3. LD decay for increasing distance (Mb) for IRI, ANA, EGY, and PAK water buffalo populations.
Lu et al. (2020) calculated the rate of LD decay in Chinese river and swamp buffaloes and found that the LD of river buffaloes was higher than that of a swamp and that the rate of LD decay in swamp buffaloes was higher than for river buffaloes for all marker distances. These data reflect the stronger genetic selection in the river buffalo breeds compared with the swamp breeds. The rate of LD decay in Chinese crossbred buffaloes has been reported to be higher than in pure Mediterranean buffalo at a distance of 600 Kb (Deng et al., 2019), possibly as a result of recent cross-breeding.
A similar situation is seen for cattle where the LD is higher in dairy cattle, which are under stronger selection than beef breeds (Qanbari et al., 2010). The pattern of LD in German Holstein cattle gave an r2 of about 0.3 for a distance less than 25Kb, which decreased to 0.24 for distances of 50–75 Kb (Qanbari et al., 2010), whereas in Australian Holstein bulls, r2 varied from 0.402 to 0.073 as the distance increased from 20 to 500 Kb (Khatkar et al., 2008). For beef cattle, where selection is less intense, the r2 for Angus, Charolais, and crossbred beef breeds (Angus × Charolais) decreased from 0.23 to 0.19, 0.16 to 0.12, and 0.15 to 0.11, respectively, for distances 30 to 100Kb, respectively (Lu et al., 2012).
Persistency of LD Phase
PLDP was calculated from the correlation between paired SNPs at distances of 0–15 Mb. An increase in the distance led to a decrease in PLDP between breeds (see Table 3 and Supplementary Table S4). At distances less than 100Kb, PLPD in all the populations was higher than 0.95 for buffalo populations from Iran, Turkey, Egypt, and Pakistan, which decreased to between 0.7 and 0.97 at 200Kb and then reduced rapidly. However, from 500 Kb to 1 Mb, the reduction in PLPD was less than seen between 200 and 500 Kb (Table 3 and Supplementary Table S5). The PLDP within breeds from the same geographical area that formed pools was higher than the other comparisons (Supplementary Table S5).

TABLE 3. Consistency of gametic phase at given distances between IRI, ANA, EGY, and PAK water buffalo populations.
PLPD among individual populations from Iran was above 0.95 for a distance less than 100Kb, which is similar results of Mokhber et al. (2019a) who reported values of 0.99, 0.96, and 0.95 at distances less than 100Kb, which reduced to 0.74, 0.25, and 0.12 at distances below than 1 Mb for AZI-KHU, AZI-MAZ, and KHU-MAZ populations, respectively.
These high PLPD values suggest that there may have been genetic exchange among these populations. The highest correlations previously reported among other pure and crossbred buffalo populations were 0.47 at the distance of 100 Kb (Deng et al., 2019), showing that the LD phase between independent populations tends not to be maintained. The value of PLDP among European, African, and African-European cattle breeds has been reported as 0.77, 0.71, and 0.65, respectively, at distances less than 10Kb and below 0.5 at distances greater than 50 Kb (Gautier et al., 2007). In Australian Holstein and New Zealand Jersey breeds, the PLDP correlation was 0.97 (De Roos et al., 2008), which is surprisingly high for breeds with different genetic histories. For beef breeds, PLDP between Charolais and Angus, Charolais and crossbred cattle, and Angus and Crosses was 0.84, 0.81, and 0.77, respectively, at distances less than 70 Kb (Lu et al., 2012), so that exchange of information among these populations should be treated with caution.
Ne
Ne was estimated from the last 500 to recent generations in the present study. A trend of decreasing Ne was observed from more distant to recent generations: from 1,570 to 212, 1,049 to 59, 1,025 to 43, and 1,165 to 131 for IRI, ANA, EGY, and PAK breeds, respectively, from 500 generations ago to three last generations (Figure 4 and Supplementary Table S6). Similar trends for a decline in Ne from past to recent generations have been reported for buffalo (Mokhber et al., 2019b) other species (Sargolzaei et al., 2008; Moradi et al., 2012). The Ne of Canadian and American Holstein cattle decreased from 1,400 to less than 100 from 500 generations ago to recent generations (Sargolzaei et al., 2008). For sheep, the Ne of Zel and Lori-Bakhtiari breeds reduced from 4,900 to 840 and 4,900 to 532 animals from 2000 generations ago to the 20 last generations, respectively (Moradi et al., 2012). Ne for Sunite, German Mutton Merino, and Dorper sheep breeds has decreased from 1,506 to 207, 1,678 to 74, and 1,506 to 67, respectively, from 2000 generations ago to the seven last generations (Zhao et al., 2014).
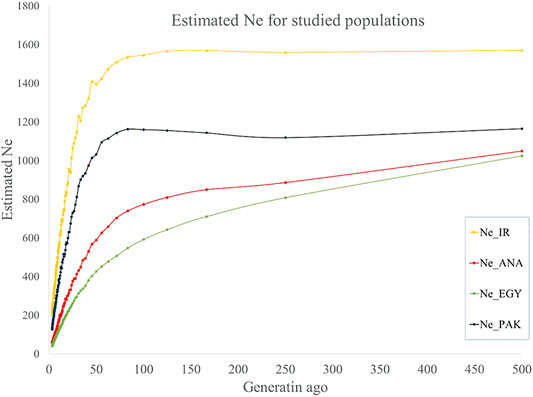
FIGURE 4. Estimated Ne for IRI (pooled Iranian breeds including AZI, KHU, and MAZ), ANA, EGY, and PAK (pooled Pakistani breeds including KHU and NIL) water buffalo populations for past generations.
The conservation of genetic and biological diversity is dependent on Ne (Wang, 2005). According to the FAO (1992), when Ne is equal to 25, 50, 125, 250, and 500, genetic diversity will shrink 18, 10, 4, 1.6, and 0.8 percent over 10 next generations, respectively. Evidence accumulated since 1980 shows that a Ne of more than 100 is necessary to maintain fitness over the subsequent 10 generations. Meuwissen (2009) showed that, with Ne greater than 100 individuals, the population would be sufficiently genetic diverse to survive in the long term, while to conserve the evolutionary potential of the population, it is better than Ne is more than 1,000 individuals (Frankham et al., 2014).
The present study showed that Ne of Iranian and Pakistani populations are greater than the population size threshold necessary to be genetically viable (Meuwissen, 2009). The main concern for all the studied populations is the rapid reduction in Ne in recent generations. Therefore, controlling the decline in Ne and increase in efficiency of economic production, e.g., by well-designed breeding programs, is necessary to prevent increasing inbreeding and eventually genetic extinction.
Conclusion
In the present study, the LD structure, PLDP, and Ne were determined for seven buffalo populations and two populations pooled based on country or origin. The level of LD found indicated that it is appropriate to use the Affymetrix Axiom 90 K SNP genomic array for GWAS and GS in these populations. The correlation between the LD information and PLDP between geographically close populations was high, meaning that genomic information from one population can be used efficiently to predict genetic effects in another. We found that results are affected by sample size, which could be partially corrected for; however, additional data should be obtained to be confident of the results. The Ne in recent generations has declined to the extent that breeding plans are urgently required to ensure that these buffalo populations are not at risk of being lost.
Data Availability Statement
The original contributions presented in the study are included in the article/Supplementary Material; further inquiries can be directed to the corresponding author.
Ethics Statement
Ethical review and approval was not required as no animal work was undertaken and the data were obtained from research published by Colli et al. (2018).
Author Contributions
SR, MG, MM, and JW participated in the conception and design of the study. SR and MM analyzed the data. MG and MM drafted the manuscript. MM and JW revised themanuscript. All authors read and approved thefinal manuscript.
Conflict of Interest
The authors declare that the research was conducted in the absence of any commercial or financial relationships that could be construed as a potential conflict of interest.
Publisher’s Note
All claims expressed in this article are solely those of the authors and do not necessarily represent those of their affiliated organizations or those of the publisher, the editors, and the reviewers. Any product that may be evaluated in this article or claim that may be made by its manufacturer is not guaranteed or endorsed by the publisher.
Acknowledgments
MG and MM are supported by the Urmia University and JW was supported by the project LEO: Livestock Environment Open Data, 16.2—PSRN 2014-2020, funded through Fondo Europeo Agricolo per lo Sviluppo Rurale (FEASR).
Supplementary Material
The Supplementary Material for this article can be found online at: https://www.frontiersin.org/articles/10.3389/fgene.2021.608186/full#supplementary-material
Supplementary Figure S1 | Principal components analysis based on the genomic kinship coefficients between all studied individuals.
Supplementary Figure S2 | Principal components analysis based on the genomic kinship coefficients between all studied individuals.
Supplementary Figure S3 to 11 | LD decay over physical distance for AZI, KHU, MAZ, IRI, ANA, EGY, KUN, NIL, and PAK, separated for each population and chromosomes.
Supplementary Table S1 | Genetic diversity between all studied populations by unbiased FST statistics.
Supplementary Table S2 | Table of mean| D'| and uncorrected and corrected r2 values for AZI, KHU, MAZ, IRI, ANA, EGY, KUN, NIL, and PAK buffalo populations.
Supplementary Table S3 | Frequency of r2 and |D'| values for AZI, KHU, MAZ, IRI, ANA, EGY, KUN, NIL, and PAK buffalo populations.
Supplementary Table S4 | Average LD decay over physical distance for AZI, KHU, MAZ, IRI, ANA, EGY, KUN, NIL, and PAK buffalo populations.
Supplementary Table S5 | Consistency of gametic phase at given distances for AZI, KHU, MAZ, IRI, ANA, EGY, KUN, NIL, and PAK buffalo breed pairs.
Supplementary Table S6 | Effective population size for AZI, KHU, MAZ, IRI, ANA, EGY, KUN, NIL, and PAK buffalo breed in a given number of generations ago.
References
Abecasis, G. R., Noguchi, E., Heinzmann, A., Traherne, J. A., Bhattacharyya, S., and Cookson, W. O. (2001). Extent and Distribution of Linkage Disequilibrium in Three Genomic Regions. Am. J. Hum. Genet. 68, 191–197. doi:10.1086/316944
Al-Mamun, H. A., A Clark, S., Kwan, P., and Gondro, C. (2015). Genome-wide Linkage Disequilibrium and Genetic Diversity in Five Populations of Australian Domestic Sheep. Genet. Sel Evol. 47, 90. doi:10.1186/s12711-015-0169-6
Alexander, D. H., Novembre, J., and Lange, K. (2009). Fast Model-Based Estimation of Ancestry in Unrelated Individuals. Genome Res. 19 (9), 1655–1664. doi:10.1101/gr.094052.109
Alhaddad, H., Khan, R., Grahn, R. A., Gandolfi, B., Mullikin, J. C., Cole, S. A., et al. (2013). Extent of Linkage Disequilibrium in the Domestic Cat, Felis silvestris Catus, and its Breeds. PLoS One 8 (1), e53537. doi:10.1371/journal.pone.0053537
Ardlie, K. G., Kruglyak, L., and Seielstad, M. (2002). Patterns of Linkage Disequilibrium in the Human Genome. Nat. Rev. Genet. 3, 299–309. doi:10.1038/nrg777
Azizi, Z., Moradi Shahrbabak, H., Moradi Shahrbabak, M., Rafat, S. A., and Shodja, J. (2016). Genetic Classification of Azari and North Ecotype Buffalo Population Using SVM Method. Iranian J. Anim. Sci. 47 (2), 279–290. doi:10.22059/ijas.2016.59033
Badke, Y. M., Bates, R. O., Ernst, C. W., Schwab, C., and Steibel, J. P. (2012). Estimation of Linkage Disequilibrium in Four US Pig Breeds. BMC Genomics 13, 24. doi:10.1186/1471-2164-13-24
Barbato, M., Orozco-terWengel, P., Tapio, M., and Bruford, M. W. (2015). SNeP: a Tool to Estimate Trends in Recent Effective Population Size Trajectories Using Genome-wide SNP Data. Front. Genet., 6, 109.doi:10.3389/fgene.2015.00109
Biegelmeyer, P., Gulias-Gomes, C. C., Caetano, A. R., Steibel, J. P., and Cardoso, F. F. (2016). Linkage Disequilibrium, Persistence of Phase and Effective Population Size Estimates in Hereford and Braford Cattle. BMC Genet. 17 (1), 32. doi:10.1186/s12863-016-0339-8
Bohmanova, J., Sargolzaei, M., and Schenkel, F. S. (2010). Characteristics of Linkage Disequilibrium in North American Holsteins. BMC Genomics 11, 421–435. doi:10.1186/1471-2164-11-421
Borquis, R. R. A., Baldi, F., de Camargo, G. M. F., Cardoso, D. F., Santos, D. J. A., Lugo, N. H., et al. (2014). Water buffalo Genome Characterization by the Illumina BovineHD BeadChip. Genet. Mol. Res. 13, 4202–4215. doi:10.4238/2014.june.9.6
Brito, L. F., Jafarikia, M., Grossi, D. A., Kijas, J. W., Porto-Neto, L. R., Ventura, R. V., et al. (2015). Characterization of Linkage Disequilibrium, Consistency of Gametic Phase and Admixture in Australian and Canadian Goats. BMC Genet. 16 (1), 67. doi:10.1186/s12863-015-0220-1
Browning, S. R., and Browning, B. L. (2007). Rapid and Accurate Haplotype Phasing and Missing-Data Inference for Whole-Genome Association Studies by Use of Localized Haplotype Clustering. Am. J. Hum. Genet. 81 (5), 1084–1097. doi:10.1086/521987
Cardoso, D., Aspilcueta-Borquis, A., Santos, D., Hurtado-Lugo, H. N., De Camargo, G., Scalez, D., et al. (2015). “Study of Linkage Disequilibrium in Brazilian Dairy Buffaloes,” in Proceedings, 10th World Congress on Genetics Applied to Livestock Production, Vancouver, August 17–22, 2014.
Colli, L., Milanesi, M., Vajana, E., Iamartino, D., Bomba, L., Puglisi, F., et al. (2018). New Insights on Water Buffalo Genomic Diversity and Post-Domestication Migration Routes from Medium Density SNP Chip Data. Front. Genet. 9, 53. doi:10.3389/fgene.2018.00053
Corbin, L. J., Blott, S. C., Swinburne, J. E., Vaudin, M., Bishop, S. C., and Woolliams, J. A. (2010). Linkage Disequilibrium and Historical Effective Population Size in the Thoroughbred Horse. Anim. Genet. 41 (Suppl. 2), 8–15. doi:10.1111/j.1365-2052.2010.02092.x
Corbin, L. J., Liu, A. Y. H., Bishop, S. C., and Woolliams, J. A. (2012). Estimation of Historical Effective Population Size Using Linkage Disequilibria with Marker Data. J. Anim. Breed. Genet. 129 (4), 257–270. . doi:10.1111/j.1439-0388.2012.01003.x
De Roos, A. P. W., Hayes, B. J., Spelman, R. J., and Goddard, M. E. (2008). Linkage Disequilibrium and Persistence of Phase in Holstein-Friesian, Jersey and Angus Cattle. Genetics 179, 1503–1512. doi:10.1534/genetics.107.084301
Decker, J. E., McKay, S. D., Rolf, M. M., Kim, J., Molina Alcalá, A., Sonstegard, T. S., et al. (2014). Worldwide Patterns of Ancestry, Divergence, and Admixture in Domesticated Cattle. Plos Genet. 10, e1004254. doi:10.1371/journal.pgen.1004254
Deng, T., Liang, A., Liu, J., Hua, G., Ye, T., Liu, S., et al. (2019). Genome-wide Snp Data Revealed the Extent of Linkage Disequilibrium, Persistence of Phase and Effective Population Size in Purebred and Crossbred buffalo Populations. Front. Genet. 9, 688. doi:10.3389/fgene.2018.00688
Frankham, R., Bradshaw, C. J. A., and Brook, B. W. (2014). Genetics in Conservation Management: Revised Recommendations for the 50/500 Rules, Red List Criteria and Population Viability Analyses. Biol. Conservation 170, 56–63. doi:10.1016/j.biocon.2013.12.036
Frankham, R. (2005). Stress and Adaptation in Conservation Genetics. J. Evol. Biol 18 (4), 750–755. doi:10.1111/j.1420-9101.2005.00885.x
Fu, W., Dekkers, J. C., Lee, W. R., and Abasht, B. (2015). Linkage Disequilibrium in Crossbred and Pure Line Chickens. Genet. Sel Evol. 47 (1), 11. doi:10.1186/s12711-015-0098-4
Gautier, M., Faraut, T., Moazami-Goudarzi, K., Navratil, V., Foglio, M., Grohs, C., et al. (2007). Genetic and Haplotypic Structure in 14 European and African Cattle Breeds. Genetics 177, 1059–1070. doi:10.1534/genetics.107.075804
Ghoreishifar, S. M., Moradi-Shahrbabak, H., Fallahi, M. H., Jalil Sarghale, A., Moradi-Shahrbabak, M., Abdollahi-Arpanahi, R., et al. (2020). Genomic Measures of Inbreeding Coefficients and Genome-wide Scan for Runs of Homozygosity Islands in Iranian River buffalo, Bubalus Bubalis. BMC Genet. 21 (1), 16–12. doi:10.1186/s12863-020-0824-y
Gianola, D., Qanbari, S., and Simianer, H. (2013). An Evaluation of a Novel Estimator of Linkage Disequilibrium. Heredity 111, 275–285. doi:10.1038/hdy.2013.46
Hayes, B. J., Visscher, P. M., McPartlan, H. C., and Goddard, M. E. (2003). Novel Multilocus Measure of Linkage Disequilibrium to Estimate Past Effective Population Size. Genome Res. 13 (4), 635–643. doi:10.1101/gr.387103
Hill, W. G., and Weir, B. S. (1994). Maximum-likelihood Estimation of Gene Location by Linkage Disequilibrium. Am. J. Hum. Genet. 54, 705–714.
Hill, W. G., and Robertson, A. (1968). Linkage Disequilibrium in Finite Populations. Theoret. Appl. Genet. 38 (6), 226–231. doi:10.1007/bf01245622
Hui, T. J., and Burt, A. (2020). Estimating Linkage Disequilibrium from Genotypes under Hardy-Weinberg Equilibrium. BMC Genet. 21 (1), 21–11. . doi:10.1186/s12863-020-0818-9
Iamartino, D., Nicolazzi, E. L., Van Tassell, C. P., Reecy, J. M., Fritz-Waters, E. R., Koltes, J. E., et al. (2017). Design and Validation of a 90K SNP Genotyping Assay for the Water Buffalo (Bubalus Bubalis). PLoS ONE 12, e0185220. doi:10.1371/journal.pone.0185220
Jemaa, S. B., Thamri, N., Mnara, S., Rebours, E., Rocha, D., and Boussaha, M. (2019). Linkage Disequilibrium and Past Effective Population Size in Native Tunisian Cattle. Genet. Mol. Biol. 42 (1), 52–61. doi:10.1590/1678-4685-gmb-2017-0342
Jombart, T., and Ahmed, I. (2011). Adegenet 1.3-1: New Tools for the Analysis of Genome-wide SNP Data. Bioinformatics 27 (21), 3070–3071. . doi:10.1093/bioinformatics/btr521
Karimi, K., Esmailizadeh Koshkoiyeh, A., and Gondro, C. (2015). Comparison of Linkage Disequilibrium Levels in Iranian Indigenous Cattle Using Whole Genome SNPs Data. J. Anim. Sci. Technol. 57 (1), 47. doi:10.1186/s40781-015-0080-2
Khatkar, M. S., Nicholas, F. W., Collins, A. R., Zenger, K. R., Cavanagh, J. A., Barris, W., et al. (2008). Extent of Genome-wide Linkage Disequilibrium in Australian Holstein-Friesian Cattle Based on a High-Density SNP Panel. BMC genomics 9, 187. doi:10.1186/1471-2164-9-187
Lewontin, R. C. (1988). On Measures of Gametic Disequilibrium. Genetics 120, 849–852. doi:10.1093/genetics/120.3.849
Lu, D., Sargolzaei, M., Kelly, M., Li, C., VanderVoort, G., Wang, Z., et al. (2012). Linkage Disequilibrium in Angus, Charolais, and Crossbred Beef Cattle. Front. Gene 3, 152. doi:10.3389/fgene.2012.00152
Lu, X. R., Duan, A. Q., Li, W. Q., Abdel-Shafy, H., Rushdi, H. E., Liang, S. S., et al. (2020). Genome-wide Analysis Reveals Genetic Diversity, Linkage Disequilibrium, and Selection for Milk Production Traits in Chinese buffalo Breeds. J. Dairy Sci. 103, 4545. doi:10.3168/jds.2019-17364
McKay, S. D., Schnabel, R. D., Murdoch, B. M., Matukumalli, L. K., Aerts, J., Coppieters, W., et al. (2007). Whole Genome Linkage Disequilibrium Maps in Cattle. BMC Genet. 8, 74. doi:10.1186/1471-2156-8-74
Meadows, J. R., Chan, E. K., and Kijas, J. W. (2008). Linkage Disequilibrium Compared Between Five Populations of Domestic Sheep. BMC Genet. 9 (1), 1–10. doi:10.1186/1471-2156-9-61
Meuwissen, T. (2009). Genetic Management of Small Populations: A Review. Acta Agriculturae Scand. Section A - Anim. Sci. 59 (2), 71–79. . doi:10.1080/09064700903118148
Meuwissen, T. H. E., Hayes, B. J., and Goddard, M. E. (2001). Prediction of Total Genetic Value Using Genome-wide Dense Marker Maps. Genetics 157, 1819–1829. doi:10.1093/genetics/157.4.1819
Minervino, A. H. H., Zava, M., Vecchio, D., and Borghese, A. (2020). Bubalus Bubalis: A Short story. Front. Vet. Sci., 7, 971.doi:10.3389/fvets.2020.570413
Mokhber, M., Moradi Shahre Babak, M., Sadeghi, M., Moradi Shahrbabak, H., and Rahmani-Nia, J. (2019b). Estimation of Effective Population Size of Iranian Water buffalo by Genomic Data. Iranian J. Anim. Sci. 50 (3), 197–205. .
Mokhber, M., Moradi-Shahrbabak, M., Sadeghi, M., Moradi-Shahrbabak, H., Stella, A., Nicolzzi, E., et al. (2018). A Genome-wide Scan for Signatures of Selection in Azeri and Khuzestani buffalo Breeds. BMC genomics 19, 449. doi:10.1186/s12864-018-4759-x
Mokhber, M., Shahrbabak, M. M., Sadeghi, M., Shahrbabak, H. M., Stella, A., Nicolzzi, E., et al. (2019a). Study of Whole Genome Linkage Disequilibrium Patterns of Iranian Water buffalo Breeds Using the Axiom Buffalo Genotyping 90K Array. PLoS One 14, e0217687. doi:10.1371/journal.pone.0217687
Mokry, F. B., Buzanskas, M. E., de Alvarenga Mudadu, M., do Amaral Grossi, D., Higa, R. H., Ventura, R. V., et al. (2014). Linkage Disequilibrium and Haplotype Block Structure in a Composite Beef Cattle Breed. BMC Genomics 15 (Suppl. 7), S6. doi:10.1186/1471-2164-15-S7-S6
Moradi, M. H., Nejati-Javaremi, A., Moradi-Shahrbabak, M., Dodds, K. G., and McEwan, J. C. (2012). Genomic Scan of Selective Sweeps in Thin and Fat Tail Sheep Breeds for Identifying of Candidate Regions Associated with Fat Deposition. BMC Genet. 13, 10. doi:10.1186/1471-2156-13-10
Mueller, J. C. (2004). Linkage Disequilibrium for Different Scales and Applications. Brief. Bioinform. 5, 355–364. doi:10.1093/bib/5.4.355
Niu, H., Zhu, B., Guo, P., Zhang, W., Xue, J., Chen, Y., et al. (2016). Estimation of Linkage Disequilibrium Levels and Haplotype Block Structure in Chinese Simmental and Wagyu Beef Cattle Using High-Density Genotypes. Livestock Sci. 190, 1–9. doi:10.1016/j.livsci.2016.05.012
Pfahler, S., and Distl, O. (2015). Effective Population Size, Extended Linkage Disequilibrium and Signatures of Selection in the Rare Dog Breed Lundehund. PloS one 10 (4), e0122680. doi:10.1371/journal.pone.0122680
Price, A. L., Patterson, N. J., Plenge, R. M., Weinblatt, M. E., Shadick, N. A., and Reich, D. (2006). Principal Components Analysis Corrects for Stratification in Genome-wide Association Studies. Nat. Genet. 38, 904–909. doi:10.1038/ng1847
Pritchard, J. K., and Przeworski, M. (2001). Linkage Disequilibrium in Humans: Models and Data. Am. J. Hum. Genet. 69, 1–14. doi:10.1086/321275
Pritchard, J. K., Stephens, M., and Donnelly, P. (2000). Inference of Population Structure Using Multilocus Genotype Data. Genetics 155, 945–959. doi:10.1093/genetics/155.2.945
Purcell, S., Neale, B., Todd-Brown, K., Thomas, L., Ferreira, M. A. R., Bender, D., et al. (2007). PLINK: A Tool Set for Whole-Genome Association and Population-Based Linkage Analyses. Am. J. Hum. Genet. 81, 559–575. doi:10.1086/519795
Qanbari, S., Pimentel, E. C., Tetens, J., Thaller, G., Lichtner, P., Sharifi, A. R., et al. (2010). The Pattern of Linkage Disequilibrium in German Holstein Cattle. Anim. Genet. 41, 346–356. doi:10.1111/j.1365-2052.2009.02011.x
Qanbari, S. (2020). On the Extent of Linkage Disequilibrium in the Genome of Farm Animals. Front. Genet. 10, 1304. doi:10.3389/fgene.2019.01304
Rahmaninia, J., Miraei-Ashtiani, S. R., and Moradi Shahrbabak, H. (2015). Unsupervised Clustering Analysis of Population and Subpopulation Structure Using Dense SNP Markers. Iranian J. Anim. Sci. 46 (3), 277–287.
Sargolzaei, M., Schenkel, F. S., Jansen, G. B., and Schaeffer, L. R. (2008). Extent of Linkage Disequilibrium in Holstein Cattle in North America. J. Dairy Sci. 91, 2106–2117. doi:10.3168/jds.2007-0553
Shin, J.-B., Krey, J. F., Hassan, A., Metlagel, Z., Tauscher, A. N., Pagana, J. M., Sherman, N. E., Jeffery, E. D., Spinelli, K. J., Zhao, H., Wilmarth, P. A., Choi, D., David, L. L., Auer, M., and Barr-Gillespie, P. G. (2013). Molecular Architecture of the Chick Vestibular Hair Bundle. Nat. Neurosci. 16 (3), 365–374. doi:10.1038/nn.3312
Soysal, M. I., Tuna, Y. T., Gurcan, E. K., Ozkan, E., Kok, S., Castellano, N., et al. (2007). Anatolian Water Buffaloes Husbandry in Turkey: Preliminary Results on Somatic Characterization. Ital. J. Anim. Sci. 6 (Suppl. 2), 1302–1307. . doi:10.4081/ijas.2007.s2.1302
Strillacci, M. G., Moradi-Shahrbabak, H., Davoudi, P., Ghoreishifar, S. M., Mokhber, M., Masroure, A. J., et al. (2021). A Genome-wide Scan of Copy Number Variants in Three Iranian Indigenous River Buffaloes. BMC genomics 22 (1), 305–314. . doi:10.1186/s12864-021-07604-3
Sved, J. A. (1971). Linkage Disequilibrium and Homozygosity of Chromosome Segments in Finite Populations. Theor. Popul. Biol. 2, 125–141. doi:10.1016/0040-5809(71)90011-6
Sved, J. A. (2009). Linkage Disequilibrium and its Expectation in Human Populations. Twin Res. Hum. Genet. 12, 35–43. doi:10.1375/twin.12.1.35
Tenesa, A., Navarro, P., Hayes, B. J., Duffy, D. L., Clarke, G. M., Goddard, M. E., et al. (2007). Recent Human Effective Population Size Estimated from Linkage Disequilibrium. Genome Res. 17, 520–526. doi:10.1101/gr.6023607
Terwilliger, J. D. (1995). A Powerful Likelihood Method for the Analysis of Linkage Disequilibrium between Trait Loci and One or More Polymorphic Marker Loci. Am. J. Hum. Genet. 56, 777–787.
Villa-Angulo, R., Matukumalli, L. K., Gill, C. A., Choi, J., Van Tassell, C. P., and Grefenstette, J. J. (2009). High-resolution Haplotype Block Structure in the Cattle Genome. BMC Genet. 10, 19. doi:10.1186/1471-2156-10-19
Vonholdt, B. M., Stahler, D. R., Bangs, E. E., Smith, D. W., Jimenez, M. D., Mack, C. M., Niemeyer, C. C., Pollinger, J. P., and Wayne, R. K. (2010). A Novel Assessment of Population Structure and Gene Flow in Grey Wolf Populations of the Northern Rocky Mountains of the United States. Mol. Ecol. 19 (20), 4412–4427. doi:10.1111/j.1365-294x.2010.04769.x
Wang, J. (2005). Estimation of Effective Population Sizes From Data on Genetic Markers. Philos. Trans. R. Soc. Lond. B Biol. Sci. 360 (1459), 1395–1409.
Wang, L., Sørensen, P., Janss, L., Ostersen, T., and Edwards, D. (2013). Genome-wide and Local Pattern of Linkage Disequilibrium and Persistence of Phase for 3 Danish Pig Breeds. BMC Genet. 14 (1), 115. doi:10.1186/1471-2156-14-115
Waples, R. K., Larson, W. A., and Waples, R. S. (2016). Estimating Contemporary Effective Population Size in Non-model Species Using Linkage Disequilibrium across Thousands of Loci. Heredity 117, 233–240. doi:10.1038/hdy.2016.60
Weir, B. S., and Hill, W. G. (1980). Effect of Mating Structure on Variation in Linkage Disequilibrium. Genetics 95, 477–488. doi:10.1093/genetics/95.2.477
Wultsch, C., Waits, L. P., and Kelly, M. J. (2016). A Comparative Analysis of Genetic Diversity and Structure in Jaguars (Panthera onca), Pumas (Puma Concolor), and Ocelots (Leopardus Pardalis) in Fragmented Landscapes of a Critical Mesoamerican Linkage Zone. PloS one 11 (3), 0151043. doi:10.1371/journal.pone.0151043
Zhao, H., Nettleton, D., and Dekkers, J. C. M. (2007). Evaluation of Linkage Disequilibrium Measures between Multi-Allelic Markers as Predictors of Linkage Disequilibrium between Single Nucleotide Polymorphisms. Genet. Res. 89, 1–6. doi:10.1017/s0016672307008634
Zhao, H., Nettleton, D., Soller, M., and Dekkers, J. C. M. (2005). Evaluation of Linkage Disequilibrium Measures between Multi-Allelic Markers as Predictors of Linkage Disequilibrium between Markers and QTL. Genet. Res. 86, 77–87. doi:10.1017/S001667230500769X
Keywords: water buffalo, linkage disequilibrium, LD phase persistency, NE, linkage disequilibrium, LD phase persistency
Citation: Rahimmadar S, Ghaffari M, Mokhber M and Williams JL (2021) Linkage Disequilibrium and Effective Population Size of Buffalo Populations of Iran, Turkey, Pakistan, and Egypt Using a Medium Density SNP Array. Front. Genet. 12:608186. doi: 10.3389/fgene.2021.608186
Received: 19 September 2020; Accepted: 03 November 2021;
Published: 07 December 2021.
Edited by:
Guohua Hua, Huazhong Agricultural University, ChinaReviewed by:
Romdhane Rekaya, University of Georgia, United StatesRostam Abdollahi, University of Georgia, United States
Mohammad Bagher Zandi, University of Zanjan, Iran
Copyright © 2021 Rahimmadar, Ghaffari, Mokhber and Williams. This is an open-access article distributed under the terms of the Creative Commons Attribution License (CC BY). The use, distribution or reproduction in other forums is permitted, provided the original author(s) and the copyright owner(s) are credited and that the original publication in this journal is cited, in accordance with accepted academic practice. No use, distribution or reproduction is permitted which does not comply with these terms.
*Correspondence: Mokhtar Ghaffari, YXJhei4xMTMwNkBnbWFpbC5jb20=