 S. Akila Parvathy Dharshini
 Sherlyn Jemimah1
 Y. H. Taguchi
 M. Michael Gromiha
- 1Protein Bioinformatics Lab, Department of Biotechnology, Indian Institute of Technology Madras, Chennai, India
- 2Department of Physics, Chuo University, Hachioji, Japan
Alzheimer’s disease (AD) and Parkinson’s disease (PD) are well-known neuronal degenerative disorders that share common pathological events. Approved medications alleviate symptoms but do not address the root cause of the disease. Energy dysfunction in the neuronal population leads to various pathological events and ultimately results in neuronal death. Identifying common therapeutic targets for these disorders may help in the drug discovery process. The Brodmann area 9 (BA9) region is affected in both the disease conditions and plays an essential role in cognitive, motor, and memory-related functions. Analyzing transcriptome data of BA9 provides deep insights related to common pathological pathways involved in AD and PD. In this work, we map the preprocessed BA9 fastq files generated by RNA-seq for disease and control samples with reference hg38 genomic assembly and identify common variants and differentially expressed genes (DEG). These variants are predominantly located in the 3′ UTR (non-promoter) region, affecting the conserved transcription factor (TF) binding motifs involved in the methylation and acetylation process. We have constructed BA9-specific functional interaction networks, which show the relationship between TFs and DEGs. Based on expression signature analysis, we propose that MAPK1, VEGFR1/FLT1, and FGFR1 are promising drug targets to restore blood-brain barrier functionality by reducing neuroinflammation and may save neurons.
Introduction
Neurodegenerative disorders, the most debilitating form of progressive disorders, include Alzheimer’s disease (AD) and Parkinson’s disease (PD). The progression of neurodegeneration is associated with various symptoms based on the regions of neuronal cell death. These disorders share common pathological events such as selective vulnerability, insulin resistance, vascular dysfunction, protein aggregation, oxidative stress, calcium-induced glutamate toxicity, inflammatory response, aging, and ultimately neuronal death (Craft, 2007; Piehl and Olsson, 2009; Gan et al., 2018; Sweeney et al., 2018a; Muddapu et al., 2020). Genome-wide association studies, gene expression analysis from various tissue locations, and protein network studies reveal that genes related to mitochondria quality control, ubiquitin-mediated degradation, and endothelial tight junction genes are dysregulated in disease conditions (Guttula et al., 2012; Borrageiro et al., 2018; Lanke et al., 2018; Raj et al., 2018). Computational and experimental studies emphasize the deregulation of genes involved in energy metabolism and protein degradation processes that lead to neurodegeneration (Wang and Michaelis, 2010; Ciryam et al., 2016; Dharshini et al., 2019). Most microarray data and large-scale co-expression network studies suggest the importance of energy metabolism associated with neurodegeneration (Wang et al., 2007; Liang et al., 2008; Wang and Michaelis, 2010; Levine et al., 2013; Tiwari and Patel, 2014).
The neurovascular system plays an essential role in energy metabolism. Impairment in the blood-brain barrier (BBB) through various stress stimuli or cytotoxic inflammatory response affects glucose uptake and metabolism (Abbott, 2002; Freeman and Keller, 2012). Further, the neuronal population exhibits elevated energy demand for maintaining structural functional integrity and the regulation of homeostasis. In addition, it escalates the ROS (reactive oxygen species) response, depletion of antioxidants, and oxidative phosphorylation metabolism, which leads to neuronal stress and ultimately damaging the cell. These studies showed an imbalance in the energy reservoirs in the neuronal system, and it is necessary to revisit the pathways, which are essential in overcoming this energy imbalance. However, there is no systematic analysis of transcriptomic data on common therapeutic pathways for these diseases.
On the other hand, currently approved medications are meant to alleviate symptoms and slow down disease progression. There are no available therapeutics to save the surviving neuronal population. To determine potential therapeutic strategies, it is essential to identify the underlying cause of the disease.
At the early stages of the disease, hippocampal cornu ammonis 1 neurons (CA1) (Wilde et al., 1997) in Alzheimer’s and substantia nigra pars compacta neurons (SNc) in Parkinson’s disease (Damier et al., 1999) are more vulnerable to cell death compared to other neuronal populations. Various imaging techniques showed that these neurons are significantly reduced in patients (Karagulle et al., 2008; DeKosky and Scheff, 1990). These vulnerable neurons possess more synaptic terminals, i.e., dense arborization, and these complex structural phenomena may affect these neurons tremendously compared to other neuronal populations. This study aims to explore the common therapeutic target for neurodegenerative disorders. Since AD and PD share common pathological and symptomatic etiologies, the analysis of tissues affected by both diseases may help identify potential treatment targets. Brodmann area 9 (BA9) plays a key role in cognitive skills, executive memory, and motor behavior, and patients with AD and PD have demonstrated skills impairment, as mentioned earlier. In addition, reduced BA9 neuronal activity is observed in these patients. Since BA9 affects both diseases, we have selected this tissue for further analysis. Identifying variants, differentially expressed genes (DEGs), and tissue-specific network studies from high-throughput BA9 RNA-seq data provide clues for therapeutics.
We identified 167 common variants between AD and PD. These variants are also identified in Genome-Wide Association Studies (GWAS) and expression Quantitative Trait Loci studies (eQTL). These variants are predominantly located in the 3′ UTR region, creating or disrupting the conserved regulatory binding motifs and affecting the transcription factor (TF) binding sites located explicitly in the non-promoter region (Albert and Kruglyak, 2015). Several variants affect the conserved TF motif associated with histone acetylation and demethylation, thus impairing downstream gene expression (McGuire et al., 2019). From tissue-specific network analysis, we identified TFs, which activate or repress the differentially expressed (DEG) genes in BA9. Tissue-specific functional module analysis revealed that endothelial and vascular smooth muscle cell pathways are dysregulated. These pathways are vital for preserving blood-brain barrier (BBB) stability and cerebral blood pressure regulation (Zenaro et al., 2017). From this study, we propose that mitogen-activated protein kinase-1 (MAPK1), vascular endothelial growth factor receptor-1 (VEGFR1), and fibroblast growth factor receptor-1 (FGFR1) serve as promising drug targets, which may help to preserve vascular endothelial pathways and reduce chronic inflammation. Further exploring these targets may restore BBB integrity and save neurons from the energy crisis and associated neuronal death.
Materials and Methods
Variant Calling and Predicting the Effect of Variants
The BA9 RNA-seq data were retrieved from a sequence retrieval archive (SRA) for AD, PD, and control samples (Supplementary Table S1), which included nine AD, 28 PD, and 52 age-matched control samples (Dumitriu et al., 2016; Scheckel et al., 2016). The data were retrieved from post-mortem samples after death (2–6 h). The average RNA integrity value for the sample was above 8 which denotes the stability of the mRNA.
The RNA-seq raw reads were preprocessed using the NGSQC toolkit (Wang et al., 2015), and reads with a PHRED score less than 20 were discarded. The index-specific Illumina adapters were removed using the Trim Galore tool (Krueger, 2015). The preprocessed reads were subjected to spliced alignment using hg38 genomic assembly and the STAR2.6 aligner (Dobin et al., 2013). After spliced alignment, the samples’ alignment rates were above 80% (uniquely mapped reads). We eliminated duplicates using PICARD to reduce the erroneous read depth during variant calling. We recalibrated the base quality score near the variant site using the GATK4 (McKenna et al., 2010) recalibrating module. The Haplotype caller was used to identify the variants. We imposed hard filters such as PHRED quality score above 30 (denotes the variant base as 99.99% accurate) and supporting read depth for variant ≥10. We categorized the variants exclusively present in the disease population but not included in the control subjects. We compared the variants with the Genotype-Tissue Expression (GTEx) consortium (Carithers and Moore, 2015), which helps filter out variants located in healthy brain tissues. We compared the identified variants with an xQTL study and discarded the matched hits for considering the aging effect. The xQTL study (Ng et al., 2017) mainly included samples from the healthy aged subjects from BA9. The shortlisted variants were compared with various eQTL and GWAS of AD and PD (Supplementary Table S2; Pankratz et al., 2012; Lambert et al., 2013; Greene et al., 2015; Deming et al., 2017; Jun et al., 2017). We selected common variants present in AD and PD pathogenesis for further analysis. Most of the variants were located in the 3′ UTR region and we predicted the effect of variants on transcription factor binding using Haploreg, SNP2TFBS, and GWAS4D (Ward and Kellis, 2012; Kumar et al., 2017; Huang et al., 2018). The effect of non-coding variants was predicted using the in silico tools CADD, DeepSea, Eigen, GWAVA, Funseq2, FATHMM, and REMM (Dayem Ullah et al., 2018).
3′ UTRs are involved in numerous regulatory processes, including transcript cleavage, RNA binding protein, stability and polyadenylation, translation, and mRNA localization. These 3′ UTRs contain some of the most conserved regulatory elements within the mammalian genome and they serve as binding sites for numerous regulatory RNA binding proteins and microRNAs. The effect of variants on miRNA binding was predicted using miRbase and vista (Dayem Ullah et al., 2018), variants on RNA binding proteins were predicted using the RBP-var web-based tool (Mao et al., 2016), and miRNA binding targets were predicted using the miRDB tool (Chen and Wang, 2020).
Computing the Variant Nucleotide Frequency Based on Genomic Location
We computed the propensity of nucleotides for the identified variants based on their genomic locations [control/AD/PD(BA9)/GWAS(AD/PD)] for determining the preferences of nucleotide changes in AD/PD samples. Supplementary Table S3 shows the frequency of nucleotides based on their genomic location for the reference human genome. From Supplementary Table S3, we observed that the occurrence of nucleotide base T was higher in the intronic and UTR3 regions. The occurrence of C and G was higher compared to other bases in the upstream and UTR5 regions.
We calculated the propensity matrix for the variants using Eqs (2) and (3). For example propensity of i→j (A→T) change in a given sample (control, AD/PD, GWAS) is calculated using the occurrence of i→j change in the specified genomic region (intronic/upstream/UTR3/UTR5/exonic) divided by the occurrence of i in the human genome located in the same genomic region.
Differential Gene Expression
The preprocessed RNA-seq reads were aligned with the hg38 human transcriptome (ensemble genomic build) using the Salmon quantification (Patro et al., 2017). The counts were normalized using transcript length and library size. We calculated the gene abundance using tximport. We performed differential gene expression using DEseq2 (Love et al., 2014), and rigorous statistical testing to filter the gene expression level (Benjamini–Hochberg Q value < 0.05, minimum fold change | log2 FC| > 1). We only selected genes that were upregulated (or) downregulated in both disease conditions from the BA9 RNA-seq profile data. We compared the gene expression fold change with various RNA-seq and microarray datasets available in the literature [single cell (Lau et al., 2020) and other tissue RNA-seq data (Donega et al., 2019; Simchovitz et al., 2020; Srinivasan et al., 2020)]. The identified differentially expressed genes (BA9) were compared with the GTEx consortium to understand the expression pattern in other normal tissues (skin, heart, bladder, kidney, spinal cord, blood, BA9, adipose, small intestine, lungs, and pancreas) that are not affected by these diseases. The median transcript per million counts (TPM) for various normal tissues was compared to BA9 [control and disease (AD/PD)].
Tissue-Specific Functional Interaction/Co-expression Network and Enrichment Analysis
We built a BA9-specific functional interaction network between the variant associated genes, transcription factors (TFs), and differentially expressed genes (DEGs) using Reactome FI, the KEGG parser pathway tuning module, and HIPPIE web tools (Wu et al., 2014; Alanis-Lobato et al., 2017). This study helps to understand the functional relationship between TFs and DEGs. We constructed the co-expression network using the information available in the HumanBase and TCSBN databases (Greene et al., 2015; Lee et al., 2018). This network aids in interpreting genes, which are co-expressed together in BA9. We performed network analysis such as degree and centrality measures to identify the network hubs. The identified DEGs and TFs were subjected to tissue-specific functional module analysis using HumanBase. The functional significance of these gene sets were elucidated by enrichment analysis.
Expression Signature/Perturbagen Analysis
The Connectivity map (cMAP) and LINCS web-based tools include transcriptional expression data accumulated from various perturbations (genetic, small molecule), which help to identify drug molecules based on disease-specific upregulated gene expression profiles (Lamb et al., 2006; Subramanian et al., 2017; Stathias et al., 2020).
1. We submitted the list of upregulated genes to these portals and obtained a set of drug molecules along with their respective targets. The scores ranged from -100 to + 100, which denotes that a given drug molecule is positively or negatively connected with a given target. These scores were derived from cMAP. For this analysis, we selected drug molecules which scored more than 85.
2. We also overlaid drug molecules from various repositories such as chEMBL, DrugBank, and PubChem to the functional interaction network using the Reactome FI cytoscape app.
3. We identified common drug molecules and their respective targets using both methods (1) and (2). We shortlisted the inhibitors and carefully reviewed the literature to understand the functionality of selected targets for further explorative studies. We have represented the workflow in Supplementary Figure S1.
Results
Variant Analysis of BA9 Samples Obtained From AD and PD
We analyzed the BA9 samples of AD and PD and identified 167 variants present in both AD and PD samples, which were not present in the control population. The identified variants from the current study were compared with various GWAS data (AD/PD) to understand whether the variant was already reported for the disease or not. GWAS provides information on the variants predominantly present in the disease population, but the effect of those variants on transcription factor binding, expression, and miRNA binding are not explored. Hence we used in silico tools to predict the impact of the variants. Supplementary Figure S2A shows that 128 variants residing in non-coding regions may play an essential role in gene regulation (Siepel et al., 2005; Araujo et al., 2012). Most of the variants were found in non-coding regions in both control and disease samples. But in the disease sample, the number of 3′ UTR variants was higher compared to other regions. GWAS studies showed that most of the disease-associated variants were located in the regulatory region and in the UTR regions compared to coding segments (Ma et al., 2015; Steri et al., 2018). We also calculated the percentage of variants in each genomic location [control, AD/PD(BA9), and GWAS variants (AD/PD)], and the results are shown in Supplementary Figure S2B. We observed that intronic variants were higher than the coding segments due to the high percentage of the intronic region in the human genome compared to the coding region.
We also computed the nucleotide frequency for the identified variants based on their genomic locations [control/AD/PD(BA9)/GWAS(AD/PD)] for determining the preferences of nucleotide changes in AD/PD samples. In the control dataset, A- > G, T- > C variants were high in the intronic region. In disease samples, the frequency of G- > A, C- > T was high both in the current study and in GWAS studies (Supplementary Table S2). This shows that epitranscriptomic modification plays an essential role in the disease mechanism (Angelova et al., 2018). Detailed information about the nucleotide frequency is represented in Supplementary Table S4.
Mostly identified variants were located in the non-promoter region. Mapping regulatory features such as enhancers and conserved transcription factor binding motifs to these variants may help to predict the effect. Albert and Kruglyak (2015) reported that the 3′ UTR variant found in the CELSR2 gene disrupts the cis-regulatory binding motif of C/EBP transcription factor (TF), and subsequent eQTL studies have shown that this variant affects the gene expression of SORT1 which is 40kb away from the variant site and is involved in myocardial infarction. We predicted the variant effects using various in silico tools (described in the section “Materials and Methods”). Of the 167 identified variants, 103 affected the binding affinity of 47 known transcription factors, which are already implicated in AD and PD. Microarray studies reported in the literature showed that these TFs are dysregulated in both disease conditions (Blalock et al., 2004; Lesnick et al., 2007; Zheng et al., 2010; Narayanan et al., 2014; Wang et al., 2016; Berchtold et al., 2019; Patel et al., 2019; Piras et al., 2019). Table 1 lists some of the crucial variants affecting the conserved regulatory motifs of the transcription factors involved in both diseases. Detailed information about the identified variants and their predicted effects are represented in Supplementary Table S5.
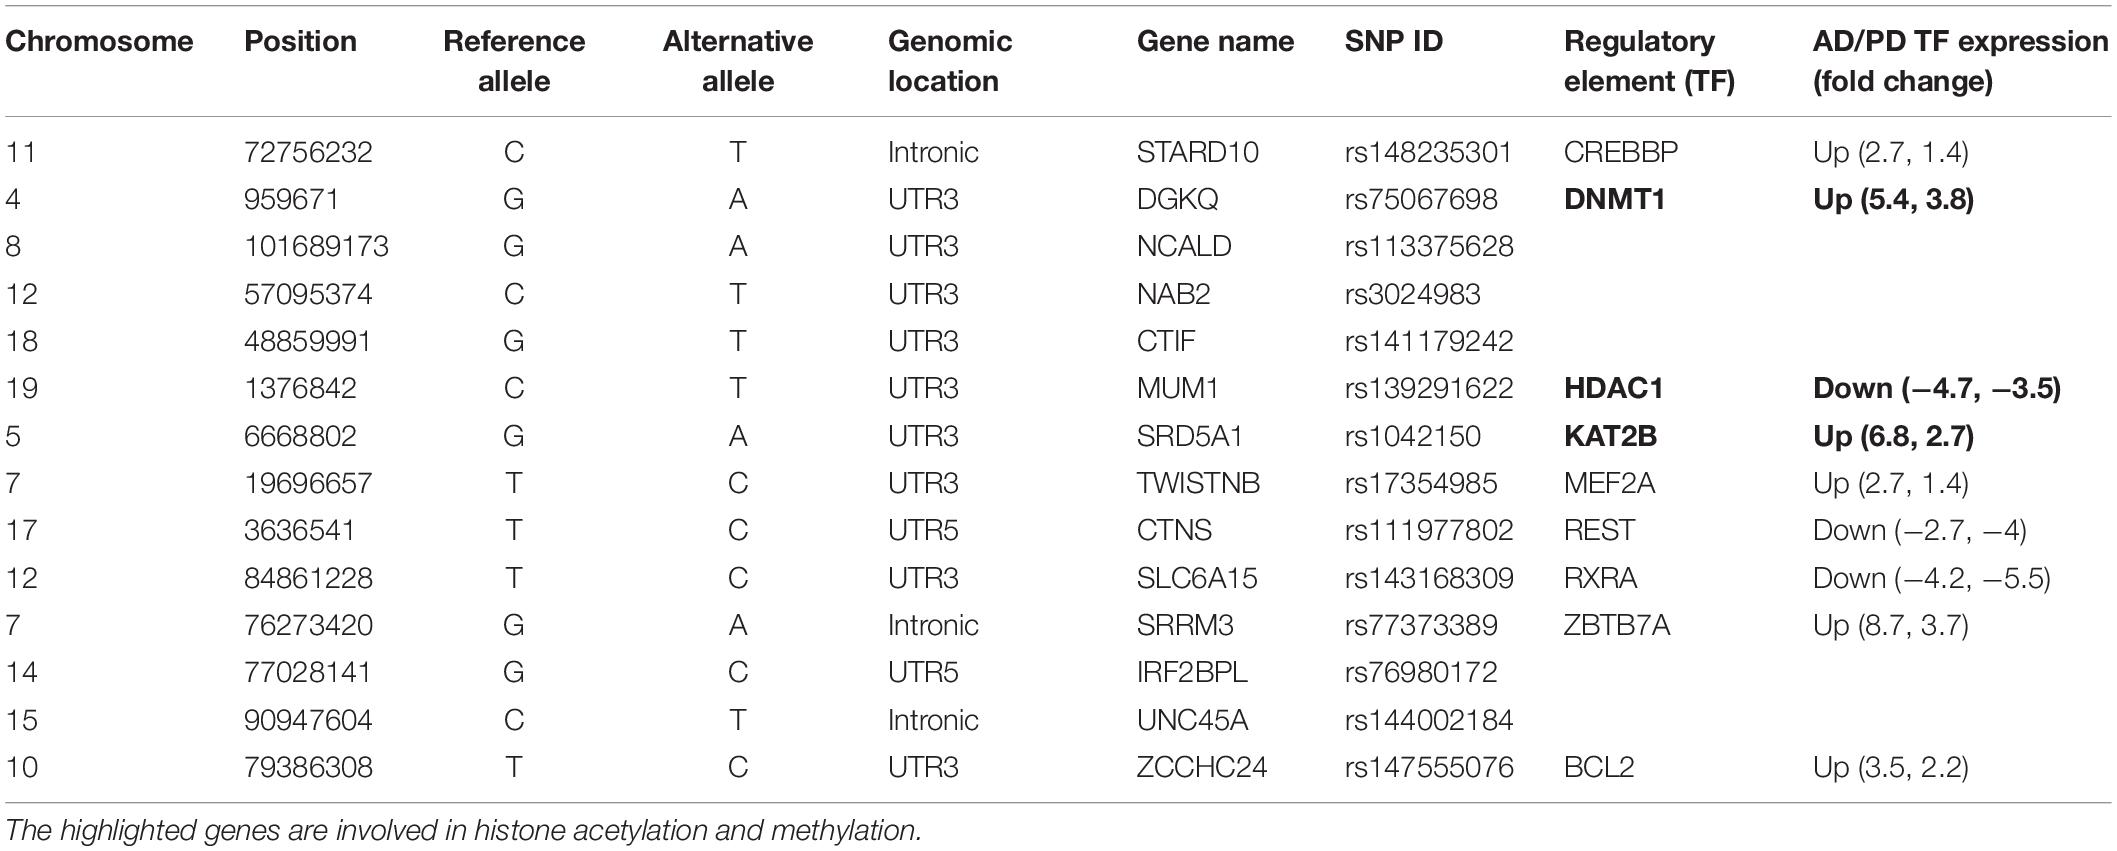
Table 1. Common variants and their effect on regulatory elements.
DNA methylation plays a crucial role in epigenetic regulation and gene expression. The 3′ UTR region is enriched with methylation sites and is positively correlated with gene expression profile (McGuire et al., 2019). Studies showed that (Wang et al., 2019) 3′ UTR variants affect the methylation pattern as well as gene expression. We observed that the identified variants, which mainly affected the regulatory elements, were involved in demethylation (DNMT1), histone acetylation (KAT2B), and deacetylation (HDAC1), and these genes are dysregulated in AD and PD. Table 1 shows that the STARD10 [rs14823530 (C/T)] variant disrupts the binding of CREBBP TF and regulates other transcription factors involved in synaptogenesis through histone acetylation (Valor et al., 2013). CREBBP is upregulated in both diseases. Variants such as DGKQ [rs75067698 (G/A)], NCALD [rs113375628 (G/A)], NAB2 [rs3024983(C/T)], and CTIF [rs141179242(G/T)] affect DNMT1 binding. DNMT1 is involved in DNA methylation and thereby controls gene expression and is upregulated in AD and PD. The SRD5A1 [rs1042150 (G/A)] variant disrupts KAT2B TF binding and is involved in transcription activation by transferring the acetyl group. KAT2B is upregulated in AD and PD. The MUM1 [rs139291622 (C/T)] variant disrupts HDAC1 binding, and this TF is implicated in transcriptional repression by deacetylation, which is downregulated in AD and PD (CoppedÃ, 2014). The TWISTNB [rs17354985 (T/C)] variant impairs the MEF2A TF binding. This TF negatively regulates mitochondrial function which dampens ATP functionality and is upregulated in both diseases. The CTNS [rs111977802 (C/T)] variant disrupts the binding of REST which participate in neurogenesis. REST is downregulated in both diseases. SRRM3 [rs77373389(G/A)], IRF2BPL [rs76980172 (G/C)], and UNC45A [rs144002184 (C/T)] variants disrupt ZBTB7A TF binding. This TF acts as a transcriptional repressor and is upregulated in AD and PD. This analysis revealed an imbalance in the transcriptional network that leads to aberrant activation or inactivation of downstream genes. Additionally, the ZCCHC24 [rs147555076(T/C)] variant disrupts Bcl2 binding, is involved in apoptosis regulation, and is upregulated in these diseases. Furthermore, we identified that the SZRD1 [rs138678090 (C/T)] and YWHAB [rs188983062 (C/G)] variants affect hsa-miR-301a-3p and hsa-miR-212-3p miRNA binding. These miRNAs are downregulated in both diseases, as reported in the literature using miRNA signature studies (Kumar and Reddy, 2016; Pallarès-Albanell et al., 2019). 3′ UTR variants such as rs72984526 (CAPZA1), rs149358308 (PBX1), rs1042150 (SRD5A1), and rs41305489 (CENPP) affect the RNA structure (riboSnitch) along with the RBP binding motif, which in turn affects miRNA binding. Details are given in Supplementary Table S5. In summary, we observed the effect of variants at multiple hierarchies such as 27 TFs, two miRNA, and 30 RBP binding motifs which were altered by 3′ UTR variants. We represent this information in Supplementary Figure S3 along with the tools used to predict the effect of variants.
Differentially Expressed Genes in AD and PD
We identified differentially expressed genes with similar gene expression profiles in both AD and PD. We observed that 100 and 98 genes were up and downregulated in AD and PD pathogenesis, respectively. The details of count tables along with the volcano plot are given in Supplementary Table S6 and Supplementary Figure S4.
Comparison of BA9 Gene Expression (Disease) With GTEx Normal Tissue Expression
The upregulated and downregulated gene expression profiles of the BA9 disease samples were compared with the GTEx consortium to understand the expression pattern in other normal tissues that are not affected by these diseases. The details are provided in Supplementary Figures S5, S6. The TPM value was high for the disease BA9 tissue for upregulated genes and low for downregulated genes. The pattern of gene expression in the disease sample differed from that of other control tissues.
Comparison of BA9 Gene Expression (Disease) With Other RNA-Seq Data (AD/PD)
Due to the unavailability of BA9 RNA-seq data in both diseases, we compared expression profiles with recently published RNA-seq data from various other tissues. Details are provided in Supplementary Table S7.
The single-cell RNA-seq data obtained from the prefrontal cortex (BA9) were available for Alzheimer’s disease. It consisted of 80,660 cells from six different cell types derived from 12 AD disease samples (Lau et al., 2020). The expression pattern (fold change) of single nucleus RNA-seq data was compared to the bulk RNA-seq data expression pattern (BA9-current study). Bulk RNA-seq data showed a similar expression pattern with single-cell RNA-seq data (Figure 1). FLT1 gene expression was high in endothelial, astrocytes, and excitatory neurons, and bulk RNA-seq also captured this gene as upregulated in disease conditions. PSMD1 was downregulated in endothelial cells, excitatory neurons, and microglia and bulk RNA-seq data showed that this gene was downregulated in disease conditions. Detailed information about the fold change in bulk and single nuclei RNAseq data (BA9) are given in Supplementary Table S7. Most of the gene expression patterns matched the single-cell RNA seq data.
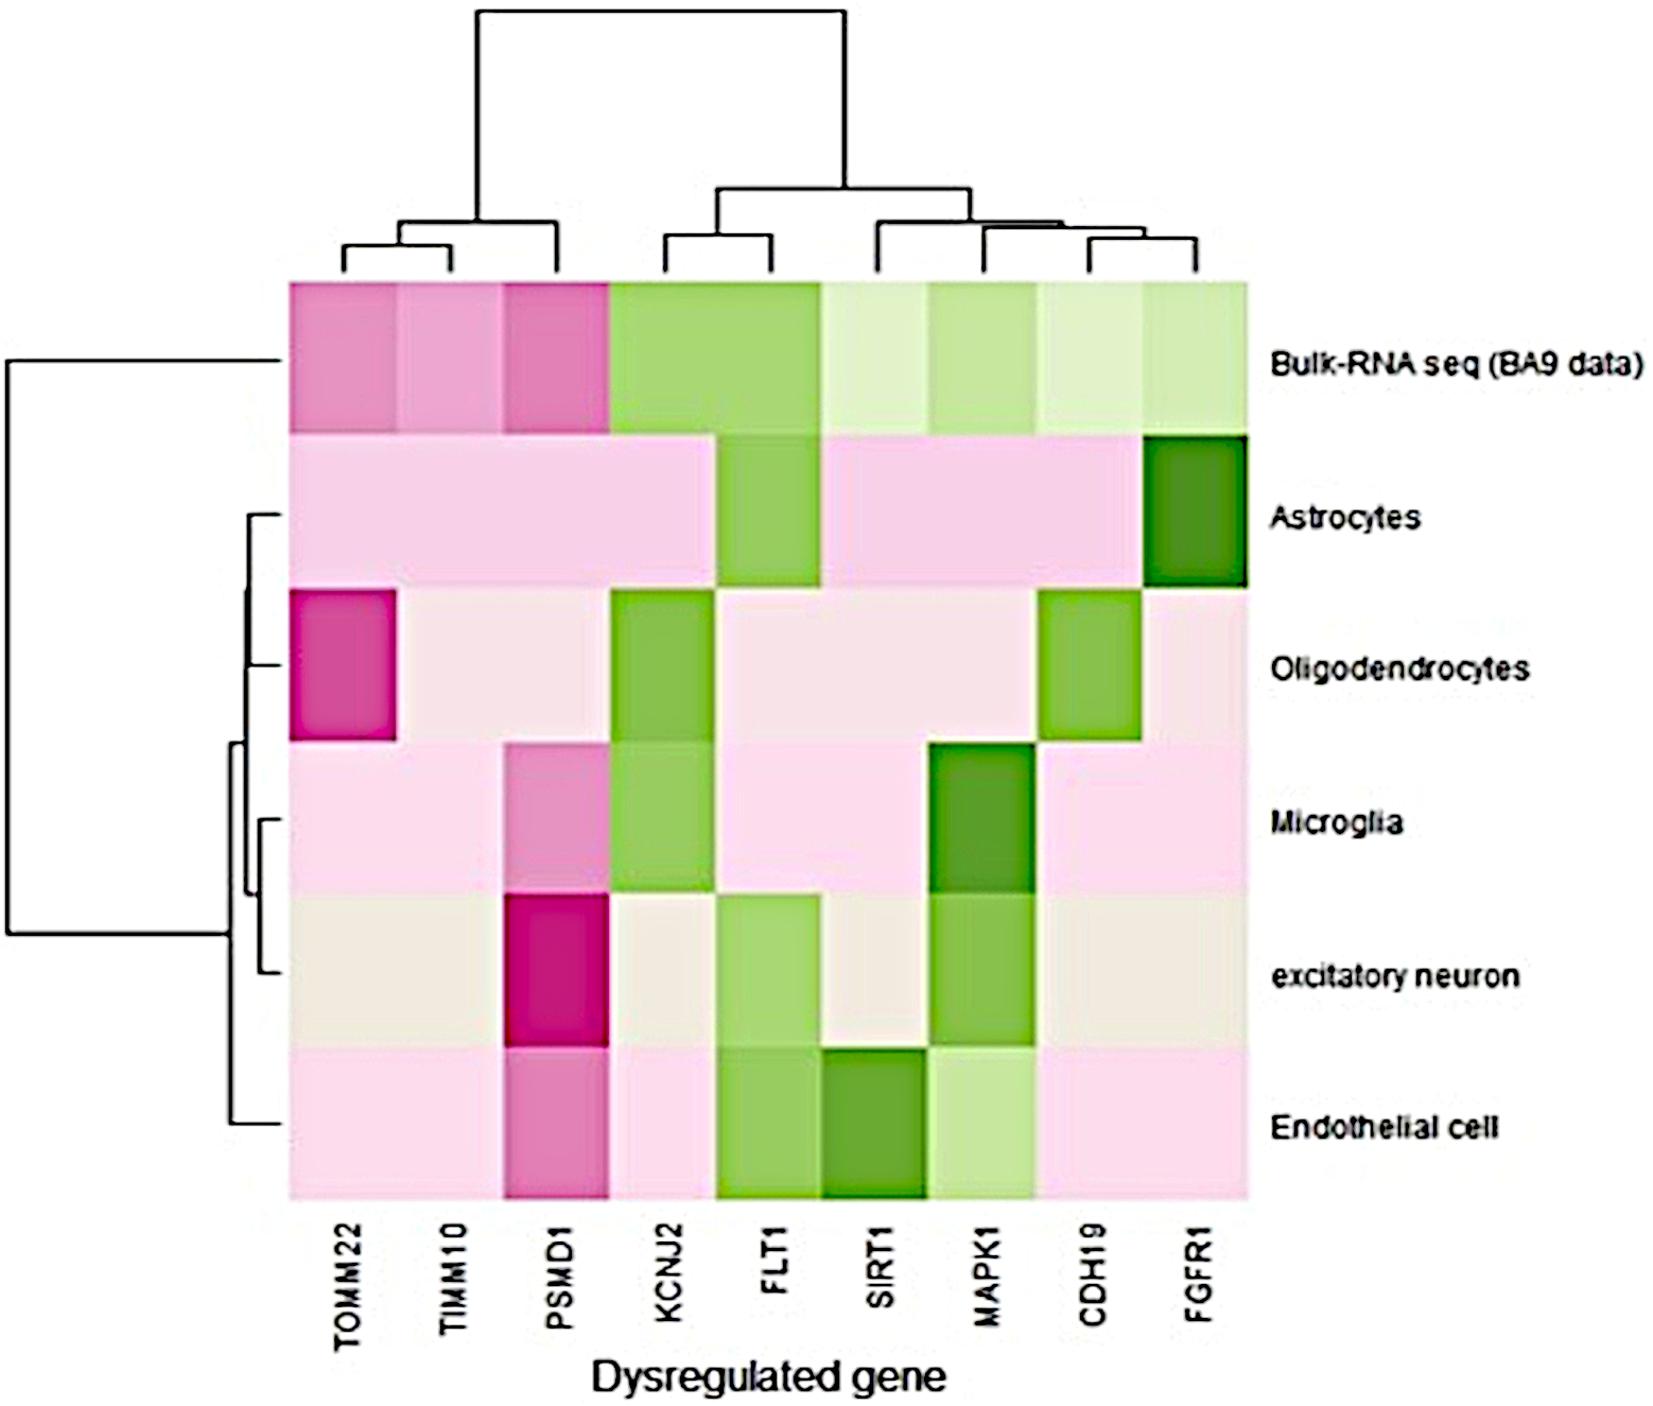
Figure 1. Comparison of gene expression profiles between bulk and single nuclei RNA-seq (disease/BA9).
Biological Classification of Differentially Expressed Genes
We grouped the differentially expressed genes based on up and downregulation. Using the clueGo cytoscape app, we classified genes based on their biological functions. The functional enrichment modules for upregulated and downregulated genes in AD and PD pathogenesis are shown in Figure 2. Furthermore, genes related to negative regulation of endothelial function and cellular senescence were upregulated, while genes involved in mitochondrial function and neuromuscular processes were downregulated. The list of differential gene expression is given in Supplementary Table S6. Upregulation of the FLT1 and FGFR1 genes may affect the blood-brain barrier (Mahoney et al., 2019; Chen et al., 2020; Lau et al., 2020). Additionally, cellular senescence is provoked by various factors such as mitochondrial dysfunction, oxidative stress, inflammation, and protein mishandling. The upregulation of senescence-related genes (BCL6, SIRT1) may lead to the deterioration of functional features.
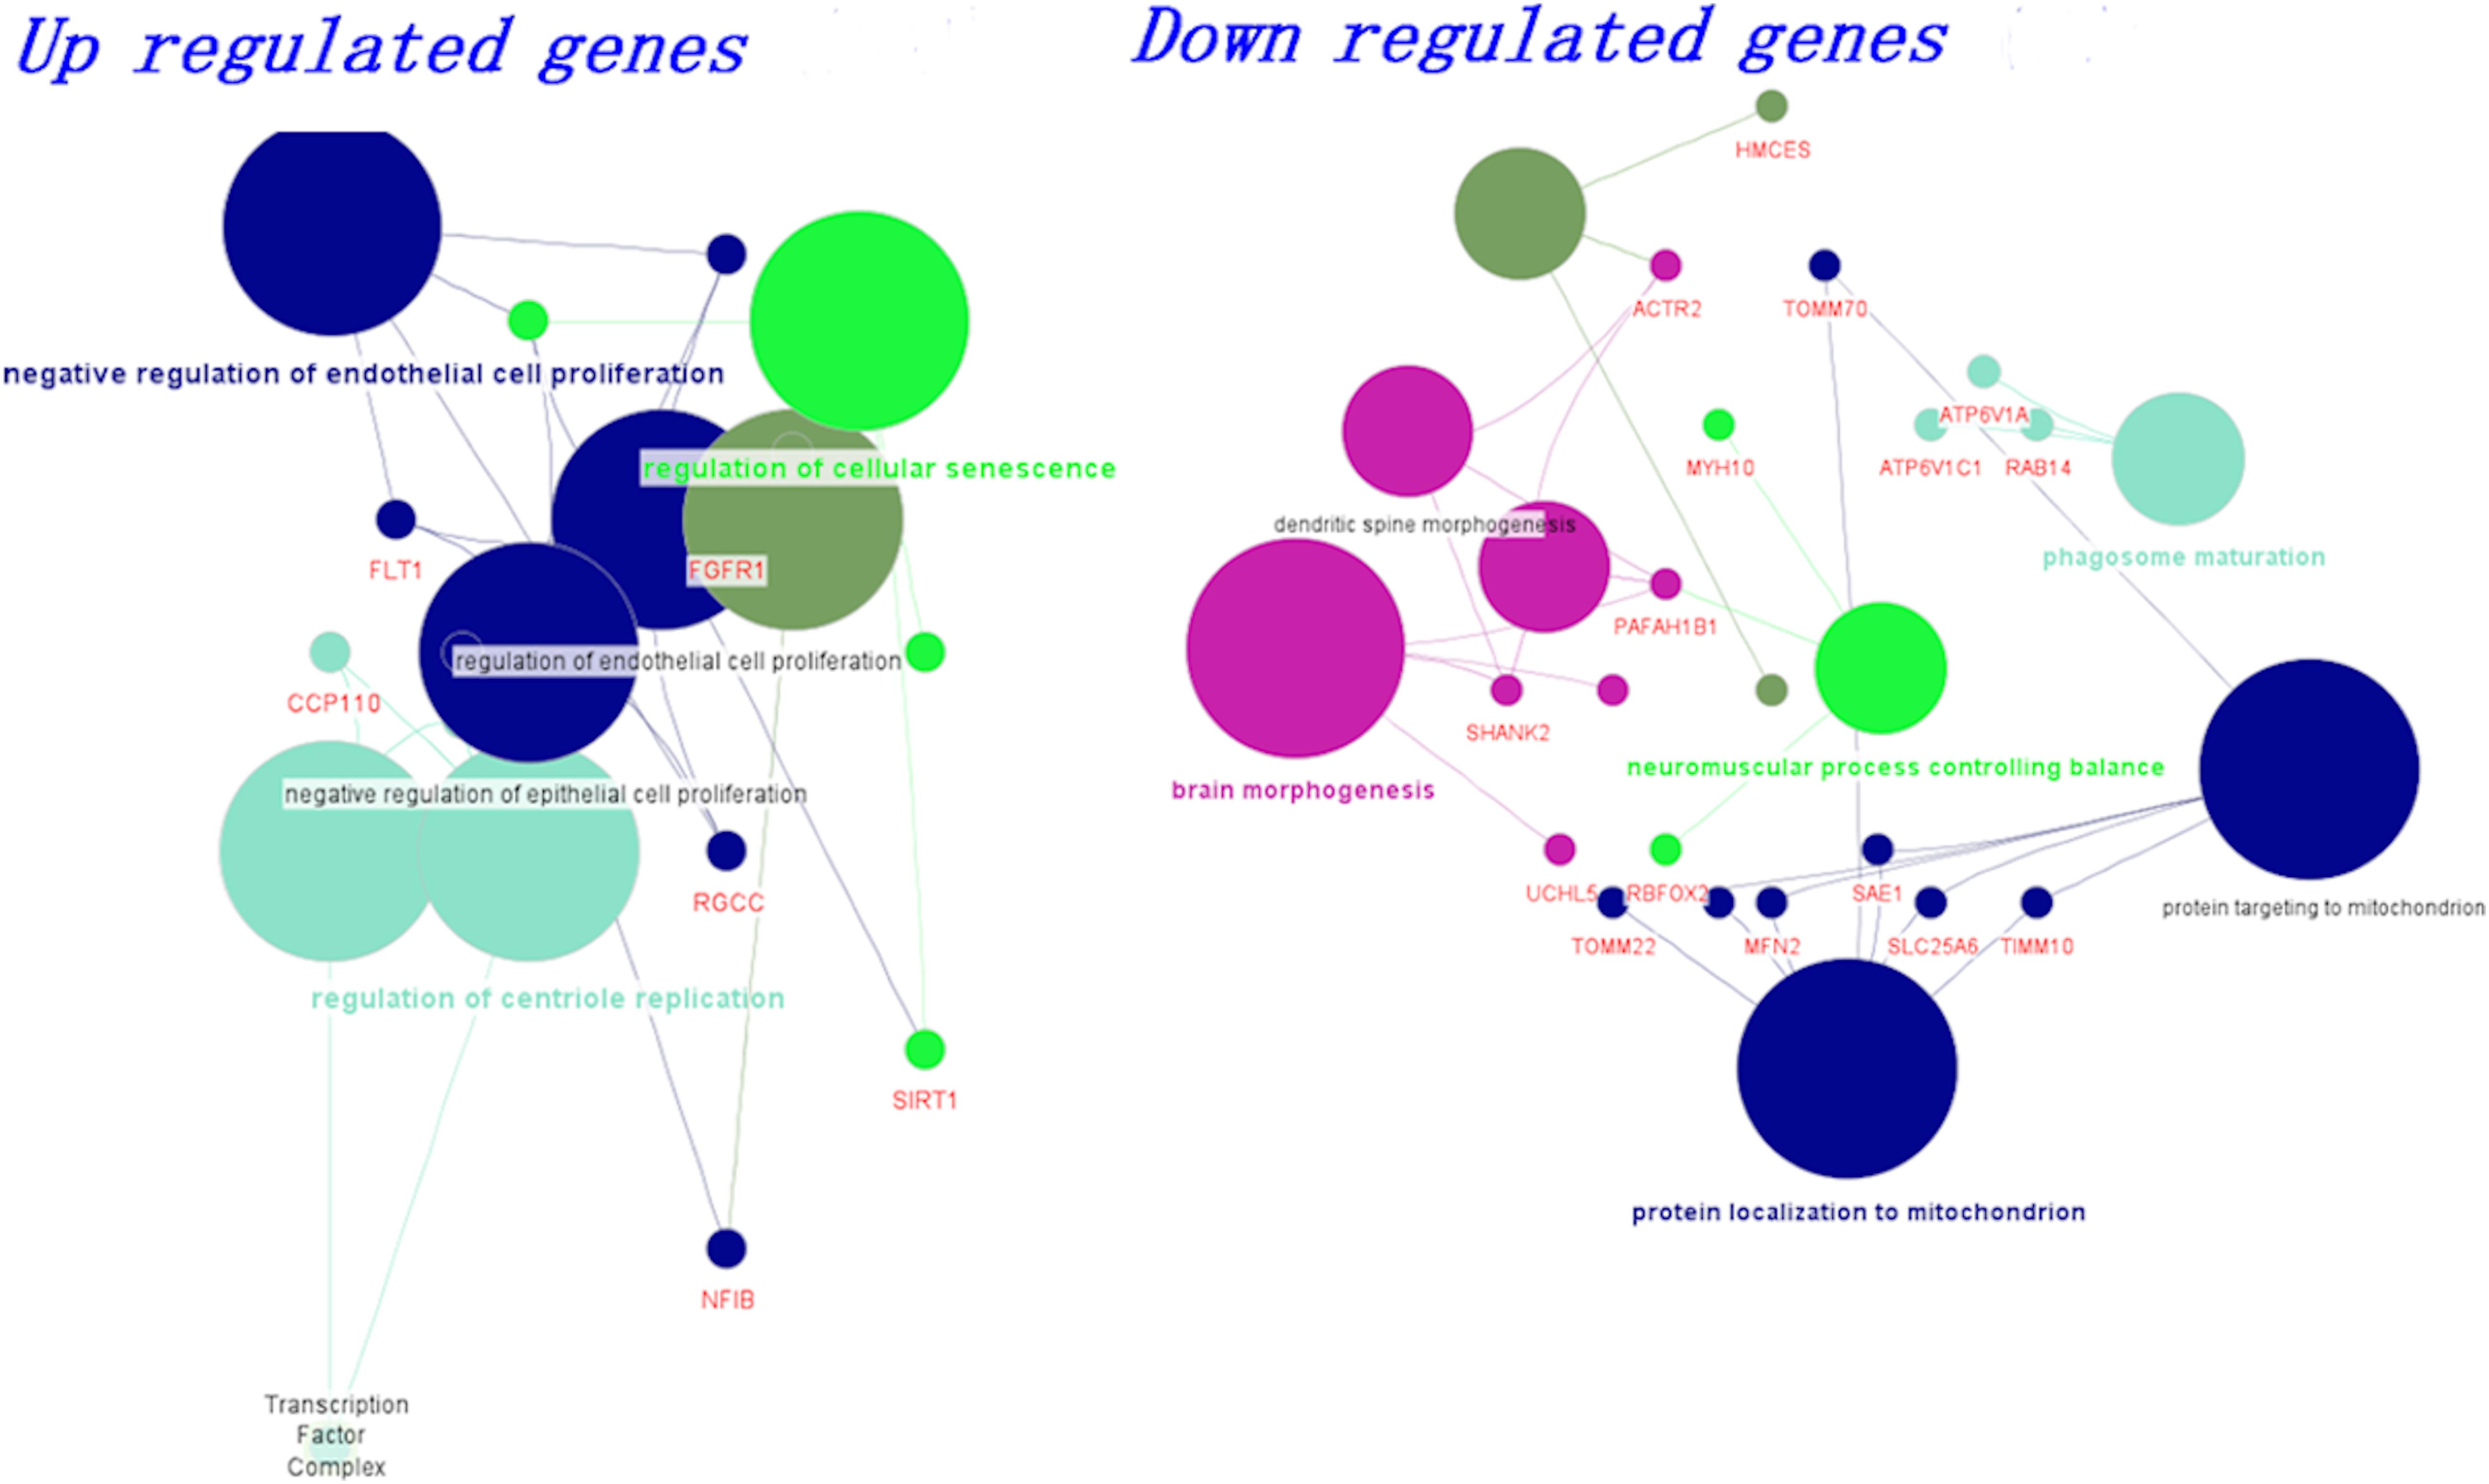
Figure 2. Biological classification and functional enrichment modules for upregulated and downregulated genes in AD and PD pathogenesis. Modules are shown in different colors and the size of the node denotes the number of genes.
On the other hand, mitochondrial localization (MFN2, TIMM10, TOMM22) and neuromuscular function (MYH10, RBFOX2, PAFAH1B1)-related genes were downregulated. We observed that the dysregulation of genes related to endothelial function influence BBB damage, which leads to impairment in vascular dynamics. Additionally, mitochondrial function-related genes were dysregulated and led to inadequate energy resources (Bélanger et al., 2011; Freeman and Keller, 2012; Sweeney et al., 2018a). All these events led to oxidative stress, which ultimately influences cellular senescence (Sweeney et al., 2018a). In addition, we also generated a boxplot based on the normalized count values obtained for these genes using control, AD, and PD datasets, and the data are shown in Supplementary Figure S7.
Effect of Variant, miRNA Binding, and Downstream Expression
We observed that the 3′ UTR gene variants SZRD1 and YWHAB affected the regulatory binding motifs of hsa-miR-301a-P and hsa-miR-212a-p binding (Figure 3). These miRNAs were downregulated in both disease conditions. We predicted potential miRNA targets and observed that these targets were upregulated in both disease conditions. hsa-miR-301a-p miRNA targets the genes SUN2, NFIB, LRP4, and PHF20 whereas hsa-miR-212a-p targets DOCK4, PNISR, CLMN, LSIRT1, and TJAP1. All these genes were upregulated in both disease conditions. Both of these miRNA target the following genes MAPK1, QKI, and ZBTB20 and these genes are upregulated in AD and PD (Supplementary Table S6).
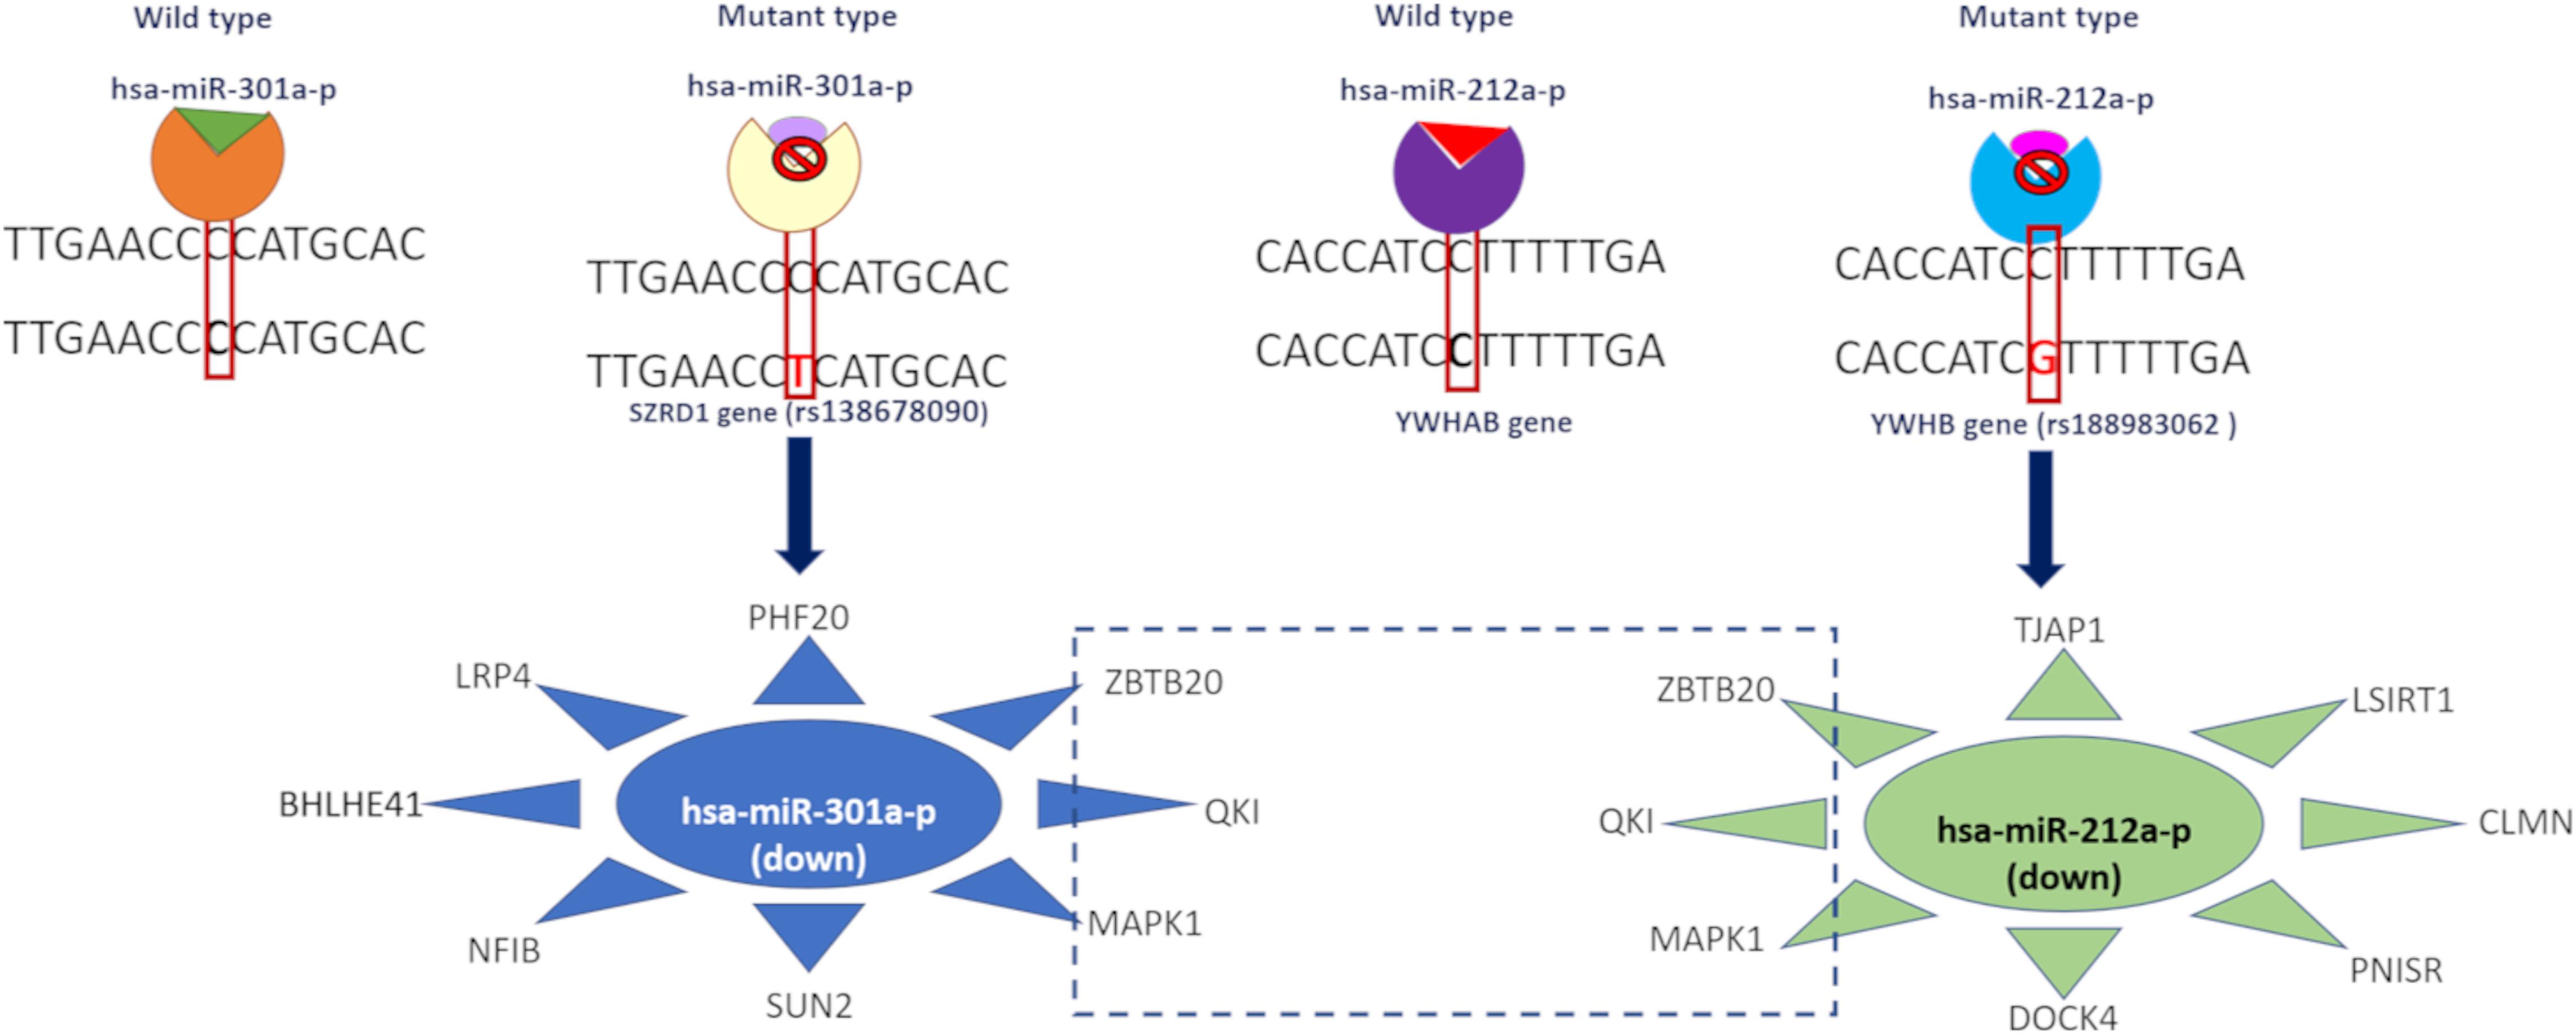
Figure 3. Effect of 3′ UTR variants in miRNA binding and downstream gene expression.
Tissue-Specific Functional Interaction and Co-expression Networks
We identified common variants, which may create or disrupt the conserved regulatory binding motifs of TFs involved in AD and PD. These TFs may activate or inhibit various downstream genes. To understand the functional relationship between TFs and DEGs, we built a tissue-specific interaction network. We also identified fewer overlaps between these classes (TF, DEG, and variants). The below mentioned genes overlapped in either of two groups: TF/DEG TCF12, variant/DG FLT1, and variant/TF TAL1.
Figure 4 illustrates the interaction between some of the essential TFs and DEGs. These TFs showed increased connectivity (degree > 5). The relationship between the identified DEGs and TFs can reveal important insights into neuronal cell survival. Figure 4 denotes that CHD9 activates CREBBP, and both TFs are upregulated in AD and PD. NCOR1 and JUN inhibit CREBBP, and these TFs are downregulated and co-expressed in BA9. KAT2B and FGFR1 interact with CREBBP, and these genes are co-exprssed and upregulated in AD and PD. CREBBP activates FLT1, CTBP1, BCL2, NFIB, BCL6, PBX1, and CUX1. All these genes are upregulated in both diseases. CREBBP TF binding is affected by the intronic variant (Table 1). CHD9, HDAC1, PBX1, JUN, CTBP1, CREBBP, and KAT2B genes are involved in NOTCH signaling, which is essential for endothelial cell migration, axonal sprouting, and neuronal survival (Lasky and Wu, 2005).
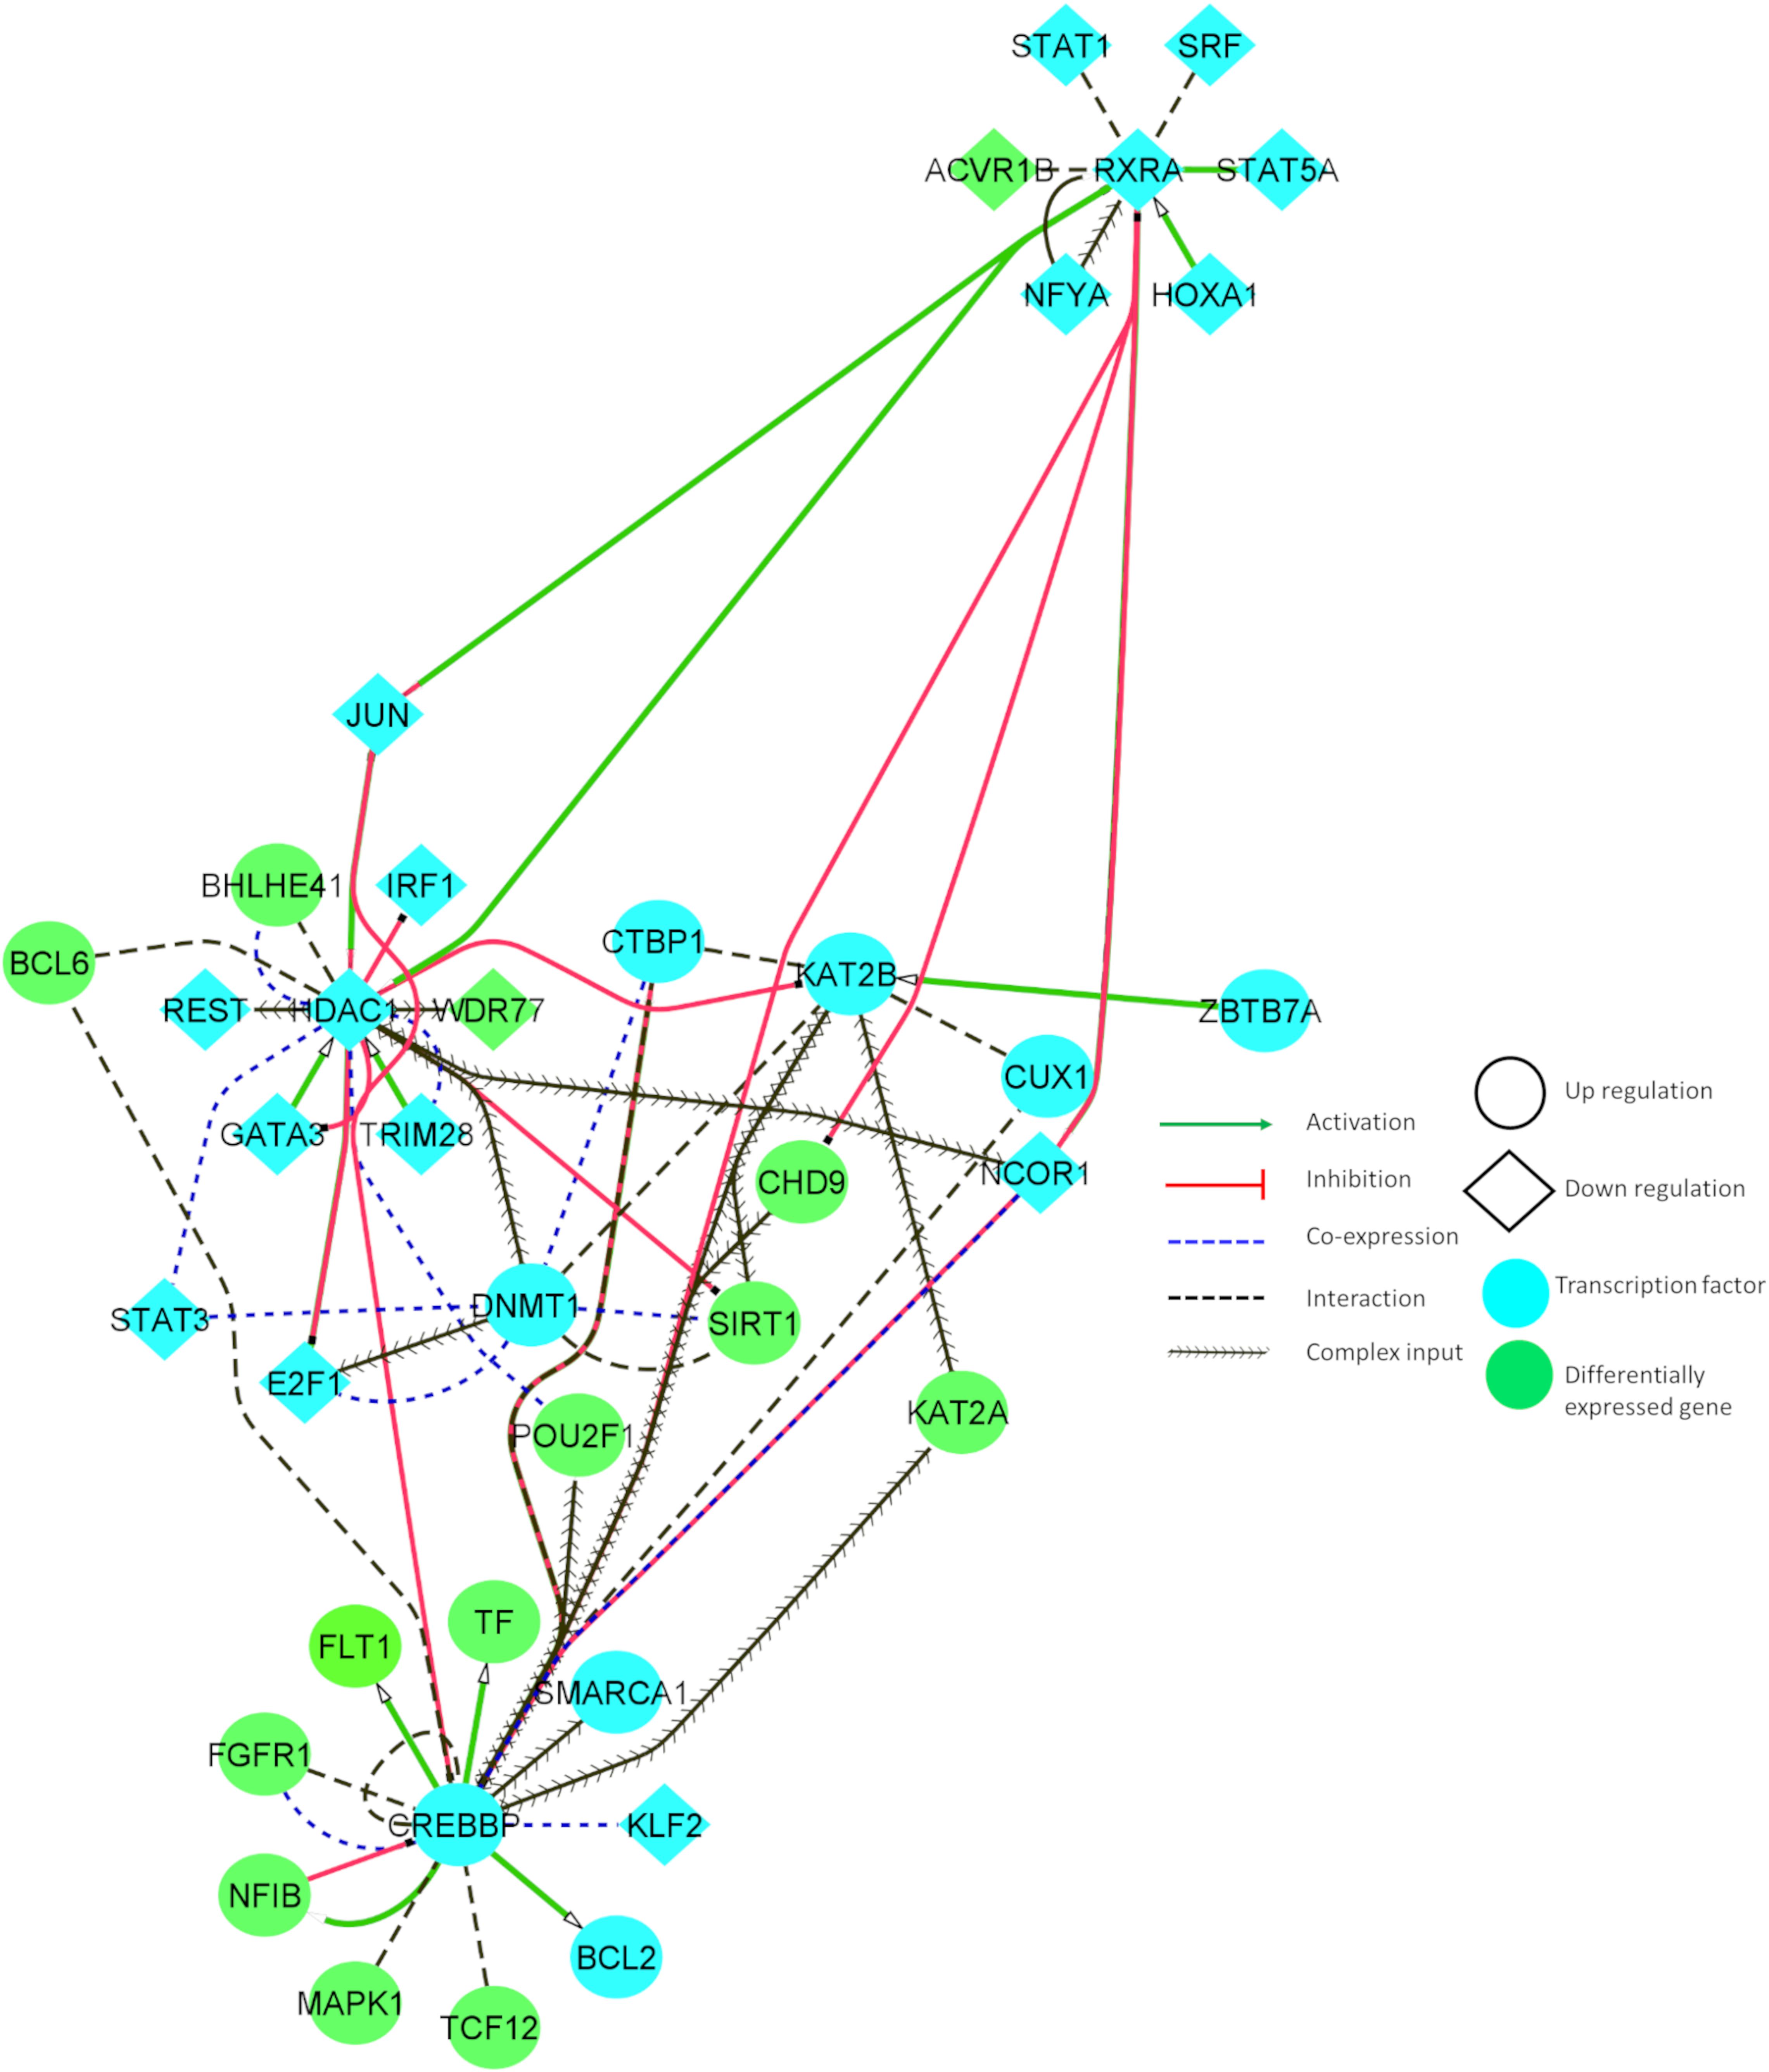
Figure 4. Tissue-specific (BA9) functional interaction network between transcription factors and differentially expressed genes involved in AD and PD.
JUN, TRIM28, and E2F1 activate HDAC1, and all these genes are downregulated in disease conditions. HDAC1 inhibits E2F1, IRF1, JUN, and GATA3, and these genes are downregulated in AD and PD. HDAC1 interacts with BHLHE41, DNMT1, REST, and BCL6, and is co-expressed in BA9. DNMT1 TF binding is affected by UTR variants (Table 1). E2F1, JUN, and BCL6 are involved in cellular senescence and autophagy. JUN, DNMT1, and REST genes are implicated in AKT cell survival signaling, which shows that genes participate in autophagy, and cell survival signaling is dysregulated in both of the disease conditions.
KAT2B is activated by ZBTB7A and upregulated in disease conditions. KAT2B inhibits HDAC1 and interacts with CREBBP, DNMT1, KLF2, KAT2A, SIRT1, CTBP1, E2F1, and JUN, and is co-expressed in BA9. KAT2B TF binding is affected by UTR variants (Table 1). Major constituents of these gene sets are involved in NOTCH signaling and oxidative stress related senescence. IRF1 and FGFR1 activate MAPK1, and these genes are upregulated in the disease conditions. MAPK1 regulates the expression of YWHAB, RXRA, STAT3, FGFR1, and BCL2 genes. These genes participate in synaptic transmission and are dysregulated in disease conditions.
Downregulated RXRA activates STAT5A, JUN, and NCOR1, and these genes are downregulated in these disorders. RXRA inhibits CHD9 and CREBBP. RXRA TF binding is affected by UTR variants (Table 1). Dysregulation of these genes resulted in aberrant long term potentiation and survival signaling pathways. From this study, we found an inherent relationship between TFs and DEGs in disease conditions which may involve various crucial signaling pathways, including the regulation of endothelial cells, oxidative stress response, and cell survival pathways. Detailed information about the functional interaction and co-expression of other genes are provided in Supplementary Table S8.
Functional Module Network Analysis
The most common identified differentially expressed genes and transcription factors were subjected to tissue-specific functional enrichment analysis. Modules were denoted as enriched biological functions obtained from the tissue-specific community network from the list of DEGs/TFs. Figure 5 illustrates functional enrichment modules and shows various tissue-specific functional modules dysregulated in AD and PD. We observed that 65 genes (47 upregulated, 18 downregulated) were dysregulated. These genes were involved in vascular smooth muscle cell regulation and are essential for preserving blood pressure in the brain (Ni et al., 2018). We found that inter-module interactions were predominant between endothelial cells (M2) and smooth muscle cell regulation (M6) (Figure 5). In this section, we discuss a few hubs, which are identified based on the network properties (degree > 5, detweenness centrality ≥ 0.5), and are highlighted in Figure 5.
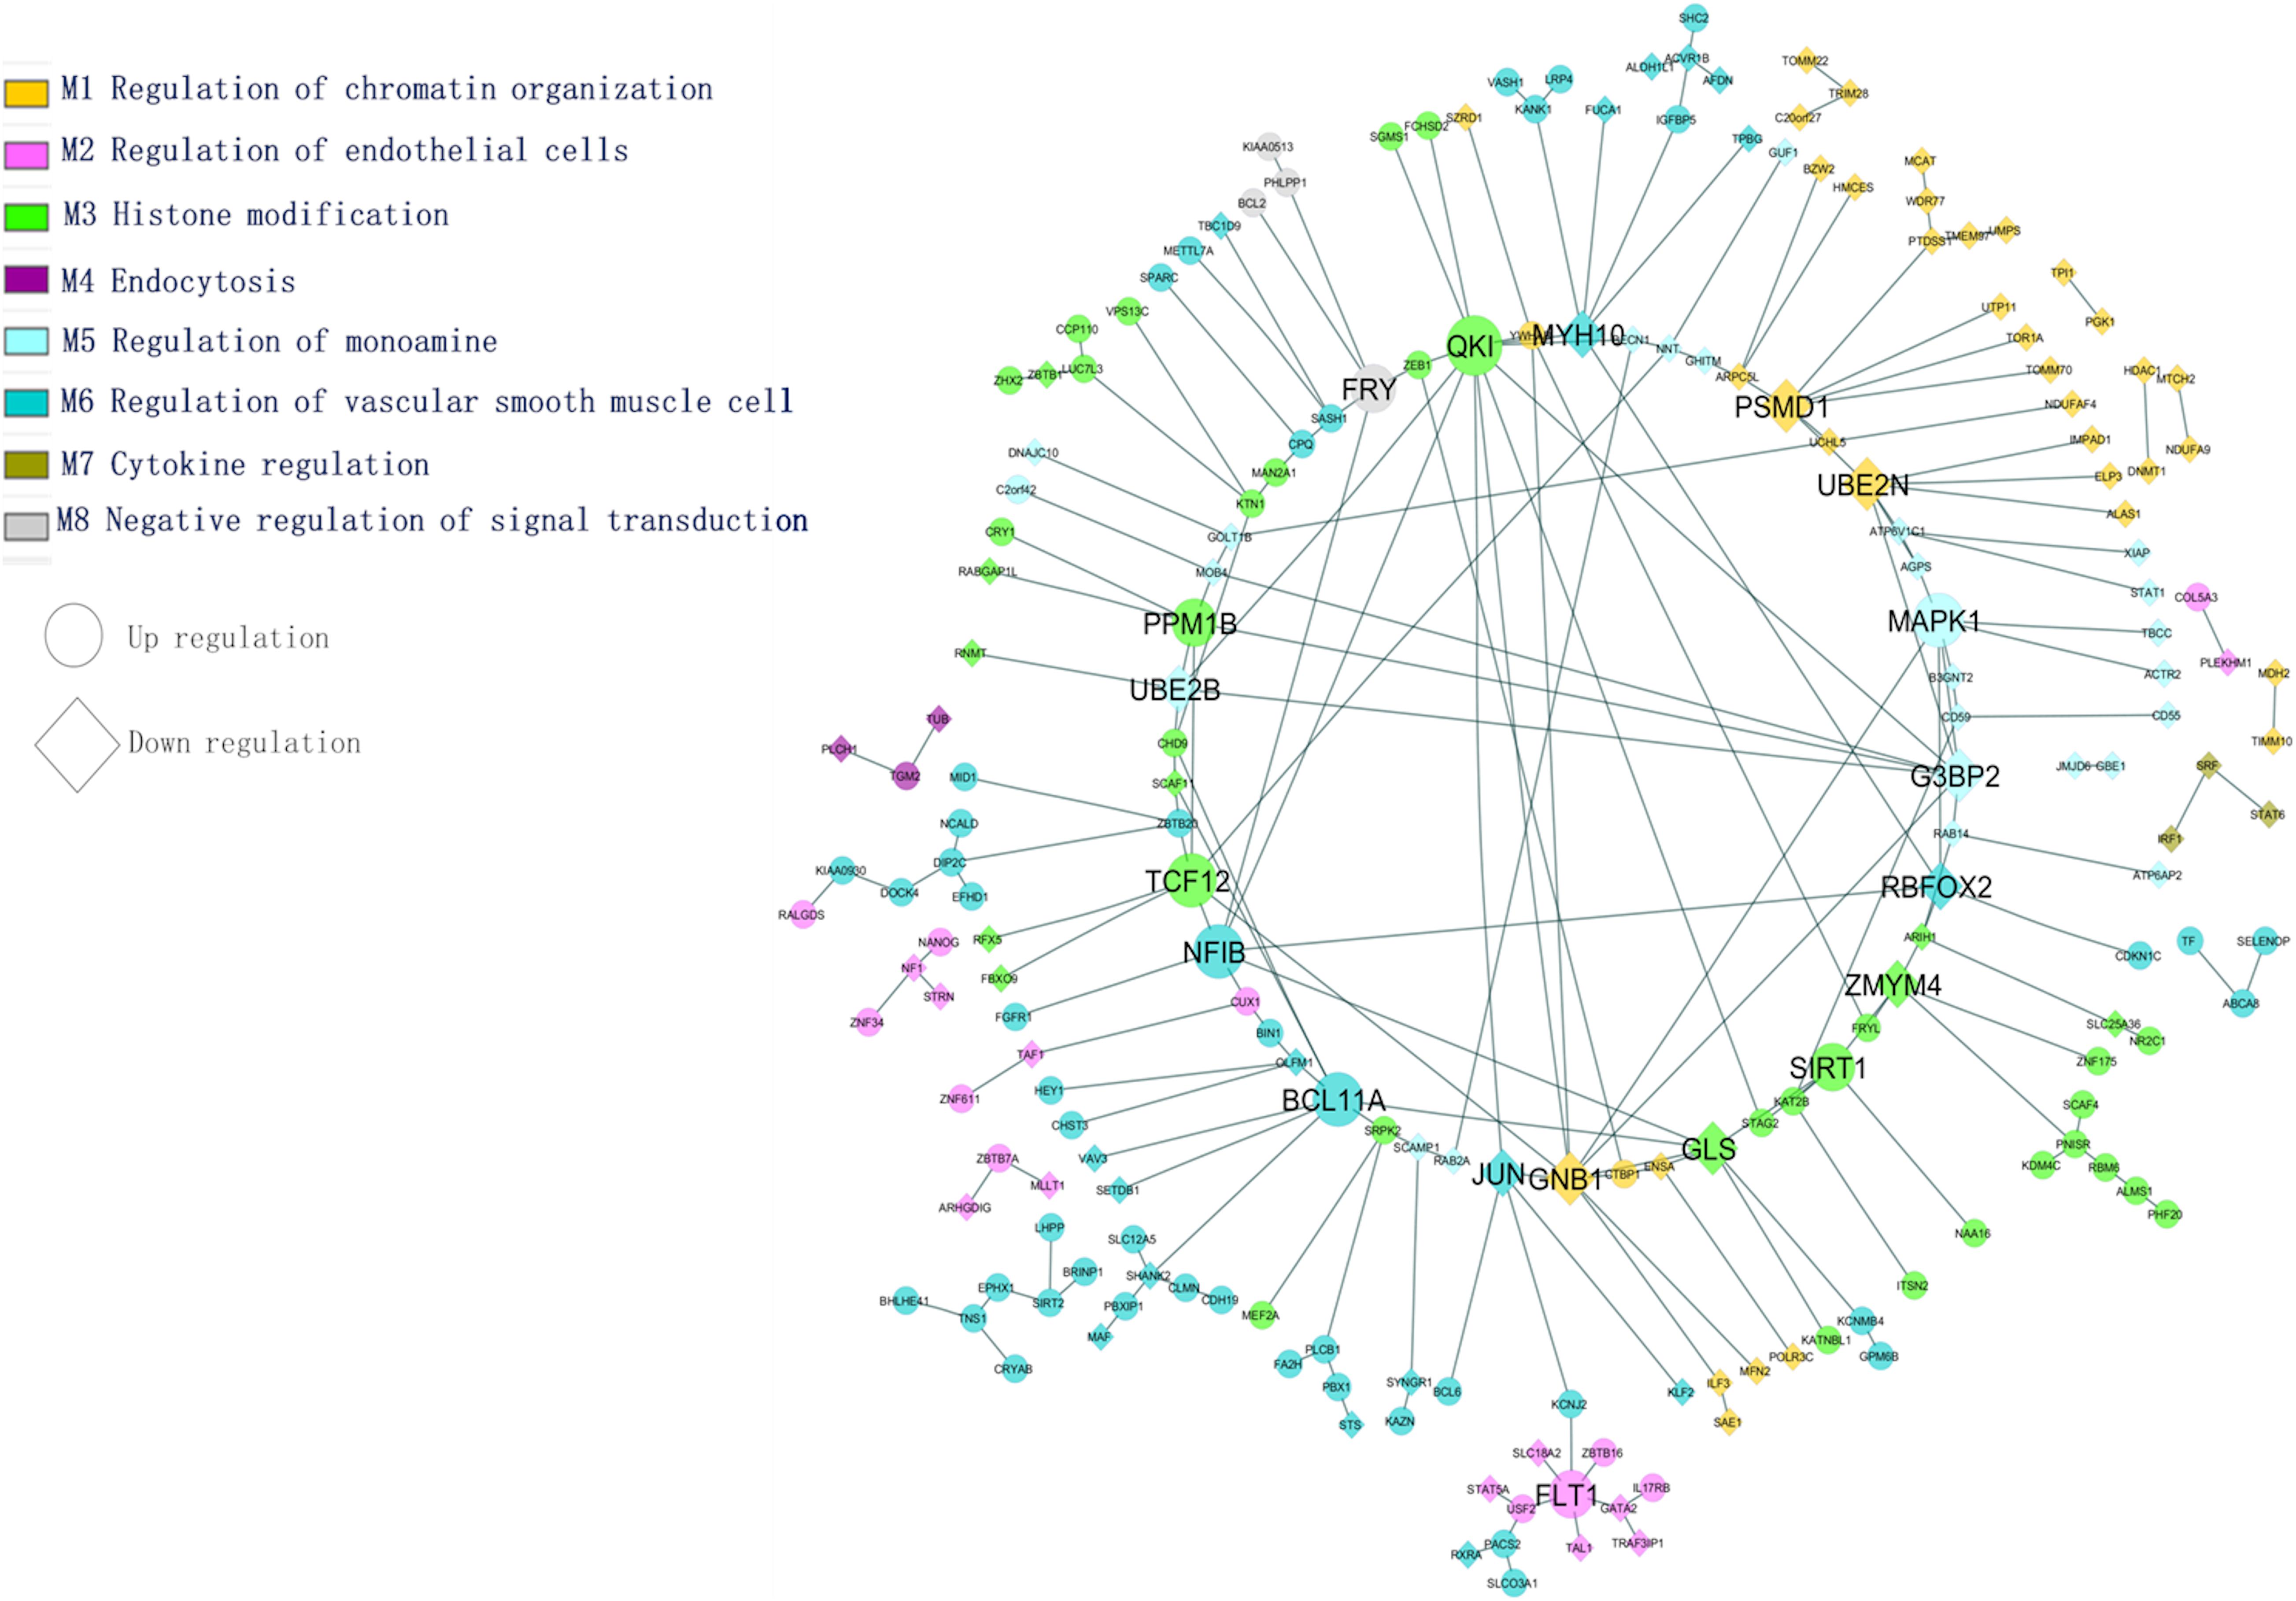
Figure 5. Tissue-specific (BA9) enrichment functional module network (transcription factors and differentially expressed genes).
The PSMD1 and UBE2N genes are involved in proteolysis and DNA damage response. They are downregulated in AD and PD. The QKI gene belongs to the RNA binding protein that regulates myelination. The QKI gene interacts with UBE2B and MYH10, and these genes are essential for the regulation of ubiquitination and cytoskeleton-mediated motility. These genes are downregulated and therefore show impairment of proteasome-mediated ubiquitination and cell transport processes under disease conditions. This may affect mitochondrial and vesicular mobility and hinder the quality control of mitochondria, thereby depleting ATP production. The PPM1B gene interacts with G3BP2 and participates in NF-kB regulation, which plays a key role in inflammation and apoptosis. The SIRT1 gene interacts with KAT2B, NAA16 is involved in the acetylation process, and all of these genes are upregulated under disease conditions.
In this study, the variant FLT1 (rs144398423-3′ UTR; VEGFR1) was identified in AD and PD. The FLT1 gene interacts with USF2, TAL1, ZBTB16, and GATA2, and these genes are involved in the development of the blood vessels and vasculature. The ATP-sensitive potassium channel (KCNJ2) interacts with FLT1 in the endothelial vascular pathway. Following an action potential, the potassium concentration of the extracellular region is higher, dilating the blood vessel for subsequent neuronal activity. In disease conditions, it has been observed that the dysregulation of potassium-related genes affects vasodilation through vascular smooth muscle and endothelial cell pathways. Both pathways are essential to maintain vascular integrity and the blood-brain barrier (Zenaro et al., 2017). We found that identified hub genes interact with other genes in specific biological functions from this enrichment analysis. From the above analysis, the BBB is essential for functional homeostasis of the human brain, and hence we propose that restoring the BBB may save the neuron against degeneration in both the diseases.
Identification of Common Potential Drug Targets in AD and PD
We identified common druggable targets to treat AD and PD disease pathogenesis and mapped the known drugs with the tissue-specific functional module network. We obtained a set of drugs based on gene expression profiles and a connectivity map, which targeted various kinase families represented in Figure 6.
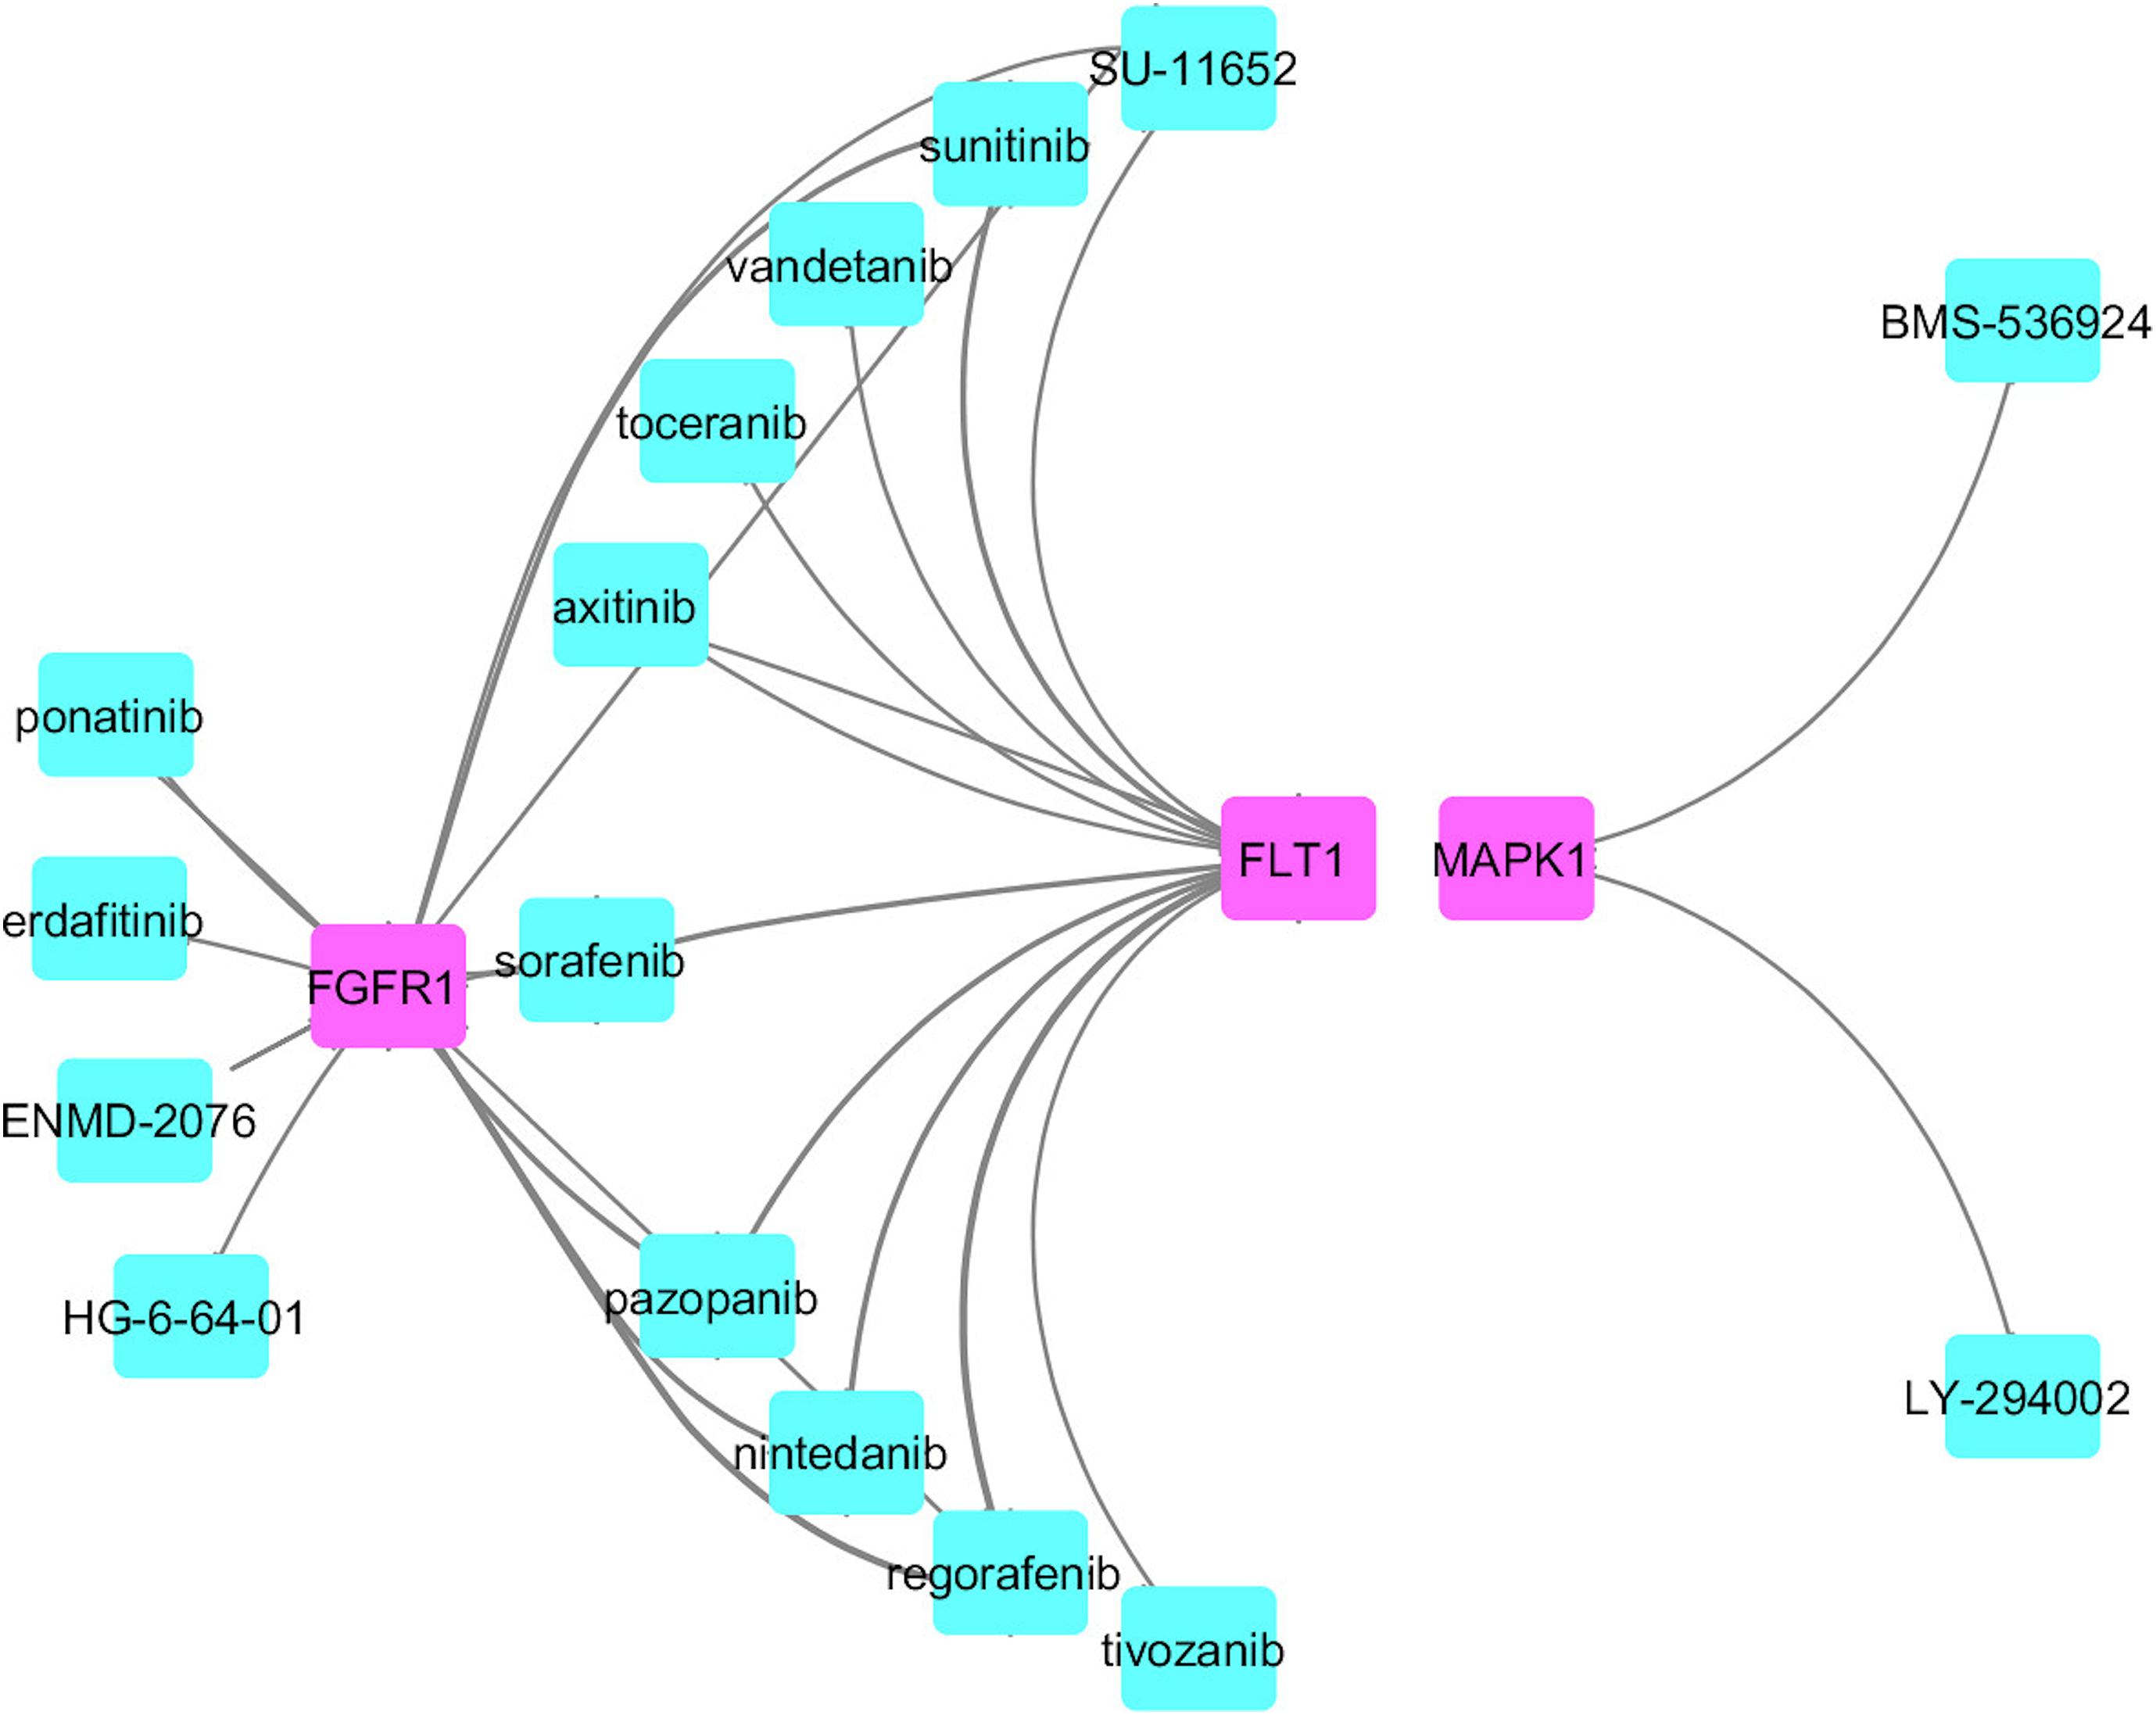
Figure 6. Drug connectivity map along with the proposed possible drug targets.
From this analysis, we found that potential druggable targets MAPK1, FGFR1, and FLT1 are upregulated in both AD and PD pathogenesis. The pattern of gene expression in the disease sample differs from that of other control tissues. In BA9 disease tissue, the TPM count values for these genes are high compared to control tissues (Supplementary Figure S8). Selective inhibition of these targets may provide common therapeutic interventions. However, the mapped drugs showed off-target effects and are listed in Supplementary Table S9. To understand these selected target mechanisms, we carefully mined the literature, and the details are illustrated in Figure 7.
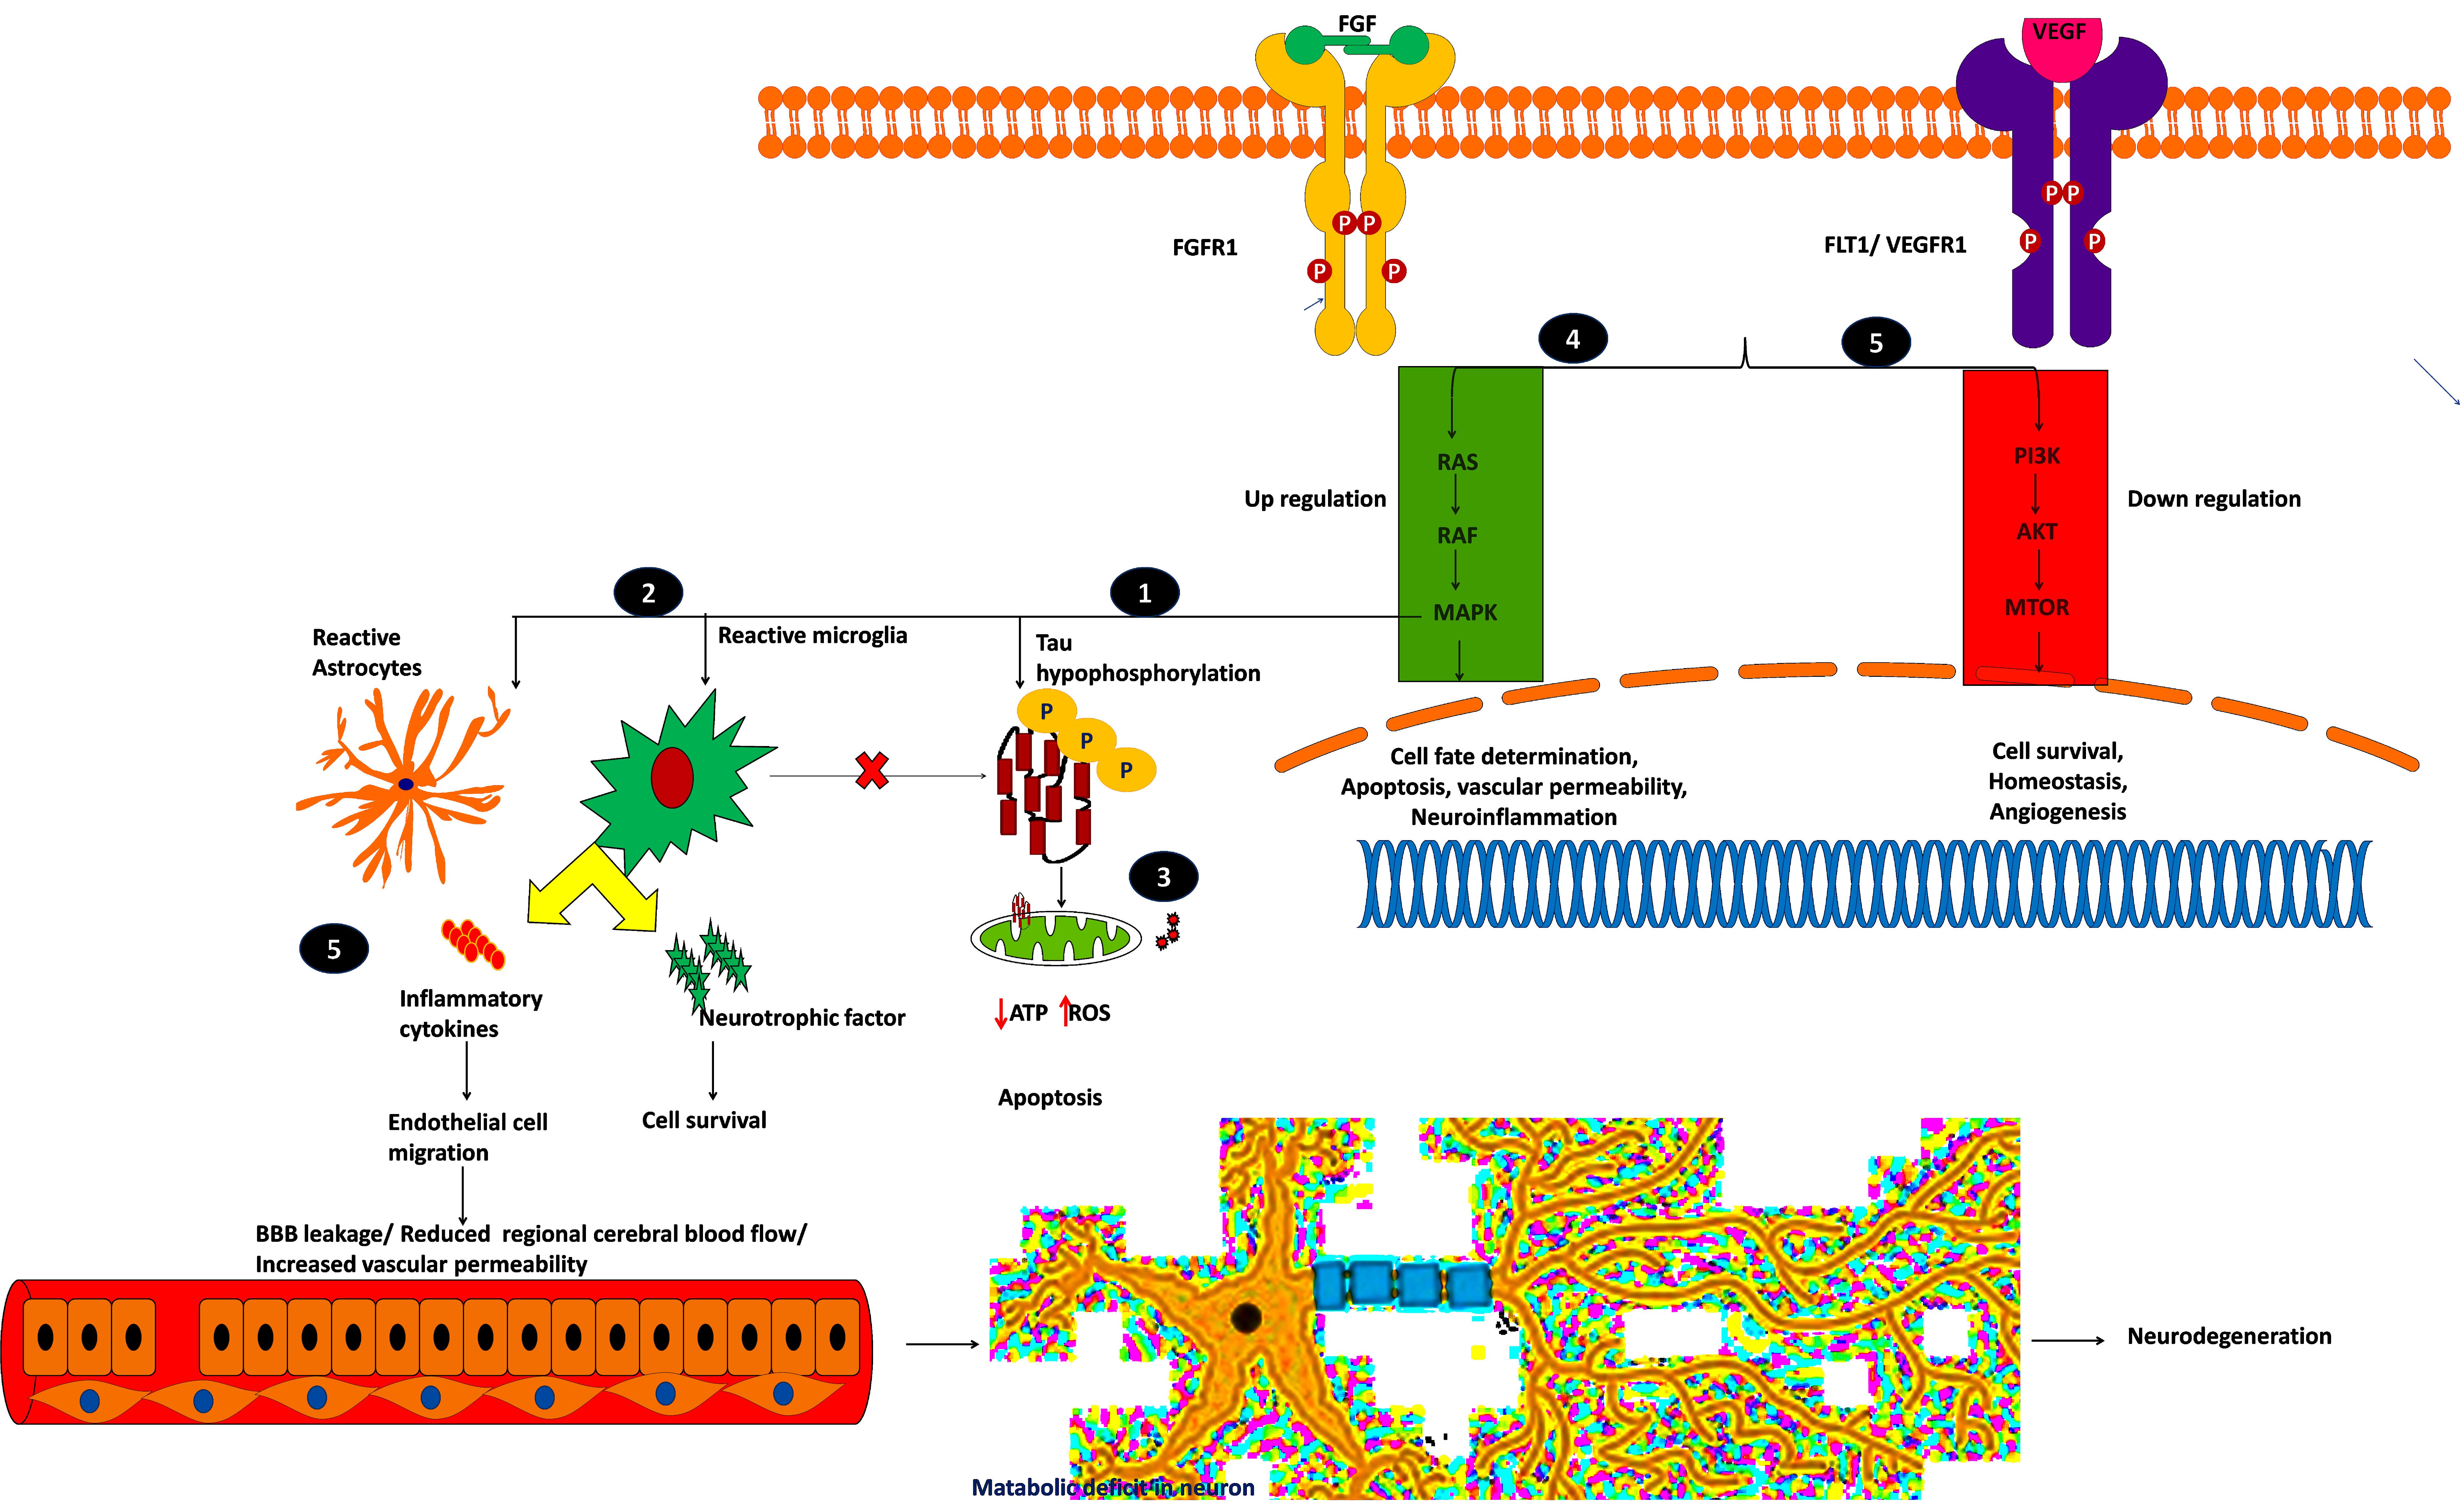
Figure 7. Plausible mechanism of proposed possible drug targets to reduce BBB permeability and neuroinflammation.
Mitogen-activated protein kinase 1 (MAPK1), widely known as p38, participates in cell proliferation, inflammation, and stress-mediated cell death. The mechanism of proposed possible targets is explained below:
(i) MAPK1 hyper-phosphorylates Tau and converts them into insoluble aggregates, which affects synaptic transmission.
(ii) Insoluble protein aggregation activates p38 signaling which acts as a double-edged sword by releasing proinflammatory cytokines and neurotrophic factors, which may save the neuron from the insult, or it may destroy the endothelial cells by releasing cytotoxic cytokines.
(iii) Insoluble protein aggregation interrupts mitochondrial function and increases ROS production which ultimately leads to oxidative stress, which in turn activates p38 signaling and induces apoptosis (Gerschütz et al., 2014; von Bernhardi et al., 2015).
The inhibition of p38 reduces oxidative stress and provides neuroprotection by regulating autophagy (Chen et al., 2018). On the other hand, designing a specific kinase inhibitor is challenging due to its cross signaling with other kinase proteins. Most of the claimed inhibitors activate or block other kinase families (Supplementary Table S9). Further studies are required to understand and selectively target MAPK1 signaling to overcome the inflammation threat.
Fibroblast growth factor receptor-1 (FGFR1) is another potential drug target for neurodegeneration and plays an essential role in glia/endothelial cell regulation, angiogenesis, and wound healing. We found that FGFR1/FGF2 is upregulated in AD and PD.
(iv) FGFR1 provides a “help-me/eat-me” signal to microglia and astrocytes through activating p38-MAPK signaling. This signaling helps clear debris, provides neuroprotection, and provokes inflammatory cytokines, affecting the damaged neuron and endothelial cells. Further, FGFR1 expression is higher near the senile plaques of deceased patients (Ye et al., 2019; Chen et al., 2020). This shows that FGFR1 upregulation may be neuroprotective or harmful to the neuronal population. A recent study showed that after traumatic injury, FGF binds to FGFR1 and increases adhesion and tight junctions, which in turn reduces blood-brain barrier permeability and guards the neuron against chronic insult (Shi et al., 2018). The role of FGFR1 in neuroinflammation and neuroprotection needs to be elucidated through activation and antagonization of the receptor.
VEGFR1, VEGFR2, and VEGFR3 mainly regulate the VEGFR pathway and are mainly activated by permeability factor VEGF-A (Mahoney et al., 2019). This pathway is essential to regulate endothelial cell migration, blood-brain barrier permeability, cell survival, and angiogenesis. Vascular endothelial growth factor receptor-1 (VEGFR1), also denoted as FLT1, is an attractive neurovascular target for both AD and PD (Weddell et al., 2018). During hypoxic conditions, such as cerebral hypoperfusion (decreased blood pressure), VEGF-A predominantly binds to FLT1, thereby regulating angiogenesis and inflammation.
(v) The upregulated FLT1 modulates microglia migration through MAPK signaling and promotes the inflammatory response. During cell stress, the reactive astrocytes release proinflammatory cytokines and VEGF-A, which affects BBB integrity, or it may provide neurotrophic factors to overcome the insult (Patel et al., 2010; Cho et al., 2017; Zenaro et al., 2017). Yang et al. (2004) showed that increased VEGF-A expression and FLT1 form leaky blood vessels near amyloid plaques. On the other hand, plaques affect VEGF-A binding to its receptor VEGFR2 which impacts neuronal survival and vascular integrity, showing that a higher concentration of VEGF-A leads to leaky blood vessels and BBB. Further research may be needed to identify the VEGF concentration (by selectively blocking VEGFR1 signaling), reduce inflammation, and improve vasculature and BBB integrity. Selectively targeting these kinase receptors is challenging due to cross signaling with other pathways and domain similarity. It is necessary to perform further explorative experiments to evaluate these targets for therapeutic intervention to reduce BBB permeability and neuroinflammation.
Discussion
In this study, we explored potential druggable targets for AD and PD using BA9 RNA-seq data. We identified variants and compared them with GWAS studies. We found that 167 variants are common between AD and PD, which are not present in control samples. We evaluated the effect of these GWAS variants using various in silico tools. A total of 128 variants are located in non-coding regions, affecting the regulatory elements involved in gene expression. The SZRD1 [rs138678090(C/T)] and YWHAB [rs188983062(G/C)] variants affect hsa-miR-301a-3p and hsa-miR-212-3p miRNA binding and these miRNAs are found to be downregulated in both diseases. The identified 3′ UTR variants disrupt the regulatory binding motif of 47 TFs, known to participate in AD and PD pathogenesis. DNMT1 and HDAC1 TFs regulate DNA methylation and histone acetylation, thereby affecting downstream signaling genes.
We built BA9 specific co-expression and functional interaction networks, and we identified the functional association between variants, DEGs, and TFs. For example, the CREBBP TF regulatory motif is disrupted by the STARD10 (rs148235301) gene variant. CREBBP activates the genes FLT1 and FGFR1, and is co-expressed in BA9; these genes are upregulated in disease conditions that are involved in vascular smooth muscle and endothelial pathways. These pathways are essential to maintain the vascular integrity and restoration of BBB and provide neurotrophic factors and metabolites to save the surviving neuronal population against various stress stimuli. Therefore, loss of BBB integrity results in disruption of neurovascular communication and cerebral blood flow (Sweeney et al., 2018b). In AD and PD, reduced regional cerebral blood flow was observed in the motor cortex (Sweeney et al., 2018a). These events led to impairment in vascular-glial communication resulting in an energy crisis and influence the energy craving neurons. Due to metabolic stress, these neurons are unable to meet their energy requirement for securing functional homeostasis. Gene signature analysis and an in-depth literature search revealed that MAPK1, FGFR1, and FLT1 are promising therapeutic targets for AD and PD.
Abnormal neuroinflammation is the biggest threat to the BBB and endothelial cells. Investigating MAPK1 and FGFR1 targets may reduce neuroinflammation and extend neuronal survival. Modulating the FLT1 pathway may provide therapeutic VEGF concentration, which may activate the VEGFR2 pathway, reducing BBB permeability and leaky blood vessels. The proposed possible targets to treat neurodegeneration belong to the kinase family. Designing selective inhibitors for the kinase family is strenuous due to its domain functionality and cross-talk between various other kinases. A recent study explains the role of the kinome and its inhibitor design can open new ventures for neuroscientists to treat CNS degeneration (Krahn et al., 2020). Exploring these targets may reduce pathological neuroinflammation and increase vasculature integrity, saving the neuron from chronic insult.
Limitations
Major limitations of the present study are the small sample size (28 PD and nine AD samples) and the fact that we used in silico tools to predict the effect of variants. Although the results are reported using a small dataset all the variants identified in the work showed good agreements with other eQTL and GWAS studies of AD and PD using large datasets. The results obtained in this work could be strengthened upon the availability of a wide volume of data and experimental validation of the identified variants.
Another limitation of using pathological tissue samples is that it is not possible to distinguish targets that will address primary causative events from downstream pathology. For example, if cell type A (BA9) dies in both diseases, this would be reflected in the differential expression and appear to target this analysis. However, many possible scenarios could complicate this logic: (i) cell type A (BA9) could die via different mechanisms in these two diseases (AD/PD), making the target different (and unknown) in each condition and (ii) cell type A (BA9) might die only because cell type B has some primary malfunction that is not detected by the differential expression analysis and in this case, we would need to target cell type B.
Data Availability Statement
The original contributions presented in the study are included in the article/Supplementary Material, further inquiries can be directed to the corresponding author/s.
Author Contributions
MMG and SAPD conceived the project. SAPD carried out the computations. SAPD, SJ, YT, and MMG contributed toward discussions and manuscript preparation. All authors read and finalized the manuscript.
Conflict of Interest
The authors declare that the research was conducted in the absence of any commercial or financial relationships that could be construed as a potential conflict of interest.
Acknowledgments
We thank the Bioinformatics facility, Department of Biotechnology, and Indian Institute of Technology Madras for computational facilities. SD thanks the Ministry of Human Resource Development (MHRD), India, for providing research fellowship.
Supplementary Material
The Supplementary Material for this article can be found online at: https://www.frontiersin.org/articles/10.3389/fgene.2021.639160/full#supplementary-material
References
Abbott, N. J. (2002). Astrocyte-endothelial interactions and blood-brain barrier permeability. J. Anat. 200, 629–638. doi: 10.1046/J.1469-7580.2002.00064.X
Alanis-Lobato, G., Andrade-Navarro, M. A., and Schaefer, M. H. (2017). HIPPIE v2.0: enhancing meaningfulness and reliability of protein-protein interaction networks. Nucleic Acids Res. 45, D408–D414. doi: 10.1093/nar/gkw985
Albert, F. W., and Kruglyak, L. (2015). The role of regulatory variation in complex traits and disease. Nat. Rev. Genet. 16, 197–212. doi: 10.1038/nrg3891
Angelova, M. T., Dimitrova, D. G., Dinges, N., Lence, T., Worpenberg, L., Carré, C., et al. (2018). The emerging field of epitranscriptomics in neurodevelopmental and neuronal disorders. Front. Bioeng. Biotechnol. 6:46. doi: 10.3389/fbioe.2018.00046
Araujo, P. R., Yoon, K., Ko, D., Smith, A. D., Qiao, M., Suresh, U., et al. (2012). Before it gets started: regulating translation at the 5’ UTR. Comp. Funct. Genomics 2012, 1–8. doi: 10.1155/2012/475731
Bélanger, M., Allaman, I., and Magistretti, P. J. (2011). Brain energy metabolism: focus on astrocyte-neuron metabolic cooperation. Cell Metab. 14, 724–738. doi: 10.1016/J.CMET.2011.08.016
Berchtold, N. C., Prieto, G. A., Phelan, M., Gillen, D. L., Baldi, P., Bennett, D. A., et al. (2019). Hippocampal gene expression patterns linked to late-life physical activity oppose age and AD-related transcriptional decline. Neurobiol. Aging 78, 142–154. doi: 10.1016/j.neurobiolaging.2019.02.012
Blalock, E. M., Geddes, J. W., Chen, K. C., Porter, N. M., Markesbery, W. R., and Landfield, P. W. (2004). Incipient Alzheimer’s disease: microarray correlation analyses reveal major transcriptional and tumor suppressor responses. Proc. Natl. Acad. Sci. U.S.A. 101, 2173–2178. doi: 10.1073/pnas.0308512100
Borrageiro, G., Haylett, W., Seedat, S., Kuivaniemi, H., and Bardien, S. (2018). A review of genome-wide transcriptomics studies in Parkinson’s disease. Eur. J. Neurosci. 47, 1–16. doi: 10.1111/ejn.13760
Carithers, L. J., and Moore, H. M. (2015). The Genotype-Tissue Expression (GTEx) Project. Biopreserv. Biobank. 13, 307–308. doi: 10.1089/bio.2015.29031.hmm
Chen, J., Ren, Y., Gui, C., Zhao, M., Wu, X., Mao, K., et al. (2018). Phosphorylation of Parkin at serine 131 by p38 MAPK promotes mitochondrial dysfunction and neuronal death in mutant A53T α-synuclein model of Parkinson’s disease. Cell Death Dis. 9:700. doi: 10.1038/s41419-018-0722-7
Chen, P., Tang, H., Zhang, Q., Xu, L., Zhou, W., Hu, X., et al. (2020). Basic fibroblast growth factor (bfgf) protects the blood-brain barrier by binding of FGFR1 and activating the ERK signaling pathway after intra-abdominal hypertension and traumatic brain injury. Med. Sci. Monit. 26:e922009. doi: 10.12659/MSM.922009
Chen, Y., and Wang, X. (2020). MiRDB: an online database for prediction of functional microRNA targets. Nucleic Acids Res. 48, D127–D131. doi: 10.1093/nar/gkz757
Cho, S. J., Park, M. H., Han, C., Yoon, K., and Koh, Y. H. (2017). VEGFR2 alteration in Alzheimer’s disease. Sci. Rep. 7:17713. doi: 10.1038/s41598-017-18042-1
Ciryam, P., Kundra, R., Freer, R., Morimoto, R. I., Dobson, C. M., and Vendruscolo, M. (2016). A transcriptional signature of Alzheimer’s disease is associated with a metastable subproteome at risk for aggregation. Proc. Natl. Acad. Sci. U.S.A. 113, 4753–4758. doi: 10.1073/pnas.1516604113
CoppedÃ, F. (2014). The potential of epigenetic therapies in neurodegenerative diseases. Front. Genet. 5:220. doi: 10.3389/fgene.2014.00220
Craft, S. (2007). Insulin resistance and Alzheimer’s disease pathogenesis: potential mechanisms and implications for treatment. Curr. Alzheimer Res. 4, 147–152. doi: 10.2174/156720507780362137
Damier, P., Hirsch, E. C., Agid, Y., and Graybiel, A. M. (1999). The substantia nigra of the human brain. Brain 122, 1437–1448. doi: 10.1093/brain/122.8.1437
Dayem Ullah, A. Z., Oscanoa, J., Wang, J., Nagano, A., Lemoine, N. R., and Chelala, C. (2018). SNPnexus: assessing the functional relevance of genetic variation to facilitate the promise of precision medicine. Nucleic Acids Res. 46, W109–W113. doi: 10.1093/nar/gky399
DeKosky, S. T., and Scheff, S. W. (1990). Synapse loss in frontal cortex biopsies in Alzheimer’s disease: correlation with cognitive severity. Ann. Neurol. 27, 457–464. doi: 10.1002/ana.410270502
Deming, Y., Li, Z., Kapoor, M., Harari, O., Del-Aguila, J. L., Black, K., et al. (2017). Genome-wide association study identifies four novel loci associated with Alzheimer’s endophenotypes and disease modifiers. Acta Neuropathol. 133, 839–856. doi: 10.1007/s00401-017-1685-y
Dharshini, S. A. P., Taguchi, Y.-H., and Gromiha, M. M. (2019). Investigating the energy crisis in Alzheimer disease using transcriptome study. Sci. Rep. 9:18509. doi: 10.1038/s41598-019-54782-y
Dobin, A., Davis, C. A., Schlesinger, F., Drenkow, J., Zaleski, C., Jha, S., et al. (2013). STAR: ultrafast universal RNA-seq aligner. Bioinformatics 29, 15–21. doi: 10.1093/bioinformatics/bts635
Donega, V., Burm, S. M., van Strien, M. E., van Bodegraven, E. J., Paliukhovich, I., Geut, H., et al. (2019). Transcriptome and proteome profiling of neural stem cells from the human subventricular zone in Parkinson’s disease. Acta Neuropathol. Commun. 7:84. doi: 10.1186/s40478-019-0736-0
Dumitriu, A., Golji, J., Labadorf, A. T., Gao, B., Beach, T. G., Myers, R. H., et al. (2016). Integrative analyses of proteomics and RNA transcriptomics implicate mitochondrial processes, protein folding pathways and GWAS loci in Parkinson disease. BMC Med. Genomics 9:5. doi: 10.1186/s12920-016-0164-y
Freeman, L. R., and Keller, J. N. (2012). Oxidative stress and cerebral endothelial cells: regulation of the blood-brain-barrier and antioxidant based interventions. Biochim. Biophys. Acta 1822, 822–829. doi: 10.1016/j.bbadis.2011.12.009
Gan, L., Cookson, M. R., Petrucelli, L., and La Spada, A. R. (2018). Converging pathways in neurodegeneration, from genetics to mechanisms. Nat. Neurosci. 21, 1300–1309. doi: 10.1038/s41593-018-0237-7
Gerschütz, A., Heinsen, H., Grünblatt, E., Wagner, A. K., Bartl, J., Meissner, C., et al. (2014). Neuron-specific alterations in signal transduction pathways associated with Alzheimer’s disease. J. Alzheimers. Dis. 40, 135–142. doi: 10.3233/JAD-131280
Greene, C. S., Krishnan, A., Wong, A. K., Ricciotti, E., Zelaya, R. A., Himmelstein, D. S., et al. (2015). Understanding multicellular function and disease with human tissue-specific networks. Nat. Genet. 47, 569–576. doi: 10.1038/ng.3259
Guttula, S. V., Allam, A., and Gumpeny, R. S. (2012). Analyzing microarray data of Alzheimer’s using cluster analysis to identify the biomarker genes. Int. J. Alzheimers. Dis. 2012:649456. doi: 10.1155/2012/649456
Huang, D., Yi, X., Zhang, S., Zheng, Z., Wang, P., Xuan, C., et al. (2018). GWAS4D: multidimensional analysis of context-specific regulatory variant for human complex diseases and traits. Nucleic Acids Res. 46, W114–W120. doi: 10.1093/nar/gky407
Jun, G. R., Chung, J., Mez, J., Barber, R., Beecham, G. W., Bennett, D. A., et al. (2017). Transethnic genome-wide scan identifies novel Alzheimer’s disease loci. Alzheimer’s Dement. 13, 727–738. doi: 10.1016/J.JALZ.2016.12.012
Karagulle, A. T., Lehericy, K. S., Luciana, M., Ugurbil, K., and Tuite, P. (2008). Altered Diffusion in the Frontal Lobe in Parkinson Disease. AJNR Am. J. Neuroradiol. 29, 501–505. doi: 10.3174/ajnr.A0850
Krahn, A. I., Wells, C., Drewry, D. H., Beitel, L. K., Durcan, T. M., and Axtman, A. D. (2020). Defining the neural kinome: strategies and opportunities for small molecule drug discovery to target neurodegenerative diseases. ACS Chem. Neurosci. 11, 1871–1886. doi: 10.1021/acschemneuro.0c00176
Krueger, F. (2015). Trim Galore!: A wrapper tool around Cutadapt and FastQC to consistently apply quality and adapter trimming to FastQ files. Cambridge, MA: The Babraham Institute.
Kumar, S., Ambrosini, G., and Bucher, P. (2017). SNP2TFBS - a database of regulatory SNPs affecting predicted transcription factor binding site affinity. Nucleic Acids Res. 45, D139–D144. doi: 10.1093/nar/gkw1064
Kumar, S., and Reddy, P. H. (2016). Are circulating microRNAs peripheral biomarkers for Alzheimer’s disease? Biochim. Biophys. Acta - Mol. Basis Dis. 1862, 1617–1627. doi: 10.1016/j.bbadis.2016.06.001
Lamb, J., Crawford, E. D., Peck, D., Modell, J. W., Blat, I. C., Wrobel, M. J., et al. (2006). The connectivity map: using gene-expression signatures to connect small molecules, genes, and disease. Science 313, 1929–1935. doi: 10.1126/science.1132939
Lambert, J. C., Ibrahim-Verbaas, C. A., Harold, D., Naj, A. C., Sims, R., Bellenguez, C., et al. (2013). Meta-analysis of 74,046 individuals identifies 11 new susceptibility loci for Alzheimer’s disease. Nat. Genet. 45, 1452–1458. doi: 10.1038/ng.2802
Lanke, V., Moolamalla, S. T. R., Roy, D., and Vinod, P. K. (2018). Integrative analysis of hippocampus gene expression profiles identifies network alterations in aging and Alzheimer’s disease. Front. Aging Neurosci. 10:153. doi: 10.3389/fnagi.2018.00153
Lasky, J. L., and Wu, H. (2005). Notch signaling, brain development, and human disease. Pediatr. Res. 57, 104R–109R. doi: 10.1203/01.PDR.0000159632.70510.3D
Lau, S. F., Cao, H., Fu, A. K. Y., and Ip, N. Y. (2020). Single-nucleus transcriptome analysis reveals dysregulation of angiogenic endothelial cells and neuroprotective glia in Alzheimer’s disease. Proc. Natl. Acad. Sci. U.S.A. 117, 25800–25809. doi: 10.1073/pnas.2008762117
Lee, S., Zhang, C., Arif, M., Liu, Z., Benfeitas, R., Bidkhori, G., et al. (2018). TCSBN: a database of tissue and cancer specific biological networks. Nucleic Acids Res. 46, D595–D600. doi: 10.1093/nar/gkx994
Lesnick, T. G., Papapetropoulos, S., Mash, D. C., Ffrench-Mullen, J., Shehadeh, L., De Andrade, M., et al. (2007). A genomic pathway approach to a complex disease: axon guidance and Parkinson disease. PLoS Genet. 3:e0030098. doi: 10.1371/journal.pgen.0030098
Levine, A. J., Miller, J. A., Shapshak, P., Gelman, B., Singer, E. J., Hinkin, C. H., et al. (2013). Systems analysis of human brain gene expression: mechanisms for HIV-associated neurocognitive impairment and common pathways with Alzheimer’s disease. BMC Med. Genomics 6:4. doi: 10.1186/1755-8794-6-4
Liang, W. S., Reiman, E. M., Valla, J., Dunckley, T., Beach, T. G., Grover, A., et al. (2008). Alzheimer’s disease is associated with reduced expression of energy metabolism genes in posterior cingulate neurons. Proc. Natl. Acad. Sci. U.S.A. 105, 4441–4446. doi: 10.1073/pnas.0709259105
Love, M. I., Huber, W., and Anders, S. (2014). Moderated estimation of fold change and dispersion for RNA-seq data with DESeq2. Genome Biol. 15:550. doi: 10.1186/s13059-014-0550-8
Ma, M., Ru, Y., Chuang, L. S., Hsu, N. Y., Shi, L. S., Hakenberg, J., et al. (2015). Disease-associated variants in different categories of disease located in distinct regulatory elements. BMC Genomics 16:S3. doi: 10.1186/1471-2164-16-S8-S3
Mahoney, E. R., Dumitrescu, L., Moore, A. M., Cambronero, F. E., De Jager, P. L., Koran, M. E. I., et al. (2019). Brain expression of the vascular endothelial growth factor gene family in cognitive aging and alzheimer’s disease. Mol. Psychiatry 26, 888–896. doi: 10.1038/s41380-019-0458-5
Mao, F., Xiao, L., Li, X., Liang, J., Teng, H., Cai, W., et al. (2016). RBP-var: a database of functional variants involved in regulation mediated by RNA-binding proteins. Nucleic Acids Res. 44, D154–D163. doi: 10.1093/nar/gkv1308
McGuire, M. H., Herbrich, S. M., Dasari, S. K., Wu, S. Y., Wang, Y., Rupaimoole, R., et al. (2019). Pan-cancer genomic analysis links 3’UTR DNA methylation with increased gene expression in T cells. EBioMedicine 43, 127–137. doi: 10.1016/j.ebiom.2019.04.045
McKenna, A., Hanna, M., Banks, E., Sivachenko, A., Cibulskis, K., Kernytsky, A., et al. (2010). The genome analysis Toolkit: a MapReduce framework for analyzing next-generation DNA sequencing data. Genome Res. 20, 1297–1303. doi: 10.1101/gr.107524.110
Muddapu, V. R., Dharshini, S. A. P., Chakravarthy, V. S., and Gromiha, M. M. (2020). Neurodegenerative diseases – is metabolic deficiency the root cause? Front. Neurosci. 14:213. doi: 10.3389/fnins.2020.00213
Narayanan, M., Huynh, J. L., Wang, K., Yang, X., Yoo, S., McElwee, J., et al. (2014). Common dysregulation network in the human prefrontal cortex underlies two neurodegenerative diseases. Mol. Syst. Biol. 10:743. doi: 10.15252/msb.20145304
Ng, B., White, C. C., Klein, H.-U., Sieberts, S. K., McCabe, C., Patrick, E., et al. (2017). An xQTL map integrates the genetic architecture of the human brain’s transcriptome and epigenome. Nat. Neurosci. 20, 1418–1426. doi: 10.1038/nn.4632
Ni, R., Rudin, M., and Klohs, J. (2018). Cortical hypoperfusion and reduced cerebral metabolic rate of oxygen in the arcAβ mouse model of Alzheimer’s disease. Photoacoustics 10, 38–47. doi: 10.1016/j.pacs.2018.04.001
Pallarès-Albanell, J., Teresa Zomeño-Abellán, M., Escaramís, G., Pantano, L., Soriano, A., Segura, M. F., et al. (2019). A high-throughput screening identifies MicroRNA inhibitors that influence neuronal maintenance and/or response to oxidative stress. Mol. Ther. Nucleic Acid 17, 374–387. doi: 10.1016/j.omtn.2019.06.007
Pankratz, N., Beecham, G. W., DeStefano, A. L., Dawson, T. M., Doheny, K. F., Factor, S. A., et al. (2012). Meta-analysis of Parkinson’s disease: identification of a novel locus, RIT2. Ann. Neurol. 71, 370–384. doi: 10.1002/ana.22687
Patel, H., Hodges, A. K., Curtis, C., Lee, S. H., Troakes, C., Dobson, R. J. B., et al. (2019). Transcriptomic analysis of probable asymptomatic and symptomatic alzheimer brains. Brain Behav. Immun. 80, 644–656. doi: 10.1016/j.bbi.2019.05.009
Patel, N. S., Mathura, V. S., Bachmeier, C., Beaulieu-Abdelahad, D., Laporte, V., Weeks, O., et al. (2010). Alzheimer’s β-amyloid peptide blocks vascular endothelial growth factor mediated signaling via direct interaction with VEGFR-2. J. Neurochem. 112, 66–76. doi: 10.1111/j.1471-4159.2009.06426.x
Patro, R., Duggal, G., Love, M. I., Irizarry, R. A., and Kingsford, C. (2017). Salmon provides fast and bias-aware quantification of transcript expression. Nat. Methods 14, 417–419. doi: 10.1038/nmeth.4197
Piehl, F., and Olsson, T. (2009). Inflammation and susceptibility to neurodegeneration: the use of unbiased genetics to decipher critical regulatory pathways. Neuroscience 158, 1143–1150. doi: 10.1016/j.neuroscience.2008.08.031
Piras, I. S., Krate, J., Delvaux, E., Nolz, J., Mastroeni, D. F., Persico, A. M., et al. (2019). Transcriptome changes in the Alzheimer’s disease middle temporal gyrus: importance of RNA metabolism and mitochondria-associated membrane genes. J. Alzheimer’s Dis. 70, 691–713. doi: 10.3233/JAD-181113
Raj, T., Li, Y. I., Wong, G., Humphrey, J., Wang, M., Ramdhani, S., et al. (2018). Integrative transcriptome analyses of the aging brain implicate altered splicing in Alzheimer’s disease susceptibility. Nat. Genet. 50, 1584–1592. doi: 10.1038/s41588-018-0238-1
Scheckel, C., Drapeau, E., Frias, M. A., Park, C. Y., Fak, J., Zucker-Scharff, I., et al. (2016). Regulatory consequences of neuronal ELAV-like protein binding to coding and non-coding RNAs in human brain. eLife 5:e10421. doi: 10.7554/eLife.10421
Shi, Y.-J., Shi, M., Xiao, L.-J., Li, L., Zou, L.-H., Li, C.-Y., et al. (2018). Inhibitive effects of FGF2/FGFR1 pathway on astrocyte-mediated inflammation in vivo and in vitro after infrasound exposure. Front. Neurosci. 12:582. doi: 10.3389/fnins.2018.00582
Siepel, A., Bejerano, G., Pedersen, J. S., Hinrichs, A. S., Hou, M., Rosenbloom, K., et al. (2005). Evolutionarily conserved elements in vertebrate, insect, worm, and yeast genomes. Genome Res. 15, 1034–1050. doi: 10.1101/gr.3715005
Simchovitz, A., Hanan, M., Yayon, N., Lee, S., Bennett, E. R., Greenberg, D. S., et al. (2020). A lncRNA survey finds increases in neuroprotective LINC-PINT in Parkinson’s disease substantia nigra. Aging Cell 19:13115. doi: 10.1111/acel.13115
Srinivasan, K., Friedman, B. A., Etxeberria, A., Huntley, M. A., van der Brug, M. P., Foreman, O., et al. (2020). Alzheimer’s patient microglia exhibit enhanced aging and unique transcriptional activation. Cell Rep. 31:107843. doi: 10.1016/j.celrep.2020.107843
Stathias, V., Turner, J., Koleti, A., Vidovic, D., Cooper, D., Fazel-Najafabadi, M., et al. (2020). LINCS Data Portal 2.0: next generation access point for perturbation-response signatures. Nucleic Acids Res. 48, D431–D439. doi: 10.1093/nar/gkz1023
Steri, M., Idda, M. L., Whalen, M. B., and Orrù, V. (2018). Genetic variants in mRNA untranslated regions. Wiley Interdiscip. Rev. RNA 9:e1474. doi: 10.1002/wrna.1474
Subramanian, A., Narayan, R., Corsello, S. M., Peck, D. D., Natoli, T. E., Lu, X., et al. (2017). A next generation connectivity map: L1000 platform and the first 1,000,000 profiles. Cell 171, 1437.e17–1452.e17. doi: 10.1016/j.cell.2017.10.049
Sweeney, M. D., Kisler, K., Montagne, A., Toga, A. W., and Zlokovic, B. V. (2018a). The role of brain vasculature in neurodegenerative disorders. Nat. Neurosci. 21, 1318–1331. doi: 10.1038/s41593-018-0234-x
Sweeney, M. D., Sagare, A. P., and Zlokovic, B. V. (2018b). Blood–brain barrier breakdown in Alzheimer disease and other neurodegenerative disorders. Nat. Rev. Neurol. 14, 133–150. doi: 10.1038/nrneurol.2017.188
Tiwari, V., and Patel, A. B. (2014). Pyruvate carboxylase and pentose phosphate fluxes are reduced in AβPP-PS1 mouse model of Alzheimer’s disease: a 13C NMR study. J. Alzheimer’s Dis. 41, 387–399. doi: 10.3233/JAD-122449
Valor, L., Viosca, J., Lopez-Atalaya, J., and Barco, A. (2013). Lysine acetyltransferases CBP and p300 as therapeutic targets in cognitive and neurodegenerative disorders. Curr. Pharm. Des. 19, 5051–5064. doi: 10.2174/13816128113199990382
von Bernhardi, R., Cornejo, F., Parada, G. E., and Eugenín, J. (2015). Role of TGFβ signaling in the pathogenesis of Alzheimer’s disease. Front. Cell. Neurosci. 9:426. doi: 10.3389/fncel.2015.00426
Wang, H., Lou, D., and Wang, Z. (2019). Crosstalk of genetic variants, allele-specific DNA methylation, and environmental factors for complex disease risk. Front. Genet. 10:695. doi: 10.3389/fgene.2018.00695
Wang, J., Raskin, L., Samuels, D. C., Shyr, Y., and Guo, Y. (2015). Genome measures used for quality control are dependent on gene function and ancestry. Bioinformatics 31, 318–323. doi: 10.1093/bioinformatics/btu668
Wang, M., Roussos, P., McKenzie, A., Zhou, X., Kajiwara, Y., Brennand, K. J., et al. (2016). Integrative network analysis of nineteen brain regions identifies molecular signatures and networks underlying selective regional vulnerability to Alzheimer’s disease. Genome Med. 8:104. doi: 10.1186/s13073-016-0355-3
Wang, X., and Michaelis, E. K. (2010). Selective neuronal vulnerability to oxidative stress in the brain. Front. Aging Neurosci. 2:12. doi: 10.3389/fnagi.2010.00012
Wang, X., Pal, R., Chen, X. W., Kumar, K. N., Kim, O. J., and Michaelis, E. K. (2007). Genome-wide transcriptome profiling of region-specific vulnerability to oxidative stress in the hippocampus. Genomics 90, 201–212. doi: 10.1016/j.ygeno.2007.03.007
Ward, L. D., and Kellis, M. (2012). HaploReg: a resource for exploring chromatin states, conservation, and regulatory motif alterations within sets of genetically linked variants. Nucleic Acids Res. 40, D930–D934. doi: 10.1093/nar/gkr917
Weddell, J. C., Chen, S., and Imoukhuede, P. I. (2018). VEGFR1 promotes cell migration and proliferation through PLCγ and PI3K pathways. NPJ Syst. Biol. Appl. 4, 1–11. doi: 10.1038/s41540-017-0037-9
Wilde, G. J., Pringle, A. K., Wright, P., and Iannotti, F. (1997). Differential vulnerability of the CA1 and CA3 subfields of the hippocampus to superoxide and hydroxyl radicals in vitro. J. Neurochem. 69, 883–886. doi: 10.1046/j.1471-4159.1997.69020883.x
Wu, G., Dawson, E., Duong, A., Haw, R., and Stein, L. (2014). ReactomeFIViz: a Cytoscape app for pathway and network-based data analysis. F1000Research 3:146. doi: 10.12688/f1000research.4431.2
Yang, S. P., Bae, D. G., Kang, H. J., Gwag, B. J., Gho, Y. S., and Chae, C. B. (2004). Co-accumulation of vascular endothelial growth factor with β-amyloid in the brain of patients with Alzheimer’s disease. Neurobiol. Aging 25, 283–290. doi: 10.1016/S0197-4580(03)00111-8
Ye, L., Wang, X., Cai, C., Zeng, S., Bai, J., Guo, K., et al. (2019). FGF21 promotes functional recovery after hypoxic-ischemic brain injury in neonatal rats by activating the PI3K/Akt signaling pathway via FGFR1/β-klotho. Exp. Neurol. 317, 34–50. doi: 10.1016/j.expneurol.2019.02.013
Zenaro, E., Piacentino, G., and Constantin, G. (2017). The blood-brain barrier in Alzheimer’s disease. Neurobiol. Dis. 107, 41–56. doi: 10.1016/J.NBD.2016.07.007
Keywords: blood-brain barrier, Brodmann area-9, inflammatory response, energy dysfunction, transcription factor
Citation: Dharshini SAP, Jemimah S, Taguchi YH and Gromiha MM (2021) Exploring Common Therapeutic Targets for Neurodegenerative Disorders Using Transcriptome Study. Front. Genet. 12:639160. doi: 10.3389/fgene.2021.639160
Received: 08 December 2020; Accepted: 22 February 2021;
Published: 19 March 2021.
Edited by:
Graziano Pesole, University of Bari Aldo Moro, ItalyReviewed by:
Carlo Colantuoni, Johns Hopkins Medicine, United StatesKatarzyna Gaweda-Walerych, Polish Academy of Sciences, Poland
Copyright © 2021 Dharshini, Jemimah, Taguchi and Gromiha. This is an open-access article distributed under the terms of the Creative Commons Attribution License (CC BY). The use, distribution or reproduction in other forums is permitted, provided the original author(s) and the copyright owner(s) are credited and that the original publication in this journal is cited, in accordance with accepted academic practice. No use, distribution or reproduction is permitted which does not comply with these terms.
*Correspondence: M. Michael Gromiha, Z3JvbWloYUBpaXRtLmFjLmlu