 Cong Pian
 Zhixin Yang
 Yuqian Yang
 Liangyun Zhang
 Yuanyuan Chen
- College of Science, Nanjing Agricultural University, Nanjing, China
N6-methyladenosine (m6A), the most common posttranscriptional modification in eukaryotic mRNAs, plays an important role in mRNA splicing, editing, stability, degradation, etc. Since the methylation state is dynamic, methylation sequencing needs to be carried out over different time periods, which brings some difficulties to identify the RNA methyladenine sites. Thus, it is necessary to develop a fast and accurate method to identify the RNA N6-methyladenosine sites in the transcriptome. In this study, we use first-order and second-order Markov models to identify RNA N6-methyladenine sites in three species (Saccharomyces cerevisiae, mouse, and Homo sapiens). These two methods can fully consider the correlation between adjacent nucleotides. The results show that the performance of our method is better than that of other existing methods. Furthermore, the codons encoded by three nucleotides have biases in mRNA, and a second-order Markov model can capture this kind of information exactly. This may be the main reason why the performance of the second-order Markov model is better than that of the first-order Markov model in the m6A prediction problem. In addition, we provide a corresponding web tool called MM-m6APred.
Introduction
To date, more than 160 types of RNA modifications have been discovered (Zhao et al., 2019). In these modifications, N6-methyladenosine (m6A) is the most common and abundant one existing in various species. It is closely associated with diverse biological processes, such as RNA localization and degradation (Wang et al., 2014), RNA structural dynamics (Roost et al., 2015), alternative splicing (Liu et al., 2015), and primary microRNA processing (Alarcón et al., 2015). Thus, identification of m6A sites is of great importance for better understanding their function and mechanisms (Chen et al., 2015). In the past few years, high-throughput experimental methods, such as MERIPP (Geula et al., 2015) and M6ASeq (Meyer et al., 2012), have been used to identify m6A modifications, but these methods have some limitations: (1) The location of the m6A site cannot be accurately located; (2) the cost is high; and (3) they are not applicable for the large-scale identification of m6A sites. Hence, it is highly desirable to develop a fast and accurate computational method for the identification of m6A sites (Dominissini et al., 2012).
Currently, there are several effective methods for predicting m6A sites based on machine learning, mainly including iRNA-Methyl (Chen et al., 2015), SRAMP (Zhou et al., 2016), M6AMRFS (Qiang et al., 2018), M6APred–EL (Wei et al., 2018), pm6A-CNN (Roost et al., 2015), and iN6-Methyl (Nazari et al., 2019) etc. The above methods actually use the physical and chemical properties of nucleotides in various species, such as the nucleotide frequency at specific locations and the chemical properties of nucleotides, to extract features and predict m6A sites. However, none of these methods can capture the correlation between adjacent nucleotides well, while the Markov model can model this kind of correlation. In fact, Pian et al. (2020) used a first-order Markov model to predict the DNA N6-methyladenine sites. Recently, we proposed a method to predict DNA 4mC sites based on the second-order Markov model (Yang et al., 2020). Later, we found that the second-order Markov model is more suitable for predicting the methylation sites of RNA m6A because of the biases of the triplet codons in mRNA. The main purpose of this article is to provide a more accurate prediction tool of m6A.
Based on this idea, we used a second-order Markov model to identify the m6A sites of RNA. The m6A data of the three species of Saccharomyces cerevisiae, mouse, and Homo sapiens, were used to evaluate our model. The results show that the prediction performances of the first-order Markov model and the second-order Markov model are significantly better than those of the other four existing prediction tools. In addition, the second-order Markov model outperforms the first-order Markov model, which indicates that the second-order Markov model can capture the codon bias in mRNA well. This suggests that second-order Markov may be able to characterize the codon bias in mRNA.
Materials and Methods
Benchmark Datasets
In this study, we used three benchmark datasets from three different species: S. cerevisiae (Chen et al., 2015), mouse (Dominissini et al., 2012), and H. sapiens (Chen et al., 2017). The corresponding number of positive samples was 1,300, 725, and 1,130. There were as many negative samples as positive samples. Table 1 shows the details of these data. For the three benchmark datasets, the positives were the sequences centered with true m6A sites, while the negatives were the sequences centered with adenines but without any m6A peaks detected. The datasets can be downloaded from the following website1.
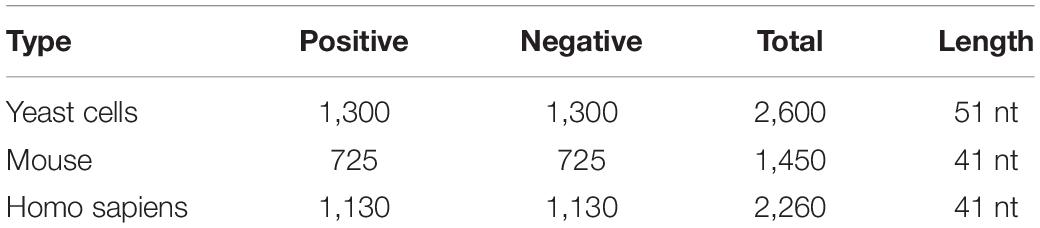
Table 1. Details of benchmark datasets.
Model Construction
A Markov model is a stochastic process where the next variable depends on only the most recent variable(s) instead of all the previous variables. In this sequence information study, we first model a sequence as a first-order Markov chain, and the current nucleotide depends on the previous nucleotide only. More specifically, for the m6A sequences of positive samples in the training data, we first calculate the initial probability , , , of the initial state S1 nucleotide being A, G, C or U, respectively. Then, we need to calculate the transfer probability of the current nucleotide state to the next state individually from the initial state S1 (for example, represents the probability that nucleotide G in state S2 transfers to nucleotide A in state S3).
Thus, we can obtain the probability of the occurrence of the four nucleotides in the initial state and the transfer probability matrix of each state except the last one. Similarly, for the negative sequences of non-m6A, the probability of the occurrence of the corresponding four nucleotides in the initial state and the transition probability matrix can also be obtained. Therefore, two Markov models are trained based on the m6A sequences and non-m6A sequences in the training dataset.
In the process of prediction, we need to select the probability values according to the nucleotide arrangement of the sequence, including the initial state probability and the corresponding transfer probability from the positive and negative Markov models in the previous step. Then, we calculate the products of positive and negative probability values. Finally, we calculate the ratio of the positive product and negative product. If the ratio is greater than 1, the sequence is considered a m6A sample. Otherwise, it is considered a non-m6A sample.
Since there is a bias in the codon of mRNA (Kurland, 1991; Quax, 2015), we consider using a second-order Markov model to capture this bias. The flowcharts of the training and testing of the second-order Markov model are shown in Figure 1. For the m6A sequences, we first calculate the initial probability of the first dinucleotide. Then, we need to calculate the transfer probabilityof the current dinucleotide (Sn Sn+1) to the next nucleotide (Sn+2) (for example, represents the probability of state S1S2 transferring to S3, where the nucleotide of state S1S2 is AA, and the nucleotide of state S3 is A). Thus, 39 transfer probability matrices with 16 rows and four columns can be obtained. Similarly, the initial probability and transfer probability can be obtained for non-m6A sequences. Therefore, two Markov models (M_P and M_N) are similarly trained based on the m6A sequences and non-m6A sequences in the training dataset. Taking the sequence “seq = GUAUAUAACUUUUUUCUUCAAGGAGCAGGUGUC UGCCUAA” as an example, the probabilities P(seq|M_P) and P(seq|M_N) of the sequence “seq” under models M_P and M_N are obtained, respectively. Then, the value of Ratio = P(seq|MP)/P(seq|MN) can be used to determine the class of “seq,” where
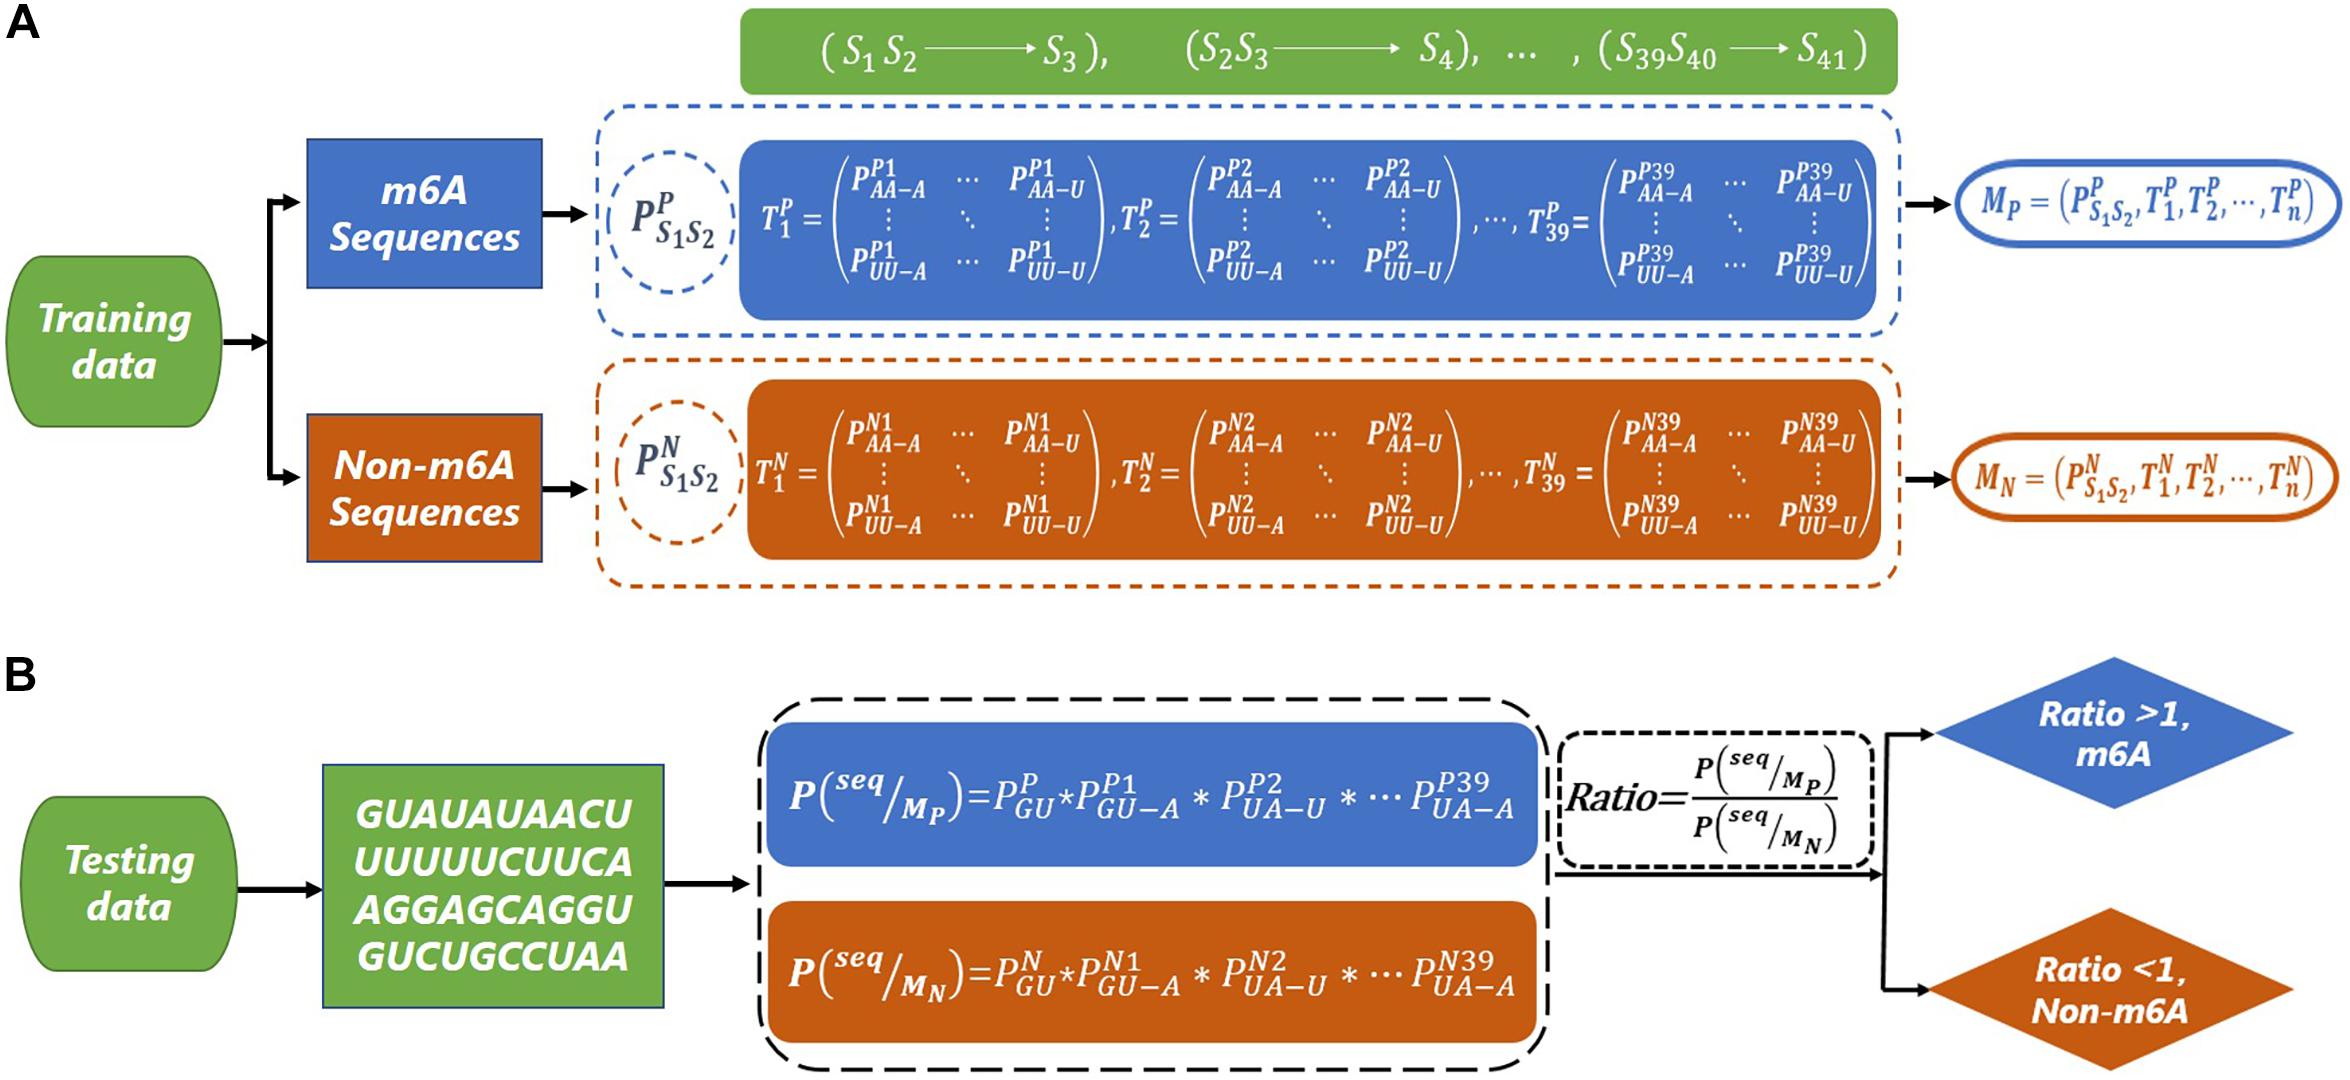
Figure 1. The flow chart of m6A site prediction. (A) The construction of second-order Markov model (MP and MN) based on m6A sequence and non-m6A sequence. (B) The prediction for a test sequence. The sequence “GUAUAUAACUUUUUUCUUCAAGGAGCAGGUGUCUGCCUAA” is used as an example to explain the prediction process.
and
If the Ratio > 1, “seq” is classified as a m6A sequence; otherwise, it is classified as a non-m6A sequence.
Performance Evaluation
Ten-fold cross-validation was used to assess the reliability of the method. In the performance evaluation, the sensitivity (Sn), specificity (Sp), accuracy (ACC), and Mathew’s correlation coefficient (MCC) were calculated. They are formulated as follows:
where TP, TN, FP, and FN denote true positive, true negative, false positive, and false negative, respectively. Sn measures the predictive ability of a predictor for positive samples, while Sp measures the predictive ability of a predictor for negative samples. ACC and MCC are two metrics measuring the overall performance of a predictor.
Results and Discussion
Representation and Illustration of ()
For the second-order Markov model, the heat map of the quotient matrix () of second-order transfer probability of m6A samples divided by the second-order transfer probability of non-m6A samples is shown in Figure 2. In order to facilitate comparison, the results of heat map were standardized. The results show that there is a significant difference in the transfer probability of nucleotides at some positions between the positive and negative samples. This indicated that the second-order Markov chain is informative for predicting sequences containing m6A sites.
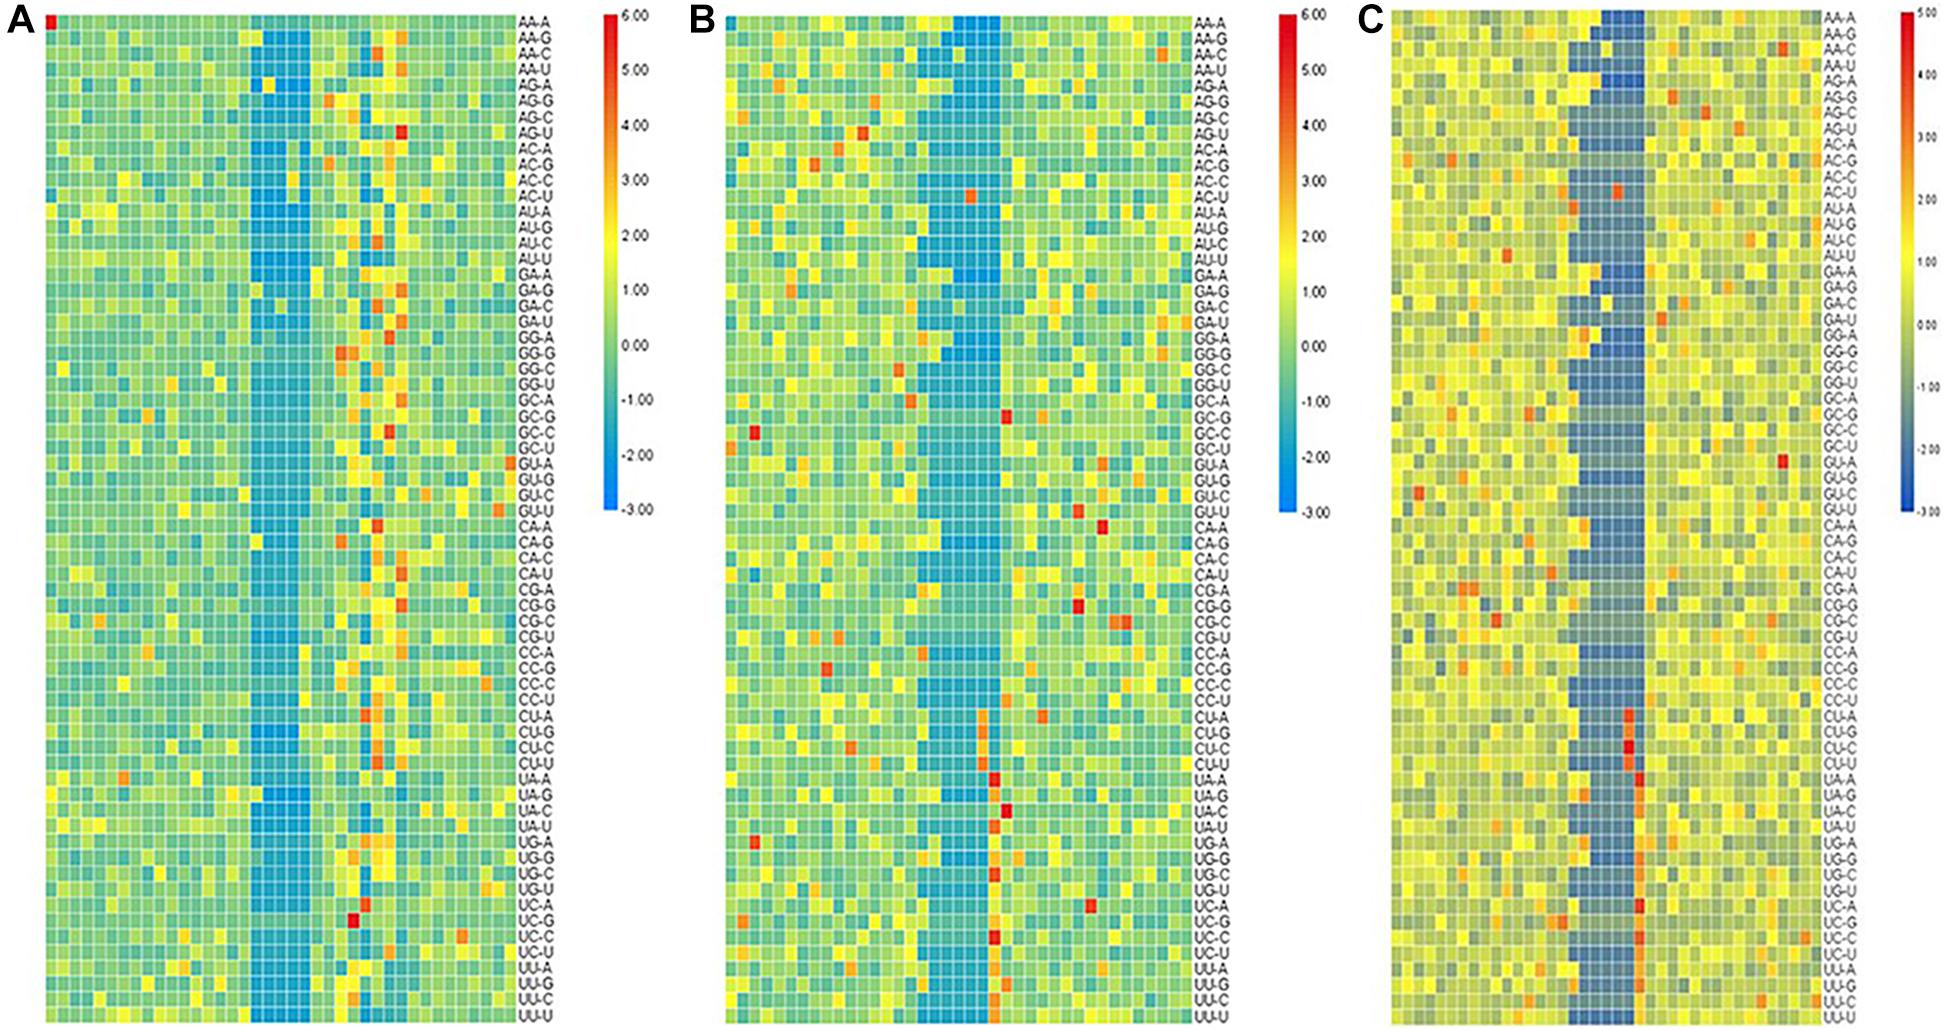
Figure 2. The heat map of standardized quotient of the transfer probabilities of the three types of species. The heat map of standardized quotient of the transfer probabilities of the three types of species. (A) Saccharomyces cerevisiae cells, (B) mouse, and (C) Homo sapiens.
We also plotted the line charts of transfer probability of the second-order Markov model (Shown in Supplementary Material 1). Similar to the first-order Markov model, the transfer probability of positive samples is significantly different from that of negative samples in the second-order Markov model. Furthermore, the number of significant different sits in the second-order Markov model are obviously greater than that in the first-order Markov model from the line charts in Supplementary Material 2. It indicates that more information is provided in the second-order Markov model to help determine the type of sequences.
The Distribution of Ratios in the Positive and Negative Sample Sets
Probability density maps of ln(Ratio) values for three species based on the second-order transfer probability products are shown in Figure 3. It can be found that in each species, the distribution of ln(Ratio) is very different between positive and negative samples, except for a small amount of overlap in the probability density graphs. The Ratio value of positive samples is significantly greater than that of negative samples, which enables the positive and negative samples to be divided accurately.
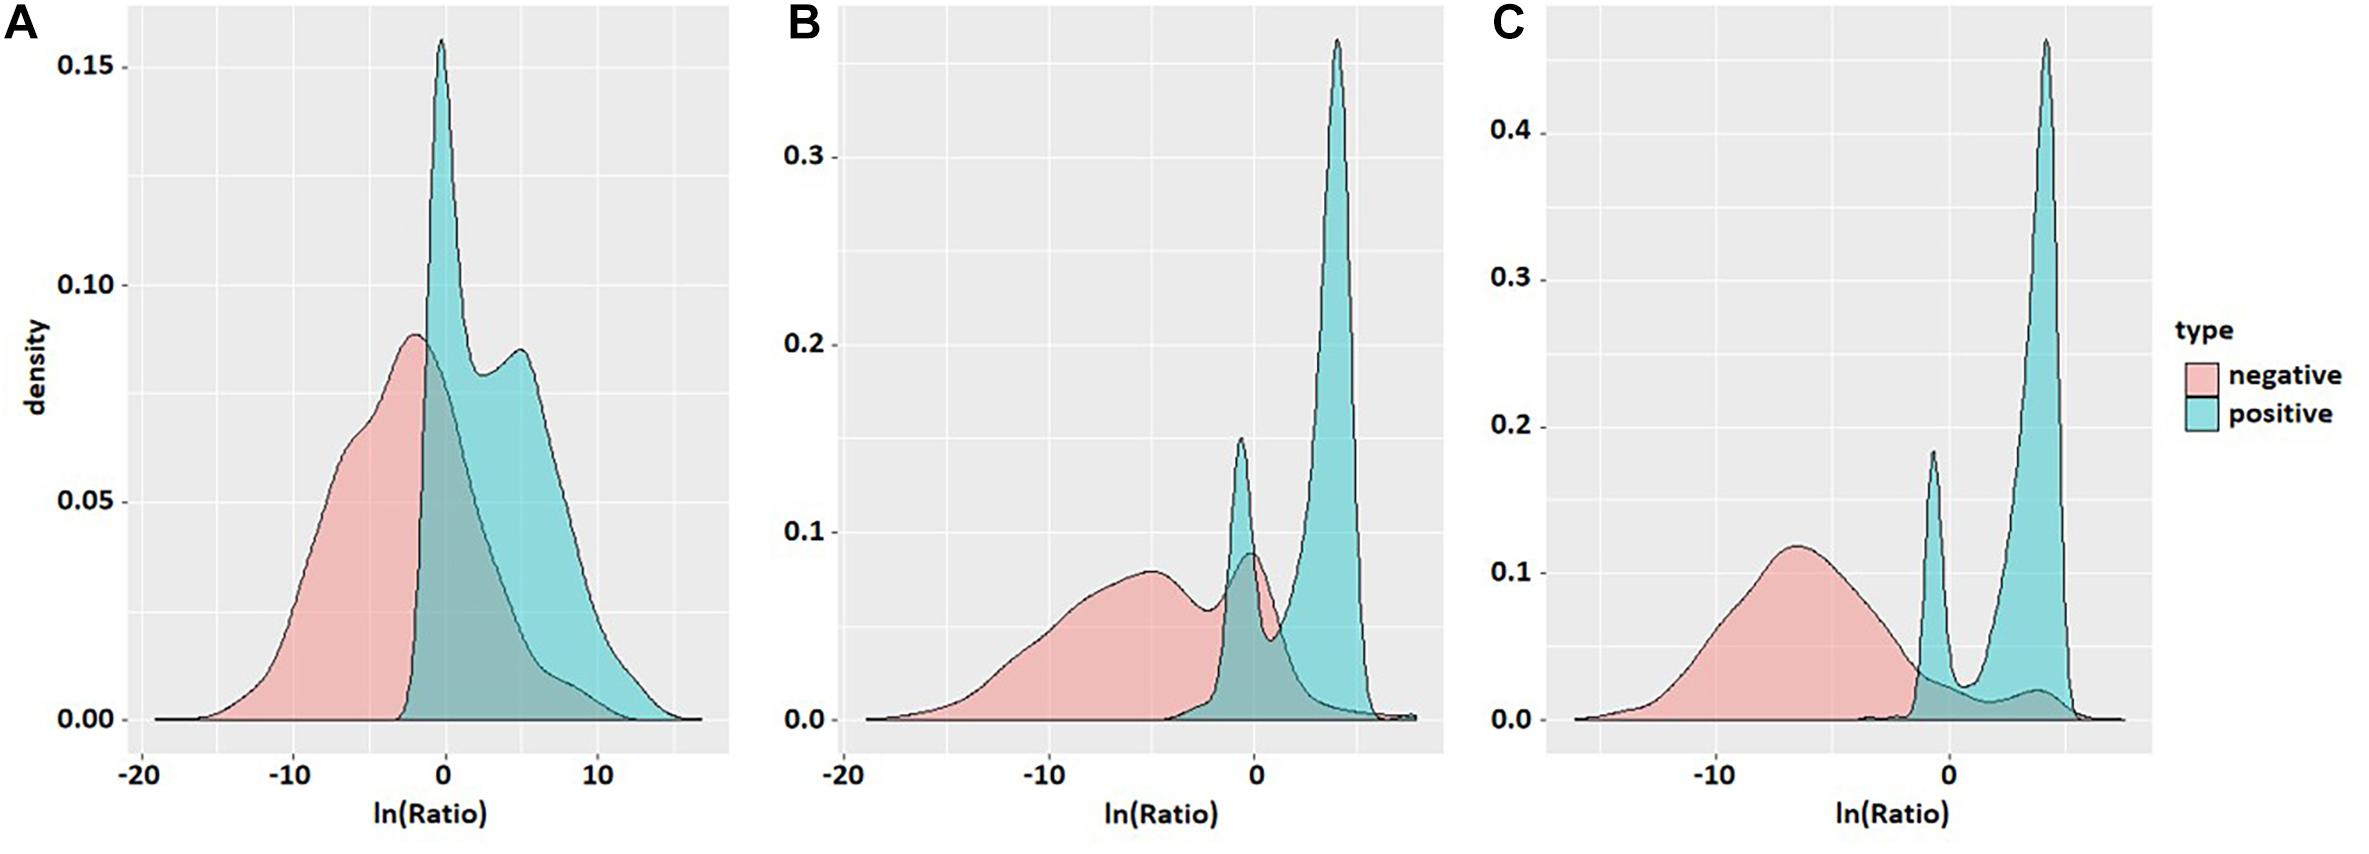
Figure 3. Probability density maps of ln(Ratio) values of the three species. The three density maps (A), (B), and (C) correspond to S. cerevisiae, mouse, and H. sapiens. Red is negative and blue is positive.
Comparison and Analysis
To evaluate our Markov model, we compared the performance of the two methods based on the Markov model with those of other m6A classifiers, including iRNA-Methyl, SRAMP, M6AMRFS, and M6APred-EL. Table 2 and Figure 4 show the prediction results of various methods (10-fold cross validation was used in all methods).
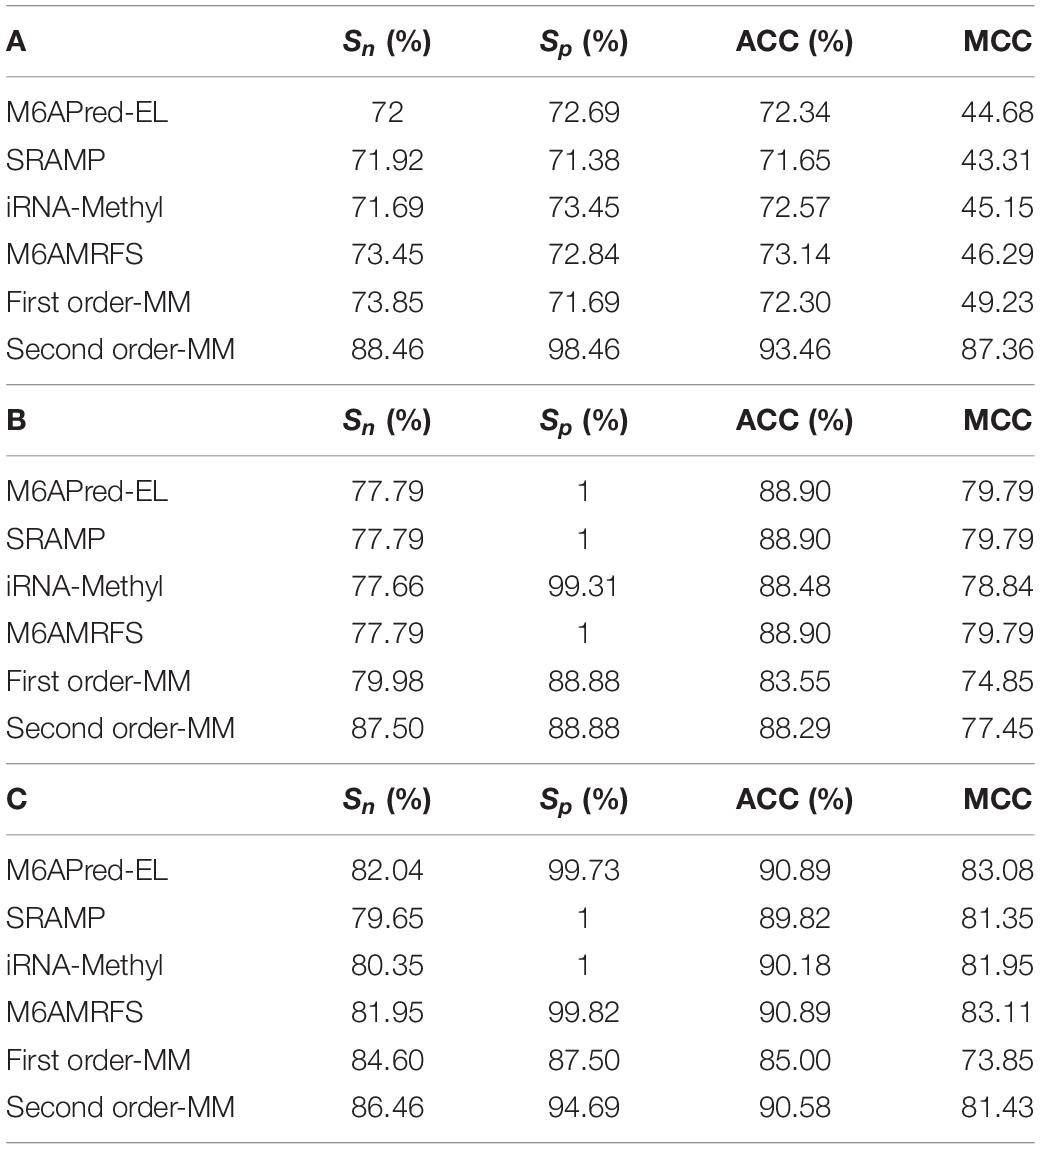
Table 2. Evaluation data comparison table of six methods in (A) S. cerevisiae, (B) mouse, and (C) H. sapiens.
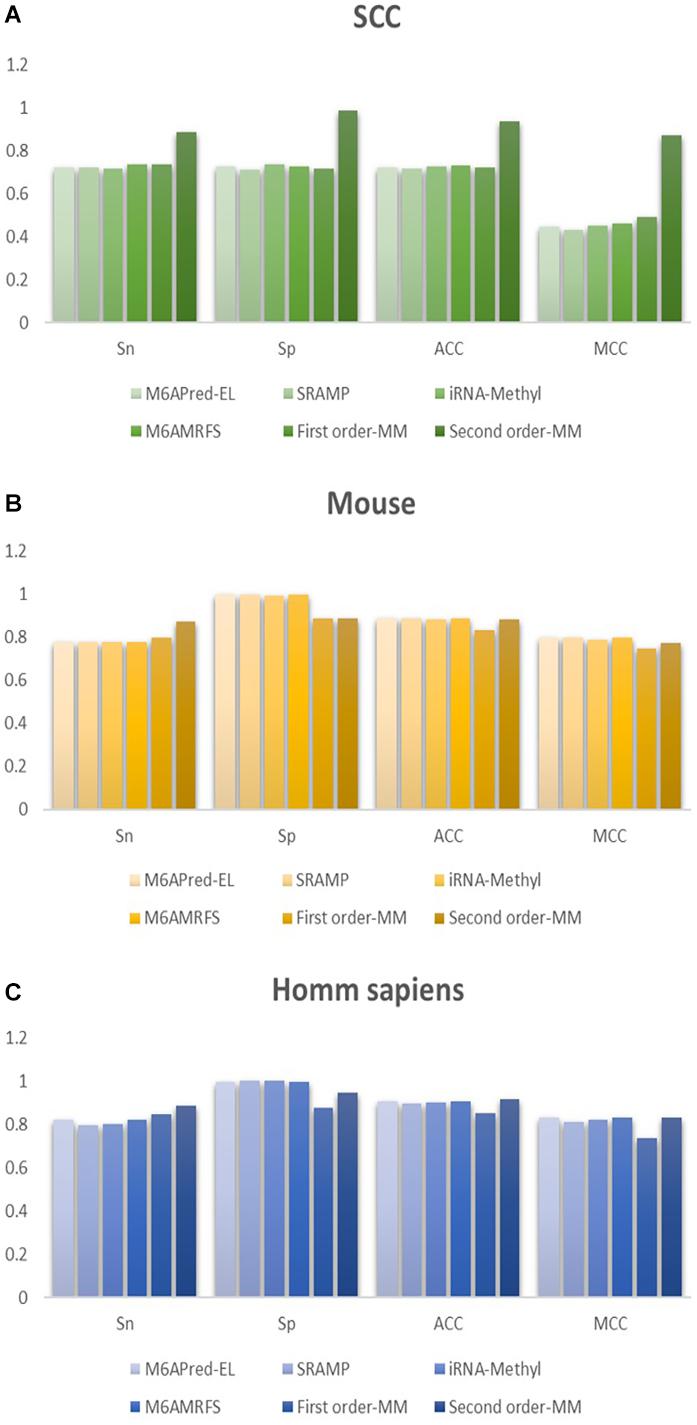
Figure 4. Comparison of the prediction effect of the six methods in (A) S. cerevisiae, (B) mouse, and (C) H. sapiens.
It can be found that the two methods based on the Markov model in m6A types of sequence identification had better or equal classification effects than several kinds of classifiers and that the second-order Markov model performed much better than the first-order Markov model in each aspect. It is noteworthy that Sp in several other methods is 100% in the species of mouse and H. sapiens, while the Sp of our method is close to 90% on average. Therefore, we checked these non-m6A data and found that the selection of negative sample data in the original literature [12] is unreasonable. The states S22 of the negative samples in mouse and human are all C, and the states S20 are all A or G. This is the reason why Sp of other methods can reach 100%. To evaluate our method more fairly, we downloaded 725 m6A sequences of mice from the m6Avar database, and the same number of sequences were randomly selected from the non-m6A sequences of the dbSNP database as negative samples. We used these data to retrain new models and carried out 10-fold cross validation in all methods. The performance results of all the above methods are shown in Table 3 and Figure 5. The results indicate that all the performance metrics based on the two Markov model are high. And the second-order Markov model still performed much better than the first-order Markov mode.
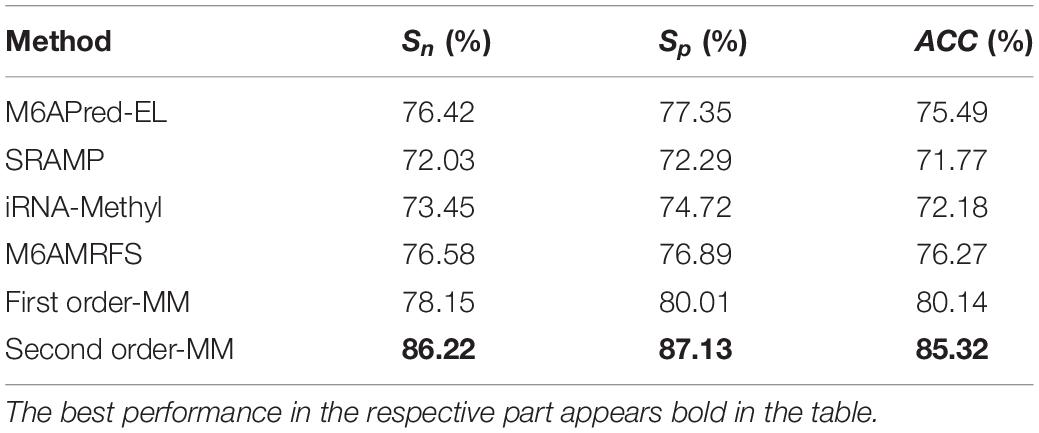
Table 3. Comparison of the prediction effect of m6A in mice based on the m6Avar database.
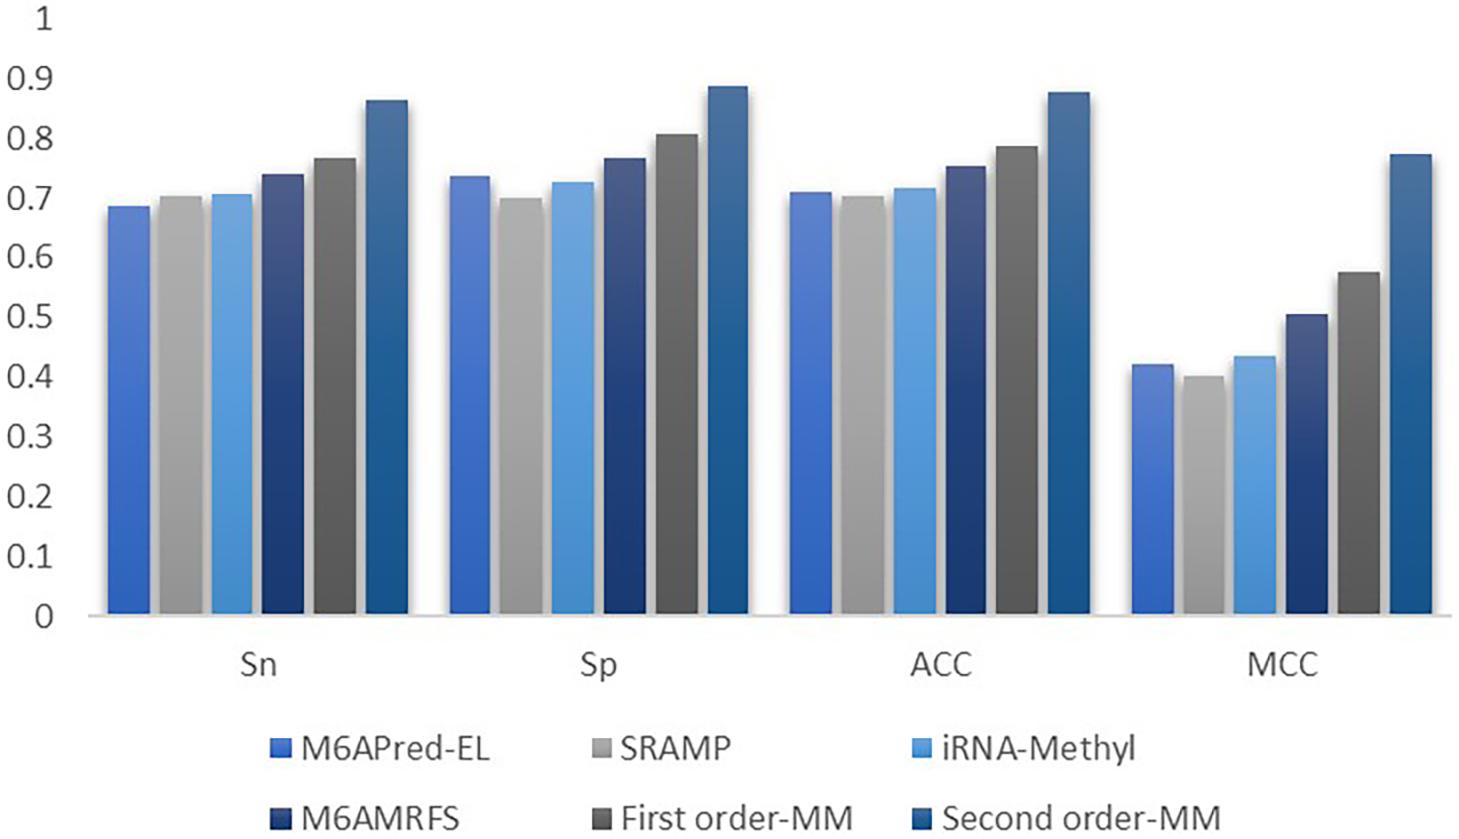
Figure 5. Comparison of the prediction effect of m6A in mice based on the m6Avar database.
Web-Server Implementation
To facilitate the use of the Markov model to identify RNA m6A sites, the user-friendly web server MM-m6APred has been provided. It is freely available at2. Our tool can handle RNA sequences of 41 bp or longer. Users can either paste RNA sequences into the text area or upload a FASTA format file.
Conclusion
Accurate identification of the m6A site is a necessary step in the study of its biological function. In this study, we used first-order and second-order Markov models to predict the m6A sites of three species. The results show that our method is better than the other four existing prediction tools. This shows that the Markov model can capture the correlation between neighboring nucleotides well. Considering the biases of the codons in mRNA, the second-order Markov model is used to capture these biases. The results show that the prediction performance of the second-order Markov model is significantly better than that of the first-order Markov model. In addition, we also provide the online prediction web tool of m6A, with code available to download (see text footnote 2).
Data Availability Statement
Publicly available datasets were analyzed in this study. This data can be found here: http://server.malab.cn/M6AMRFS.
Author Contributions
CP and ZY contributed equally to this work. All authors read and approved the final manuscript.
Conflict of Interest
The authors declare that the research was conducted in the absence of any commercial or financial relationships that could be construed as a potential conflict of interest.
Acknowledgments
We would like to thank Xiao Sun (Southeast University) for his helpful suggestions.
Supplementary Material
The Supplementary Material for this article can be found online at: https://www.frontiersin.org/articles/10.3389/fgene.2021.650803/full#supplementary-material
Footnotes
References
Alarcón, C. R., Lee, H., Goodarzi, H., Halberg, N., and Tavazoie, S. F. (2015). N 6-methyladenosine marks primary microRNAs for processing. Nature 519, 482–485. doi: 10.1038/nature14281
Chen, W., Feng, P., Ding, H., Lin, H., and Chou, K.-C. (2015). iRNA-methyl:identifying N6-methyladenosine sites using pseudo nucleotide composition. Anal. Biochem. 490, 26–33. doi: 10.1016/j.ab.2015.08.021
Chen, W., Tang, H., and Lin, H. (2017). MethyRNA: a web server for identification of N6-methyladenosine sites. J. Biomol. Struct. Dyn. 35, 683–687.
Dominissini, D., Moshitch-Moshkovitz, S., Schwartz, S., Salmon-Divon, M., Ungar, L., Osenberg, S., et al. (2012). Topology of the human and mouse m6ARNA methylomes revealed by m6A-seq. Nature 485, 201–206. doi: 10.1038/nature11112
Geula, S., Moshitch-Moshkovitz, S., Dominissini, D., Mansour, A. A., Kol, N., Salmon-Divon, M., et al. (2015). m6A mRNA methylation facilitates resolutionof naïve pluripotency toward differentiation. Science 347, 1002–1006. doi: 10.1126/science.1261417
Kurland, C. G. (1991). Codon bias and gene expression. FEBS Lett. 285, 165–169. doi: 10.1016/0014-5793(91)80797-7
Liu, B., Liu, F., Wang, X., Chen, J., Fang, L., and Chou, K.-C. (2015). Pse-in-One:a web server for generating various modes of pseudo components of DNA, RNA, and protein sequences. Nucleic Acids Res. 43, W65–W71. doi: 10.1093/nar/gkv458
Meyer, K. D., Saletore, Y., Zumbo, P., Elemento, O., Mason, C. E., and Jaffrey, S. R. (2012). Comprehensive analysis of mRNA methylation reveals enrichment in3’. UTRs Near Stop Codons. Cell 149, 1635–1646. doi: 10.1016/j.cell.2012.05.003
Nazari, I., Tahir, M., Tayara, H., and Chong, K. T. (2019). In6-methyl (5-step): identifying rna n6-methyladenosine sites using deep learning mode via chou’s 5-step rules and chou’s general pseknc. Chemometr. Intell. Lab. Syst. 193:103811. doi: 10.1016/j.chemolab.2019.103811
Pian, C., Zhang, G., Li, F., and Fan, X. (2020). Mm-6mapred: identifying dna n6-methyladenine sites based on markov model. Bioinformatics 36, 388–392. doi: 10.1093/bioinformatics/btz556
Qiang, X., Chen, H., Ye, X., Su, R., and Wei, L. (2018). M6AMRFS: robust prediction of N6-methyladenosine sites with sequence-based features in multiple species. Front. Genet. 9:495. doi: 10.3389/fgene.2018.00495
Quax, T. F. (2015). Codon bias as a means to fine-tune gene expression. Mol. Cell 59, 149–161. doi: 10.1016/j.molcel.2015.05.035
Roost, C., Lynch, S. R., Batista, P. J., Qu, K., Chang, H. Y., and Kool, E. T. (2015). Structure and thermodynamics of n6-methyladenosine in rna: a spring-loaded base modification. J. Am. Chem. Soc. 137, 2107–2115. doi: 10.1021/ja513080v
Wang, X., Lu, Z., Gomez, A., Hon, G. C., Yue, Y., Han, D., et al. (2014). N6-methyladenosine-dependent regulation of messenger RNA stability. Nature 505, 117–120. doi: 10.1038/nature12730
Wei, L., Chen, H., and Su, R. (2018). M6apred-el: a sequence-based predictor for identifying n6-methyladenosine sites using ensemble learning. Mol. Ther. Nucleic Acids 12, 635–644. doi: 10.1016/j.omtn.2018.07.004
Yang, J., Lang, K., Zhang, G., Fan, X., Chen, Y., and Pian, C. (2020). SOMM4mC: a second-order Markov model for DNA N4-methylcytosine site prediction in six species. Bioinformatics 36, 4103–4105.
Zhao, W., Zhou, Y., Cui, Q., and Zhou, Y. (2019). Paces: prediction of n4-acetylcytidine (ac4c) modification sites in mrna. Sci. Rep. 9:11112. doi: 10.1038/s41598-019-47594-7
Keywords: RNA N6-methyladenine sites, second-order Markov model, codons biases, transfer probability matrix, web tool
Citation: Pian C, Yang Z, Yang Y, Zhang L and Chen Y (2021) Identifying RNA N6-Methyladenine Sites in Three Species Based on a Markov Model. Front. Genet. 12:650803. doi: 10.3389/fgene.2021.650803
Received: 08 January 2021; Accepted: 03 March 2021;
Published: 19 March 2021.
Edited by:
Jia Meng, Xi’an Jiaotong-Liverpool University, ChinaReviewed by:
Kil To Chong, Jeonbuk National University, South KoreaJie Jiang, Xi’an Jiaotong-Liverpool University, China
Copyright © 2021 Pian, Yang, Yang, Zhang and Chen. This is an open-access article distributed under the terms of the Creative Commons Attribution License (CC BY). The use, distribution or reproduction in other forums is permitted, provided the original author(s) and the copyright owner(s) are credited and that the original publication in this journal is cited, in accordance with accepted academic practice. No use, distribution or reproduction is permitted which does not comply with these terms.
*Correspondence: Yuanyuan Chen, Y2hlbnl1YW55dWFuQG5qYXUuZWR1LmNu
†These authors have contributed equally to this work