 Yu Fang
 Jie Chen
 Honghua Ruan
 Nan Xu1
 Hongyi Liu
- 1College of Biology and the Environment, Nanjing Forestry University, Nanjing, China
- 2Key Laboratory for Ecology and Pollution Control of Coastal Wetlands (Environmental Protection, Department of Jiangsu), School of Environmental Science and Engineering, Yancheng Institute of Technology, Yancheng, China
The earthworm species Metaphire vulgaris (a member of the Clitellata class) is widely distributed across China, and has important ecological functions and medicinal value. However, investigations into its genetic diversity and differentiation are scarce. Consequently, we evaluated the genetic diversity of five populations of M. vulgaris (GM, HD, NYYZ, QDDY, and QDY) in Yancheng, China via the mitochondrial COI gene and the novel microsatellites developed there. A total of nine haplotypes were obtained by sequencing the mitochondrial COI gene, among which NYYZ and QDDY populations had the greatest number of haplotypes (nh = 5). Further, the nucleotide diversity ranged from 0.00437 to 0.1243. The neighbor-joining trees and the TCS network of haplotypes indicated that earthworm populations within close geographical range were not genetically isolated at these small scale distances. Results of the identification of microsatellite molecular markers revealed that the allele number in 12 microsatellite loci ranged from 4 to 13. The observed heterozygosity ranged from 0.151 to 0.644, whereas the expected heterozygosity ranged from 0.213 to 0.847. The polymorphism data content of most sites was >0.5, which indicated that the designed sites had high polymorphism. Structural analysis results indicated that GM, HD, and NYYZ had similar genetic structures across the five populations. The Nei’s genetic distance between HD and NYYZ populations was the smallest (Ds = 0.0624), whereas that between HD and QDY populations was the largest (Ds = 0.2364). The UPGMA tree showed that HD were initially grouped with NYYZ, followed by GM, and then with QDDY. Furthermore, cross-species amplification tests were conducted for Metaphire guillelmi, which indicated that the presented markers were usable for this species. This study comprised a preliminary study on the genetic diversity of M. vulgaris, which provides basic data for future investigations into this species.
Introduction
Earthworms have key roles in myriad soil processes, including soil turnover, aeration, and drainage, and the breakdown and incorporation of organic matter (Edwards and Bohlen, 1996). Studies have revealed that direct interactions between earthworms and seeds can influence the formation of plant communities (Asshoff et al., 2010). Against the backdrop of escalating terrestrial pollution, earthworms can accelerate the degradation of soil permeating pesticide residues (Liang and Zhou, 2006; Lin et al., 2018). Furthermore, from a medical perspective, earthworms can be employed for the prevention and cure of arteriosclerosis, promotion of blood circulation, and removal of blood stasis, as well as the prevention and treatment of cardiovascular and cerebrovascular diseases. Thus, it is important to elucidate the diversity and population structures of earthworms. Traditional morphological studies begin with phenotypes; however, phenotypes are generally controlled by genes and are significantly influenced by the environment (Gilbert and Nijland, 2008). Therefore, it is difficult to accurately determine the level of genetic variation between species through phenotypic differences.
At present, mitochondrial DNA (mtDNA) and microsatellites are extensively employed for species identification, population genetic diversity, and genetic differentiation (Guichoux et al., 2011; Hodel et al., 2016; Qin et al., 2017). mtDNA is a type of extranuclear genetic material (Herrera et al., 2015). Some authors have analyzed mtDNA to investigate the genetic diversity and population structures of earthworms (Chang and Chen, 2005; Minamiya et al., 2009; Lang et al., 2012; Siqueira et al., 2013). Mitochondrial COI genes are also the most commonly used molecular markers. Molecular genetic studies have demonstrated that the relative paucity in morphological characteristics conceals a high genetic diversity (Shekhovtsov et al., 2014). Microsatellites are simple repeat sequences with 1–6 bases as the repeating unit (Babaei et al., 2017), which have been confirmed to be very suitable markers for the study of population genetics. However, cross-species amplification experiments have revealed that earthworm microsatellite marker possess a high specificity for species (Guichoux et al., 2011). Only a few sets of microsatellite markers of Megascolecidae earthworms have been developed (e.g., Amynthas corticis) (Cunha et al., 2017). Further, studies on the genetic diversity of earthworms via microsatellites have been mostly for the Lumbricidae family (Somer et al., 2011; Dupont et al., 2017).
In response to the growing need for genetic and genomic tools for the study of earthworm biology, we isolated 12 microsatellite markers for Metaphire vulgaris using RAD sequencing technologies. M. vulgaris belongs to the genus Metaphire of the family Megascolecidae, which can be found in many provinces across China, including Jiangsu, Shanghai, Zhejiang, and Guizhou (Xu and Xiao, 2011). To provide theoretical data for the level of genetic diversity of this species, which belonged to different ecosystems in Yancheng City of Jiangsu Province, the genetic diversity and population structures were evaluated using mitochondrial COI gene and the novel microsatellites. These data can contribute to elucidating the genetic diversity and differentiation of the M. vulgaris group of earthworms, as well myriad other species.
Materials and Methods
Sample Collection and DNA Extraction
All earthworm samples were selected from five sites in Yancheng City, Jiangsu Province, China and grouped according to their geographic origin (Figure 1 and Table 1). A total of 112 earthworms were collected as follows: 15 earthworms from Guomeng Town (GM) (120°28’41.4″E, 33°15′23.6″N), 30 from Seawall Road (HD) (120°30’24.8″E, 33°36’2.5″N), 21 from rape and pea fields in Qingdun Town (QDDY) (120°11’11.3″E, 33°29’14.9″N), 21 from a rape field in Qingdun Town (QDY) (120°11’55.5″E, 33°29’18.5″N), and 25 from the Nanyang Experimental Station (NYYZ) (120°12’5.1″E, 33°25′13.1″N). GM and QDDY reside in long-term cultivated lands (GM was sampled on the ridge of the field), whereas HD and NYYZ dwell in agricultural wastelands, and QDY is present in newly cultivated land. The earthworms were anaesthetized in the field with 10% ethanol, and subsequently preserved in 70% ethanol. The M. vulgaris were from 130 to 150 mm in length and 5–7 mm wide. The body surface has no setae, and the color of the middle line on the back is dark cyan. The mating cavity is deep and wide, and the inner wall is wrinkled, often with three flat-topped mastoid processes. The anterior and posterior margin of the seminal vesicle is swollen, and the size of the mastoid process can be seen outside the lumen (Xu and Xiao, 2011). Once the earthworms were identified with similar M. vulgaris, samples from each individual were sectioned and preserved in 95% ethanol for genomic DNA extraction using a genomic DNA extraction kit (Vazyme Biotech, Beijing, China) in the laboratory. The extracted DNA was stored at −20°C for an extended duration.
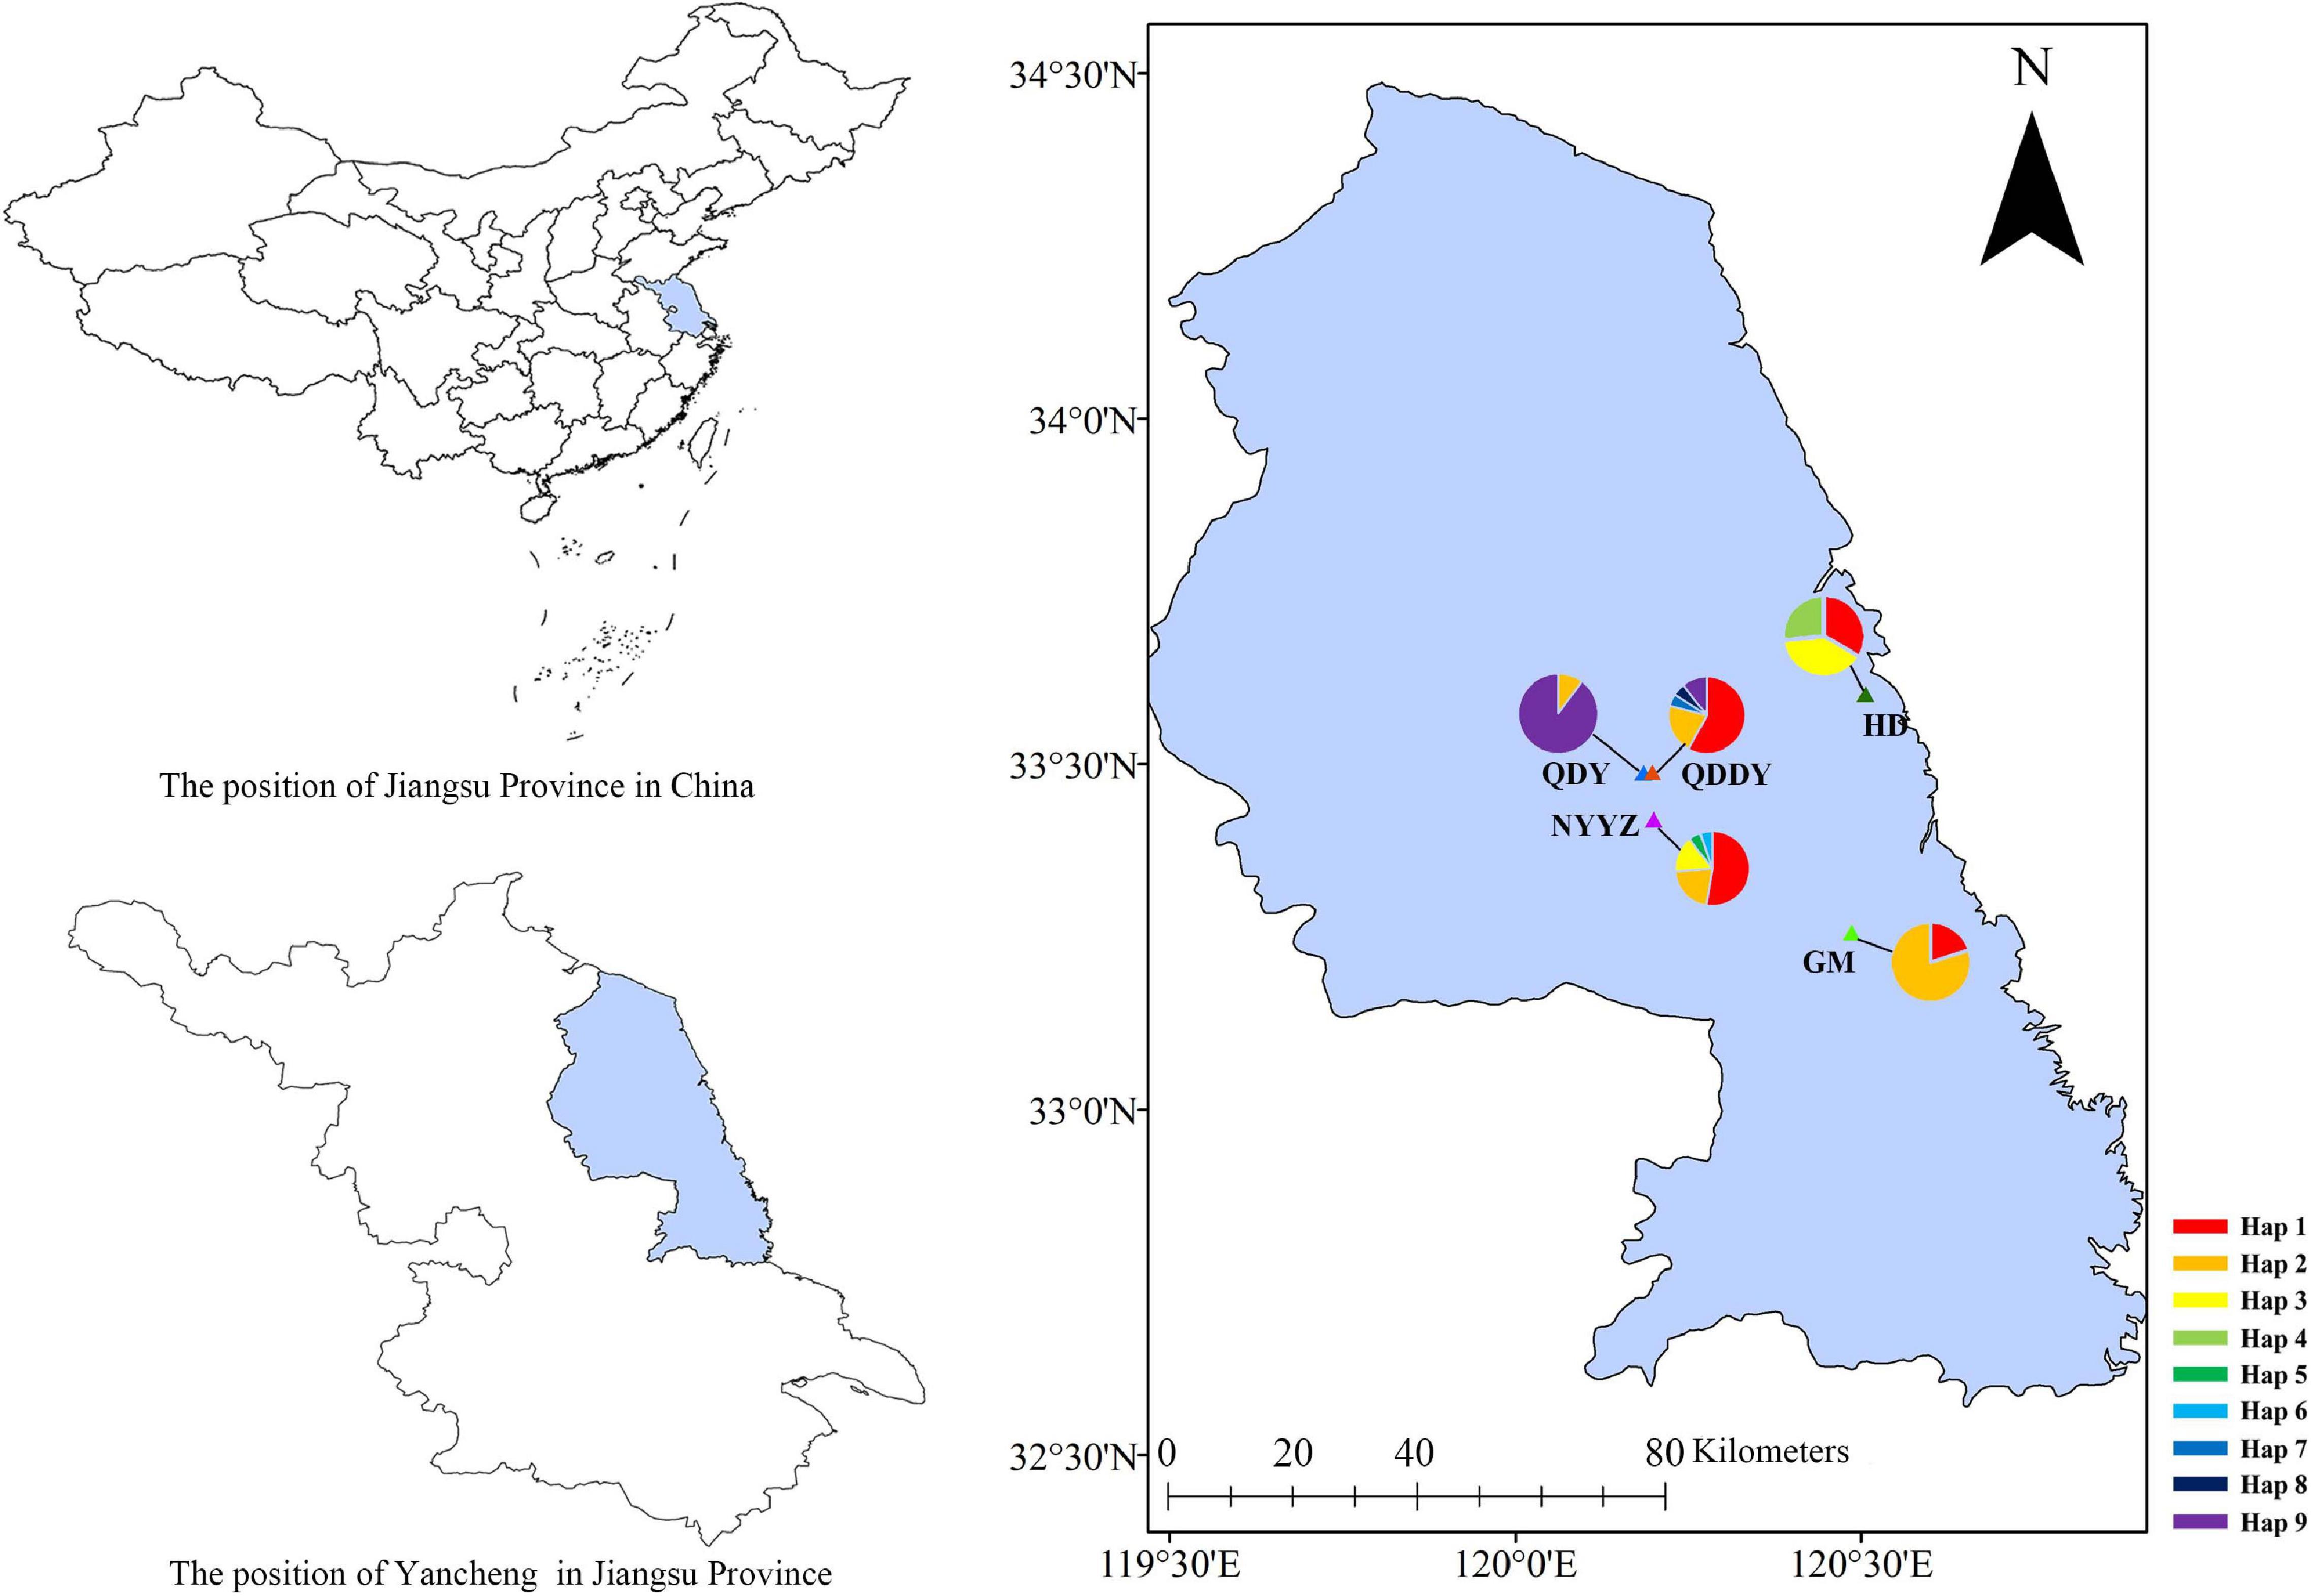
Figure 1. Distribution of sampling locations and haplotypes.
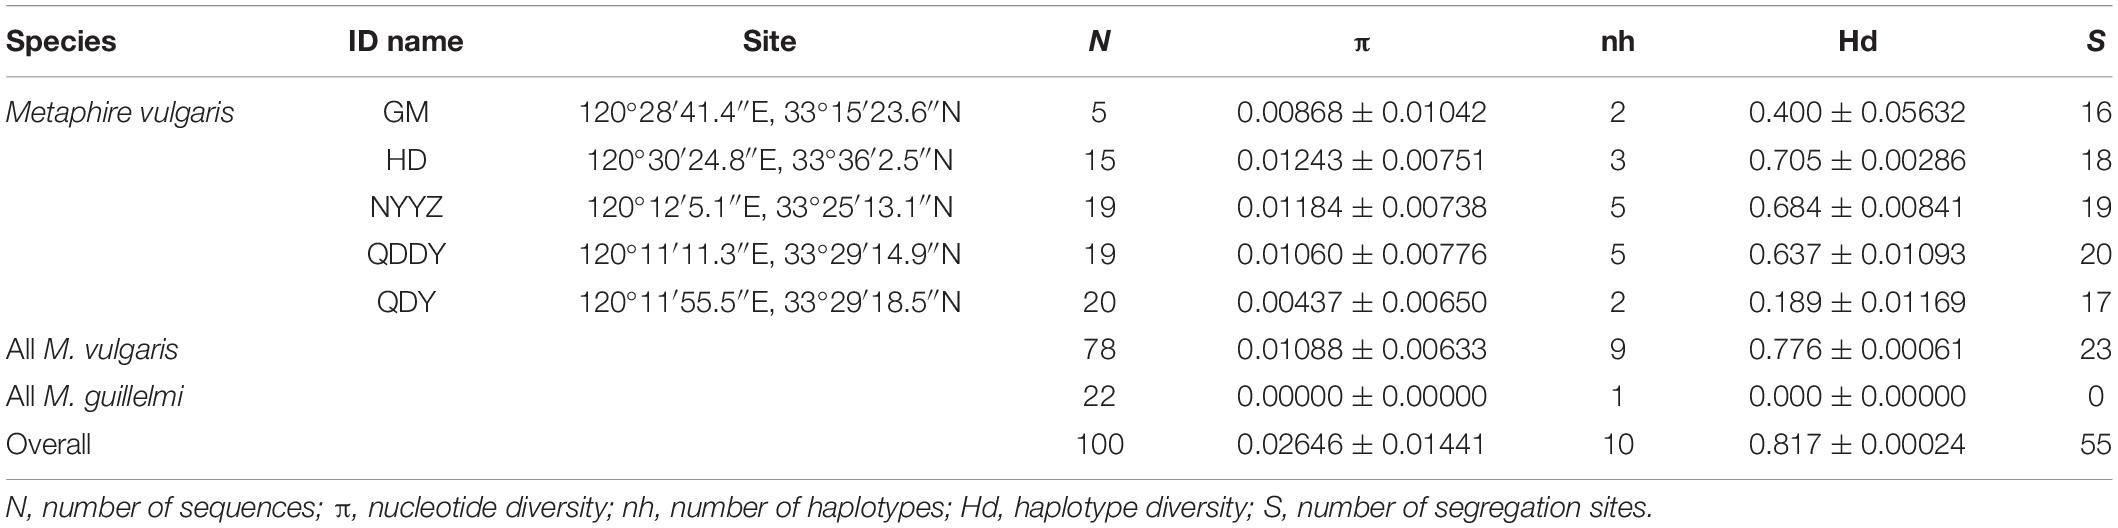
Table 1. Geographic locations of sampling sites and haplotypes.
COI Gene Amplification and Molecular Identification of Species
The primers used for gene amplification were designed with reference to the entire mtDNA sequences of M. vulgaris (KJ137279.1), Metaphire guillelmi (KT429017.1), and Metaphire californica (KP688581.1) from NCBI (QY-COI-F:5′-TTTGGGCACCCAGAAGTATA-3′; QY-COI-R:5′-GTAATAATACCTGTTTCYCT-3′). Amplifications were performed in 25 μl reaction volumes containing 12.5 μl of 2 × Taq Master Mix (Dye Plus), 1 μl of genomic DNA, 0.5 μl of each primer, and 10.5 μl of deionized water. The PCR procedure was as follows: an initial denaturation step at 95°C for 5 min, followed by 32 cycles of denaturation at 95°C for 30 s, annealing at 55°C for 30 s, and extension at 72°C for 30 s, with a final extension at 72°C for 5 min. After being detected by agarose gel electrophoresis, the PCR products were sent to the TSINGKE Biotech Company (Nanjing, China) for sequencing. Species identification was performed via DNA barcoding by sequencing a fragment of the COI gene. Ultimately, we obtained 78 M. vulgaris and 22 M. guillelmi earthworms.
Microsatellite Identification and Amplification
The genomic DNA of a M. vulgaris specimen was used for RAD-seq, where RAD library construction and Illumina sequencing were conducted by Novogene Bioinformatics Technology Co. Ltd. (Beijing, China) following the standard protocol. Approximately 1.287 G bases of raw reads were obtained from the RAD library, with average Q30 and GC contents of 92.41 and 43.51%, respectively. Subsequent to the filtering and assembly of the raw reads, we obtained 33,069 contigs, with average contig lengths of 346 bp. A total of 1975 microsatellites were obtained that were suitable for the design of primers. The primers were designed using the primer 3.0 subprogram of the SR search software (Novogene, Beijing, China). A total of 20 pairs of primers were randomly designed and employed to amplify the DNA templates of 3 M. vulgaris individuals, of which 12 pairs of primers produced clean products. These primers were labeled with fluorescent dye 5′ 6-FAM, 5′ HEX, or 5′ TAMRA for randomly testing the amplification in 24 M. vulgaris individuals. Finally, 12 microsatellite loci with high polymorphisms and 12 corresponding primers were successfully screened (Table 2).
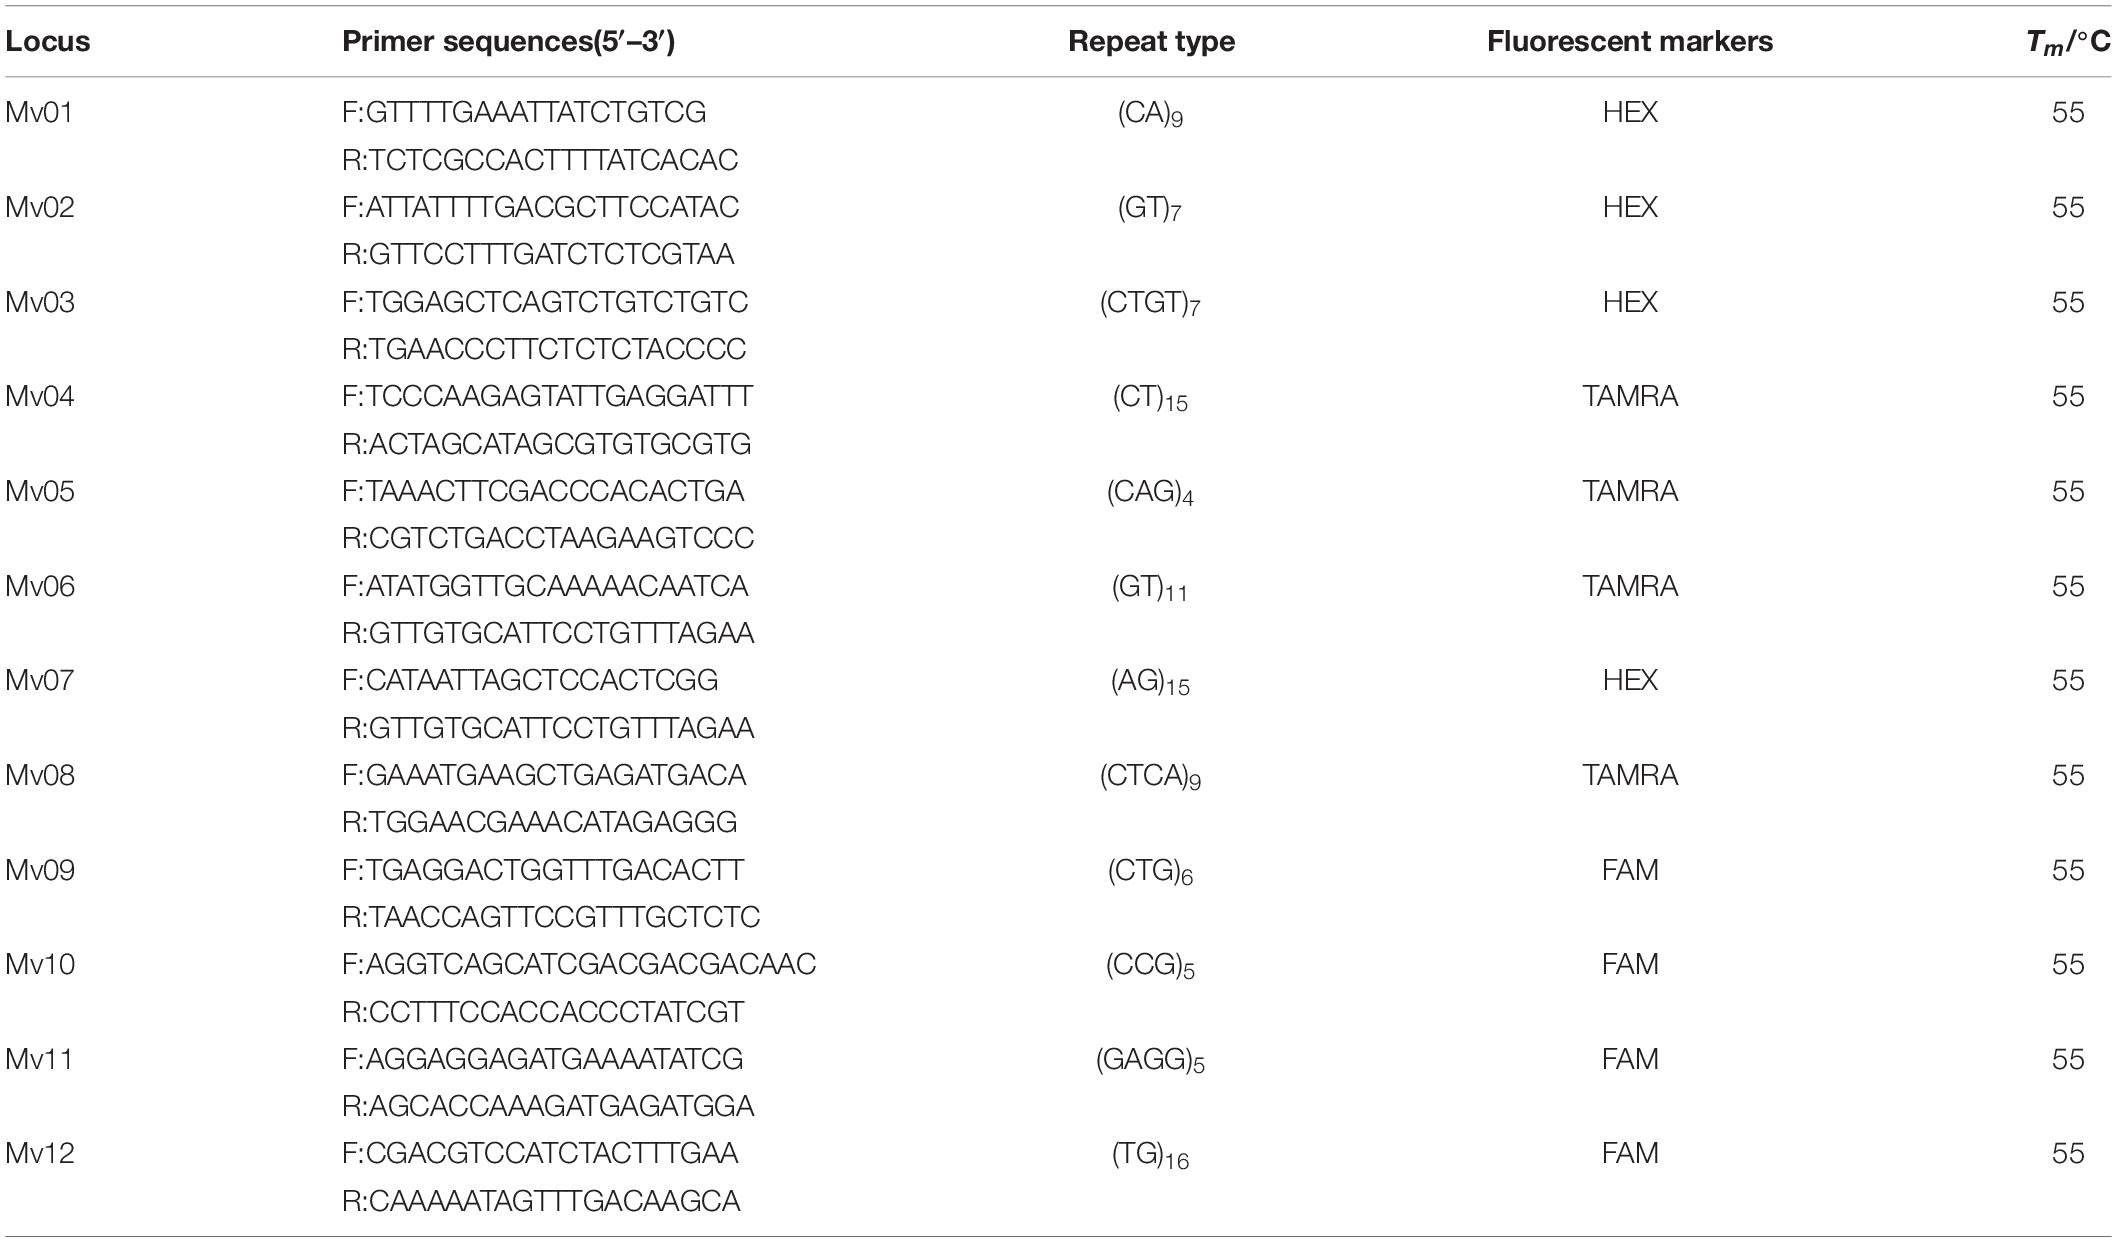
Table 2. Characteristics of the 12 microsatellite primers.
Except for different primers, the reaction system and reaction conditions were as above. The PCR products were also checked using a 1% agarose gel electrophoresis method. To validate the developed microsatellites in other Metaphire species, M. guillelmi (n = 22) were sampled for cross-amplification analysis. All PCR products were sent to the SINGKE Biotech Company (Nanjing, China) for genotyping using an ANI 3730 Genetic Analyzer (Applied Biosystem).
Statistical Analyses
mtDNA Sequence Data
The sequences of each gene region were edited and aligned in SeqMan (Swindell and Plasterer, 1997) Pro v9 (DNAstar Inc., Madison, WI, United States). Molecular genetic diversity indices for each population were calculated in DnaSP v5.0 (Librado and Rozas, 2009). The diversity indices included nucleotide diversity (π), number of haplotypes (nh), haplotype diversity (Hd), and number of segregation sites (S). A neighbor joining (NJ) tree was constructed by MEGA v7.0 (Sudhir et al., 2016) according to the haplotype of the population, and with M. guillelmi as an outgroup. The confidence levels at nodes after 1000 repetitions employed the Bootstrap method (Adeniran et al., 2021). The phylogenetic relationships between mtDNA haplotypes of M. vulgaris were estimated from a TCS network using PopART v1.7 (Leigh and Bryant, 2015).
Microsatellite Data
Cervus version 3.0 software (Kalinowski et al., 2007) was used to determine the following parameters: The number of alleles (NA), observed heterozygosity (HO), expected heterozygosity (HE), polymorphism information content (PIC) values, and Hardy–Weinberg equilibrium test for each locus. Arlequin 3.0 software (Excoffier et al., 2007) was employed to estimate the fixation indices (FIS, FST, and FIT) per locus. Through an AMOVA analysis using Arlequin 3.0 software, the distribution patterns of genetic diversity were compared. Popgene 3.2 software was employed to calculate the genetic distance (DS), and construct a phylogenetic tree via UPGMA. An analysis of the population genetic structure was performed with Structure 2.3.4 software (Pritchard et al., 2000), where the Set population K 2--5, Each K value repeats 10 times, Length of Burnin Period and McMc Reps were 100,000 and 100,000. The results were uploaded to the Structure Harvester1 (Rosenberg et al., 2001) to obtain the best K value.
Results
Population Genetic Diversity and Differentiation of Mitochondrial COI Gene
Genetic Diversity of Mitochondrial COI Gene
A total of 100 COI sequences (737 bp) were obtained, of which 78 were M. vulgaris and 22 were M. guillelmi, following amplification and species identification (GenBank accessions: MW861684–MW861693). The average frequencies of T, C, A, and G were 32.6, 22.3, 27.9, and 17.2%, respectively. The A + T contents (60.5%) were higher than the C + G contents (39.5%). The nucleotide diversity (π), nh, and Hd are presented in Table 1. The NYYZ and QDDY had the most haplotypes (nh = 5). The highest Hd was the HD population (Hd = 0.705), whereas the lowest was the QDY population (Hd = 0.189). The genetic diversity of the GM and QDY populations was significantly lower than that of the other three populations (HD, NYYZ, and QDDY). There were 10 haplotypes in total, among which only one was a M. guillelmi haplotype. There were nine haplotypes within the five populations of M. vulgaris, among two haplotypes (Hap 1 and Hap 2) were found in four populations, two haplotypes (Hap 3 and Hap 9) were found in two populations, and the remaining five haplotypes were designated as “private haplotypes” (Table 3).
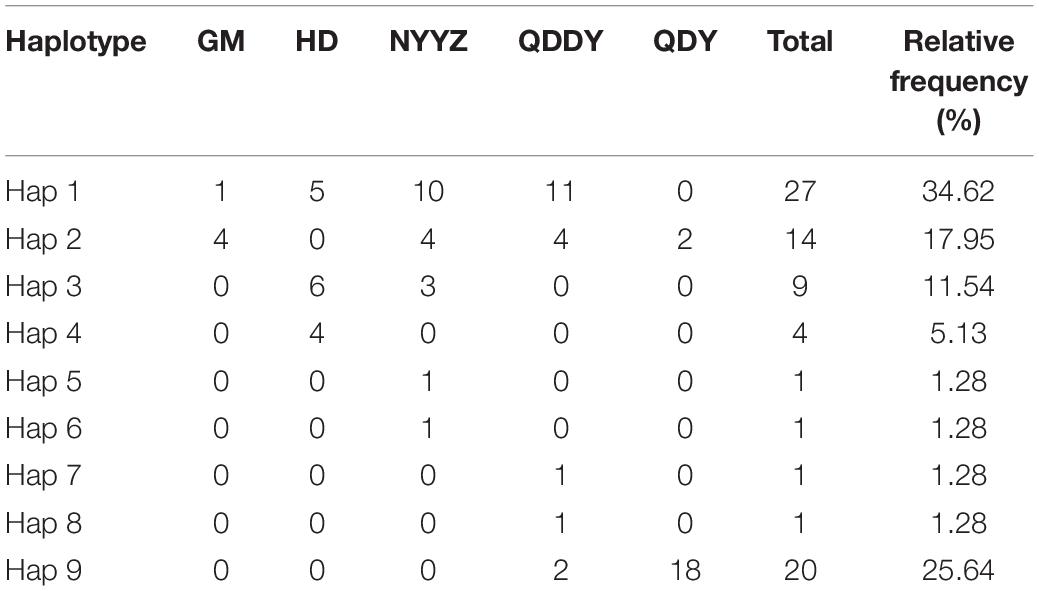
Table 3. Haplotypes of COI sequences identified in M. vulgaris populations.
Population Genetic Structure of Mitochondrial Gene Markers
As was visible from the constructed NJ tree (Figure 2A), the M. guillelmi outgroup was obviously different from the M. vulgaris group as one branch, and five populations of M. vulgaris were divided into two large branches. A total of nine haplotypes were distributed between the two branches, which was similar to the aggregation of the overall TCS network (Figure 2B) haplotype distribution. For most haplotypes, two (Hap 1 and Hap 2) were used as the central radiation distribution. Other haplotypes were formed by one or two mutations of these two haplotypes. Among them, Hap 1 was likely the most primitive haplotype, which evolved into others. The NJ tree and the network between haplotypes revealed that there was no significant lineage differentiation between the five M. vulgaris populations.
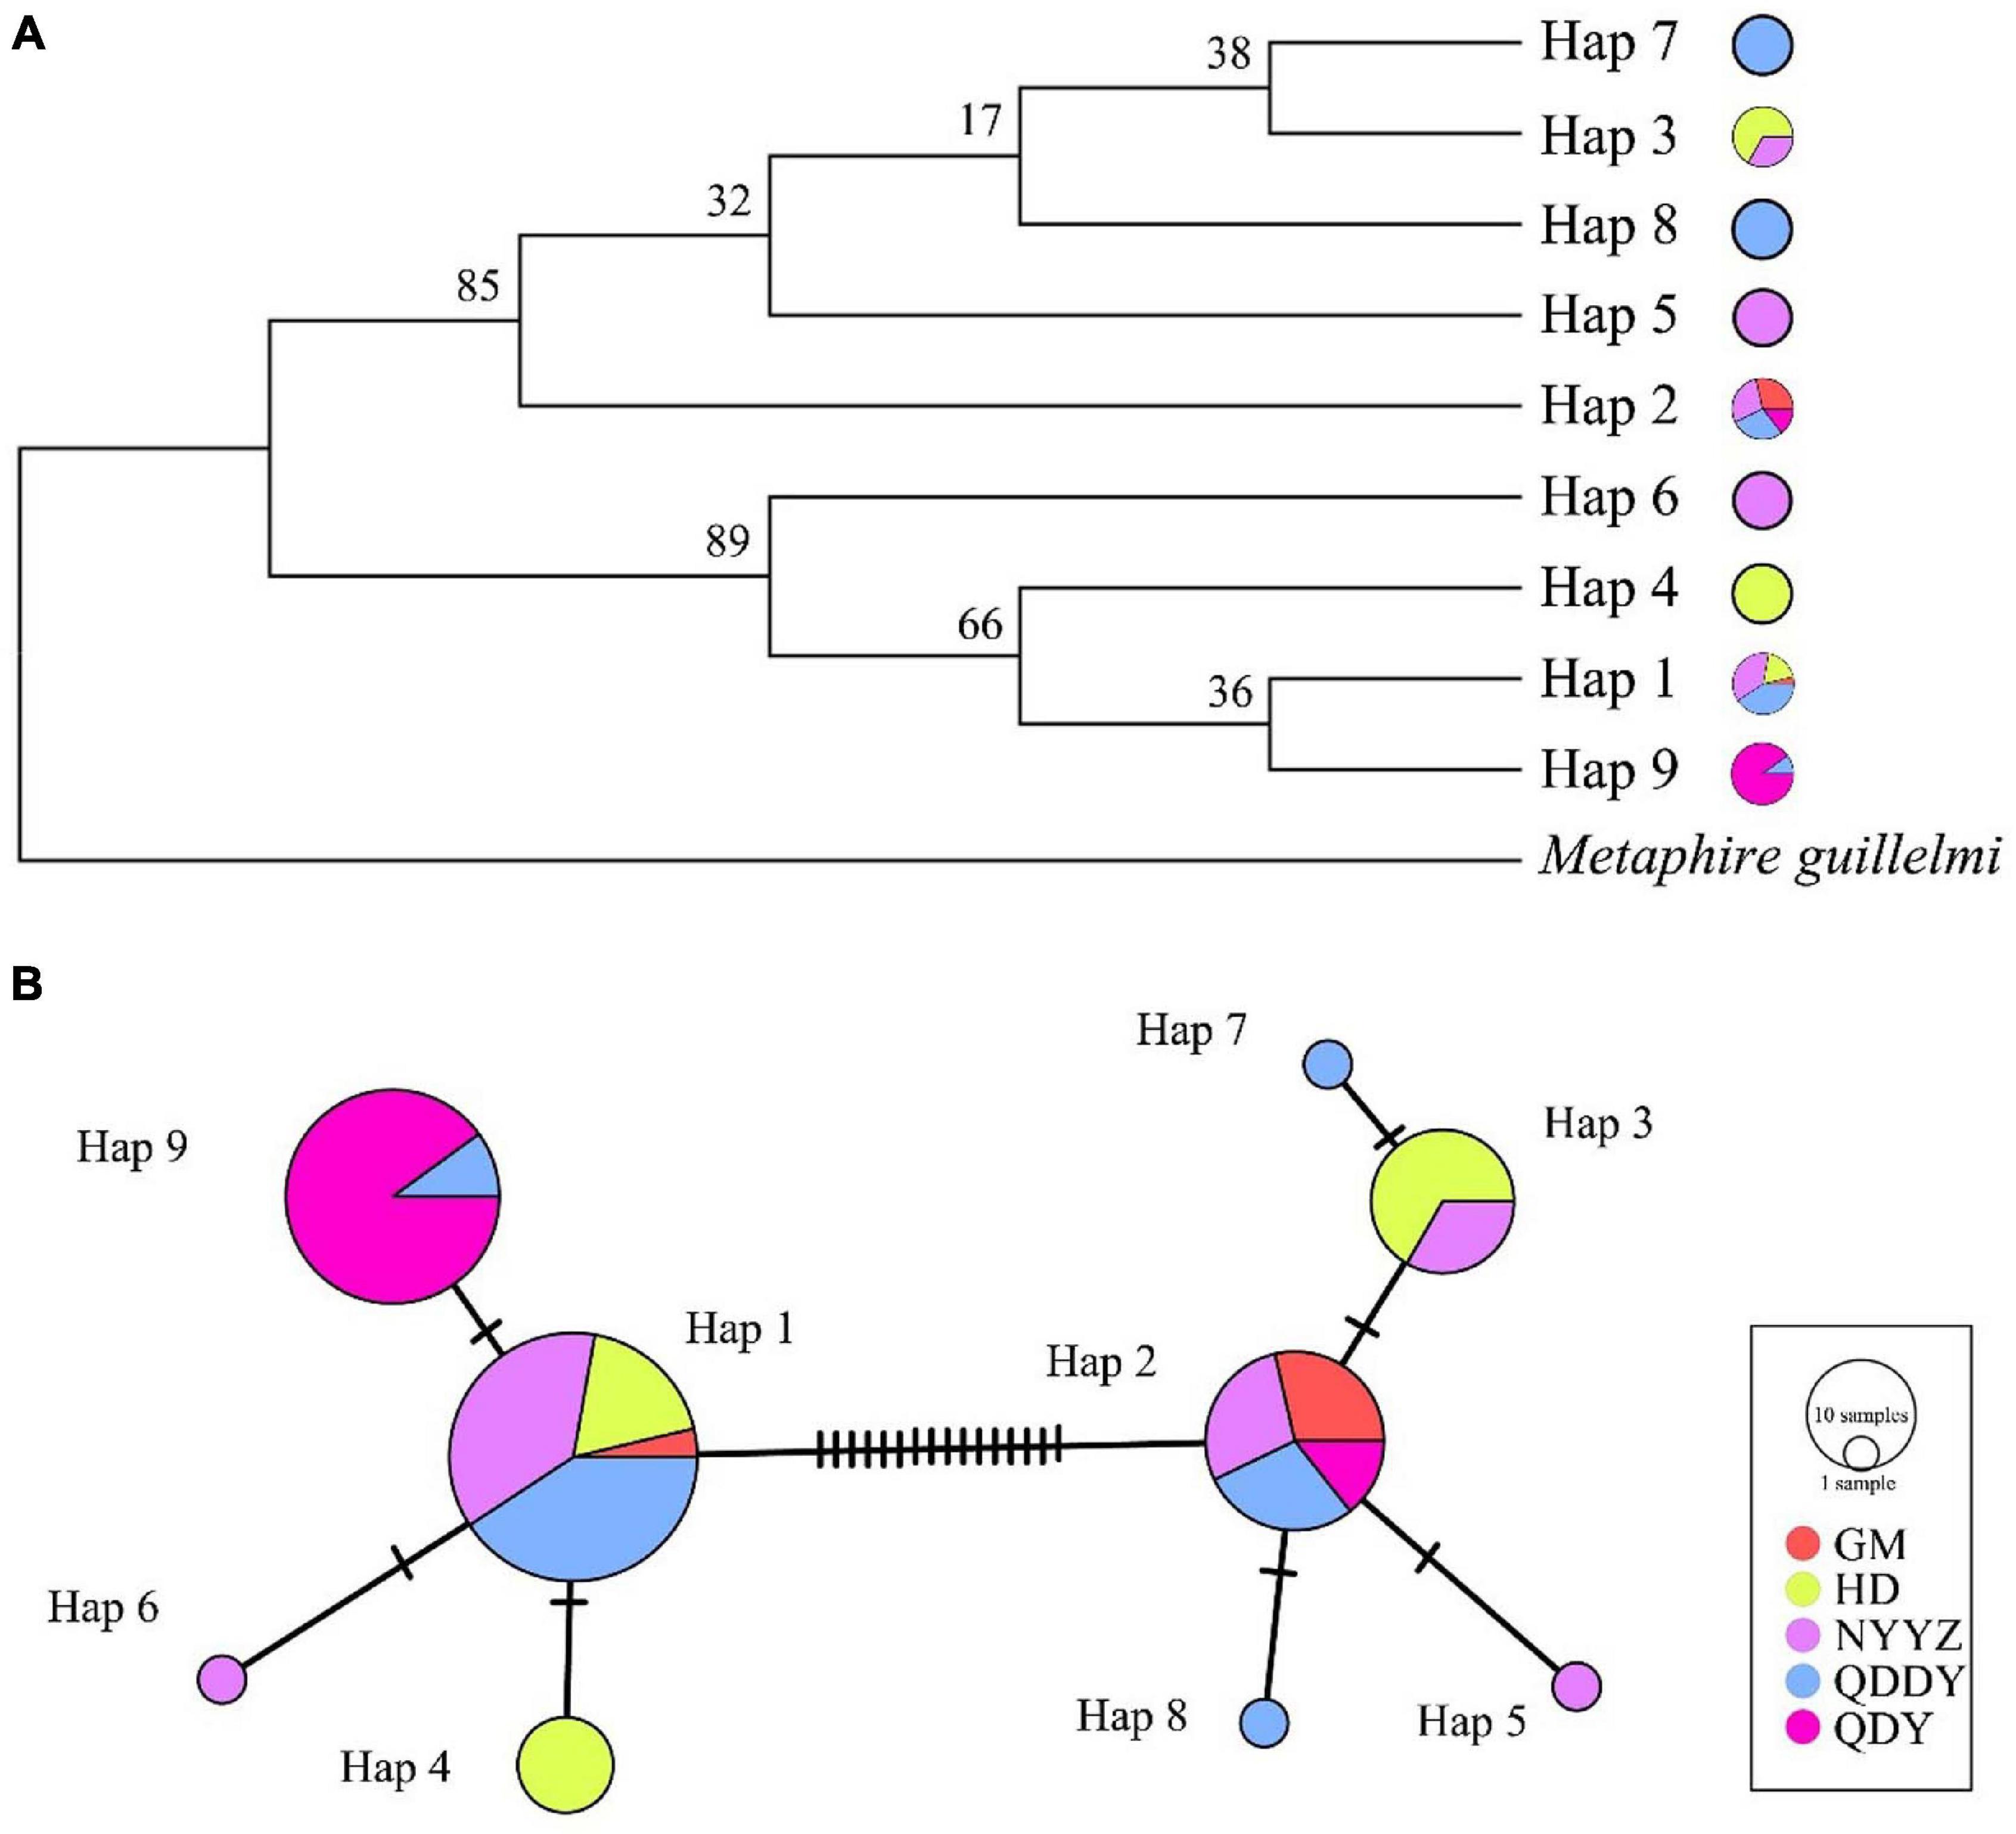
Figure 2. Neighbor-Joining Tree (A) and TCS network (B) based on COI gene. Circle sizes indicate the probability of haplotypes. Different colored in the circles indicate the distribution in different populations, and the oblique lines indicate mutations between haplotypes.
Population Genetic Diversity and Structure Based on Microsatellites
Genetic Diversity of Microsatellite Loci
An innovative design of the 12 microsatellite loci and their corresponding 12 pairs of primers (GenBank accessions: MW858330–MW858341), a genetic diversity assessment of 73 individuals in 5 populations of M. vulgaris, and cross-species amplification of polymorphic microsatellite markers from M. guillelmi, showed that most microsatellite loci could be successfully amplified (Table 4). The allele number of all the loci in the 5 different populations of M. vulgaris ranged from 4 to 13 with an average number of 8. The HO and HE ranged from 0.151 to 0.644 (mean value, 0.430), and from 0.213 to 0.847 (mean value, 0.619), respectively. The average PIC was 0.571, while the highest was 0.823 for the Mv07 locus, and the lowest was 0.200 for the Mv08 locus.
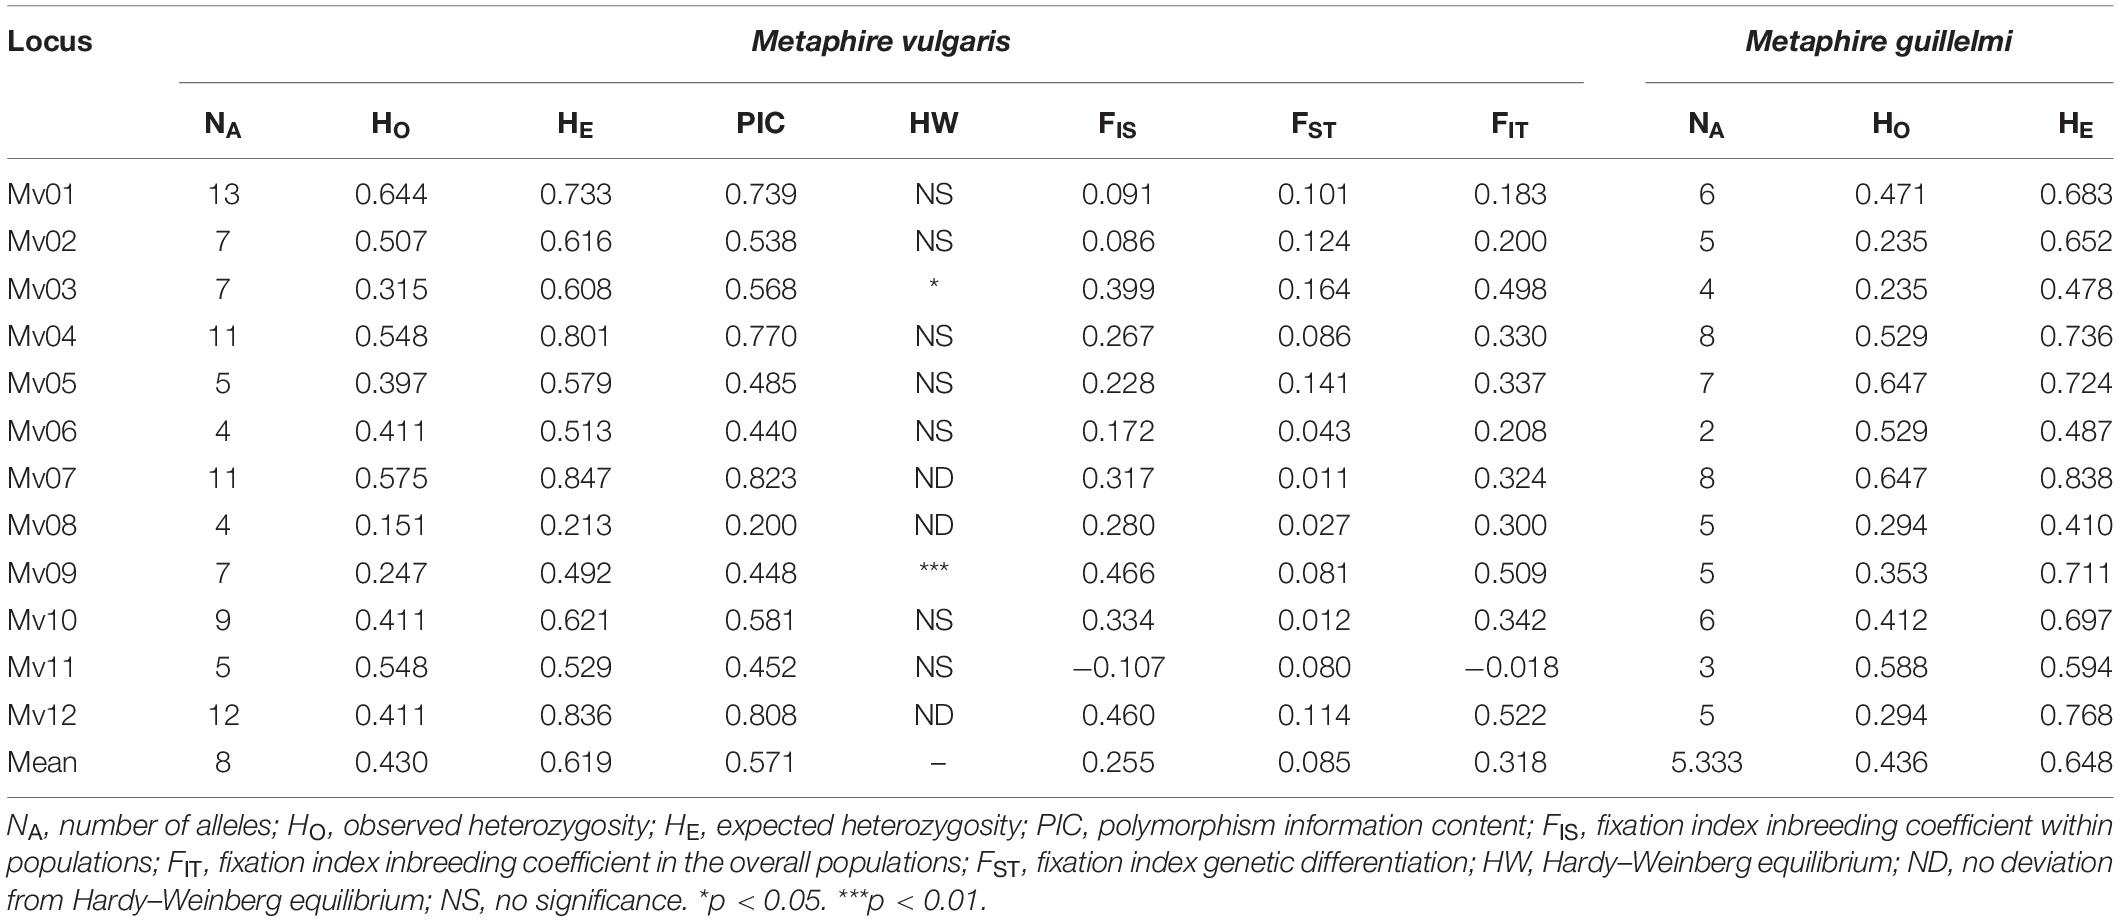
Table 4. Polymorphism of the 12 microsatellite loci for Metaphire.
Population Genetic Diversity and Structure
The NA between the five populations of M. vulgaris ranged from 3.250 (GM) to 5.250 (QDDY), where the average allele number was 4.42 (Table 5). The ranged from 0.403 (HD) to 0.458 (QDDY). The HE ranged from between 0.504 (QDY) and 0.633 (HD). The average of the observed and expected heterozygosity was 0.426 and 0.581, respectively. The PIC was from between 0.446 and 0.546, as the lowest in the QDY population, and the highest in the HD population, with an average of 0.504. The best K (K = 3) values were obtained from the Structure Harvester (see text footnote 1). The genetic structure of the population was analyzed using Structure 2.3.4 software, setting K = 3, that is, the five populations could be divided into three genetic groups (red, blue, and green) (Figure 3A.) All five populations had three simultaneous genetic groups, among which three in the QDDY population were uniformly distributed. The GM, HD, and three NYYZ populations consisted primarily of red and blue-derived genetic populations, whereas QDY were more of the green-derived genetic populations.
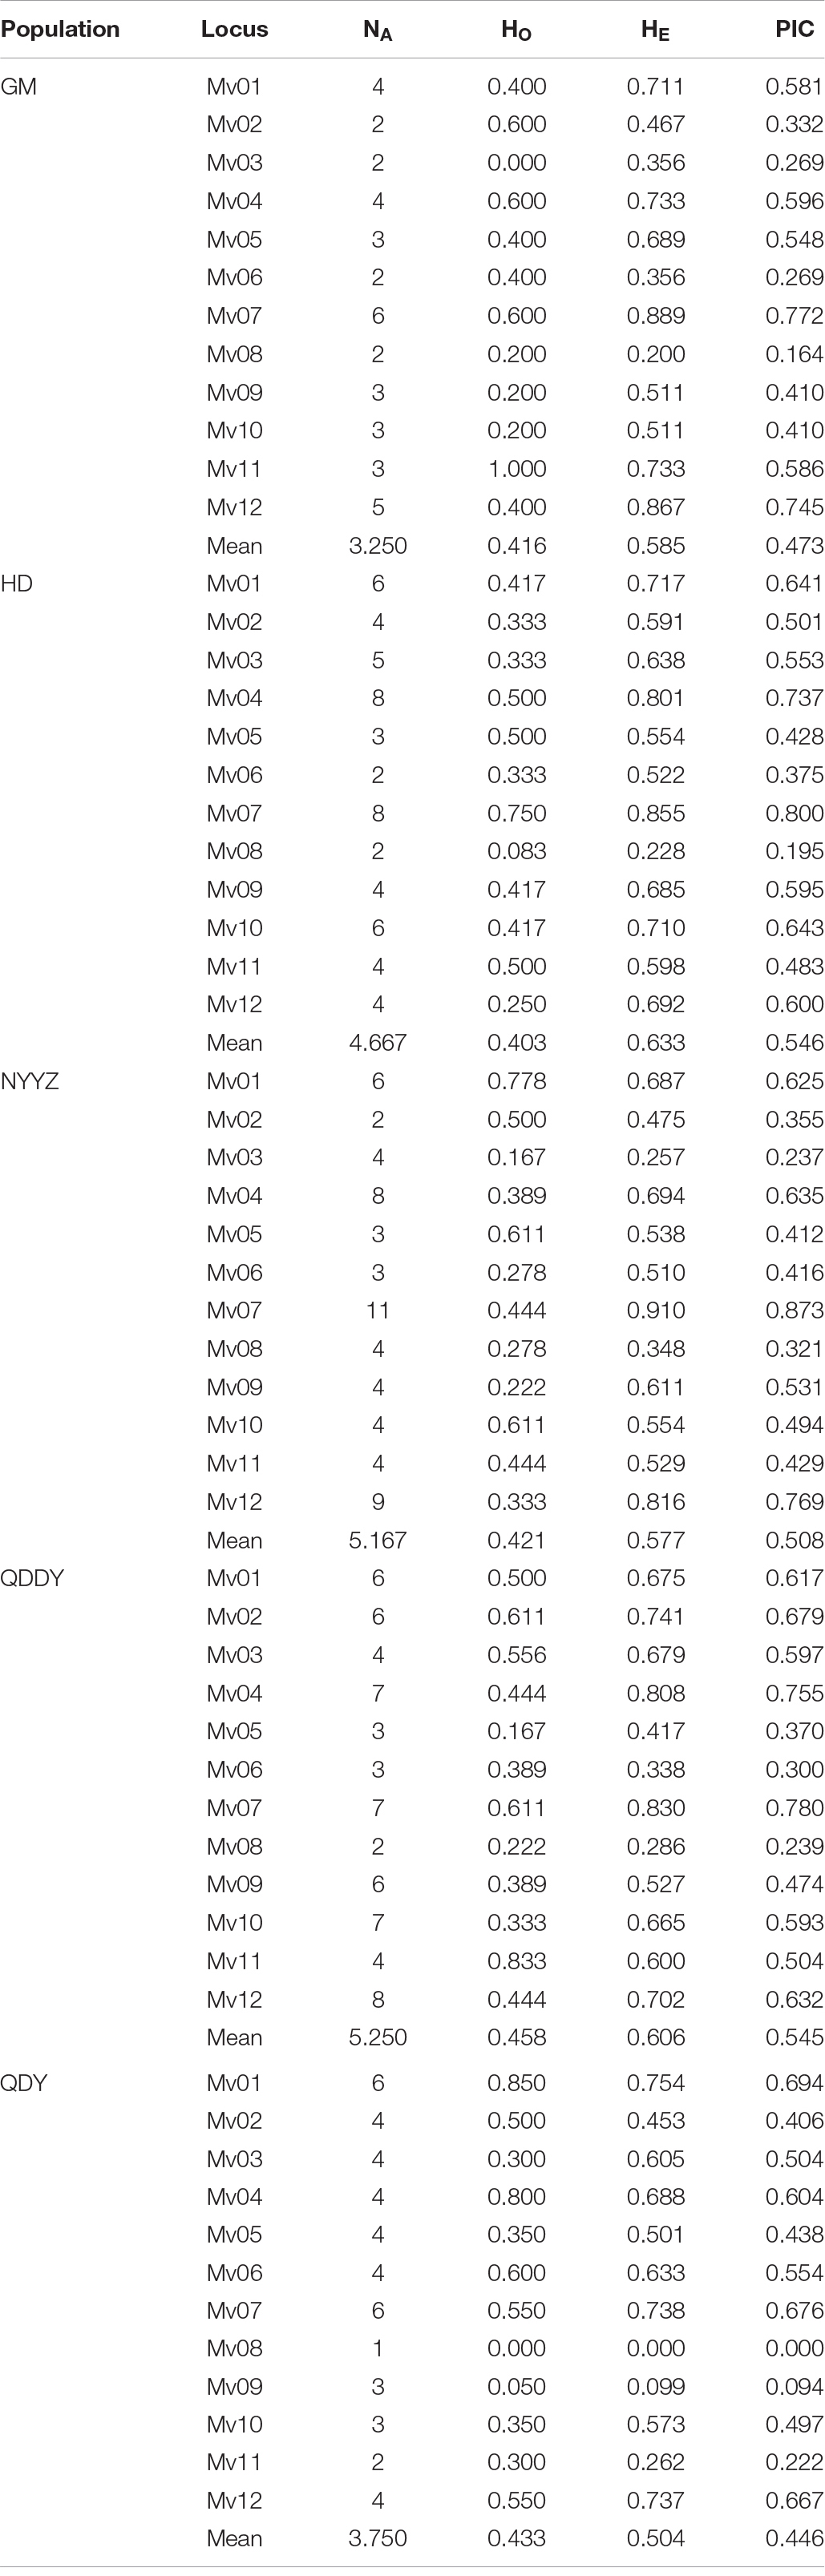
Table 5. Genetic information for the 12 microsatellite loci observed in M. vulgaris.
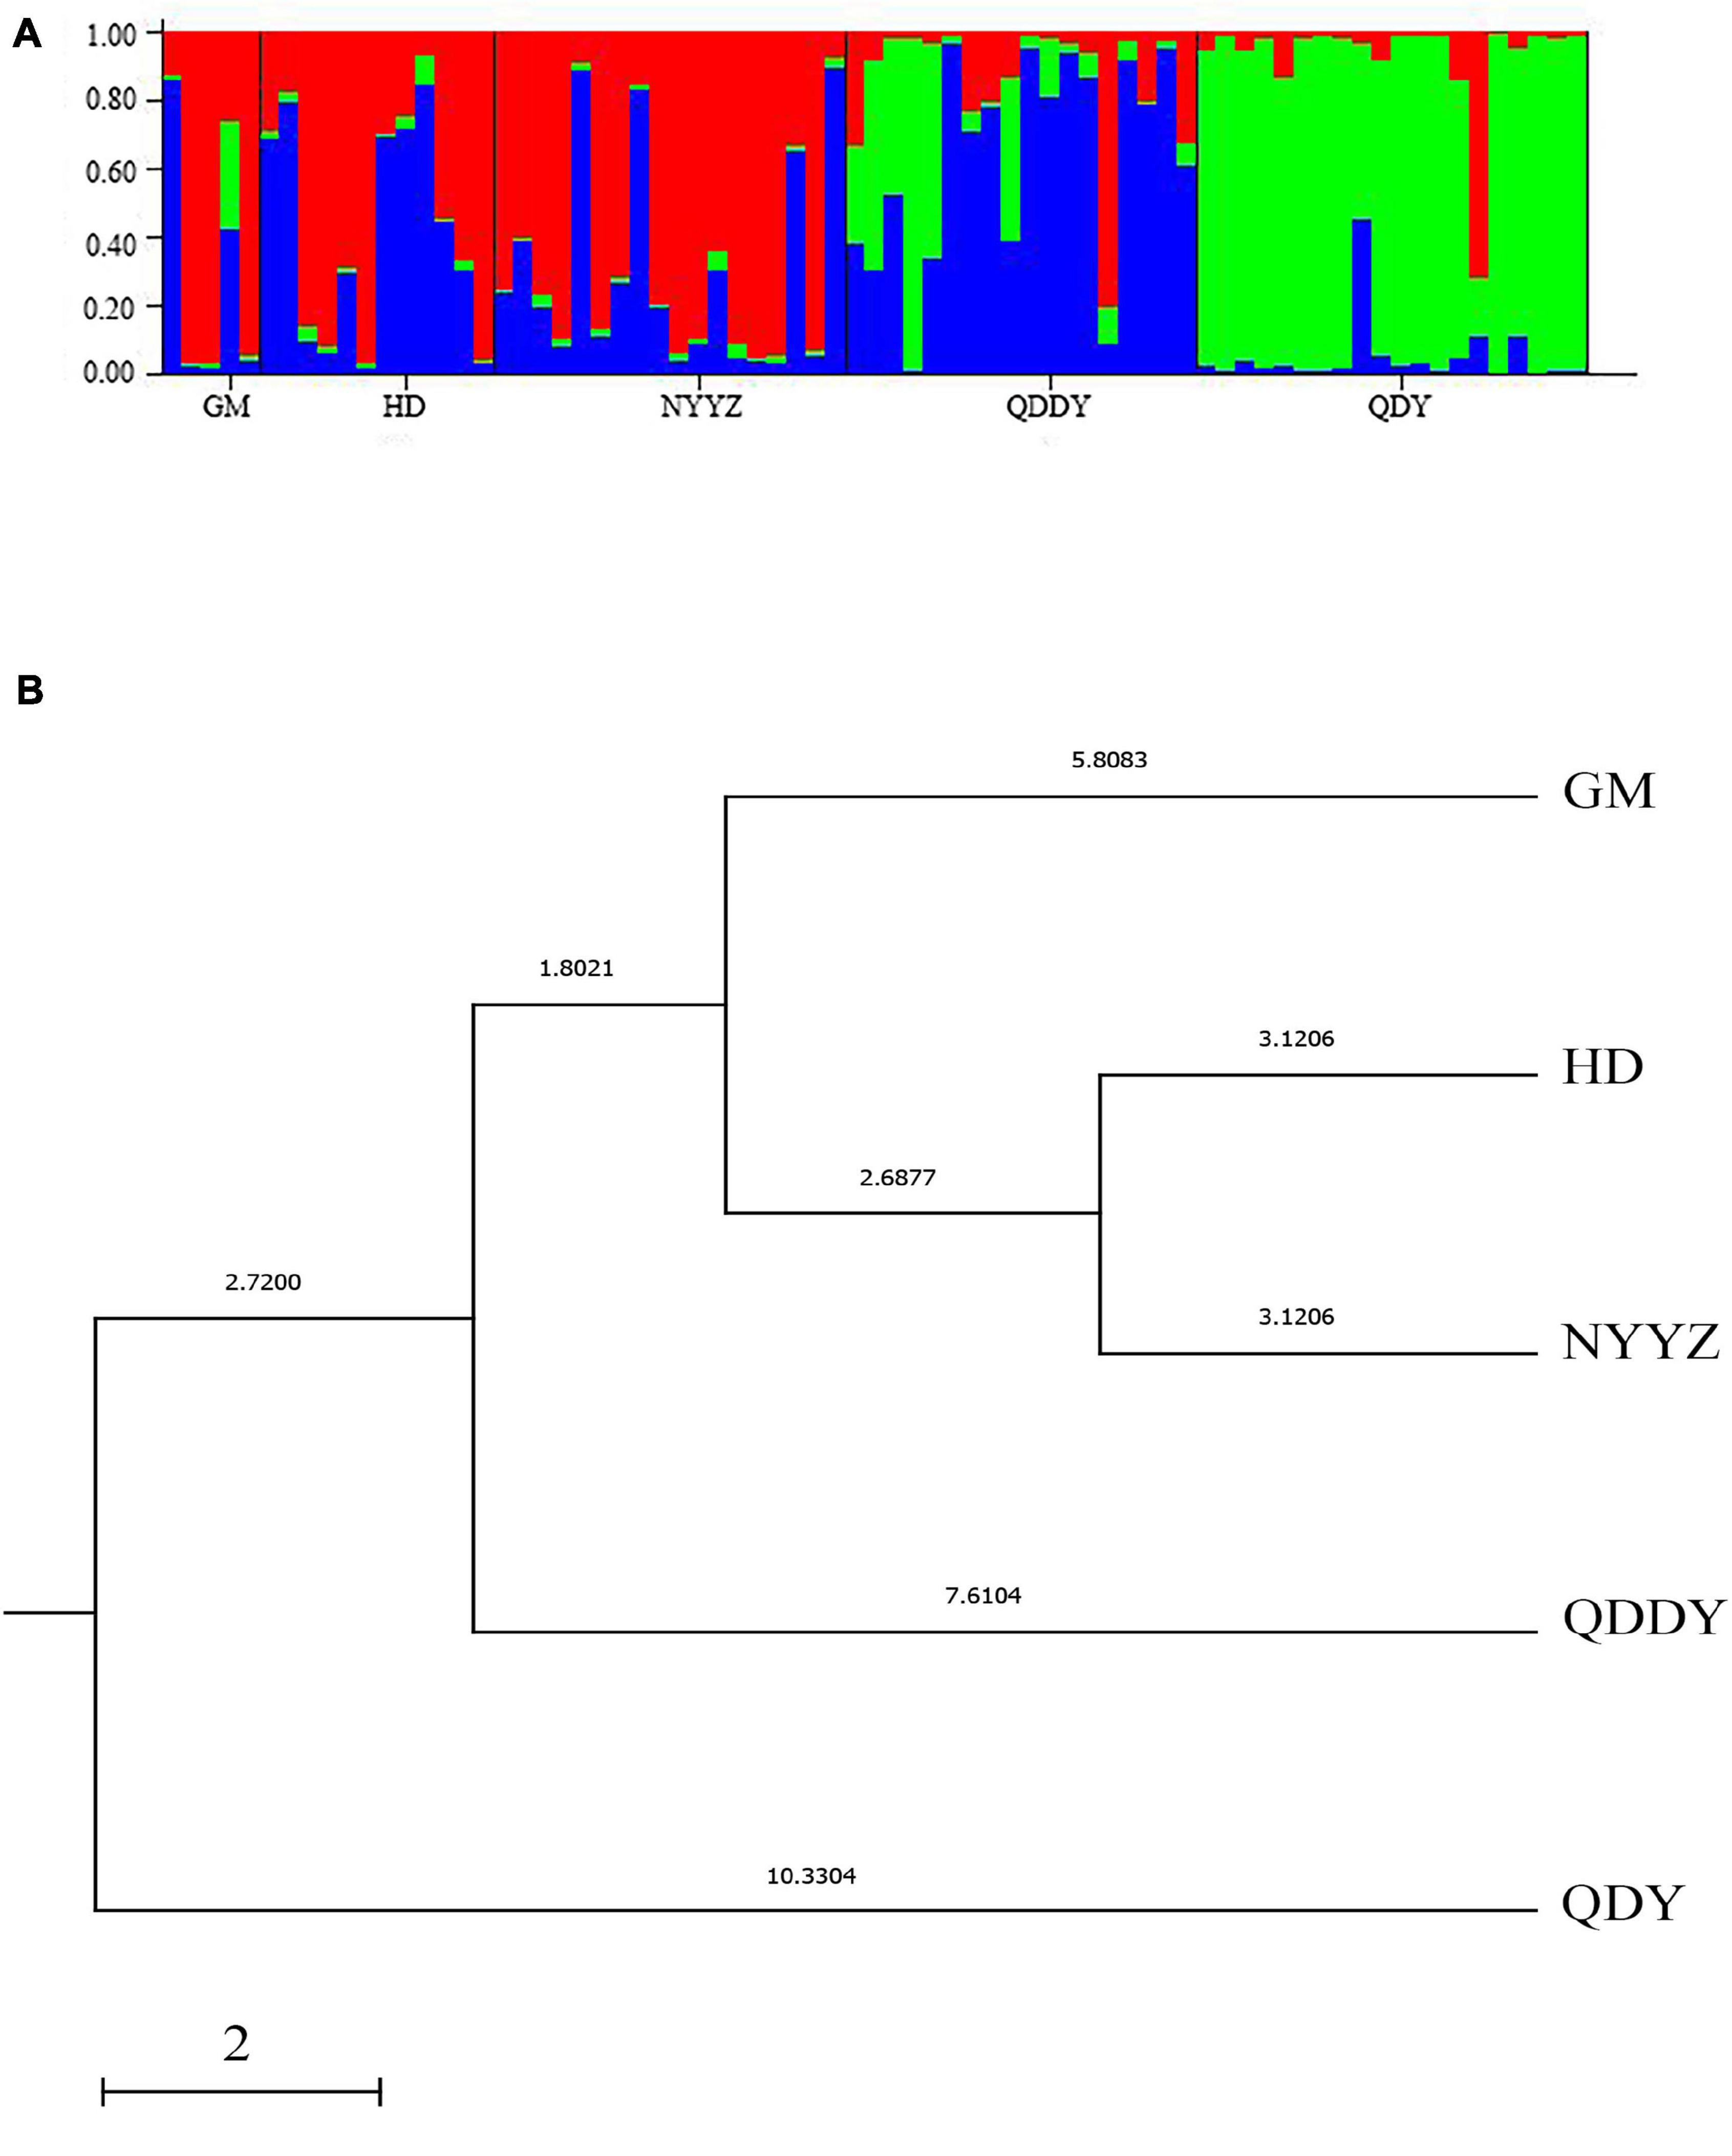
Figure 3. STRUCTURE cluster analysis of the five populations. These populations were grouped in three ancestral clusters (A). The UPGMA tree from 12 microsatellite loci of 5 M. vulgaris populations (B).
Genetic Differentiation of Five Populations
F-statistics (Table 4) were estimated in a fixation index as a coefficient within populations (FIS), genetic differentiation (FST), and inbreeding coefficient in the overall populations (FIT). The FIS ranged from −0.107 (Mv11) to 0.466 (Mv09), with an average value of 0.255. The FST ranged from 0.011 (Mv07) to 0.164 (Mv03), with an average value of 0.085. The FIT ranged from −0.018 (Mv11) to 0.522 (Mv12), with an average of 0.318. From these three indices, it was observed that there was a certain inbreeding phenomenon; however, the genetic differentiation coefficient was small, which indicated that the degree of genetic differentiation of the population was not high.
According to the allele frequencies of the 5 populations at 12 microsatellite loci, the genetic identity and genetic distance (Ds) of Nei was calculated by Popgene v3.2 software. The results indicated that the genetic distance between the HD and NYYZ populations was the smallest (Ds = 0.0624) and the genetic distance between the HD and QDY populations was the largest (Ds = 0.2364) (Table 6). The genetic distances between the GM and HD and NYYZ were also small at 0.1137 and 0.1186, respectively. While the genetic distances between QDY and the other four populations were all larger than 0.16. AMOVA analysis (Table 7) revealed that the total variability observed between different populations was 9.35%, whereas 90.65% of variation was found within populations. The genetic variation of M. vulgaris primarily occurred within the population. The UPGMA tree based on codominant genotypic distances matrix of the 12 microsatellite markers from 5 populations showed that HD were initially grouped with NYYZ, followed by GM, and then with QDDY (Figure 3B).
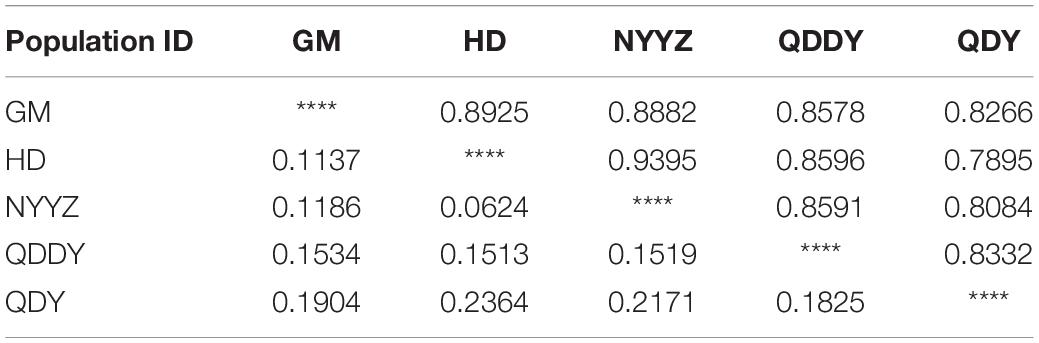
Table 6. Nei’s genetic identity (above diagonal) and genetic distance (below diagonal) of the five populations of M. vulgaris based on microsatellites.
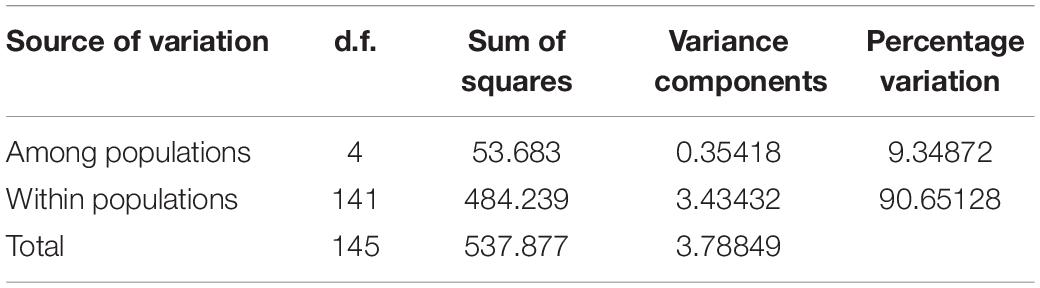
Table 7. Analysis of molecular variance for the five populations of M. vulgaris based on microsatellites.
Discussion
Amplification of Microsatellite Primers
Microsatellites are markers of neutrality, co-dominance, and high polymorphism. They have been shown to be highly suitable markers for population genetics (Guichoux et al., 2011). However, cross-species amplification tests revealed that the microsatellite markers of earthworms were highly species-specific (Lumbricus rubellus, 2006; Aporrectodea longa (Ude), 2012; Lumbricus terrestris, 2016) (Harper et al., 2006; Strunk et al., 2012; Souleman et al., 2016). At present, there are few studies on the genetic diversity of earthworms using microsatellite molecular markers. For this study, we designed 12 pairs of microsatellite primers for M. vulgaris. The PIC values greater than 0.5 for most of the 12 microsatellite loci indicated that these microsatellite markers were highly polymorphic (Yuan et al., 2015). Cross-species amplification tests revealed that the presented markers were usable for M. guillelmi. The results of cross-species amplification tests may vary for different families, which can be successfully amplified in Moniligastridae and Megascolecidae, but not in Lumbricus (Liu et al., 2020).
Genetic Diversity of M. vulgaris in Yancheng City
Genetic diversity is the foundational core of ecosystems and species diversity, and the basic condition for species to sustain their evolutionary potential (Frankham et al., 2004; Spielman et al., 2004). For mtDNA, the COI gene was used to evaluate the genetic diversity of M. vulgaris in Yancheng City. In the present study, the QDY population had the lowest genetic diversity and the HD population had the highest. The COI gene fragment species produced 9 haplotypes in 78 samples of the M. vulgaris population with a nucleotide diversity of π = 0.01088 ± 0.00633. This was lower than Amynthas triastriatus in China by Dong Yan (π = 0.0309) (Dong et al., 2020), which was primarily related to the small sample size obtained in this study. For the microsatellite makers, 12 microsatellite loci were selected to evaluate the genetic diversity of 73 M. vulgaris individuals from the 5 populations in this study. The mean HO, HE, and PIC values were 0.430, 0.619, and 0.571 at 12 microsatellite loci, respectively (Table 4). The NA, HE, and PIC values of the GM and QDY populations were lower than those of the other populations. The HO and the HE were 0.426 and 0.581, respectively, based on the microsatellite markers. Compared with Lumbricus terrestris (Souleman et al., 2016) (HO: from 0.132 to 0.839; HE: from 0.407 to 0.926) studied by Dima Souleman, the population of M. vulgaris showed a moderate genetic diversity. The results based on mitochondrial COI gene and microsatellites showed that the genetic diversity of QDY and GM populations was low, whereas that of the HD population was the highest. However, the evaluation of genetic diversity with different molecular markers may give different results (Siqueira et al., 2013). The consistent results of different molecular markers in M. vulgaris further indicated the objective existence of genetic diversity in this study (Jiang et al., 2016).
Population Differentiation and Structure of M. vulgaris in Yancheng City
For microsatellites, Nei’s genetic diversity (DS) was calculated to evaluate the level of differentiation between populations. The DS values between QDY and any other populations was greater than 0.16, which implied that they possessed medium genetic differentiation. The FST = 0.09349 (P < 0.01) based on microsatellite markers also indicated that genetic differentiation had occurred between the five populations, forming different genetic clusters. According to Bayesian analysis in Structure 2.3.4 software, the five populations of M. vulgaris were divided into three genetic clusters. The AMOVA results revealed that the source of genetic differences emerged primarily from within the populations. However, the phylogenetic NJ tree and network based on the species haplotypes of the mitochondrial gene showed no obvious lineage structure. The results of population differentiation based on mitochondrial COI gene and microsatellite molecular markers were inconsistent, which may have been because microsatellites are nuclear genes, while COI are cytoplasmic genes, and the two have different inheritance patterns (Taanman, 1999). In general, earthworms may be considered to be less transmissible animals (Lise et al., 2015) and more likely to form in geographical isolation. However, the results of this study showed that the GM, HD, and NYYZ populations had similar genetic structures, and the three populations were also on a branch in the UPGMA tree. This may have been due to the geographic proximity of the sampling sites and the lack of geographic isolation. Although the geographic locations of the QDDY and QDY populations were similar, the population structures of the two groups varied significantly in the STRUCTURE cluster. The author believes that this may have been related to land use (QDDY was present in perennial agricultural land; however, QDY was present in newly cultivated land. As a result, QDDY were subjected to greater anthropogenic interference).
With the development of sequencing technology, a reduced-representation genome sequencing method with high-throughput single-nucleotide polymorphisms discovery was used for the genetic differentiation of earthworms (Marchán et al., 2020; Yuan et al., 2020). With the further availability of reference genomes, this method will be more useful for earthworm genetics.
Conclusion
In summary, we developed microsatellite molecular markers and designed 12 pairs of corresponding polymorphic primers for M. vulgaris. The genetic diversity and population structures of five M. vulgaris populations were explored via mitochondrial COI genes and microsatellites. The genetic diversity was at a moderate level and the genetic structure revealed that the five populations could be divided into three genetic groups. M. vulgaris populations were not genetically isolated by distance at small scales, and different land use patterns will lead to genetic differences in population. The aim of the present study was to further inspire and facilitate intense research on M. vulgaris genetics.
Data Availability Statement
The datasets presented in this study can be found in online repositories. The names of the repository/repositories and accession number(s) can be found below: NCBI GenBank, COI1 accession numbers: SUB9429448 Seq1 MW861684–SUB9429448 Seq10 MW861693; SSR accession numbers: BankIt2446728 Seq1 MW858330–BankIt2446728 Seq12 MW858341.
Ethics Statement
Ethical review and approval was not required for the animal study because Earthworms are common soil animals and are not listed in IUCN Red List of Threatened Species.
Author Contributions
HL: conception and design. NX: development of methodology. ZQ: acquisition of data. YF, NX, ZQ, and JC: analysis and interpretation of data. YF, HR, and HL: writing, review, and/or revision of the manuscript. All authors contributed to the article and approved the submitted version.
Funding
This study was supported by the National Natural Science Foundation of China (No. 32071594), the National Key Research and Development Program of China (2016YFD0600204), the Postdoctoral Science Foundation of Jiangsu Province (2019K253), the Innovation and Entrepreneurship Training Program for College Students of China (201910298064Z), the Priority Academic Program Development of Jiangsu Higher Education Institutions (PAPD), and the Funding for school-level research projects of Yancheng Institute of Technology (Grant No. xjr2019042).
Conflict of Interest
The authors declare that the research was conducted in the absence of any commercial or financial relationships that could be construed as a potential conflict of interest.
Footnotes
References
Adeniran, A. A., Hernández-Triana, L. M., Ortega-Morales, A. I., Garza-Hernández, J. A., Cruz-Ramos, J., Chan-Chable, R. J., et al. (2021). Identification of mosquitoes (Diptera: Culicidae) from Mexico State, Mexico using morphology and COI DNA barcoding. Acta. Trop. 213:105730. doi: 10.1016/j.actatropica.2020.105730
Asshoff, R., Scheu, S., and Eisenhauer, N. (2010). Different earthworm ecological groups interactively impact seedling establishment. Eur. J. Soil Biol. 46, 330–334. doi: 10.1016/j.ejsobi.2010.06.005
Babaei, H., Zeinalian, H., Emami, M. H., Hashemzadeh, M., Farahani, N., and Salehi, R. (2017). Simplified microsatellite instability detection protocol provides equivalent sensitivity to robust detection strategies in Lynch syndrome patients. Cancer Biol. Med. 14, 142–150. doi: 10.20892/j.issn.2095-3941.2016.0091
Chang, C., and Chen, J. (2005). Taxonomic status and intraspecific phylogeography of two sibling species of Metaphire (Oligochaeta: Megascolecidae) in Taiwan. Pedobiologia 49, 591–600. doi: 10.1016/j.pedobi.2005.07.002
Cunha, L., Thornber, A., Kille, P., Morgan, A. J., and Novo, M. (2017). A large set of microsatellites for the highly invasive earthworm Amynthas corticis predicted from low coverage genomes. Appl. Soil Ecol. 119, 152–155. doi: 10.1016/j.apsoil.2017.05.029
Dong, Y., Jiang, J. B., Yuan, Z., Zhao, Q., and Qiu, J. P. (2020). Population genetic structure reveals two lineages of Amynthas triastriatus (Oligochaeta: Megascolecidae) in China, with notes on a new subspecies of Amynthas riastriatus. Int. J. Env. Res. Pub. H. 15, 1538–1543. doi: 10.3390/ijerph17051538
Dupont, L., Pauwels, M., Dume, C., Deschins, V., Audusseau, H., Gigon, H., et al. (2017). Genetic variation of the epigeic earthworm Lumbricus castaneus populations in urban soils of the Paris region (France) revealed using eight newly developed microsatellite markers. Appl. Soil Ecol. 135, 33–37. doi: 10.1016/j.apsoil.2018.11.004
Edwards, C. A., and Bohlen, P. J. (1996). Biology and Ecology of Earthworms. Agr. Ecosyst. Environ. 64:426.
Excoffier, L., Laval, G., and Scheider, S. (2007). Arlequin (version 3.0): an integrated software package for population genetics data analysis. Evol. Bioinform. 1, 25–47.
Frankham, R., Ballou, J. D., and Briscoe, D. A. (2004). Introduction to Conservation Genetics Cambridge University Press. Genet. Res. 83, 221–222. doi: 10.1017/s0016672304216913
Gilbert, J. S., and Nijland, M. J. (2008). Sex differences in the developmental origins of hypertension and cardiorenal disease. Am. J. Physiol-Reg. I 295, 1941–1952.
Guichoux, E., Lagache, L., Wagner, S., Chaumeil, P., Léger, P., Lepais, O., et al. (2011). Current trends in microsatellite genotyping. Mol. Ecol. Resour. 4, 591–611.
Harper, G. L., Cesarini, S., Casey, S. P., Morgan, A. J., Kille, P., and Bruford, M. W. (2006). Microsatellite markers for the earthworm Lumbricus rubellus. Mol. Ecol. Notes 6, 325–327. doi: 10.1111/j.1471-8286.2005.01219.x
Herrera, A., Garcia, I., Gaytan, N., Jones, E., Maldonado, A., and Gilkerson, R. (2015). Endangered species: mitochondrial DNA loss as a mechanism of human disease. Front. Biosci. 7, 109–124. doi: 10.2741/428
Hodel, R. G. J., Claudia Segovia-Salcedo, M., Landis, J. B., Crowl, A. A., Sun, M., Liu, X., et al. (2016). The report of my death was an exaggeration: A review for researchers using microsatellites in the 21st century. Appl. Plant Sci. 4:as.1600025.
Jiang, J., Yu, J., Li, J., Li, P., Fan, Z., Niu, L., et al. (2016). Mitochondrial genome and nuclear markers provide new insight into the evolutionary history of macaques. PLoS One 11:e0154665. doi: 10.1371/journal.pone.0154665
Kalinowski, S. T., Taper, M. L., and Marshall, T. C. (2007). Revising how the computer program CERVUS accommodates genotyping error increases success in paternity assignment. Mol. Ecol. 16, 1099–1106. doi: 10.1111/j.1365-294x.2007.03089.x
Lang, S. A., Garcia, M. V., James, S. W., Sayers, C. H., and Shain, D. H. (2012). Phylogeny and Clitellar Morphology of the Giant Amazonian Earthworm, Rhinodrilus priollii (Oligochaeta: Glossoscolecidae). Am. Midl. Nat. 14, 142–150.
Leigh, J. W., and Bryant, D. (2015). Popart: full−feature software for haplotype network construction. Methods Ecol. Evol. 6, 1110–1116. doi: 10.1111/2041-210x.12410
Liang, J., and Zhou, Q. (2006). Influences of acetochlor and copper on the degradation process of methamidophos in phaeozem by earthworms. Acta Sci. Circum. 26, 306–311.
Librado, P., and Rozas, J. (2009). DnaSP v5: a software for comprehensive analysis of DNA polymorphism data. Bioinformatics 25, 1451–1452. doi: 10.1093/bioinformatics/btp187
Lin, Z., Zhen, Z., Ren, L., Yang, J., Luo, C., Zhong, L., et al. (2018). Effects of two ecological earthworm species on atrazine degradation performance and bacterial community structure in red soil. Chemosphere 196, 467–475. doi: 10.1016/j.chemosphere.2017.12.177
Lise, D., Ysoline, G., Benoît, R., Thibaud, D., and Jérôme, M. (2015). Dispersal constraints and fine-scale spatial genetic structure in two earthworm species. Biol. J. Linn. Soc. 114, 335–347. doi: 10.1111/bij.12436
Liu, H. Y., Zhang, Y. F., Wang, G. B., Chen, J., Zhang, Q. Z., and Ruan, H. H. (2020). Development and characterization of microsatellite markers in the earthworm drawida gisti michaelsen, 1931 and cross-amplification in two other congeners. Mol. Biol. Rep. 47, 8265–8269. doi: 10.1007/s11033-020-05799-4
Marchán, D. F., Novo, M., Sánchez, N., Domínguez, J., and Fernández, R. (2020). Local adaptation fuels cryptic speciation in terrestrial annelids. Mol. Phylogenet. Evol. 146:106767. doi: 10.1016/j.ympev.2020.106767
Minamiya, Y., Yokoyama, J., and Fukuda, T. (2009). A phylogeographic study of the Japanese earthworm, Metaphire sieboldi (Horst, 1883) (Oligochaeta: Megascolecidae): Inferences from mitochondrial DNA sequences. Eur. J. Soil Biol. 45, 423–430. doi: 10.1016/j.ejsobi.2009.06.004
Pritchard, J. K., Stephens, M., and Donnelly, P. (2000). Inference of population structure using multilocus genotype data. Genetics 115, 945–959. doi: 10.1093/genetics/155.2.945
Qin, H., Yang, G., Jim, P., Liu, J., and Gao, L. (2017). Using MiddRAD-seq data to develop polymorphic microsatellite markers for an endangered yew species. Plant Divers. 39, 294–299. doi: 10.1016/j.pld.2017.05.008
Rosenberg, N. A., Burke, T., Elo, K., Feldman, M. W., Freidlin, P. J., Groenen, M. A., et al. (2001). Empirical evaluation of genetic clustering methods using multilocus genotypes from 20 chicken breeds. Genetics 159, 699–713. doi: 10.1093/genetics/159.2.699
Shekhovtsov, S. V., Golovanova, E. V., and Peltek, S. E. (2014). Genetic diversity of the earthworm Octolasion tyrtaeum (Lumbricidae, Annelida). Pedobiologia 57, 245–250. doi: 10.1016/j.pedobi.2014.09.002
Siqueira, F. D. F., Sandes, S. H. D. C., Drumond, M. A., Campos, S. H., Martins, R. P., Fonseca, C. G. D., et al. (2013). Genetic diversity and population genetic structure in giant earthworm Rhinodrilus alatus (Annelida: Clitellata: Glossoscolecidae). Pedobiologia 56, 15–23. doi: 10.1016/j.pedobi.2012.08.006
Somer, C. M., Neudorf, K., Jones, K. L., and Lance, S. L. (2011). Novel microsatellite loci for the compost earthworm Eisenia fetida: A genetic comparison of three North American vermiculture stocks. Pedobiologia 54, 111–117. doi: 10.1016/j.pedobi.2010.11.002
Souleman, D., Grumiaux, F., Frérot, H., Vandenbulcke, F., and Pauwels, M. (2016). Isolation and characterization of eight polymorphic microsatellites markers for the earthworm Lumbricus terrestris. Eur. J. Soil Biol. 74, 76–80. doi: 10.1016/j.ejsobi.2016.03.009
Spielman, D., Brook, J. D., and Briscoe, D. A. (2004). Introduction to Conservation Genetics Cambridge University Press. Proc. Natl. Acad. Sci. U S A. 101, 15261–15264.
Strunk, H., Hochkirch, A., Veith, M., Hankeln, T., and Emmerling, C. (2012). Isolation and characterization of eleven polymorphic microsatellite markers for the earthworm Aporrectodea longa (Ude). Eur. J. Soil Biol. 48, 56–58. doi: 10.1016/j.ejsobi.2011.11.004
Sudhir, K., Glen, S., and Koichiro, T. (2016). MEGA7: Molecular Evolutionary Genetics Analysis Version 7.0 for Bigger Datasets. Mol. Biol. Evol. 33, 1451–1452.
Swindell, S. R., and Plasterer, T. N. (1997). SEQMAN. Contig assembly. Methods Mol. Biol. 70, 75–89.
Taanman, J. W. (1999). The mitochondrial genome: structure, transcription, translation and replication. Biochim. Biophys. Acta 1410, 103–123. doi: 10.1016/s0005-2728(98)00161-3
Xu, Q., and Xiao, N. (2011). Terrestrial earthworms (Oligochaeta: Opisthopora) of China. Beijing: China Agriculture Press, 51–52.
Yuan, Y., Shangguan, J. B., Li, Z. B., Ning, Y. F., Huang, Y. S., Li, B. B., et al. (2015). Isolation and characterization of new microsatellite markers in red tail prawn, Fenneropenaeus penicillatus, an endangered species in China. Genet. Mol. Res. 14, 15412–15416. doi: 10.4238/2015.november.30.18
Yuan, Z., Jiang, J., Dong, Y., Zhao, Q., and Qiu, J. (2020). Unearthing the genetic divergence and gene flow of the earthworm Amynthas_yn2017 sp. (Oligochaeta: Megascolecidae) populations based on restriction site-associated DNA sequencing. Eur. J. Soil Biol. 99:103210. doi: 10.1016/j.ejsobi.2020.103210
Keywords: COI, microsatellite, genetic diversity, Metaphire guillelmi, Metaphire vulgaris
Citation: Fang Y, Chen J, Ruan H, Xu N, Que Z and Liu H (2021) Genetic Diversity and Population Structure of Metaphire vulgaris Based on the Mitochondrial COI Gene and Microsatellites. Front. Genet. 12:686246. doi: 10.3389/fgene.2021.686246
Received: 26 March 2021; Accepted: 18 May 2021;
Published: 08 June 2021.
Edited by:
Diogo Teruo Hashimoto, São Paulo State University, BrazilReviewed by:
Yuzine Esa, Putra Malaysia University, MalaysiaSeyed Mehdi Talebi, Arak University, Iran
Copyright © 2021 Fang, Chen, Ruan, Xu, Que and Liu. This is an open-access article distributed under the terms of the Creative Commons Attribution License (CC BY). The use, distribution or reproduction in other forums is permitted, provided the original author(s) and the copyright owner(s) are credited and that the original publication in this journal is cited, in accordance with accepted academic practice. No use, distribution or reproduction is permitted which does not comply with these terms.
*Correspondence: Hongyi Liu, aG9uZ3lpX2xpdUBuamZ1LmVkdS5jbg==
†These authors have contributed equally to this work