 Hongxiao Jiao
 Miaomiao Zhang2†
 Wei-Dong Li
- 1Research Center of Basic Medical Sciences, Tianjin Medical University, Tianjin, China
- 2Department of Genetics, College of Basic Medical Sciences, Tianjin Medical University, Tianjin, China
- 3College of Public Health, Tianjin Medical University, Tianjin, China
As a marker for glomerular filtration, plasma cystatin C level is used to evaluate kidney function. To decipher genetic factors that control the plasma cystatin C level, we performed genome-wide association and pathway association studies using United Kingdom Biobank data. One hundred fifteen loci yielded p values less than 1 × 10−100, three genes (clusters) showed the most significant associations, including the CST8-CST9 cluster on chromosome 20, the SH2B3-ATXN2 gene region on chromosome 12, and the SHROOM3-CCDC158 gene region on chromosome 4. In pathway association studies, forty significant pathways had FDR (false discovery rate) and or FWER (family-wise error rate) ≤ 0.001: spermatogenesis, leukocyte trans-endothelial migration, cell adhesion, glycoprotein, membrane lipid, steroid metabolic process, and insulin signaling pathways were among the most significant pathways that associated with the plasma cystatin C levels. We also performed Genome-wide association studies for eGFR, top associated genes were largely overlapped with those for cystatin C.
Introduction
Chronic kidney disease (CKD) is a global public health problem with high morbidity (Coresh et al., 2003; Eckardt et al., 2013), which prevalence increases disproportionately with age (Coresh et al., 2007; Zhang et al., 2008; Stevens et al., 2010; Arora et al., 2013), and requires kidney dialysis or kidney transplantation to maintain life in the late stage (Levey et al., 2007; Jha et al., 2013). In addition to lifestyle and environmental factors, genetic factors play an important role in the progression of kidney disease (Kottgen et al., 2009). Genetic susceptibility exposures shared within families are associated with an increased risk of end-stage renal disease (ESRD) (Lei et al., 1998). Although mutation analysis has a high predictive value for monogenetic kidney diseases, finding genetic susceptibility variants for CKD by linkage mapping or candidate gene approaches has proven to be difficult (Hildebrandt, 2010).
Plasma cystatin C (encoded by CST3 on 20p11.21), as an endogenous biomarker of kidney function (Onopiuk et al., 2015) and healthy aging (Sarnak et al., 2008), can effectively evaluate glomerular filtration rate (GFR) (Allen et al., 2015; Koksal et al., 2019). Cystatin C was found to be the most important biological features influencing organismal biological age (Gialluisi et al., 2021). In addition, cystatin C can inhibit the activity of extracellular cathepsins and participate in cardiovascular diseases (CVD), such as stroke, heart failure, coronary heart disease, and other pathological processes (Angelidis et al., 2013). Heritability of cystatin C that estimated by the Swedish twin model was 0.55 (0.49–0.60) in men, 0.63 (0.59–0.66) in women, and 0.60 (0.56–0.63) in both sexes combined, while the heritability of cystatin C estimated by genome-wide complex trait analysis (GCTA) was 0.40 in both sexes (Arpegard et al., 2015). Previous research on Genome-wide association studies (GWAS) have identified common genetic variants at the CST3, UMOD, ATXN2, and STC1 loci that associated with cystatin C and its clinical derivatives (estimated glomerular filtration rate based on cystatin C) in European-ancestry subjects (Hwang et al., 2007; Kottgen et al., 2009; Chambers et al., 2010; Kottgen et al., 2010). SNPs in the CST3 gene locus were associated with circulation concentration of cystatin C, while rs911119 showed the strongest association (Hwang et al., 2007; Kottgen et al., 2009; Chambers et al., 2010; Kottgen et al., 2010; van der Laan et al., 2016; Gorski et al., 2017). However, the minor allele of rs911119 merely explains 2.8% of the observed phenotypic variation in cystatin C (van der Laan et al., 2016). This may be because most of the common variants separately or corporately affect the traits/complex diseases with the modest effect (Hindorff et al., 2009), but higher penetrance rare variants were not detected by GWA studies. Minor genes that associated with complex traits usually become insignificant after adjustment for multiple testing. Meanwhile, interactions among genes were largely ignored, although non-additive effects (epistasis) may account for significant amount of heritabilities (Dong et al., 2003). As a result, most gene loci screened by GWAS cannot sufficiently explain the genetic variation of human traits or complex diseases.
To decipher genetic factors that associated with the plasma cystatin C level, and corporately consider multiple variations of gene-gene interactions in cystatin C, the modified GSEA method (GenGen Program) (Wang et al., 2007) was applied in our study. Genome-wide association and pathway association analyses were performed in United Kingdom Biobank subjects to find novel susceptibility loci and gene sets/pathways that associated with cystatin C levels. It was the largest GWAS for cystatin C in sample size, and the first genome wide pathway association study that ever carried out for cystatin C related phenotypes, providing more possibilities for further explaining the phenotypic variation of cystatin C.
Materials and Methods
Subjects
Subjects were originally collected to United Kingdom Biobank, which is an open access prospective cohort study in the United Kingdom. In 2006–2010, a total of 502,665 subjects from across the United Kingdom with age between 40 and 69 were recruited to participate in United Kingdom Biobank (Chua et al., 2019). Of these, we had cystatin C data for 465,309 individuals, outliers (>3 SD) were excluded thereafter. All participants gave written informed consent prior the study. The research protocol was authorized by the Human Ethics Committee of Tianjin Medical University. This research has been conducted using the United Kingdom biobank Resource under the project number of 45,676.
Genotyping
Genomic DNA of participants was extracted from stored blood samples collected at United Kingdom Biobank. Genotyping was carried out by the United Kingdom Biobank Axiom® Array (825,927 SNPs) or the Affymetrix United Kingdom BiLEVE Axiom® Array (807,411 SNPs) and the methods have been described in detail (Welsh et al., 2017; Bycroft et al., 2018). In summary, samples call rates for inclusion was >80% and genotyped call rates was >95%. Quality control (QC) of the data was performed centrally at the Wellcome Trust Centre for Human Genetics (WTCHG) and genotype data are available for access to approved researchers, providing a powerful resource to decipher new genetic associations and the genetic bases of traits or complex diseases.
Genome-wide Association Study and Gene-Based Association Study
Genome-wide quantitative association analyses were performed by PLINK 1.07 (Purcell et al., 2007) for cystatin C. SNPs with minor allele frequencies (MAF) < 0.05 and HWE p < 0.001were excluded, and Wald test of phenotype on allele dosage was performed for cystatin C association studies. GWAS were carried out in all subjects and in Caucasians, analyses for age and gender adjusted cystatin C were also performed (Table 1, Supplemental Table S2). p < 5 × 10⁻⁸ was regarded as significant to analyze interactions. To remove multiple SNPs which in linkage disequilibrium (LD), SNPs were also preselected with an LD-pruning method and those SNPs were deleted in the same LD block (r2 > 0.6). IBD checking and adjustment of MDS component were performed in 5,000 randomly chosen Caucasian subjects. We also performed GWASs for eGFR, creatinine, and urea, respectively. Besides GWAS, we also conducted gene-based association study for cystatin C that implemented in MAGMA (de Leeuw et al., 2015), which analyzes multiple genetic variants to determine their joint effect and generates novel genome-wide signals at the gene-based level.
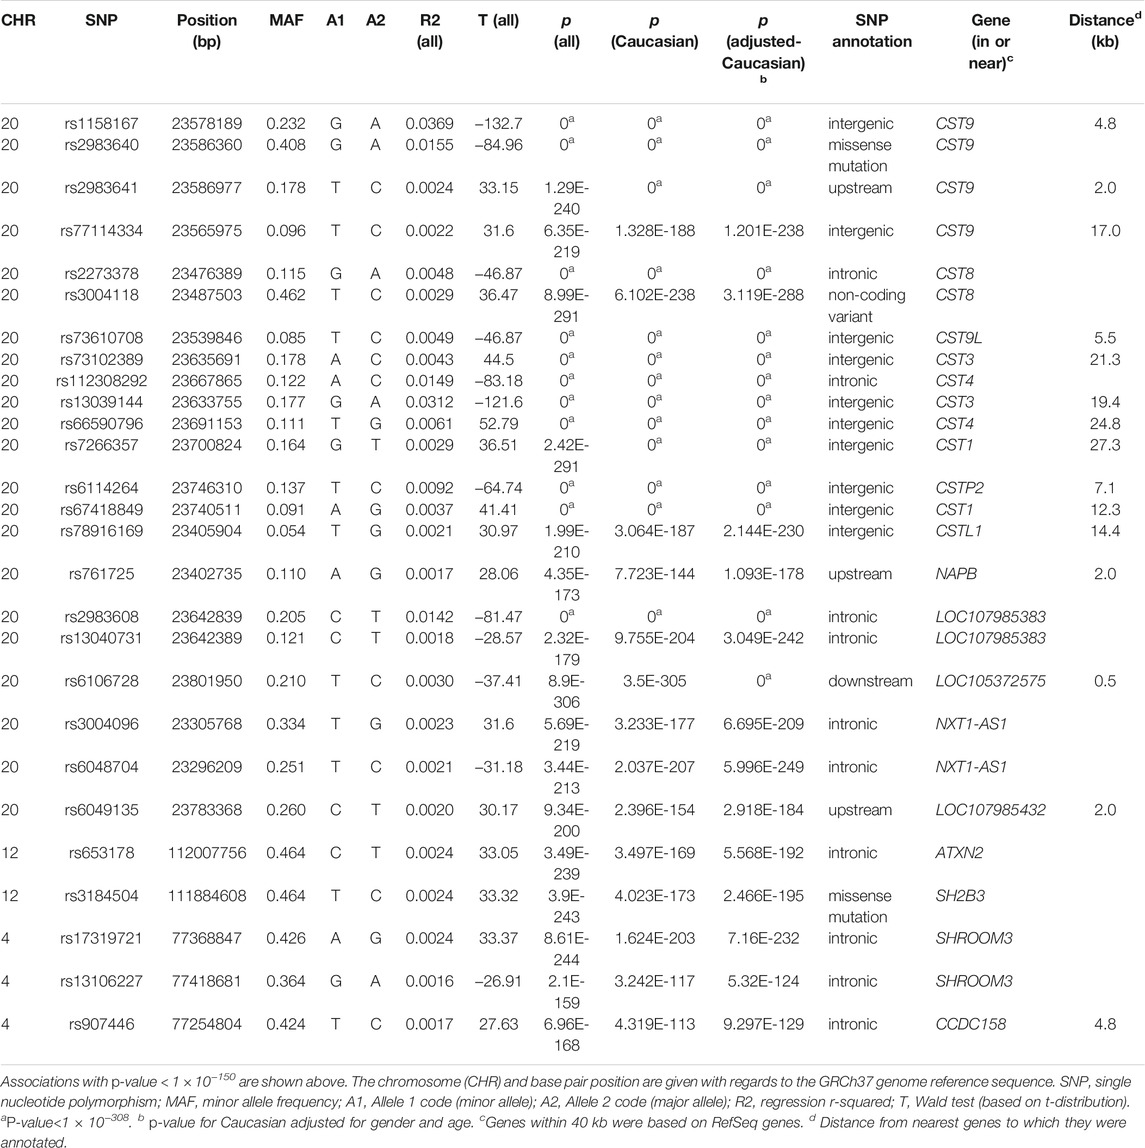
TABLE 1. Genome-wide association study for plasma cystatin C (P < 1 × 10−150).
Pathway Association Study
Pathway-based association studies were carried out by the GenGen program (Wang et al., 2007) based on the modified Gene Set Enrichment Algorithm (GSEA) (Lai et al., 2014) to further study the gene-gene interactions. The calculation process has been described in detail previously (Jiao et al., 2015). Briefly, for each gene, the SNP with the highest test statistic (chi-square detection/F-test) among all SNPs mapped to the gene was selected to represent the gene and all genes were ranked by sorting their statistic values from the largest to smallest. For any given gene set S, an enrichment score (ES) was calculated which reflects the overrepresentation of the gene set S at the forefront of the entire gene list. Then, in order to adjust the size of different genes, phenotype label permutation with 1,000 permutations was performed, and for each permutation, all the above calculations were repeated and the normalized enrichment score (NES) was calculated. The percentage of times that the ES value after permutation was greater than the actual ES value was called as “the empirical p-value”. Finally, a false-discovery rate (FDR) procedure was conducted to control the fraction of expected false-positive findings and family-wise error rate (FWER) ensured that there were no false positive gene sets in the output list. SNPs with minor allele frequencies (MAF) < 0.05 or Hardy-Weinberg equilibrium (HWE) < 0.001 were excluded and SNPs mapped at 20bp upstream or downstream of the gene region are regarded as part of the gene. A total of 377,863 SNPs that covered 21,787 genes were selected for Pathway-based association analyses. Meanwhile, 1,347 pathways/gene sets with size between 5 and 200 genes were selected from Kyoto Encyclopedia of Genes and Genomes (KEGG), BioCarta, and Gene Ontology (GO) databases. Empirical p values ≤0.001, the false-discovery rate (FDR) and or family-wise error rate (FWER) ≤ 0.001 were considered as significant.
Results
We collected phenotype data of plasma cystatin C from subjects in the United Kingdom Biobank, 460,858 participants were included in our study after excluding outliers (>3 SD). The average level of cystatin C was 0.899 ± 0.137 mg/L (range, 0.386–1.436 mg/L). Distributions of cystatin C were shown in Supplemental Table S1 and Q-Q plots for distributions of cystatin C were shown in Supplemental Figure S2.
Genome-wide Association Studies
Quantitative GWAS analyses were performed for cystatin C in United Kingdom Biobank data. One hundred fifteen SNPs had p values less than 1 × 10−100, including significant associations in three gene regions: the CST gene cluster on 20p11.21, the SHROOM3 -CDCC158 region on 4q21.1, and the SH2B3-ATXN2 region on 12q24.11. The gene regions are shown in the Manhattan plots (Figure 1). Analyses in Caucasians, as well as age and gender adjusted phenotypes, yielded similar results (Table 1, Supplemental Table S2). Many SNPs which significantly related to cystatin C overlapped with other renal functional phenotypes, including eGFR and creatinine (Figure 2). The most significant SNP for cystatin C levels was on rs1158167(p<1 × 10−308, Table 1 and Supplemental Table S2), near the cystatin C precursor gene family (CST3, CST4, CST9). However, no association was found for other renal function related phenotypes (creatinine, eGFR, urea) for CST cluster SNPs.
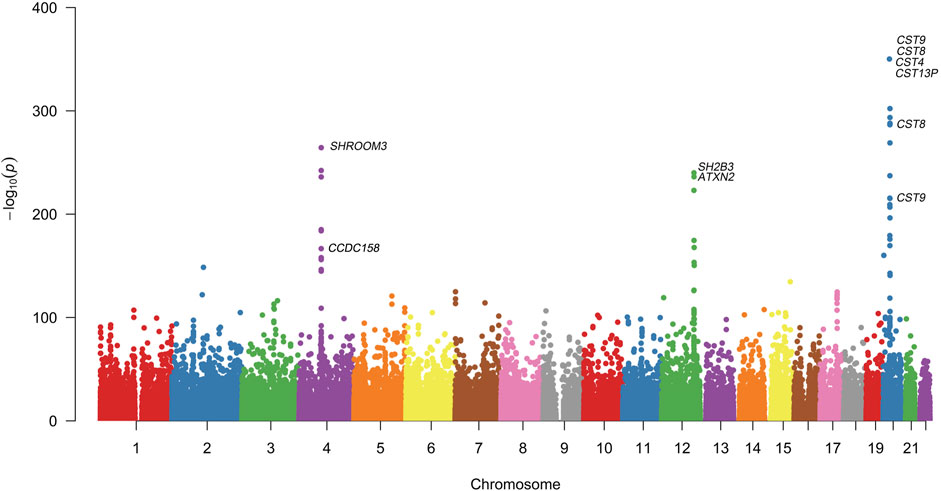
FIGURE 1. Manhattan Plot for genome wide association study of cystatin C. Variants are positioned according to the GRCh37 genome reference sequence. Associations with p-value < 1 × 10−308 were not displayed in normal scale.
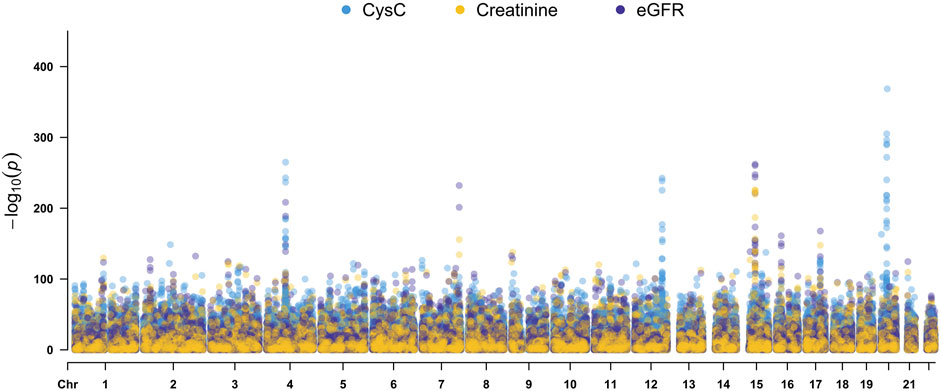
FIGURE 2. Manhattan Plots for cystatin C, creatinine, and eGFR genome wide association studies. Variants are positioned according to the GRCh37 genome reference sequence.
Two SNPs (rs17319721, and rs13106227) in the SHROOM3 gene, one of the most replicated loci for renal function, reached a p < 1 × 100−200 (Table 1). The SNP rs17319721 yielded p = 8.61 × 10−244, p = 5.14 × 10−209, p = 5.65 × 10−109, and p = 1.51 × 10−126 for cystatin C, eGFR, creatinine, and urea, respectively (Supplemental Table S4). rs907446 in the CCDC158 gene, which located in the upstream region of SHROOM3, was also associated with cystatin C (Table 1). A SNP rs653178 that located in the SH2B3-ATXN2 gene region showed significant association (p = 3.49 × 10−239) with cystatin C (Table 1).
Pathway Association Studies
We carried out pathway associations based on the GSEA algorithm. A total of 1,347 Kyoto Encyclopedia of Genes and Genomes (KEGG), BioCarta, and Gene Ontology (GO) pathways were tested. Figure 3 showed top significant pathways/gene sets that significantly associated with cystatin C levels. Pathways with false-discovery rate (FDR) and or family-wise error rate (FWER) ≤ 0.001 were set as significant (Table 2). Spermatogenesis, leukocyte transendothelial migration, cytoskeleton, tight junction, cell adhesion, glycoprotein, membrane lipid, steroid metabolic process, and insulin signaling pathways were among the most significant pathways.
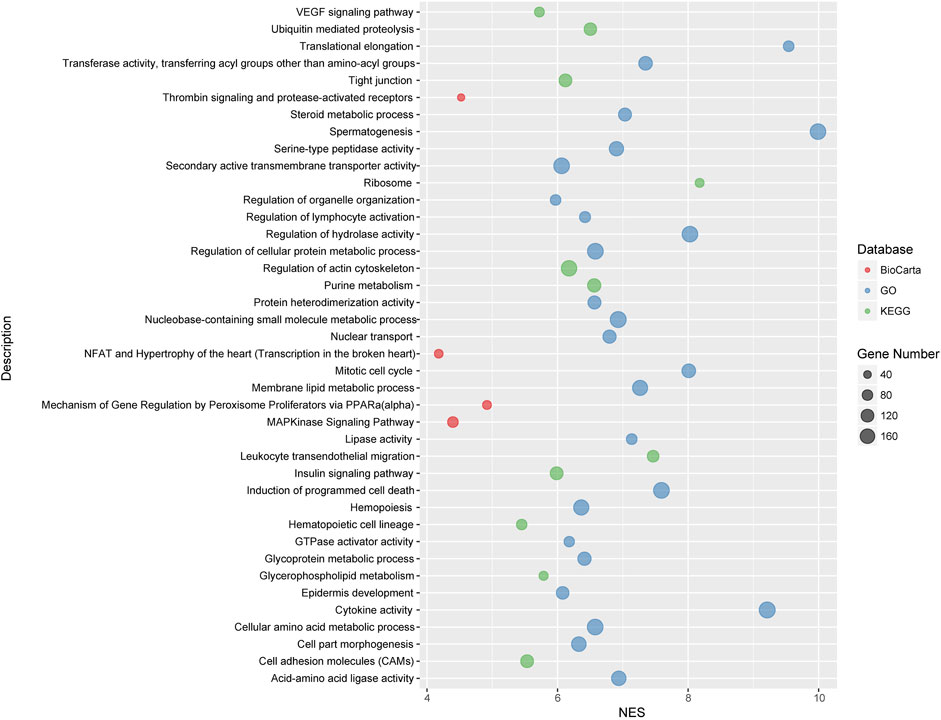
FIGURE 3. Top significant pathways/gene sets that associated with cystatin C levels. Results passing multiple hypothesis tests (false-discovery rate (FDR) and or family-wise error rate (FWER) ≤ 0.001) that identified by pathway association studies were shown in the figure. The NES(Wang et al., 2007) denotes normalized enrichment score (ES) which reflects the overrepresentation of gene sets at the top of the entire ranking list of genes in the genome.
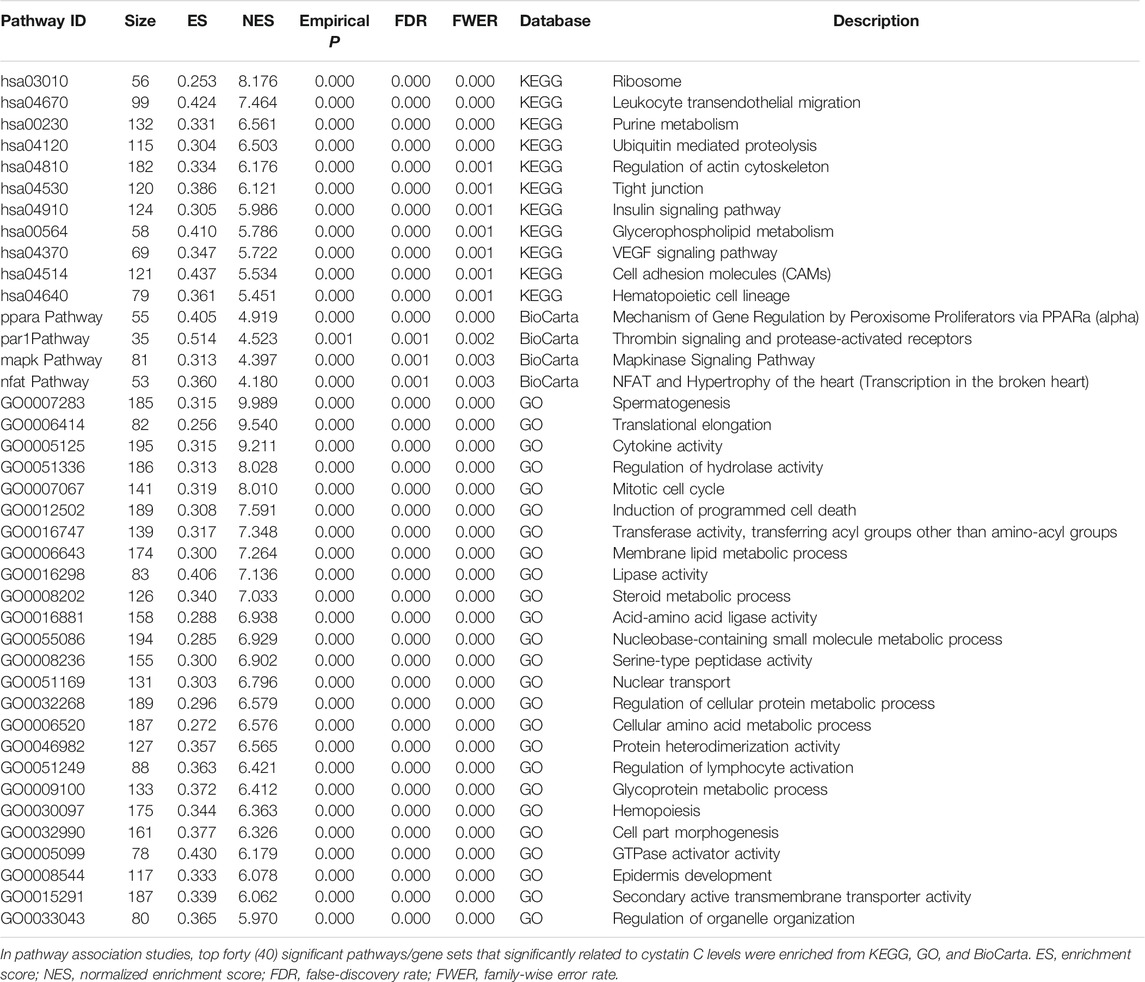
TABLE 2. Pathway association studies for plasma cystatin C.
Discussion
Plasma cystatin C, as a superior endogenous biomarker of kidney function and healthy aging, is reported to be produced at a near constant rate and not to be affected by age, gender, or weight (Angelidis et al., 2013). However, there are limited data on genetic factors, that may influence plasma cystatin C levels.
Up to now, a few of GWAS studies on cystatin C and its clinical derivatives (estimated glomerular filtration rate based on cystatin C) have been reported (Hwang et al., 2007; Kottgen et al., 2009; Chambers et al., 2010; Kottgen et al., 2010; Gorski et al., 2017). From these reports, associations on CST3, UMOD, ATXN2, and STC1 were identified. Of note, CST3, located in cystatin (CST) superfamily gene cluster on chromosome 20 and encoding the most abundant extracellular inhibitor of cysteine proteases, has associated with plasma cystatin C levels. SNPs that significantly related to cystatin C were identified, including rs1158167 (Hwang et al., 2007), rs13038305 (Kottgen et al., 2009) and rs911119 (Kottgen et al., 2010) on the CST gene cluster. Not unexpectedly, rs1158167 (p < 1 × 10−308, Table 1), the most significant common variation in our study, almost exclusively associated with cystatin C, meanwhile no association was found in other renal function related phenotypes (creatinine, eGFR, urea).
The SH2B3-ATXN2 region on chromosomal 12q24.11 is another locus that we found related to cystatin C, which had associated with a wide spectrum of complex diseases, such as hematopoietic disorders of red and white blood cells, rheumatoid arthritis, retinal microcirculation problems, chronic kidney disease, cardiovascular infarction, and neurodegenerative diseases in previous studies (Gudbjartsson et al., 2009; Ikram et al., 2010; Kottgen et al., 2010; Mehta, 2011; Auburger et al., 2014). SH2B3, originally characterized as LNK, encodes a member of the SH2B adaptor family of proteins and is expressed in hematopoietic precursor cells and endothelial cells. It negatively regulates cytokine signaling involved in immune and inflammatory signaling pathways (Velazquez et al., 2002) and inhibits the JAK2/ABL1 dependent leukocyte proliferation. SH2B3 mutations were associated with susceptibility to celiac disease type 13 and insulin-dependent diabetes mellitus.
ATXN2 belongs to a group of genes that associated with microsatellite-expansion diseases and encodes cytoplasmic protein which modulates mTOR signals, modifying ribosomal translation and mitochondrial function. ATXN2 deletions can lead to insulin resistance and obesity in mice (Meierhofer et al., 2016). The SNP rs653178, an intronic SNP at the ATXN2 locus, reached significant association (p = 3.49 × 10−239, Table 1) with cystatin C levels in our study. This SNP is in near complete linkage disequilibrium (LD) with a missense SNP rs3184504 (p = 3.90 × 10−243, Table 1) at the SH2B3 locus (r2=0.99). Indeed, several independent GWASs reported that rs653178 displayed significant associations with renal function phenotypes (estimated glomerular filtration rate based on cystatin C, eGFRcys) and CKD in populations of European and African ancestry (Kottgen, 2010; Kottgen et al., 2010; Boger and Heid, 2011; Liu et al., 2011). SNPs in these genes probably influence plasma levels of cystatin C and therefore eGFRcys, but not necessary for the true GFR susceptibility. Although rs653178 in ATXN2 has no known functional effect, rs3184504 in SH2B3 results in a substitution of tryptophan by arginine (R262 W) which is in the pleckstrin homology (PH) domain of LNK and induces changes in the structure and hydrophilic properties. At the same time, the missense variant also introduces a new phosphorylation site in the PH domain which may influence signaling pathways mediated by SH2B3. High conservation in mammals of the R262 residue in LNK suggests that it may have irreplaceable function in biological activities (Takaki et al., 2002). This may explain why the non-synonymous SNP in SH2B3 seems to be a powerful pleiotropic variant involved in multiple complex diseases or traits including cystatin C.
Shroom family member 3 (SHROOM3) also appeared to be very significant in our GAWS studies on cystatin C. It plays an important role in mammalian kidney development and human kidney disease including CKD and ESRD through estimated glomerular filtration rate based on creatinine (eGFRcrea) (Kottgen et al., 2009; Boger et al., 2011). SHROOM3, the actin-binding protein, regulates the microtubule cytoskeleton during epithelial morphogenesis (Lee et al., 2007) and participates in epithelial cell arrangement and remodeling (Nishimura and Takeichi, 2008), which maintains the integrity of the glomerular filtration barrier (Yeo et al., 2015). Remarkably, rs13106227 (p = 5.32 × 10−124) in SHROOM3 gene showed a strong correlation with cystatin C levels, which has not been reported by association research. However, the intronic SNP rs17319721 located in a highly conserved region in SHROOM3 on chromosome 4 proved to be related to glomerular filtration rate (Kottgen et al., 2009) and impacted cis-expression of SHROOM3 and renal allograft fibrosis (Menon et al., 2015). It is worth noting that SNP rs17319721 in SHROOM3 showed consistency association across renal traits (cystatin C, eGFR, creatinine, and urea) in our study. The consistency of renal traits suggests that it may be an important functional site that interacts with other gene sites to perform its function. Another significant cystatin C associated SNP in SHROOM3 was rs9992101 (not shown in Table 1), which is in high LD with rs17319721 (r2 = 0.75) and both closely associated with CKD (Chambers et al., 2010).
Coiled-coil domain containing 158 (CCDC158) gene SNPs were significantly associated with cystatin C levels. CCDC158, located on 4q21.1, contains a conserved coiled-coil domain, which are found in important proteins involved in crucial interactions such as transcription factors (leucine zippers), molecular motors (myosin, kinesin), receptors, and signaling molecules (Lupas and Gruber, 2005). Unfortunately, there is little research on CCDC158 related to the kidney due to its restricted expression in testis, even though coiled coils may change their oligomer state and conformation in response to environment changes. We need to point out these CCDC158 gene region SNPs in CDCC158 gene located within 100 Kb upstream of SHROOM3 gene, still fell into the SHROOM3 enhancer region.
To decipher genetic factors that control the plasma cystatin C levels and corporately consider multiple variation of gene-gene interactions in cystatin C, we performed pathway association analyses based on the genome-wide genotyping data in the United Kingdom Biobank database. We found 40 pathways/gene sets were significantly associated with cystatin C levels (Figure 3). It is worth noting that most significant pathways were cell adhesion, cell migration, and cell polarity related pathways, such as regulation of actin cytoskeleton, cell adhesion molecules, tight junction, and the VEGF signaling pathway.
Many metabolism related pathways were identified in our study, including cellular amino acid, glycoprotein, membrane lipid, steroid metabolic process, and the insulin signaling pathway. Furthermore, a few of immunity and inflammation-related pathways were involved, including leukocyte transendothelial migration and MAPKinase signaling pathways.
Cell adhesion plays an important role in maintaining the filtration integrity of epithelial cells (Sachs and Sonnenberg, 2013). Podocytes, as a key component of glomerular filtration barrier, adhere tightly to the underlying glomerular basement membrane (GBM), which provides cell adhesion and acts as solid-phase agonists of epithelial cells migration (Yurchenco, 2011). Previous research has reported that cystatin C was related to the pathological traits of invasiveness and angiogenesis caused by increased adhesion and migration in age-related macular degeneration (Carlsson et al., 2020), suggesting a relationship between cell adhesion and cystatin C levels. Indeed, our study of pathway association analysis in United Kingdom Biobank database revealed the genetic basis for its influence on the level of cystatin C. Whether cell adhesion affects the level of cystatin C and thus glomerular filtration needs further research.
Insulin is the major hormone controlling glucose and lipid metabolism and acts on most organs and cell types including the kidney, besides classical insulin target tissues (liver, skeletal muscle, and white adipose tissue) (Artunc et al., 2016). Abundant insulin receptors are expressed on podocytes, endothelial cells, mesangial cells, renal tubular epitheliums (Fornoni, 2010). Insulin signaling displays important roles in podocyte viability and renal tubular cell function (Artunc et al., 2016). Insulin resistance (IR) appears in the early stages of CKD patients, even if their GFR is still within the normal range, and becomes almost universal in those with the end stage of renal failure (Spoto et al., 2016). Impaired kidney function is well known to be linked with insulin resistance, however, the causality of this relationship was not well defined. The insulin signaling cascades in kidney mainly includes phosphoinoside-3-kinase (PI3K), mitogen-activated protein kinase (MAPK), nuclear factor kappa B (NF-κB), glucose transporter 4 (GLUT4), and adenosine monophosphate activated protein kinase (AMPK). Clinically, a higher level of serum cystatin C was associated with decreased insulin sensitivity in type 1 diabetic patients (Uruska et al., 2014). Although whether the level of cystatin C can accurately reflect insulin resistance remains to be verified, the role of insulin signaling pathway which was found in pathway-based association analyses cannot be ignored as the genetic background of cystatin C.
In summary, recent technological advancements resulted in large collections of whole-genome genotyping data which provides better coverage and increased imputation quality. It was the largest GWAS for cystatin C in sample size, and the first genome wide pathway association study for cystatin C that ever carried out. We have also found novel associations and pathways for plasma cystatin C levels. However, under current conditions, we are unable to verify biological functions of results from our pathway research, further verifications in the transcriptome dataset are needed in the future.
Conclusion
We performed genome wide association and pathway association studies on cystatin C in an open access prospective cohort study. We have identified three major gene loci and 40 novel biological pathways, including cell adhesion and insulin signaling pathways, that associated with the plasma cystatin C levels. Our results provided more genetic bases for further understanding the phenotypic variations of cystatin C.
Data Availability Statement
The datasets presented in this study can be found in online repositories. The names of the repository/repositories and accession number(s) can be found in the article/Supplementary Material.
Ethics Statement
The studies involving human participants were reviewed and approved by the Human Ethics Committee of Tianjin Medical University. The patients/participants provided their written informed consent to participate in this study.
Author Contributions
HJ designed the study, researched data and contributed to discussion. MZ researched data and wrote the manuscript. W-DL designed the study, researched data and edited the manuscript. YW designed the study and contributed to discussion. YZ researched data.
Funding
This work was supported in part by the National Natural Science Foundation of China (92046014, 91746205), Beijing-Tianjin-Hebei Jointed Research Program (19JCZDJC64700), and by the National Key R and D Program of China (2017YFC1001900).
Conflict of Interest
The authors declare that the research was conducted in the absence of any commercial or financial relationships that could be construed as a potential conflict of interest.
Publisher’s Note
All claims expressed in this article are solely those of the authors and do not necessarily represent those of their affiliated organizations, or those of the publisher, the editors, and the reviewers. Any product that may be evaluated in this article, or claim that may be made by its manufacturer, is not guaranteed or endorsed by the publisher.
Acknowledgments
The authors gratefully acknowledge the participants of the United Kingdom Biobank.
Supplementary Material
The Supplementary Material for this article can be found online at: https://www.frontiersin.org/articles/10.3389/fgene.2021.711155/full#supplementary-material
References
Allen, A. M., Kim, W. R., Larson, J. J., Colby, C., Therneau, T. M., and Rule, A. D. (2015). Serum Cystatin C as an Indicator of Renal Function and Mortality in Liver Transplant Recipients. Transplantation 99 (7), 1431–1435. doi:10.1097/TP.0000000000000552
Angelidis, C., Deftereos, S., Giannopoulos, G., Anatoliotakis, N., Bouras, G., Hatzis, G., et al. (2013). Cystatin C: An Emerging Biomarker in Cardiovascular Disease. Curr. Top. Med. Chem. 13 (2), 164–179. doi:10.2174/1568026611313020006
Arora, P., Vasa, P., Brenner, D., Iglar, K., McFarlane, P., Morrison, H., et al. (2013). Prevalence Estimates of Chronic Kidney Disease in Canada: Results of a Nationally Representative Survey. CMAJ 185 (9), E417–E423. doi:10.1503/cmaj.120833
Arpegård, J., Viktorin, A., Chang, Z., de Faire, U., Magnusson, P. K. E., and Svensson, P. (2015). Comparison of Heritability of Cystatin C‐ and Creatinine‐Based Estimates of Kidney Function and Their Relation to Heritability of Cardiovascular Disease. J. Am. Heart Assoc. 4 (1), e001467. doi:10.1161/JAHA.114.001467
Artunc, F., Schleicher, E., Weigert, C., Fritsche, A., Stefan, N., and Häring, H.-U. (2016). The Impact of Insulin Resistance on the Kidney and Vasculature. Nat. Rev. Nephrol. 12 (12), 721–737. doi:10.1038/nrneph.2016.145
Auburger, G., Gispert, S., Lahut, S., Omur, O., Damrath, E., Heck, M., et al. (2014). 12q24 Locus Association with Type 1 diabetes:SH2B3orATXN2? World J. Diabetes 5 (3), 316–327. doi:10.4239/wjd.v5.i3.316
Böger, C. A., Gorski, M., Li, M., Hoffmann, M. M., Huang, C., Yang, Q., et al. (2011). Association of eGFR-Related Loci Identified by GWAS with Incident CKD and ESRD. Plos Genet. 7 (9), e1002292. doi:10.1371/journal.pgen.1002292
Böger, C. A., and Heid, I. M. (2011). Chronic Kidney Disease: Novel Insights from Genome-Wide Association Studies. Kidney Blood Press. Res. 34 (4), 225–234. doi:10.1159/000326901
Bycroft, C., Freeman, C., Petkova, D., Band, G., Elliott, L. T., Sharp, K., et al. (2018). The UK Biobank Resource with Deep Phenotyping and Genomic Data. Nature 562 (7726), 203–209. doi:10.1038/s41586-018-0579-z
Carlsson, E., Supharattanasitthi, W., Jackson, M., and Paraoan, L. (2020). Increased Rate of Retinal Pigment Epithelial Cell Migration and Pro-Angiogenic Potential Ensuing from Reduced Cystatin C Expression. Invest. Ophthalmol. Vis. Sci. 61 (2), 9. doi:10.1167/iovs.61.2.9
Chambers, J. C., Zhang, W., Lord, G. M., van der Harst, P., Lawlor, D. A., Sehmi, J. S., et al. (2010). Genetic Loci Influencing Kidney Function and Chronic Kidney Disease. Nat. Genet. 42 (5), 373–375. doi:10.1038/ng.566
Chua, S. Y. L., Thomas, D., Allen, N., Lotery, A., Desai, P., Patel, P., et al. (2019). Cohort Profile: Design and Methods in the Eye and Vision Consortium of UK Biobank. BMJ Open 9 (2), e025077. doi:10.1136/bmjopen-2018-025077
Coresh, J., Astor, B. C., Greene, T., Eknoyan, G., and Levey, A. S. (2003). Prevalence of Chronic Kidney Disease and Decreased Kidney Function in the Adult US Population: Third National Health and Nutrition Examination Survey. Am. J. Kidney Dis. 41 (1), 1–12. doi:10.1053/ajkd.2003.50007
Coresh, J., Selvin, E., Stevens, L. A., Manzi, J., Kusek, J. W., Eggers, P., et al. (2007). Prevalence of Chronic Kidney Disease in the United States. JAMA 298 (17), 2038–2047. doi:10.1001/jama.298.17.2038
de Leeuw, C. A., Mooij, J. M., Heskes, T., and Posthuma, D. (2015). MAGMA: Generalized Gene-Set Analysis of GWAS Data. Plos Comput. Biol. 11 (4), e1004219. doi:10.1371/journal.pcbi.1004219
Dong, C., Wang, S., Li, W.-D., Li, D., Zhao, H., and Price, R. A. (2003). Interacting Genetic Loci on Chromosomes 20 and 10 Influence Extreme Human Obesity. Am. J. Hum. Genet. 72 (1), 115–124. doi:10.1086/345648
Eckardt, K.-U., Coresh, J., Devuyst, O., Johnson, R. J., Köttgen, A., Levey, A. S., et al. (2013). Evolving Importance of Kidney Disease: from Subspecialty to Global Health burden. The Lancet 382 (9887), 158–169. doi:10.1016/S0140-6736(13)60439-0
Fornoni, A. (2010). Proteinuria, the Podocyte, and Insulin Resistance. N. Engl. J. Med. 363 (21), 2068–2069. doi:10.1056/NEJMcibr1008395
Gialluisi, A., Di Castelnuovo, A., Costanzo, S., Bonaccio, M., Persichillo, M., Magnacca, S., et al. (2021). Exploring Domains, Clinical Implications and Environmental Associations of a Deep Learning Marker of Biological Ageing. Eur. J. Epidemiol. doi:10.1007/s10654-021-00797-7
Gorski, M., van der Most, P. J., Teumer, A., Chu, A. Y., Li, M., Mijatovic, V., et al. (2017). 1000 Genomes-Based Meta-Analysis Identifies 10 Novel Loci for Kidney Function. Sci. Rep. 7, 45040. doi:10.1038/srep45040
Gudbjartsson, D. F., Bjornsdottir, U. S., Halapi, E., Helgadottir, A., Sulem, P., Jonsdottir, G. M., et al. (2009). Sequence Variants Affecting Eosinophil Numbers Associate with Asthma and Myocardial Infarction. Nat. Genet. 41 (3), 342–347. doi:10.1038/ng.323
Hildebrandt, F. (2010). Genetic Kidney Diseases. The Lancet 375 (9722), 1287–1295. doi:10.1016/S0140-6736(10)60236-X
Hindorff, L. A., Sethupathy, P., Junkins, H. A., Ramos, E. M., Mehta, J. P., Collins, F. S., et al. (2009). Potential Etiologic and Functional Implications of Genome-wide Association Loci for Human Diseases and Traits. Proc. Natl. Acad. Sci. 106 (23), 9362–9367. doi:10.1073/pnas.0903103106
Hwang, S.-J., Yang, Q., Meigs, J. B., Pearce, E. N., and Fox, C. S. (2007). A Genome-wide Association for Kidney Function and Endocrine-Related Traits in the NHLBI's Framingham Heart Study. BMC Med. Genet. 8 (Suppl. 1), S10. doi:10.1186/1471-2350-8-S1-S10
Ikram, M. K., Xueling, S., Jensen, R. A., Cotch, M. F., Hewitt, A. W., Ikram, M. A., et al. (2010). Four Novel Loci (19q13, 6q24, 12q24, and 5q14) Influence the Microcirculation In Vivo. Plos Genet. 6 (10), e1001184. doi:10.1371/journal.pgen.1001184
Jha, V., Garcia-Garcia, G., Iseki, K., Li, Z., Naicker, S., Plattner, B., et al. (2013). Chronic Kidney Disease: Global Dimension and Perspectives. The Lancet 382 (9888), 260–272. doi:10.1016/S0140-6736(13)60687-X
Jiao, H., Wang, K., Yang, F., Grant, S. F. A., Hakonarson, H., Price, R. A., et al. (2015). Pathway-Based Genome-Wide Association Studies for Plasma Triglycerides in Obese Females and Normal-Weight Controls. PLoS One 10 (8), e0134923. doi:10.1371/journal.pone.0134923
Koksal, A. R., Alkim, H., Boga, S., Iyisoy, M. S., Sen, I., Tekin Neijmann, S., et al. (2019). Value of Cystatin C-Based E-GFR Measurements to Predict Long-Term Tenofovir Nephrotoxicity in Patients With Hepatitis B. Am. J. Ther. 26 (1), e25–e31. doi:10.1097/MJT.0000000000000518
Köttgen, A., Pattaro, C., Böger, C. A., Fuchsberger, C., Olden, M., Glazer, N. L., et al. (2010). New Loci Associated with Kidney Function and Chronic Kidney Disease. Nat. Genet. 42 (5), 376–384. doi:10.1038/ng.568
Köttgen, A. (2010). Genome-Wide Association Studies in Nephrology Research. Am. J. Kidney Dis. 56 (4), 743–758. doi:10.1053/j.ajkd.2010.05.018
Köttgen, A., Glazer, N. L., Dehghan, A., Hwang, S.-J., Katz, R., Li, M., et al. (2009). Multiple Loci Associated with Indices of Renal Function and Chronic Kidney Disease. Nat. Genet. 41 (6), 712–717. doi:10.1038/ng.377
Lai, Y., Zhang, F., Nayak, T. K., Modarres, R., Lee, N. H., and McCaffrey, T. A. (2014). Concordant Integrative Gene Set Enrichment Analysis of Multiple Large-Scale Two-Sample Expression Data Sets. BMC Genomics 15 (Suppl. 1), S6. doi:10.1186/1471-2164-15-S1-S6
Lee, C., Scherr, H. M., and Wallingford, J. B. (2007). Shroom Family Proteins Regulate γ-Tubulin Distribution and Microtubule Architecture during Epithelial Cell Shape Change. Development 134 (7), 1431–1441. doi:10.1242/dev.02828
Lei, H. H., Perneger, T. V., Klag, M. J., Whelton, P. K., and Coresh, J. (1998). Familial Aggregation of Renal Disease in a Population-Based Case-Control Study. J. Am. Soc. Nephrol. 9 (7), 1270–1276. doi:10.1681/asn.v971270
Levey, A. S., Atkins, R., Coresh, J., Cohen, E. P., Collins, A. J., Eckardt, K.-U., et al. (2007). Chronic Kidney Disease as a Global Public Health Problem: Approaches and Initiatives - a Position Statement from Kidney Disease Improving Global Outcomes. Kidney Int. 72 (3), 247–259. doi:10.1038/sj.ki.5002343
Liu, C.-T., Garnaas, M. K., Tin, A., Kottgen, A., Franceschini, N., Peralta, C. A., et al. (2011). Genetic Association for Renal Traits Among Participants of African Ancestry Reveals New Loci for Renal Function. Plos Genet. 7 (9), e1002264. doi:10.1371/journal.pgen.1002264
Lupas, A. N., and Gruber, M. (2005). The Structure of α-Helical Coiled Coils. Adv. Protein Chem. 70, 37–38. doi:10.1016/S0065-3233(05)70003-6
Mehta, N. N. (2011). Large-scale Association Analysis Identifies 13 New Susceptibility Loci for Coronary Artery Disease. Circ. Cardiovasc. Genet. 4 (3), 327–329. doi:10.1161/CIRCGENETICS.111.960443
Meierhofer, D., Halbach, M., Şen, N. E., Gispert, S., and Auburger, G. (2016). Ataxin-2 (Atxn2)-Knock-Out Mice Show Branched Chain Amino Acids and Fatty Acids Pathway Alterations. Mol. Cell Proteomics 15 (5), 1728–1739. doi:10.1074/mcp.M115.056770
Menon, M. C., Chuang, P. Y., Li, Z., Wei, C., Zhang, W., Luan, Y., et al. (2015). Intronic Locus Determines SHROOM3 Expression and Potentiates Renal Allograft Fibrosis. J. Clin. Invest. 125 (1), 208–221. doi:10.1172/JCI76902
Nishimura, T., and Takeichi, M. (2008). Shroom3-mediated Recruitment of Rho Kinases to the Apical Cell Junctions Regulates Epithelial and Neuroepithelial Planar Remodeling. Development 135 (8), 1493–1502. doi:10.1242/dev.019646
Onopiuk, A., Tokarzewicz, A., and Gorodkiewicz, E. (2015). Cystatin C. Adv. Clin. Chem. 68, 57–69. doi:10.1016/bs.acc.2014.11.007
Purcell, S., Neale, B., Todd-Brown, K., Thomas, L., Ferreira, M. A. R., Bender, D., et al. (2007). PLINK: A Tool Set for Whole-Genome Association and Population-Based Linkage Analyses. Am. J. Hum. Genet. 81 (3), 559–575. doi:10.1086/519795
Sachs, N., and Sonnenberg, A. (2013). Cell-Matrix Adhesion of Podocytes in Physiology and Disease. Nat. Rev. Nephrol. 9 (4), 200–210. doi:10.1038/nrneph.2012.291
Sarnak, M. J., Katz, R., Fried, L. F., Siscovick, D., Kestenbaum, B., Seliger, S., et al. (2008). Cystatin C and Aging success. Arch. Intern. Med. 168 (2), 147–153. doi:10.1001/archinternmed.2007.40
Spoto, B., Pisano, A., and Zoccali, C. (2016). Insulin Resistance in Chronic Kidney Disease: A Systematic Review. Am. J. Physiology-Renal Physiol. 311 (6), F1087–F1108. doi:10.1152/ajprenal.00340.2016
Stevens, L. A., Li, S., Wang, C., Huang, C., Becker, B. N., Bomback, A. S., et al. (2010). Prevalence of CKD and Comorbid Illness in Elderly Patients in the United States: Results from the Kidney Early Evaluation Program (KEEP). Am. J. Kidney Dis. 55 (3 Suppl. 2), S23–S33. doi:10.1053/j.ajkd.2009.09.035
Takaki, S., Morita, H., Tezuka, Y., and Takatsu, K. (2002). Enhanced Hematopoiesis by Hematopoietic Progenitor Cells Lacking Intracellular Adaptor Protein, Lnk. J. Exp. Med. 195 (2), 151–160. doi:10.1084/jem.20011170
Uruska, A., Araszkiewicz, A., Zozulinska-Ziolkiewicz, D., Wegner, M., Grzelka, A., and Wierusz-Wysocka, B. (2014). Does Serum Cystatin C Level Reflect Insulin Resistance in Patients with Type 1 Diabetes? Clin. Biochem. 47 (13-14), 1235–1238. doi:10.1016/j.clinbiochem.2014.06.014
van der Laan, S. W., Fall, T., Soumaré, A., Teumer, A., Sedaghat, S., Baumert, J., et al. (2016). Cystatin C and Cardiovascular Disease: A Mendelian Randomization Study. J. Am. Coll. Cardiol. 68 (9), 934–945. doi:10.1016/j.jacc.2016.05.092
Velazquez, L., Cheng, A. M., Fleming, H. E., Furlonger, C., Vesely, S., Bernstein, A., et al. (2002). Cytokine Signaling and Hematopoietic Homeostasis Are Disrupted in Lnk-Deficient Mice. J. Exp. Med. 195 (12), 1599–1611. doi:10.1084/jem.20011883
Wang, K., Li, M., and Bucan, M. (2007). Pathway-Based Approaches for Analysis of Genomewide Association Studies. Am. J. Hum. Genet. 81 (6), 1278–1283. doi:10.1086/522374
Welsh, S., Peakman, T., Sheard, S., and Almond, R. (2017). Comparison of DNA Quantification Methodology Used in the DNA Extraction Protocol for the UK Biobank Cohort. BMC Genomics 18 (1), 26. doi:10.1186/s12864-016-3391-x
Yeo, N. C., O’Meara, C. C., Bonomo, J. A., Veth, K. N., Tomar, R., Flister, M. J., et al. (2015). Shroom3contributes to the Maintenance of the Glomerular Filtration Barrier Integrity. Genome Res. 25 (1), 57–65. doi:10.1101/gr.182881.114
Yurchenco, P. D. (2011). Basement Membranes: Cell Scaffoldings and Signaling Platforms. Cold Spring Harbor Perspect. Biol. 3 (2), a004911. doi:10.1101/cshperspect.a004911
Keywords: genome wide association, pathway association studies, genetics, United Kingdom biobank, cystatin C
Citation: Jiao H, Zhang M, Zhang Y, Wang Y and Li W-D (2021) Pathway Association Studies Reveal Gene Loci and Pathway Networks that Associated With Plasma Cystatin C Levels. Front. Genet. 12:711155. doi: 10.3389/fgene.2021.711155
Received: 18 May 2021; Accepted: 09 November 2021;
Published: 25 November 2021.
Edited by:
Maria G. Stathopoulou, Institut National de la Santé et de la Recherche Médicale (INSERM), France.Reviewed by:
Zhipeng Liu, Purdue University, United StatesAlessandro Gialluisi, Istituto Neurologico Mediterraneo Neuromed (IRCCS), Italy
Copyright © 2021 Jiao, Zhang, Zhang, Wang and Li. This is an open-access article distributed under the terms of the Creative Commons Attribution License (CC BY). The use, distribution or reproduction in other forums is permitted, provided the original author(s) and the copyright owner(s) are credited and that the original publication in this journal is cited, in accordance with accepted academic practice. No use, distribution or reproduction is permitted which does not comply with these terms.
*Correspondence: Yaogang Wang, WWFvZ2FuZ1dBTkdAdG11LmVkdS5jbg==; Wei-Dong Li, bGl3ZWlkb25nOThAdG11LmVkdS5jbg==
†These authors have contributed equally to this work.