 Lijun Shi*
 Yang LiQian LiuLongchao Zhang
 Ligang WangXin LiuHongmei GaoXinhua Hou
 Fuping ZhaoHua YanLixian Wang*
- Institute of Animal Science, Chinese Academy of Agricultural Sciences, Beijing, China
Sow milk production ability is an important limiting factor impacting suboptimal growth and the survival of piglets. Through pig genetic improvement, litter sizes have been increased. Larger litters need more suckling mammary glands, which results in increased milk from the lactating sow. Hence, there is much significance to exploring sow lactation performance. For milk production ability, it is not practical to directly measure the milk yield, we used litter weight gain (LWG) throughout sow lactation as an indicator. In this study, we estimated the heritability of LWG, namely, 0.18 ± 0.07. We then performed a GWAS, and detected seven significant SNPs, namely, Sus scrofa Chromosome (SSC) 2: ASGA0010040 (p = 7.73E-11); SSC2:MARC0029355 (p = 1.30E-08), SSC6: WU_10.2_6_65751151 (p = 1.32E-10), SSC7: MARC0058875 (p = 4.99E-09), SSC10: WU_10.2_10_49571394 (p = 6.79E-08), SSC11: M1GA0014659 (p = 1.19E-07), and SSC15: MARC0042106 (p = 1.16E-07). We performed the distribution of phenotypes corresponding to the genotypes of seven significant SNPs and showed that ASGA0010040, MARC0029355, MARC0058875, WU_10.2_10_49571394, M1GA0014659, and MARC0042106 had extreme phenotypic values that corresponded to the homozygous genotypes, while the intermediate values corresponded to the heterozygous genotypes. We screened for flanking regions ± 200 kb nearby the seven significant SNPs, and identified 38 genes in total. Among them, 28 of the candidates were involved in lactose metabolism, colostrum immunity, milk protein, and milk fat by functional enrichment analysis. Through the combined analysis between 28 candidate genes and transcriptome data of the sow mammary gland, we found nine commons (ANO3, MUC15, DISP3, FBXO6, CLCN6, HLA-DRA, SLA-DRB1, SLA-DQB1, and SLA-DQA1). Furthermore, by comparing the chromosome positions of the candidate genes with the quantitative trait locus (QTLs) as previously reported, a total of 17 genes were found to be within 0.86–94.02 Mb of the reported QTLs for sow milk production ability, in which, NAV2 was found to be located with 0.86 Mb of the QTL region ssc2: 40936355. In conclusion, we identified seven significant SNPs located on SSC2, 6, 7, 10, 11, and 15, and propose 28 candidate genes for the ability to produce milk in Yorkshire pigs, 10 of which were key candidates.
Introduction
The mammary gland is a ubiquitous morphological feature of mammals, and lactation is an essential process in mammalian reproduction, including the secretion of milk from mammary glands. For offspring, depending on milk is a key strategy to the life history of all mammals. During lactation, maintaining body growth and milk production for the dam is necessary, thus energy requirement is high. In the past few decades, genetic and management changes have occurred, and the modern sow is subject to additional challenges. Litter size is one of the most important factors affecting milk production in a sow (Eissen et al., 2000), and piglet survival after birth is negatively affected by increasing litter size (Wang et al., 2017). During this period, the litter size of pigs has increased and will continue as an important goal trait in pig breeding programs around the world (Spötter and Distl, 2006; Baxter et al., 2013). In general, larger litters need more suckle mammary glands, which results in increased milk from the lactating sow (Auldist et al., 1998). The survival of offspring can be enhanced by milk yield, which satisfies the immunological needs of offspring and assists in the endocrine maturation of neonates (Goldman, 2002). In response to greater suckling intensity, sows have to produce more milk to nurse more piglets (Auldist et al., 1998; Revell et al., 1998). Additionally, poor lactation traits lead to early culling, which affects the profitability of commercial producers. Hence, it is of economic importance to improve lactation performance in pigs, and it is necessary to include lactation traits in the breeding goals.
The genetic improvement of sow lactation performance is hindered due to the difficulty of collecting accurate phenotypes. Unlike dairy cattle, it is not possible to directly measure the sow milk yield. Different experimental methods have been proposed to measure pig milk production ability, such as the isotope dilution method (Pettigrew et al., 1987) and the weighsuckle-weigh method (Elsley, 1971). These methods are expensive, complicated, and labor-intensive, and are difficult to be implemented on a routine basis in a commercial herd. A simpler and more straightforward measurement for an increase in body weight of piglets during lactation has been reported and is considered as an indicator trait for milk production ability (Revell et al., 1998; Bergsma et al., 2008). In 2016, DM. Thekkoot et al. estimated the heritability of litter weight gain (LWG) as an indicator of lactation trait in Yorkshire and Landrace sows, namely 0.16–0.22 and 0.12–0.20, respectively (Thekkoot et al., 2016a).
A Genome-Wide Association Study (GWAS) is an effective strategy to examine the underlying genetics of complex traits (Goddard and Hayes, 2009). Many studies have identified candidate markers associated with important economic traits in pigs, such as meat quality (Falker-Gieske et al., 2019) and growth (Zhang et al., 2019). For LWG traits in Yorkshire sow lactation, the GWAS detects two quantitative trait locus (QTLs) on Sus scrofa Chromosome (SSC) 7 (126 and 101 Mb) (Thekkoot et al., 2016b).
Until now, there has been little known about the heritability and genomic prediction of sow milk production ability. In this study, we aimed to estimate the heritability of LWG of the sow during lactation, to perform a GWAS for proposing the single nucleotide polymorphisms (SNPs) and candidate genes, and to conduct the combined analysis with the reported swine mammary gland transcriptome data and GWAS data for further insights into the candidates involved in sow milk synthesis.
Materials and Methods
Animals and Phenotypic Data
In this study, a total of 985 Yorkshire sows involved in 96 sire families, were recorded between 2019 and 2020 in Shanxi and Liaoning Province, China. These sows were fed with the fodders prescribed by their farms, in which, the regular quarantine inspection was carried out. For each sow, only one production record was performed, and 985 individuals were involved in 1–8 parity.
As it was not practical to directly measure the milk production ability of sows, our study weighed all non-mummified piglets at birth, death, weaning, and at the time of fostering. This allowed us to quantify the exact weight gain of each piglet for each sow. We calculated the LWG for each sow by summing up the increase in weight of all piglets nursed by that sow and considered it as a potential indicator for milk production ability. The formula for calculating LWG was as follow:
Genetic Parameters Estimation for LWG
We estimated the genetic parameters of LWG with an animal model. The genetic parameters and estimated breeding values (EBV) were performed by the ASReml package as the following model:
where
Genotyping and Quality Control
Ear samples of the 985 Yorkshire sows were collected in farms. For each ear, DNA was isolated with a commercially available kit, Q1Aamp DNA Mini Kit (QIAGEN, Germany). In total, 985 sows were then genotyped with the GenSeek Genomic Profiler (GGP) Porcine 50K (50,697 SNPs, Illumina, San Diego, CA, United States).
With PLINK (Purcell et al., 2007), we removed the SNPs with minor allele frequencies < 0.01, and a deviation from Hardy-Weinberg equilibrium (HWF) p values < 0.001. A dataset containing 36,871 SNPs and 985 animals was used for further analysis. All SNP positions were annotated based on pig genome assembly Sscrofa 11.1. The genotype data used for GWAS was submitted to public repositories, and the DOI was 10.6084/m9. figshare.16545915 (https://figshare.com/s/edda38a1c99aa7ab7ae0).
Genome-Wide Association Study
We utilized the EBV of LWG as the dependent variable to perform GWAS by Fixed and random effect model Circulating Probability Unification (FarmCPU). FarmCPU is a multi-locus model that incorporates multiple markers simultaneously as covariates to partially remove the confounding effect between testing markers and kinship (Liu et al., 2016). A genome-wide Bonferroni correction threshold of 0.05/36,871 (i.e., 1.36E-06) was implemented to correct for multiple testing and assess the significance level for each SNP. The Manhattan and quantile-quantile (Q-Q) plots were drawn by R packages (http://cran.r-project.org/web/packages/gap/index.html).
In addition, we estimated the least square mean of sow LWG phenotypes for homozygous and heterozygous genotypes of the seven significant SNPs with standard error (SE) by SAS9.2 (SAS Institute, Cary, NC, United States).
Gene Contents and Functional Annotation
We used the BioMart in Ensembl database to retrieve candidate genes within 200 kb (Zhao et al., 2011) of significant SNPs based on the pig reference genome (Sscrofa11.1). To provide insight into the functional enrichment of candidate genes identified in this study, we performed gene ontology (GO) and Kyoto Encyclopedia of Genes and Genomes (KEGG) analysis with the KOBAS (http://kobas.cbi.pku.edu.cn/kobas3/genelist/) (Xie et al., 2011).
Combined Analysis With the Reported Transcriptome and GWAS Data
To further confirm the key candidates, we performed the combined analysis between the results of this study and reported transcriptome research of the sow mammary gland (Palombo et al., 2018).
Based on the gene location information in the Ensembl database (http://asia.ensembl.org/index.html) and reported GWAS, it was considered that the candidate genes located within 5 Mb to the peak of QTLs in the previous GWAS were promising candidates associated with the ability to produce milk.
Results
Descriptive Statistics and Heritability of LWG Trait
For 985 Yorkshire pigs, the average days of lactation were 19.13. We calculated the descriptive statistics of LWG throughout lactation: number sows ∼ 985, mean ∼ 51.65 kg, standard deviation ∼ 16.05, maximum ∼ 98.74 kg, and minimum ∼ 5.54 kg. Figure 1 shows the distribution of LWG, which indicated the data was normal.
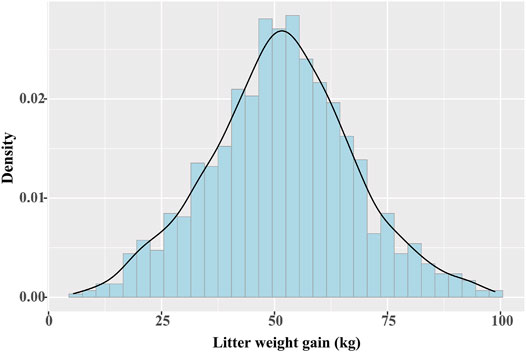
FIGURE 1. Distribution of milk production ability for 985 Yorkshire pigs.
We estimated the heritability of sow LWG: 0.18 ± 0.07, in which, the estimated additive variance was
GWAS and Identification of Candidate Genes
In this study, a total of 985 sows with the EBVs of LWG and genotypes were used for the GWAS by FarmCPU. The Manhattan and Q-Q plots are shown in Figures 2A,B, respectively. Seven genome-wide significant SNPs were identified: ASGA0010040 (p = 7.73E-11) and MARC0029355 (p = 1.30E-08) located on SSC 2, WU_10.2_6_65751151 (p = 1.32E-10) located on SSC6, MARC0058875 (p = 4.99E-09) located on SSC7, WU_10.2_10_49571394 (p = 6.79E-08) located on SSC10, M1GA0014659 (p = 1.19E-07) located on SSC11, and MARC0042106 (p = 1.16E-07) located on SSC15 (Table 1).
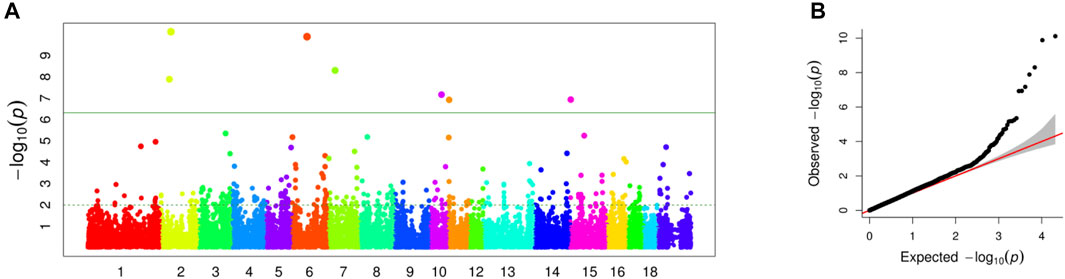
FIGURE 2. (A) Manhattan plot of association results for sow milk production ability. The green line indicated p = 1.36E-06. (B) Quantile-quantile plot of 36,871 SNPs in genome-wide association study for milk production ability.
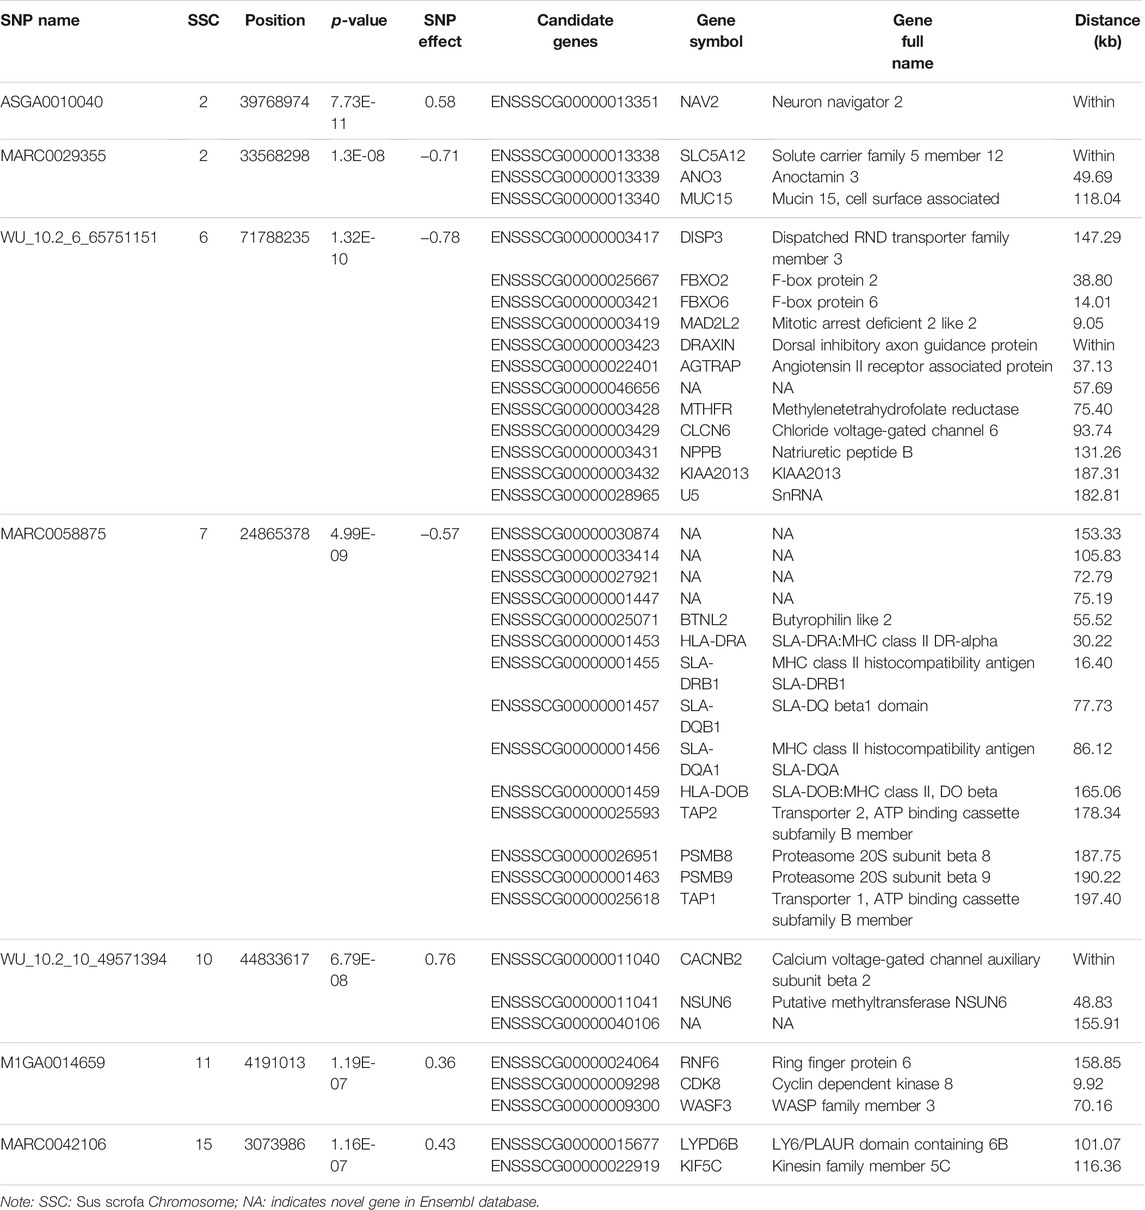
TABLE 1. Candidate genes associated with milk production ability by genome-wide association study
We performed the distribution of phenotypes for LWG by the genotype of the significant SNPs, the results of which can be seen in Figure 3. These data of ASGA0010040, MARC0029355, MARC0058875, WU_10.2_10_49571394, M1GA0014659, and MARC0042106 showed that the extreme phenotypic values corresponded to the homozygous genotypes, while the intermediate values corresponded to the heterozygous genotypes. The least-square mean (± SE) of the LWG by seven significant SNPs is shown in Table 2, which also presents the genotype and allele frequencies.
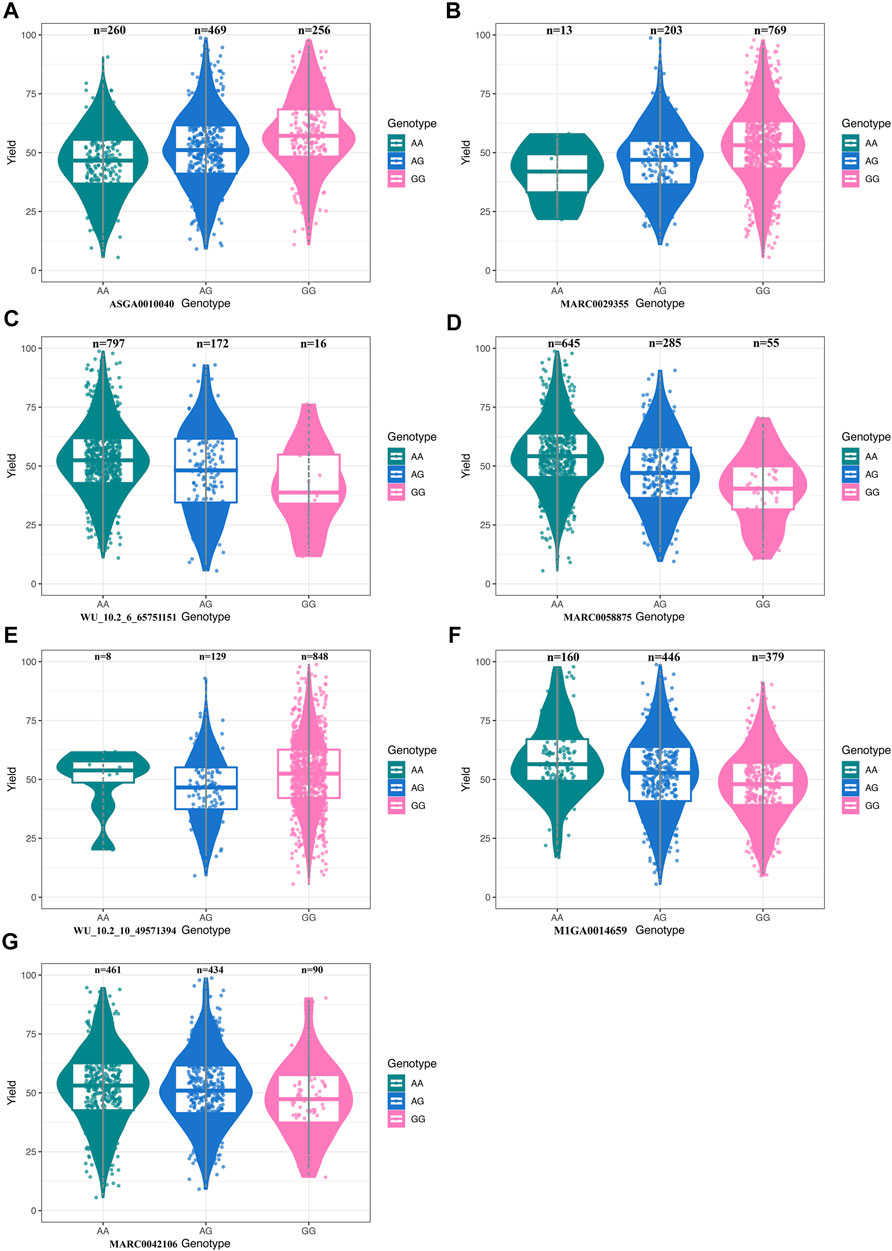
FIGURE 3. (A) Boxplot for litter weight gain (LWG) and the genotype at SNP ASGA0010040. (B) Boxplot for LWG and the genotype at SNP MARC0029355. (C) Boxplot for LWG and the genotype at SNP WU_10.2_6_65751151. (D) Boxplot for LWG and the genotype at SNP MARC0058875. (E) Boxplot for LWG and the genotype at SNP WU_10.2_10_49571394. (F) Boxplot for LWG and the genotype at SNP M1GA0014659. (G) Boxplot for LWG and the genotype at SNP MARC0042106.
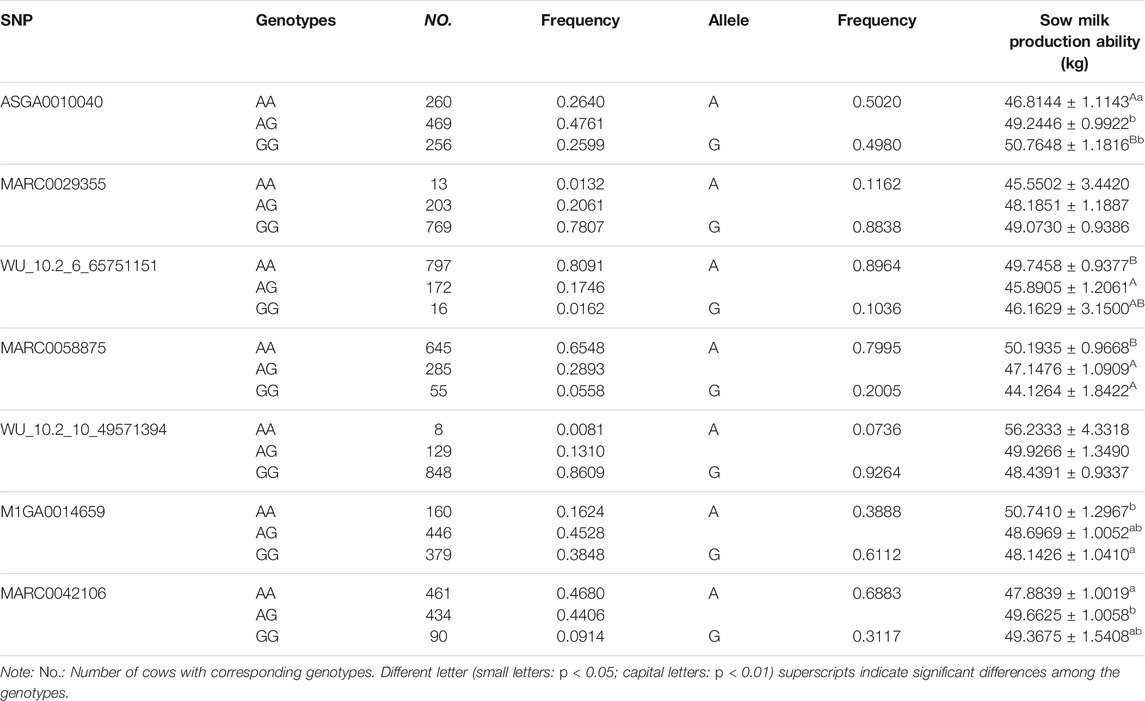
TABLE 2. Least square mean (± SE) of sow litter weight gain (LWG) by the genotype of seven significant SNPs.
Sows that were homozygous AA for ASGA0010040 showed significantly lower LWG than those that were homozygous GG (p < 0.01) and heterozygous AG (p < 0.05). The homozygous AA for MARC0058875 showed significantly larger LWG than those with homozygous GG (p < 0.01) and heterozygous AG (p < 0.01). The homozygous AA for M1GA0014659 showed significantly larger LWG than those with homozygous GG (p < 0.05). Sows that were homozygous AA for WU_10.2_6_65751151 and AG for MARC0042106 showed significantly larger milk production ability than those that were heterozygous AG (p < 0.01) and homozygous AA (p < 0.05), respectively. The SNPs MARC0029355 and WU_10.2_10_49571394 were not significant, while the homozygous GG for MARC0029355 and AA for WU_10.2_10_49571394 had obvious larger LWG than those with homozygous AA and GG, respectively. These results further confirmed that the seven SNPs were highly associated with sow milk production ability.
In addition, through screening for flanking regions ± 200 kb nearby seven significant SNPs, a total of 38 genes were identified in SSCs 2, 6, 7, 10, 11, and 15 (Table 1).
Functional Analysis of Candidate Genes
To investigate the functions of 38 genes, we performed GO and KEGG pathway analysis by KOBAS. In total, 142 GO and 51 KEGG enrichments were clustered with 28 genes (Supplementary Table S2). All these GO and KEGG enrichments were mainly related to cellular components and basic metabolism. In which, many GO and KEGG enrichments were involved in lactose metabolism, colostrum immunity, and milk protein and fat, such as tetrahydrofolate interconversion, thermogenesis, oxytocin signaling pathway, antigen processing and presentation, primary immunodeficiency, immune system process, glycoprotein catabolic process, cGMP-PKG signaling pathway, fat cell differentiation, and MAPK signaling pathway (Supplementary Table S2). Additionally, there were also many important metabolism enrichments clustered by these genes, including chloride channel activity, ubiquitin-mediated proteolysis, regulation of cell growth, carbon metabolism, metabolic pathways, ATP binding, and oxidation-reduction process (Supplementary Table S2). According to the results of the GO and KEGG enrichments, we considered the 28 genes as candidates for lactose metabolism, colostrum immunity, and milk protein and fat (Supplementary Table S2).
Combined Analysis With the Reported Transcriptome of Swine Mammary Gland and GWAS Data of Sow Milk Production Ability
To further detect insights into the association of 28 candidate genes with milk synthesis, we performed the combined analysis between this GWAS and reported transcriptome data (Palombo et al., 2018) to improve the accuracy of the selection of functional genes related to milk production in swine. In total, nine (ANO3, MUC15, DISP3, FBXO6, CLCN6, HLA-DRA, SLA-DRB1, SLA-DQB1, and SLA-DQA1) of 28 candidates were differentially expressed genes at days 14, 10, 6, and 2 before (−) parturition and day 1 after (+) parturition (Table 3).
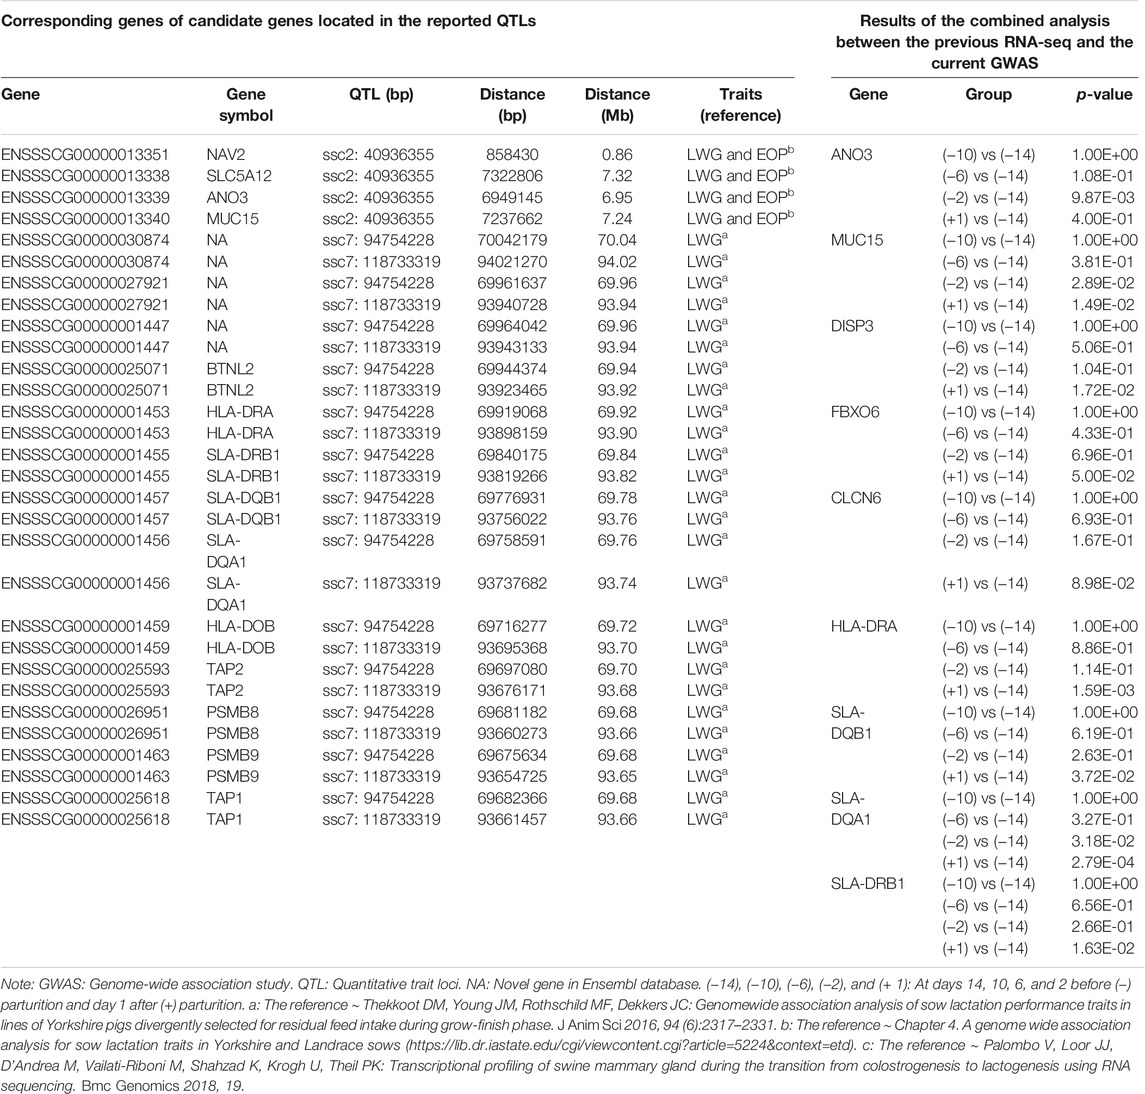
TABLE 3. Results of the combined analysis with the reported swine mammary gland transcriptome and milk production ability GWAS data.
We also compared the chromosome positions of 28 candidates with those of the QTLs from reported GWAS data for milk production ability traits, and a total of 17 genes were found to be within 0.86–94.02 Mb of the reported QTLs for milk yield (Table 3). In which, NAV2 was found to be located with 0.86 Mb of QTL region ssc2: 40936355 that was confirmed to have large genetic effects on sow milk yield (Table 3).
Discussion
In this study, we estimated the heritability and EBV of LWG and performed a GWAS to screen the candidate genes. We found 28 promising candidates involved in lactose metabolism, colostrum immunity, and milk protein and fat, such as tetrahydrofolate interconversion, primary immunodeficiency, glycoprotein catabolic process, fat cell differentiation, and MAPK signaling pathway.
Our heritability estimates for LWG were 0.18 and were consistent with those reported by DM. Thekkoot, who found the heritability of LWG ranged from 0.16 to 0.22 for Yorkshire and 0.12–0.20 for Landrace sows (Thekkoot et al., 2016a). We performed the GWAS and proposed seven significant SNPs associated with sow milk production ability. By the estimation of least-square means, ASGA0010040, MARC0058875, WU_10.2_10_49571394, M1GA0014659, and MARC0042106 were found that the extreme phenotypic values significantly corresponded to the homozygous genotypes. Sows that were genotyped for MARC0029355 and WU_10.2_10_49571394 had an obvious phenotype trend between two different homozygous, while not significant. This might be due to the high SE.
The lactation process includes initiation and maintenance, which are mainly regulated by hormone-nerve. Milk production is highly influenced by the sow’s body reserves at the start of lactation as well as the degree and type of body tissues that are mobilized during lactation (Costermans et al., 2020). Selection for high prolificacy in modern sows has led to increased litter size and a higher number of piglets weaned per litter, which results in greater metabolic demands during lactation, due to a higher milk production (Kemp et al., 2018). In our research, we found the candidate genes were enriched mainly in metabolism-related functions, especially in processes involving carbohydrates, ATP, lipids, and protein processes. In addition, we also found that these candidate genes were involved in colostrum immune processes and milk synthesis.
By the combined analysis with the swine mammary gland transcriptome data, nine genes were identified to be key candidates. By the combined analysis with the reported GWAS data, the NAV2 gene was found to be located with 0.86 Mb of the reported QTL region ssc2: 40936355. We comprehensively analyzed the results of functional enrichments, the swine mammary gland transcriptome, and previous GWAS data, which revealed that 28 candidate genes were associated with swine milk production, and 10 of them were key candidates.
For the 10 key candidate genes, NAV2 was mainly enriched into Na (+) channel (Mishra et al., 2015), nervous system development (Clagett-Dame et al., 2006; Yan et al., 2015; Pook et al., 2020), and delayed age of menopause among women (Bae et al., 2019). In all brain regions studied, the levels of NAV2 observed in late gestation and early postnatal life were the highest (Pook et al., 2020). It was reported that NAV2 was associated with hyperlipidemia (Sun et al., 2018a). ANO3 was associated with dystonia and motor neuron dysfunction (García-Hernández et al., 2021). The glycoprotein MUC15 was initially isolated from the bovine milk fat globule membrane and had a potential physiological function in signal transduction (Pallesen et al., 2008). MUC15 was involved in PI3K/AKT signaling pathway (Yue et al., 2020), and the localization of MUC15 was shown to be controlled by the ovarian hormones, oestrogen, and progesterone (Poon et al., 2014). DISP3 was a molecule between thyroid hormone and cholesterol metabolism, which used thyroid hormone to regulate serum cholesterol levels, thus participating in the metabolism and synthesis of various substances such as sugar, protein, fat, estradiol, and cortisol in the body (Zikova et al., 2009). DISP3 was also associated with the release of lipid-anchored secretory proteins (Katoh and Katoh, 2005). FBXO6 was related to ovarian cancer treatment (Ji et al., 2021) and glycoprotein quality control (Glenn et al., 2008). CLCN6 was involved in the renin-angiotensin-aldosterone system (Ji et al., 2017). SLA-DRA, SLA-DRB1, SLA-DQB1, and SLA-DQA1 were the SLA class Ⅱ genes involved in immune (Liu et al., 2015).
SLC5A12 was an active source of lactate transmembrane transporter, which is mainly involved in sodium ion transport (Martin et al., 2007; Sivaprakasam et al., 2017). FBXO2 and MAD2L2 were involved in ubiquitination processes (Li et al., 2018; Liu et al., 2021), which regulated the milk protein and fat metabolic mechanism (Liu et al., 2020a). DRAXIN was related to Akt, which could impact milk synthesis (Meli et al., 2015; Liu et al., 2020b). AGTRAP was reported to have a functional role in adipose metabolism (Ohki et al., 2017). MTHFR was involved in the metabolism of carbon, methionine, and tetrahydrofolic acid, and was related to the metabolism of milk folic acid (Page et al., 2019). MTHFR could play a role in milk protein synthesis through folic acid (Hou et al., 2015). Studies reported that MTHFR was an important candidate gene for sheep milk yield traits (Hou et al., 2015; An et al., 2016). NPPB and BTNL2 were involved in PI3K/AKT, Ca2+, K+, ATP, and immunity (Fioretti et al., 2004; Dolovcak et al., 2009; Sun et al., 2018b; Zhao et al., 2020). KIAA2013 was related to DNA methylation levels of newborns (Yeung et al., 2021). HLA-DOB, PSMB8, and TAP1 were involved in immune, protein and fat metabolism processes (Nagarajan et al., 2002; Niesporek et al., 2005; Garg, 2011; Kolbus et al., 2012; Arimochi et al., 2016; Naderi et al., 2016; Moussa et al., 2018; Yang et al., 2018; Chen et al., 2020). CACNB2 was involved in the regulation of ion membrane transport, which was related to calcium channel activity, MAPK, and oxytocin signaling pathways (Durairaj Pandian et al., 2019), and studies have shown that CACNB2 was involved in the formation of porcine marlin (Bertolini et al., 2018). NSUN6 protein might have an important function in broad aspects of embryonic development (Chi and Delgado-Olguín, 2013). KIF5C was involved in the regulation of mammalian phosphorylation (Padzik et al., 2016). As the substrate of protein kinase CK2, KIF5C cloud interacts with CK2alpha to become a negative factor of adipogenesis (Schäfer et al., 2008; Chen et al., 2017).
ENSSSCG00000030874, ENSSSCG00000027921, and ENSSSCG00000001447 genes were novel genes in the Ensembl database, while our functional analysis showed their roles in the immune system.
In conclusion, we identified seven SNPs significantly associated with sow milk production ability and propose 28 candidate genes. By integrated analysis of the biological functions, swine mammary gland transcriptome, and previous GWAS data, 10 genes (NAV2, ANO3, MUC15, DISP3, FBXO6, CLCN6, HLA-DRA, SLA-DQB1, HLA-DRB1, SLA-DQB1, and SLA-DQA1) were proposed to the key candidates. Our study provided a new insight for investigating the potential critical SNPs and genes involved in sow milk production, and the molecular information might be used to improve sow lactation performance.
Data Availability Statement
The datasets presented in this study can be found in online repositories. The names of the repository/repositories and accession number(s) can be found in the article/Supplementary Material.
Ethics Statement
The animal study was reviewed and approved by the Animal experiments were approved by the Science Research Department of the Institute of Animal Sciences, Chinese Academy of Agricultural Sciences (CAAS) (Beijing, China).
Author Contributions
LXW and LS conceived and designed the study. LS collected the DNA and phenotype samples with the help of YL, QL, LZ, LGW, XL, HG, XH, FZ, and HY. LS analyzed the data and prepared the manuscript. All authors read and approved the final manuscript.
Funding
This research was supported by the China Agriculture Research System of MOF and MARA, and Chinese Academy of Agricultural Sciences Foundation (20118/2020-YWF-YTS-8).
Conflict of Interest
The authors declare that the research was conducted in the absence of any commercial or financial relationships that could be construed as a potential conflict of interest.
Publisher’s Note
All claims expressed in this article are solely those of the authors and do not necessarily represent those of their affiliated organizations, or those of the publisher, the editors and the reviewers. Any product that may be evaluated in this article, or claim that may be made by its manufacturer, is not guaranteed or endorsed by the publisher.
Supplementary Material
The Supplementary Material for this article can be found online at: https://www.frontiersin.org/articles/10.3389/fgene.2021.724533/full#supplementary-material
References
An, X., Song, Y., Hou, J., Wang, S., Gao, K., and Cao, B. (2016). Identification of a Functional SNP in the 3′-UTR of CaprineMTHFRgene That Is Associated With Milk Protein Levels. Anim. Genet. 47, 499–503. doi:10.1111/age.12425
Arimochi, H., Sasaki, Y., Kitamura, A., and Yasutomo, K. (2016). Differentiation of Preadipocytes and Mature Adipocytes Requires PSMB8. Sci. Rep. 6, 26791. doi:10.1038/srep26791
Auldist, D. E., Morrish, L., Eason, P., and King, R. H. (1998). The Influence of Litter Size on Milk Production of Sows. Anim. Sci. 67, 333–337. doi:10.1017/s1357729800010109
Bae, H., Lunetta, K. L., Murabito, J. M., Andersen, S. L., Schupf, N., Perls, T., et al. (2019). Genetic Associations With Age of Menopause in Familial Longevity. Menopause. 26, 1204–1212. doi:10.1097/gme.0000000000001367
Baxter, E., Rutherford, K., D'Eath, R., Arnott, G., Turner, S., Sandøe, P., et al. (2013). The Welfare Implications of Large Litter Size in the Domestic Pig II: Management Factors. Anim. Welfare. 22, 219–238. doi:10.7120/09627286.22.2.219
Bergsma, R., Kanis, E., Verstegen, M. W. A., and Knol, E. F. (2008). Genetic Parameters and Predicted Selection Results for Maternal Traits Related to Lactation Efficiency in Sows. J. Anim. Sci. 86, 1067–1080. doi:10.2527/jas.2007-0165
Bertolini, F., Schiavo, G., Galimberti, G., Bovo, S., D’Andrea, M., Gallo, M., et al. (2018). Genome-wide Association Studies for Seven Production Traits Highlight Genomic Regions Useful to Dissect Dry-Cured Ham Quality and Production Traits in Duroc Heavy Pigs. Animal. 12, 1777–1784. doi:10.1017/s1751731118000757
Chen, M., Li, Y., Lv, H., Yin, P., Zhang, L., and Tang, P. (2020). Quantitative Proteomics and Reverse Engineer Analysis Identified Plasma Exosome Derived Protein Markers Related to Osteoporosis. J. Proteomics. 228, 103940. doi:10.1016/j.jprot.2020.103940
Chen, Q., Hao, W., Xiao, C., Wang, R., Xu, X., Lu, H., et al. (2017). SIRT6 Is Essential for Adipocyte Differentiation by Regulating Mitotic Clonal Expansion. Cel Rep. 18, 3155–3166. doi:10.1016/j.celrep.2017.03.006
Chi, L., and Delgado-Olguín, P. (2013). Expression of NOL1/NOP2/sun Domain (Nsun) RNA Methyltransferase Family Genes in Early Mouse Embryogenesis. Gene Expr. Patterns. 13, 319–327. doi:10.1016/j.gep.2013.06.003
Clagett-Dame, M., McNeill, E. M., and Muley, P. D. (2006). Role of All-Trans Retinoic Acid in Neurite Outgrowth and Axonal Elongation. J. Neurobiol. 66, 739–756. doi:10.1002/neu.20241
Costermans, N. G. J., Soede, N. M., Middelkoop, A., Laurenssen, B. F. A., Koopmanschap, R. E., Zak, L. J., et al. (2020). Influence of the Metabolic State During Lactation on Milk Production in Modern Sows. Animal. 14, 2543–2553. doi:10.1017/s1751731120001536
Dolovcak, S., Waldrop, S. L., Fitz, J. G., and Kilic, G. (2009). 5-Nitro-2-(3-Phenylpropylamino)Benzoic Acid (NPPB) Stimulates Cellular ATP Release Through Exocytosis of ATP-Enriched Vesicles. J. Biol. Chem. 284, 33894–33903. doi:10.1074/jbc.m109.046193
Durairaj Pandian, V., Giovannucci, D. R., Vazquez, G., and Kumarasamy, S. (2019). CACNB2 Is Associated With Aberrant RAS-MAPK Signaling in Hypertensive Dahl Salt-Sensitive Rats. Biochem. Biophysical Res. Commun. 513, 760–765. doi:10.1016/j.bbrc.2019.03.215
Eissen, J. J., Kanis, E., and Kemp, B. (2000). Sow Factors Affecting Voluntary Feed Intake during Lactation. Livestock Prod. Sci. 64, 147–165. doi:10.1016/s0301-6226(99)00153-0
Elsley, F. W. H. (1971). “Nutrition and Lactation in the Sow,” in Lactation. Editor I. R. Faulkner (London: Butterworths), 393–411.
Falker-Gieske, C., Blaj, I., Preuss, S., Bennewitz, J., Thaller, G., and Tetens, J. (2019). GWAS for Meat and Carcass Traits Using Imputed Sequence Level Genotypes in Pooled F2-Designs in Pigs. G3-Genes Genom Genet. 9, 2823–2834. doi:10.1534/g3.119.400452
Fioretti, B., Castigli, E., Calzuola, I., Harper, A. A., Franciolini, F., and Catacuzzeno, L. (2004). NPPB Block of the Intermediate-Conductance Ca2+-Activated K+ Channel. Eur. J. Pharmacol. 497, 1–6. doi:10.1016/j.ejphar.2004.06.034
García-Hernández, J. L., Corchete, L. A., Marcos-Alcalde, Í., Gómez-Puertas, P., Fons, C., and Lazo, P. A. (2021). Pathogenic Convergence of CNVs in Genes Functionally Associated to a Severe Neuromotor Developmental Delay Syndrome. Hum. Genomics. 15, 11. doi:10.1186/s40246-021-00309-4
Garg, A. (2011). Lipodystrophies: Genetic and Acquired Body Fat Disorders. J. Clin. Endocr. Metab. 96, 3313–3325. doi:10.1210/jc.2011-1159
Glenn, K. A., Nelson, R. F., Wen, H. M., Mallinger, A. J., and Paulson, H. L. (2008). Diversity in Tissue Expression, Substrate Binding, and SCF Complex Formation for a Lectin Family of Ubiquitin Ligases. J. Biol. Chem. 283, 12717–12729. doi:10.1074/jbc.m709508200
Goddard, M. E., and Hayes, B. J. (2009). Mapping Genes for Complex Traits in Domestic Animals and Their Use in Breeding Programmes. Nat. Rev. Genet. 10, 381–391. doi:10.1038/nrg2575
Goldman, A. S. (2002). Evolution of the Mammary Gland Defense System and the Ontogeny of the Immune System. J. Mammary Gland Biol. Neoplasia. 7, 277–289. doi:10.1023/a:1022852700266
Hou, J., An, X., Song, Y., Gao, T., Lei, Y., and Cao, B. (2015). Two Mutations in the Caprine MTHFR 3'UTR Regulated by MicroRNAs Are Associated With Milk Production Traits. PLoS One. 10, e0133015. doi:10.1371/journal.pone.0133015
Ji, L.-D., Li, J.-Y., Yao, B.-B., Cai, X.-B., Shen, Q.-J., and Xu, J. (2017). Are Genetic Polymorphisms in the Renin-Angiotensin-Aldosterone System Associated With Essential Hypertension? Evidence From Genome-Wide Association Studies. J. Hum. Hypertens. 31, 695–698. doi:10.1038/jhh.2017.29
Ji, M., Zhao, Z., Li, Y., Xu, P., Shi, J., Li, Z., et al. (2021). FBXO6-mediated RNASET2 Ubiquitination and Degradation Governs the Development of Ovarian Cancer. Cell Death Dis. 12, 317. doi:10.1038/s41419-021-03580-4
Katoh, Y., and Katoh, M. (2005). Identification and Characterization of DISP3 Gene In Silico. Int. J. Oncol. 26, 551–556. doi:10.3892/ijo.26.2.551
Kemp, B., Da Silva, C. L. A., and Soede, N. M. (2018). Recent Advances in Pig Reproduction: Focus on Impact of Genetic Selection for Female Fertility. Reprod. Dom Anim. 53 (Suppl. 2), 28–36. doi:10.1111/rda.13264
Kolbus, D., Ljungcrantz, I., Söderberg, I., Alm, R., Björkbacka, H., Nilsson, J., et al. (2012). TAP1-Deficiency Does Not Alter Atherosclerosis Development in Apoe−/− Mice. PLoS One. 7, e33932. doi:10.1371/journal.pone.0033932
Li, Y., Li, L., Chen, M., Yu, X., Gu, Z., Qiu, H., et al. (2018). MAD2L2 Inhibits Colorectal Cancer Growth by Promoting NCOA3 Ubiquitination and Degradation. Mol. Oncol. 12, 391–405. doi:10.1002/1878-0261.12173
Liu, L. L., Guo, A. W., Li, Q., Wu, P. F., Yang, Y., Chen, F. F., et al. (2020a). The Regulation of Ubiquitination in Milk Fat Synthesis in Bovine. Yi Chuan. 42, 548–555. doi:10.16288/j.yczz.20-037
Liu, Y., Hou, J., Zhang, M., Seleh‐Zo, E., Wang, J., Cao, B., et al. (2020b). circ‐016910 Sponges miR‐574‐5p to Regulate Cell Physiology and Milk Synthesis via MAPK and PI3K/AKT-mTOR Pathways in GMECs. J. Cel Physiol 235, 4198–4216. doi:10.1002/jcp.29370
Liu, X., Huang, M., Fan, B., Buckler, E. S., and Zhang, Z. (2016). Iterative Usage of Fixed and Random Effect Models for Powerful and Efficient Genome-Wide Association Studies. Plos Genet. 12, e1005767. doi:10.1371/journal.pgen.1005767
Liu, Y., Pan, B., Qu, W., Cao, Y., Li, J., and Zhao, H. (2021). Systematic Analysis of the Expression and Prognosis Relevance of FBXO Family Reveals the Significance of FBXO1 in Human Breast Cancer. Cancer Cel Int. 21, 130. doi:10.1186/s12935-021-01833-y
Liu, Z. Z., Xia, J. H., Xin, L. L., Wang, Z. G., Qian, L., Wu, S. G., et al. (2015). Swine Leukocyte Antigen Class II Genes (SLA-DRA, SLA-DRB1, SLA-DQA, SLA-DQB1) Polymorphism and Genotyping in Guizhou Minipigs. Genet. Mol. Res. 14, 15256–15266. doi:10.4238/2015.november.30.1
Martin, P. M., Dun, Y., Mysona, B., Ananth, S., Roon, P., Smith, S. B., et al. (2007). Expression of the Sodium-Coupled Monocarboxylate Transporters SMCT1 (SLC5A8) and SMCT2 (SLC5A12) in Retina. Invest. Ophthalmol. Vis. Sci. 48, 3356–3363. doi:10.1167/iovs.06-0888
Meli, R., Weisová, P., and Propst, F. (2015). Repulsive Axon Guidance by Draxin Is Mediated by Protein Kinase B (Akt), Glycogen Synthase Kinase-3β (GSK-3β) and Microtubule-Associated Protein 1B. PLoS One. 10, e0119524. doi:10.1371/journal.pone.0119524
Mishra, S., Reznikov, V., Maltsev, V. A., Undrovinas, N. A., Sabbah, H. N., and Undrovinas, A. (2015). Contribution of Sodium Channel Neuronal Isoform Nav1.1 to Late Sodium Current in Ventricular Myocytes From Failing Hearts. J. Physiol. 593, 1409–1427. doi:10.1113/jphysiol.2014.278259
Moussa, E. M., Huang, H., Thézénas, M. L., Fischer, R., Ramaprasad, A., Sisay-Joof, F., et al. (2018). Proteomic Profiling of the Plasma of Gambian Children With Cerebral Malaria. Malar. J. 17, 337. doi:10.1186/s12936-018-2487-y
Naderi, M., Hashemi, M., and Amininia, S. (2016). Association of TAP1 and TAP2 Gene Polymorphisms with Susceptibility to Pulmonary Tuberculosis. Iran J. Allergy Asthma Immunol. 15, 62–68.
Nagarajan, U. M., Lochamy, J., Chen, X., Beresford, G. W., Nilsen, R., Jensen, P. E., et al. (2002). Class II Transactivator Is Required for Maximal Expression of HLA-DOB in B Cells. J. Immunol. 168, 1780–1786. doi:10.4049/jimmunol.168.4.1780
Niesporek, S., Meyer, C. G., Kremsner, P. G., and May, J. (2005). Polymorphisms of Transporter Associated with Antigen Processing Type 1 (TAP1), Proteasome Subunit Beta Type 9 (PSMB9) and Their Common Promoter in African Children with Different Manifestations of Malaria. Int. J. Immunogenet. 32, 7–11. doi:10.1111/j.1744-313x.2005.00484.x
Ohki, K., Wakui, H., Azushima, K., Uneda, K., Haku, S., Kobayashi, R., et al. (2017). ATRAP Expression in Brown Adipose Tissue Does Not Influence the Development of Diet-Induced Metabolic Disorders in Mice. Int. J. Mol. Sci. 18, 676. doi:10.3390/ijms18030676
Padzik, A., Deshpande, P., Hollos, P., Franker, M., Rannikko, E. H., Cai, D., et al. (2016). KIF5C S176 Phosphorylation Regulates Microtubule Binding and Transport Efficiency in Mammalian Neurons. Front. Cel. Neurosci. 10, 57. doi:10.3389/fncel.2016.00057
Page, R., Wong, A., Arbuckle, T. E., and MacFarlane, A. J. (2019). The MTHFR 677C>T Polymorphism Is Associated With Unmetabolized Folic Acid in Breast Milk in a Cohort of Canadian Women. Am. J. Clin. Nutr. 110, 401–409. doi:10.1093/ajcn/nqz056
Pallesen, L. T., Pedersen, L. R. L., Petersen, T. E., Knudsen, C. R., and Rasmussen, J. T. (2008). Characterization of Human Mucin (MUC15) and Identification of Ovine and Caprine Orthologs. J. Dairy Sci. 91, 4477–4483. doi:10.3168/jds.2008-1204
Palombo, V., Loor, J. J., D'Andrea, M., Vailati-Riboni, M., Shahzad, K., Krogh, U., et al. (2018). Transcriptional Profiling of Swine Mammary Gland During the Transition from Colostrogenesis to Lactogenesis Using RNA Sequencing. Bmc Genomics. 19, 322. doi:10.1186/s12864-018-4719-5
Pettigrew, J. E., Cornelius, S. G., Moser, R. L., and Sower, A. F. (1987). A Refinement and Evaluation of the Isotope Dilution Method for Estimating Milk Intake by Piglets. Livestock Prod. Sci. 16, 163–174. doi:10.1016/0301-6226(87)90017-0
Pook, C., Ahrens, J. M., and Clagett-Dame, M. (2020). Expression Pattern of Nav2 in the Murine CNS With Development. Gene Expr. Patterns. 35, 119099. doi:10.1016/j.gep.2020.119099
Poon, C. E., Lecce, L., Day, M. L., and Murphy, C. R. (2014). Mucin 15 Is Lost but Mucin 13 Remains in Uterine Luminal Epithelial Cells and the Blastocyst at the Time of Implantation in the Rat. Reprod. Fertil. Dev. 26, 421–431. doi:10.1071/rd12313
Purcell, S., Neale, B., Todd-Brown, K., Thomas, L., Ferreira, M. A. R., Bender, D., et al. (2007). PLINK: A Tool Set for Whole-Genome Association and Population-Based Linkage Analyses. Am. J. Hum. Genet. 81, 559–575. doi:10.1086/519795
Revell, D. K., Williams, I. H., Mullan, B. P., Ranford, J. L., and Smits, R. J. (1998). Body Composition at Farrowing and Nutrition during Lactation Affect the Performance of Primiparous Sows: II. Milk Composition, Milk Yield, and Pig Growth. J. Anim. Sci. 76, 1738–1743. doi:10.2527/1998.7671738x
Schäfer, B., Götz, C., and Montenarh, M. (2008). The Kinesin I Family Member KIF5C Is a Novel Substrate for Protein Kinase CK2. Biochem. Biophysical Res. Commun. 375, 179–183. doi:10.1016/j.bbrc.2008.07.107
Sivaprakasam, S., Bhutia, Y. D., Yang, S., and Ganapathy, V. (2017). Short‐Chain Fatty Acid Transporters: Role in Colonic Homeostasis. Compr. Physiol. 8, 299–314. doi:10.1002/cphy.c170014
Spötter, A., and Distl, O. (2006). Genetic Approaches to the Improvement of Fertility Traits in the Pig. Vet. J. 172, 234–247. doi:10.1016/j.tvjl.2005.11.013
Sun, L., Dong, Y., Zhao, J., Yin, Y., Tong, B., Zheng, Y., et al. (2018a). NPPB Modulates Apoptosis, Proliferation, Migration and Extracellular Matrix Synthesis of Conjunctival Fibroblasts by Inhibiting PI3K/AKT Signaling. Int. J. Mol. Med. 41, 1331–1338. doi:10.3892/ijmm.2017.3323
Sun, R., Weng, H., Men, R., Xia, X., Chong, K. C., Wu, W. K. K., et al. (2018b). Gene-methylation Epistatic Analyses via the W-Test Identifies Enriched Signals of Neuronal Genes in Patients Undergoing Lipid-Control Treatment. BMC Proc. 12, 53. doi:10.1186/s12919-018-0143-8
Thekkoot, D. M., Kemp, R. A., Rothschild, M. F., Plastow, G. S., and Dekkers, J. C. M. (2016). Estimation of Genetic Parameters for Traits Associated with Reproduction, Lactation, and Efficiency in Sows1. J. Anim. Sci. 94, 4516–4529. doi:10.2527/jas.2015-0255
Thekkoot, D. M., Young, J. M., Rothschild, M. F., and Dekkers, J. C. M. (2016). Genomewide Association Analysis of Sow Lactation Performance Traits in Lines of Yorkshire Pigs Divergently Selected for Residual Feed Intake During Grow-Finish Phase1. J. Anim. Sci. 94, 2317–2331. doi:10.2527/jas.2015-0258
Wang, Y., Ding, X., Tan, Z., Ning, C., Xing, K., Yang, T., et al. (2017). Genome-Wide Association Study of Piglet Uniformity and Farrowing Interval. Front. Genet. 8, 194. doi:10.3389/fgene.2017.00194
Xie, C., Mao, X., Huang, J., Ding, Y., Wu, J., Dong, S., et al. (2011). KOBAS 2.0: a Web Server for Annotation and Identification of Enriched Pathways and Diseases. Nucleic Acids Res. 39, W316–W322. doi:10.1093/nar/gkr483
Yan, J., Kim, S., Nho, K., Chen, R., Risacher, S. L., Moore, J. H., et al. (2015). Hippocampal Transcriptome-Guided Genetic Analysis of Correlated Episodic Memory Phenotypes in Alzheimer's Disease. Front. Genet. 6, 117. doi:10.3389/fgene.2015.00117
Yang, B.-y., Song, J.-w., Sun, H.-z., Xing, J.-c., Yang, Z.-h., Wei, C.-y., et al. (2018). PSMB8 Regulates Glioma Cell Migration, Proliferation, and Apoptosis through Modulating ERK1/2 and PI3K/AKT Signaling Pathways. Biomed. Pharmacother. 100, 205–212. doi:10.1016/j.biopha.2018.01.170
Yeung, E. H., Mendola, P., Sundaram, R., Zeng, X., Guan, W., Tsai, M. Y., et al. (2021). Conception by Fertility Treatment and Offspring Deoxyribonucleic Acid Methylation. Fertil. Sterility. 116, 493–504. doi:10.1016/j.fertnstert.2021.03.011
Yue, Y., Hui, K., Wu, S., Zhang, M., Que, T., Gu, Y., et al. (2020). MUC15 Inhibits Cancer Metastasis via PI3K/AKT Signaling in Renal Cell Carcinoma. Cel Death Dis. 11, 336. doi:10.1038/s41419-020-2518-9
Zhang, Y., Zhang, J., Gong, H., Cui, L., Zhang, W., Ma, J., et al. (2019). Genetic Correlation of Fatty Acid Composition With Growth, Carcass, Fat Deposition and Meat Quality Traits Based on GWAS Data in Six Pig Populations. Meat Sci. 150, 47–55. doi:10.1016/j.meatsci.2018.12.008
Zhao, K., Tung, C.-W., Eizenga, G. C., Wright, M. H., Ali, M. L., Price, A. H., et al. (2011). Genome-wide Association Mapping Reveals a Rich Genetic Architecture of Complex Traits in Oryza Sativa. Nat. Commun. 2, 467. doi:10.1038/ncomms1467
Zhao, Y., Zheng, Q., and Jin, L. (2020). The Role of B7 Family Molecules in Maternal-Fetal Immunity. Front. Immunol. 11, 458. doi:10.3389/fimmu.2020.00458
Keywords: Yorkshire pig, litter weight gain, GWAS, SNP, candidate gene
Citation: Shi L, Li Y, Liu Q, Zhang L, Wang L, Liu X, Gao H, Hou X, Zhao F, Yan H and Wang L (2021) Identification of SNPs and Candidate Genes for Milk Production Ability in Yorkshire Pigs. Front. Genet. 12:724533. doi: 10.3389/fgene.2021.724533
Received: 13 June 2021; Accepted: 22 September 2021;
Published: 05 October 2021.
Edited by:
Hasan Riaz, COMSATS Institute of Information Technology, PakistanReviewed by:
Hugo Oswaldo Toledo-Alvarado, National Autonomous University of Mexico, MexicoMuhammad Azhar, COMSATS University Islamabad—Sahiwal Campus, Pakistan
Copyright © 2021 Shi, Li, Liu, Zhang, Wang, Liu, Gao, Hou, Zhao, Yan and Wang. This is an open-access article distributed under the terms of the Creative Commons Attribution License (CC BY). The use, distribution or reproduction in other forums is permitted, provided the original author(s) and the copyright owner(s) are credited and that the original publication in this journal is cited, in accordance with accepted academic practice. No use, distribution or reproduction is permitted which does not comply with these terms.
*Correspondence: Lijun Shi, c2hpbGlqdW4wMUBjYWFzLmNu; Lixian Wang, aWFzd2x4QDI2My5uZXQ=