- 1Animal Biotechnology Division, ICAR-National Bureau of Animal Genetic Resources, Karnal, India
- 2Animal Biotechnology Center, ICAR-National Dairy Research Institute, Karnal, India
- 3DRDO-Defense Institute of High-altitude Research, Leh, India
- 4Department of Livestock Production Management, ICAR-National Dairy Research Institute, Karnal, India
To estimate gene expression in a reliable manner, quantitative real-time polymerase chain reaction data require normalisation using a panel of stably expressed reference genes (RGs). To date, information on an appropriate panel of RGs in cattle populations reared at cold arid high-altitude hypoxia and hot arid tropical normoxia environments is not available. Therefore, the present study was carried out to identify a panel of stably expressed RGs from 10 candidate genes (GAPDH, RPL4, EEF1A1, RPS9, HPRT1, UXT, HMBS, B2M, RPS15, and ACTB) in peripheral blood mononuclear cells (PBMCs) of cattle populations reared at cold arid high-altitude hypoxia and hot arid normoxia environments. Four different statistical algorithms: geNorm, NormFinder, BestKeeper, and RefFinder were used to assess the stability of these genes. A total of 30 blood samples were collected: six adult heifers each of Ladakhi (LAC) and Holstein Frisian crosses (HFX) and 4 Jersey (JYC) cows from cold arid high-altitude hypoxia environments (group I) and five adult heifers each of Sahiwal (SAC), Karan Fries (KFC), and Holstein Friesian (HFC) cows from hot arid normoxia environments (group II). Combined analysis of group I and group II resulted in identification of a panel of RGs like RPS9, RPS15, and GAPDH that could act as a useful resource to unravel the accurate transcriptional profile of PBMCs from diverse cattle populations adapted to distinct altitudes.
Introduction
India has been blessed with several cattle breeds of Bos indicus lineage adapted to various agro-climatic zones from high land to hot tropical regions. Leh-Ladakh, also known as a “COLD DESERT” is a part of the western Himalayan agro-climatic and high-altitude temperate sub-agro-climatic zone in India. Ladakh is situated at an altitude of 3,500–5,500 m with difficult terrain and harsh climate conditions such as extreme temperature (−40°C in winter and 35°C in summer), low humidity (25–40%), low precipitation (80–300 mm), and low oxygen level (nearly 60–70% of the oxygen concentration at sea level). In spite of harsh weather, this region is blessed with several unique livestock populations such as yak, cattle, horses, sheep, goat, donkey, and double-hump camel. Over thousands of years of the evolutionary process, these animals have developed the special ability to survive in cold and hypoxia environments prevalent in Ladakh. Amongst all the livestock species, the native cattle of Ladakh known as “Ladakhi cattle” are the major livestock species that play an important role in the agriculture economy of the region. The cattle from the Trans-Himalayan region of Ladakh are short in stature and well-adapted to the high-altitude environment. Based on morphometric data on 275 animals and genetic characterization using microsatellite markers (unpublished data), this cattle population was observed to be highly distinct from native cattle breeds adapted to other agroclimatic zones of India. Recently, our group was successful in delineating the distinct transcriptome signatures of peripheral blood mononuclear cells (PBMCs) of high-altitude-adapted Ladakhi cattle and tropically adapted Sahiwal cattle (Verma et al., 2018a; Verma et al., 2018b). In the last few years, the purity of Ladakhi cattle is believed to have declined due to widespread intermixing with Jersey cattle. However, considering the unique hypoxia-tolerant characteristics of Ladakhi cattle, preserving its purity will be a key for long-term conservation and sustainable utilization.
On the other hand, India has also been blessed with a huge native cattle genetic resource base which has adapted to hot and tropical conditions. For example, native cattle breeds like Sahiwal, Tharparkar, Rathi, Gir, Ongole etc. are known for their superior thermotolerance as compared to their exotic counterparts of the Bos taurus lineage. The superior cellular tolerance ability of PBMCs from native cattle has been shown in a few studies published by our group (Kishore et al., 2013; Kishore et al., 2014; Sharma et al., 2019) using PBMCs as the cellular model. However, native cattle breeds are also facing genetic dilution due to crossbreeding with exotic germplasm in order to enhance milk production. These native cattle populations that are adapted to distinct altitudes might have acquired a distinct gene pool during the course of the evolutionary process. Such genetic resources with remarkable adaptive traits could be an interesting resource to mine gene expression and the mechanism underlying changes associated with adaptation to cold arid and hot arid environments. It would be interesting to define the importance of various genes in conferring adaptation to cattle populations adapted to diverse altitudes through targeted gene expression analysis. Quantitative real-time polymerase chain reaction (qRT-PCR) has been widely employed to quantify the expression of target genes of interest in different tissues/cells exposed to a variety of experimental conditions. In spite of many of its advantages, this tool is prone to analytical variations arising due to differing amounts of starting material, pipetting errors, and differing efficiencies of RNA extraction and reverse transcription (Vandesompele et al., 2002; Huggett et al., 2005; Bustin et al., 2009). To overcome the limitations of experimental variation, the use of appropriate internal control genes (ICGs) or reference genes (RGs) to successfully normalise the RT-qPCR data has been reported in several studies (Bustin 2010; Castigliego et al., 2010; Crookenden et al., 2017; Die et al., 2017; Sang et al., 2018). The approach to identify a suitable panel of RGs during various experimental/physiological conditions has also been reported in different livestock species (Aggarwal et al., 2013; Kapila et al., 2013; Zhu et al., 2015; Jatav et al., 2016; Li et al., 2016; Kaur et al., 2018). However, to the best of our knowledge, no comparative data on suitable RGs are available for cattle populations reared at cold arid high-altitude and hot arid tropical regions. The present study was planned to identify a panel of stably expressed RGs in PBMCs of six cattle populations from the high-altitude cold arid region of Leh-Ladakh and hot arid tropical climate of India.
Materials and Methods
Ethics Statement and Animal Selection
The blood sampling of animals was performed in accordance with the relevant guidelines and regulations as approved by the Institutional Animal Ethics Committee (IAEC) of ICAR-National Bureau of Animal Genetics Resources (NBAGR), Karnal. The study has included three cattle populations from the cold arid high-altitude region of Leh-Ladakh, viz., Ladakhi cattle (native), Jersey cattle (exotic), and Frieswal cattle {Sahiwal x Holstein Frisian cross}, and three cattle populations from the hot dry and semi-arid condition of Haryana state, viz., Sahiwal cattle (native), Holstein Frisians cattle (exotic), and Karan Fries cattle {Tharparkar x Holstein Frisian}. Ladakhi cattle (LAC) are the native breed of the Bos indicus lineage and are naturally adapted to the high-altitude region of Ladakh. Jersey cattle (JYC) are of the Bos taurus lineage and originated from temperate regions, while Frieswal cattle (HFX) are a cross-bred cattle population. Both Jersey and Frieswal cattle are non-native to Leh-Ladakh and have been reared in limited organized farms in the region since the last 2 decades. Amongst the cattle populations selected from the hot semi-arid region, Sahiwal cattle (SAC) are a very popular native cattle breed of Bos indicus lineage and are known for their adaptation potential to hot dry and tropical conditions. Holstein Frisian cattle (HFC) are of Bos taurus lineage and are non-native to India. However, Holstein Frisian cattle have been widely used in India in various cross-breeding programmes to enhance milk production of local breeds. Karan Fries cattle (KFC) are a popular cross-breed that were developed several decades ago by crossing Tharparkar cattle (native) with Holstein Frisian. Therefore the study has included two populations of native cattle: one from high-altitude (Ladakhi cattle; LAC) and the other from hot arid tropical regions (Sahiwal cattle; SAC); and two populations of cross-breeds and two populations of exotic cattle from two extreme altitudes. The geographical coordinates of the sampling site representing the hot arid climate were latitude– 29° 3′ 56.7828″ N, and longitude 76° 2′ 25.7892″ E. The geographical coordinates of the sampling site from the high-altitude region of Ladakh were latitude– 34° 9′ 9.3168″ N, and longitude 77° 34′ 37.3764″ E. About 7–8 ml of whole blood samples was collected aseptically from the external jugular vein of the animals in sterile EDTA-coated vacutainer tubes.
In total, 30 blood samples were collected from adult heifers; five each of Sahiwal (SAC), Karan Fries (KFC), and Holstein Friesian (HFC) cows from the hot arid normoxia environment and 5 heifers each of Ladakhi (LAC), Holstein Frisian crosses (HFX), and Jersey (JYC) cows from the cold arid high-altitude hypoxia environment. The entire workflow of the qPCR experiment is depicted in Figure 1.
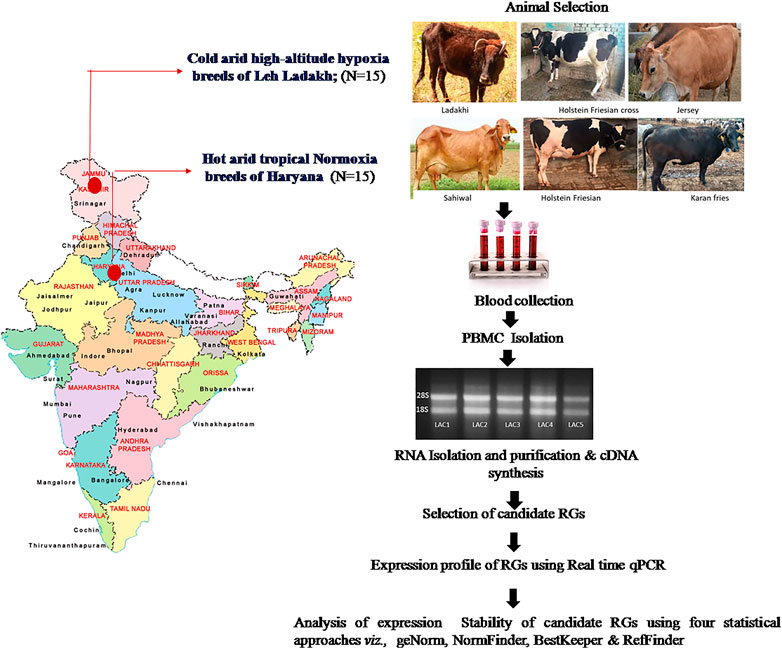
FIGURE 1. The entire workflow of the present study conducted using PBMCs of cattle breeds from cold arid high-altitude hypoxia and hot arid normoxia groups. The map of India in Figure 1 was created with the help of Smartdraw software- https://www.smartdraw.com).
Peripheral Blood Mononuclear Cells Isolation, RNA Extraction, and cDNA Synthesis
Immediately after collection, the blood samples were processed to isolate peripheral blood mononuclear cells (PBMCs) using the density gradient centrifugation method as described by Verma et al. (2018b). In brief, blood was diluted in a 1:1 ratio with 1 × PBS (Ca2+ and Mg2+ free; Hyclone, Utah) and was gently over laid on a Histopaque-1077 (Sigma-Aldrich Inc., United States) followed by centrifugation at 4000 RPM for 30 min at RT. After removing the buffy coat in a separate 15 ml tube, cells were treated with 2 ml of chilled RBC lysis buffer for 5 min at RT and washed twice with 1 × PBS (Ca2+ and Mg2+ free; Hyclone, Utah). Finally, the cells were suspended in 1.0 ml of ice cold Trizol reagent (Invitrogen, Carlsbad, California), homogenized, and stored at −80°C. Total RNA was extracted using Trizol reagent according to the manufacturer’s instructions (Invitrogen, Corp., CA, United States). The extracted RNA was further purified using RNeasy mini kit columns (Qiagen, Germany). To remove the traces of genomic DNA, rnase free DNase enzyme was used according to the manufacturer’s instructions (Qiagen, Germany). RNA concentration and purity were checked using a NanoDrop ND-1000 spectrophotometer (Thermo Scientific, United States) and Experion Bio-analyzer (Bio-Rad, United States). The OD260/OD280 absorption ratio for different samples varied from 1.92 to 2.10. The RNA integrity number (RIN) values for all purified RNA samples were in the satisfactory range (6.5–8.5). The RNA integrity of each sample was also confirmed by visualizing 28S and 18S ribosomal bands on 1.5% agarose gel. The cDNA was synthesized using a Revertaid First strand cDNA synthesis kit (Fermentas, United States) as described in our previous studies (Kishore et al., 2013; Verma et al., 2018b). Briefly, first strand cDNA was synthesized with 200 ng of purified RNA, oligo-dT (18) primer, dNTP mix, random primers, RiboLockRNase inhibitor, and M-MuLV reverse transcriptase supplied with RevertAid First Strand cDNA Synthesis (Thermo Scientific, CA, United States), using the program: 25°C for 5 min, 50°C for 60 min, and 70°C for 15 min. Before using them as templates for qPCR, each of the cDNA samples was diluted 1:4 (v:v) with DNase/RNase free water. The quality of 30 cDNAs was confirmed by amplifying the GAPDH gene using a similar protocol to that described for qPCR except for the final dissociation protocol. A small aliquot of amplified products for all the samples was run on 2.5% agarose gel to check the primer specificity and amplification quality.
Selection of Candidate Reference Genes and Real-Time Quantitative PCR Primers
In the present study, 10 candidate genes belonging to different functional groups were selected for evaluation as suitable RGs (Table 1). The candidate genes included in the study were; glyceraldehyde 3-phosphate (GAPDH), ribosomal protein L-4 (RPL4), eukaryotic elongation factor 1 alpha (EEF1A1), ribosomal protein S9 (RPS9), hypoxanthine guanine phosphoribosyl transferase 1 (HPRT1), ubiquitin expressed transcript (UXT), hydroxyl methylbilane (HMBS), beta 2-microglobulin (B2M), ribosomal protein S15 (RPS15), and beta actin (ACTB). The primers specific for these 10 RGs were available in the laboratory and have been utilized successfully in several of our previous studies (Kapila et al., 2013; Jatav et al., 2016; Kaur et al., 2018). The information about sequences, amplicon length, and annealing temperature for each primer pair are summarized in Table 1.
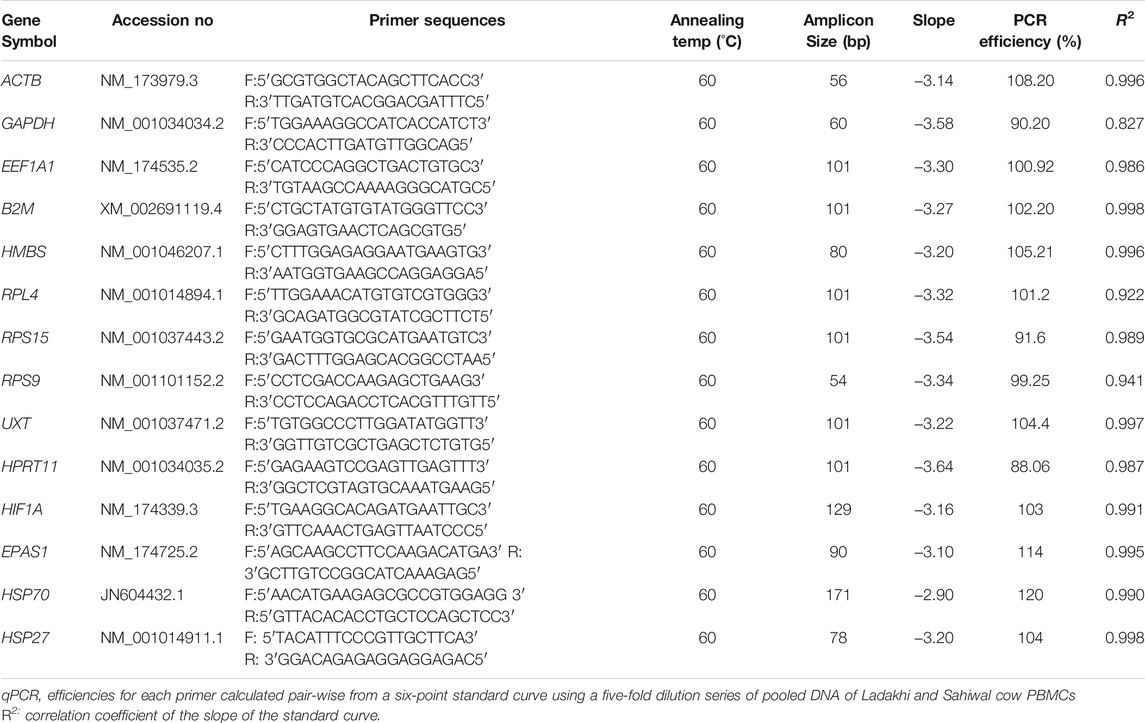
TABLE 1. Gene symbol, primer sequence, amplicon size, slope, PCR efficiency and (R2) of RGs for each evaluated RG.
Real-Time Quantitative PCR Reference Genes Transcripts
Quantitative PCR was performed in a 10 μL reaction volume containing 4 μl of diluted cDNA and 6 μl of master mix composed of 5 μL of 2X LightCycler 480 SYBR Green (Roche Life Science, Germany), 0.4 μL each of 10 μM forward and reverse primers, and 0.2 μL of DNase/RNase free water. Each qRT-PCR reaction was performed in duplicate to check the quality by assessing intra-assay variation. The amplification was carried out in a 96-well block using a LightCycler 480-II real-time PCR instrument (Roche Life Science, Germany) with the following conditions; 2 min at 50°C, 10 min at 95°C, 40 cycles of 15 s at 95°C (denaturation), and 1 min at 60°C (annealing + extension). In order to evaluate the quality of qPCR reactions in terms of nonspecific amplification and primer-dimer formation, a dissociation curve for each gene was obtained by increasing the temperature from 60°C to 95°C. A six-point relative standard curve was prepared for each gene by using five-fold serial dilutions of pooled cDNA samples in duplicate. The amplification specificity for each primer was checked by the presence of a single band of expected size on 2.5% agarose gel (Supplementary Figure S1), and also by observing the single melt curve peak after completion of qPCR (Supplementary Figure S2). The qPCR data for each gene were extracted using the “second derivative maximum” method (Rasmussen 2001) as computed by Light Cycler software 3.5 for subsequent analysis.
Analysis of Expression Stability of Candidate Reference Genes
The qPCR data recorded for each gene were subsequently analysed to evaluate the expression stability. Four statistical approaches, viz., geNorm (Vandesompele et al., 2002), NormFinder (Andersen et al., 2004), BestKeeper (Xu et al.,. 2016), and the RefFinder web tool (Xie et al., 2012) were used to calculate the expression stability and ranking of RGs in the high-altitude hypoxia cold arid group (LAC, JYC, and HFX) and normoxia hot arid group (SAC, KFC, and HFC). The Cq values of each RG were exported to an Excel work sheet and modified as per the requirement of the software. Like for creating an input file for geNorm and NormFinder analysis, the Cq values were first transformed into relative quantities by using formula 2−∆CT, in which ∆Cq = corresponding Cq value - minimum Cq value. geNorm calculated the expression stability of individual genes on the basis of the M value which indicates the stability in expression of a gene. The genes with smaller M values (<1.5) are considered to have higher expression stability (Xu et al., 2016). In addition, geNorm was also used to conduct pair-wise variation analysis (Vn/Vn+1) in order to select the optimal number of RGs to normalise the target gene expression data. The cut off value of Vn/Vn+1 < 0.15 was used to decide the optimal number of RGs to be employed for calculating the normalisation factor (Vandesompele et al., 2002). This analysis is based on the principal that the expression ratio of the two best RGs will always remain similar across samples. The NormFinder software calculated the stability values of each RG based on inter- and intra-group variations. Similar to geNorm, for Normfinder analysis, the CT values were first transformed into relative quantities. However, for Bestkeeper analysis, CT values were not transformed into relative quantities. The BestKeeper algorithm was used to calculate gene expression variation based on cycle threshold values (Cq), crossing point standard deviation [{SD (±CP)} <1], and coefficient of variance (CV [%CP]). In BestKeeper analysis, genes with low SD (<1), low CV, and high coefficient of correlation (r) are generally considered stably expressed and vice versa.
Finally, the RefFinder tool (https://www.heartcure.com.au/reffinder/) was also employed to estimate the overall ranking of the 10 RGs by assigning an appropriate weight to each gene (Xie et al., 2012). The RefFinder analysis integrates the outcome of geNorm, NormFinder, and BestKeeper tools to provide an overall final ranking of RGs.
Results
Primer Specificity, Amplification Efficiency, and Descriptive Statistics
This study evaluated the expression stability of 10 RGs (GAPDH, RPL4, EEF1A1, RPS9, HPRT1, UXT, HMBS, B2M, RPS15, and ACTB) in PBMCs of cattle types from cold arid high-altitude hypoxia and hot arid normoxia environments. The specificity of each primer pair was ascertained by the presence of the single specific amplicon of expected size on 2.5% agarose gel (Supplementary Figure S1). The melt curve plot of each RG showed a single peak suggesting the highly specific nature of primer pairs used (Supplementary Figure S2). The amplification efficiencies estimated from the six-point standard curve (generated from five-fold serial dilution of pooled cDNA) ranged from 88 to 110%. The slope values of the standard curve for different RGs ranged between −3.05 and −3.5 which was within the acceptable limit (−2.96 to −3.6). Based on the overall evaluation of the melt curve, amplification efficiencies, and slope values, it could be safely assumed that RT-qPCR data for each primer pair were of high quality (Table 1).
The average raw Cq values of individual RGs across all PBMCs in cold arid and hot arid groups (combined analysis) are summarized in Table 2. The average Cq values of individual RGs were quite variable and ranged from 17.66 (EEF1A1) to 27.86 (HMBS). On the basis of their average Ct scores, the 10 RGs were classified into group-I (abundantly expressed), group-II (moderately expressed), and group-III (least expressed). Group-1 included EEF1A1, B2M, RPS15, and RPL4 genes with a high expression level and average Cq scores of 17.66, 18.18, 19.35, and 19.68, respectively. Group-II included RPS9, GAPDH, and ACTB that displayed an intermediate expression level with average Cq scores of 20.33, 21.69, and 22.27, respectively. Group-III included UXT, HPRT1, and HMBS with the least expression and average Cq scores of 24.76, 26.18, and 27.86, respectively (Table 2). Considering the distribution of average raw Cq scores and interquartile range, EEF1A1 exhibited the lowest coefficient of variations (lowest variability across samples). On the other hand, the HMBS gene showed the highest coefficient of variation. Based on this parameter, EEF1A1, B2M, RPS15, and RPL4 RGs were most stable while UXT, HPRT1, and HMBS genes were the least stable across the combined dataset (Figure 2).
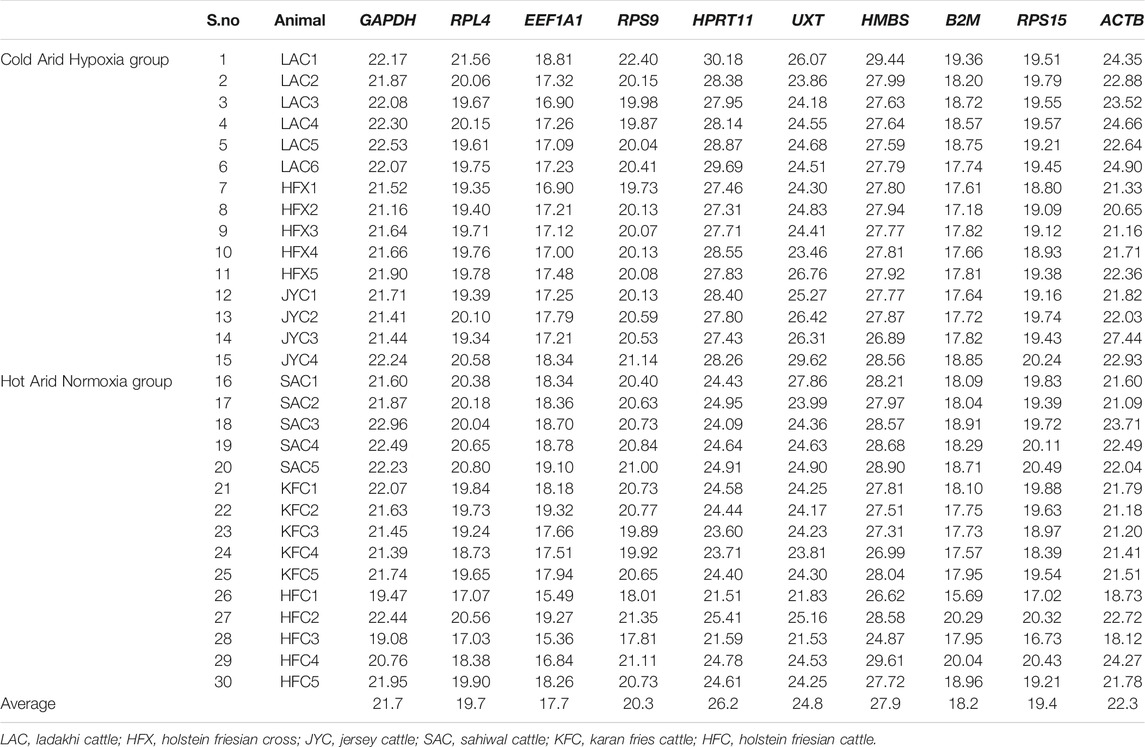
TABLE 2. The average raw Ct values of individual RGs in cattle populations adapted to cold arid high-altitude hypoxia (LAC, HFX, JYC) and hot arid normoxia environments (SAC, KFC, HFC).
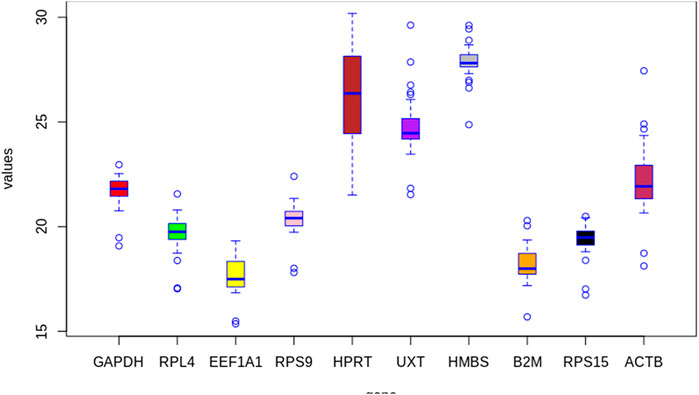
FIGURE 2. Box whisker plot showing expression levels of individual candidate RGs in the combined group (cold arid and hot arid). The data are presented as quantification cycle (CP) values of each gene in the box-whisker diagram. The median is shown as a line across the box while whiskers indicate maximum and minimum values.
Similar to the combined dataset, in cold arid as well as hot arid normoxia groups, EEF1A1 showed the highest maximum and HMBS showed the least expression level. The average Cq values of individual RGs in cold arid hypoxia and hot arid normoxia groups are summarized in Supplementary Tables S1,S2 and Supplementary Figures S3,S4 respectively.
Selection of Reference Genes by geNorm Analysis
The first analysis to determine the expression stability of 10 candidate RGs in PBMCs of heifer cows from the hypoxia cold arid group (LAC, JYC, and HFX) and normoxia hot arid group (SAC, KFC, and HFC) was based on the geNorm algorithm. The expression stability of individual RGs was evaluated first by combining RT-qPCR data for all 30 PBMCs samples (cold arid hypoxia and hot arid normoxia groups). All the RGs in combined group analysis showed stable expression with a stability index within the acceptable range (<M value < 1.5). In the combined analysis, RPS9 and RPS15 showed the highest expression stability (M = 0.464), followed by RPL4 (M = 0.527) and GAPDH (M = 0.539), whereas HPRT1 was the least stable gene (M = 1.228). On the basis of average expression stability measure, RGs were arranged from most stable (lowest M value) to the least stable (highest M value): RPS9 = RPS15 > RPL4> GAPDH > HMBS > EEF1A1> B2M > UXT > ACTB > HPRT1 (Figure 3A). Since the samples were from two distinct altitudes, we tried to determine the optimal number of RGs on the basis of pair-wise variation (Vn/n+1). The V values were calculated in different combinations: V2/V3, V3/V4, V4/V5, V5/V6 by adding the third, fourth, fifth, and sixth less stable genes, respectively. The V values for V2/V3 (0.169), V3/V4 (0.116), V4/V5 (0.101), V5/V6 (0.092), and V6/V7 (0.103) were either > or < the threshold of 0.15 (Figure 3B). It is generally considered that when Vn/n+1 is < 0.15 (threshold value), inclusion of an additional gene is not required for calculating the normalisation factor. In the combined dataset, combination V3/V4 resulted in a Vn/n+1 value < 0.116 which was less than the cut off value of 0.15 suggesting that the first three most stable RGs will be sufficient for accurate normalisation of RT-qPCR data. Therefore, based on M (stability) and V values (pair-wise variation) derived from geNorm analysis, the most stable RGs for the combined dataset were RPS9, RPS15, and RPL4 (Figure 4 and Table 3).
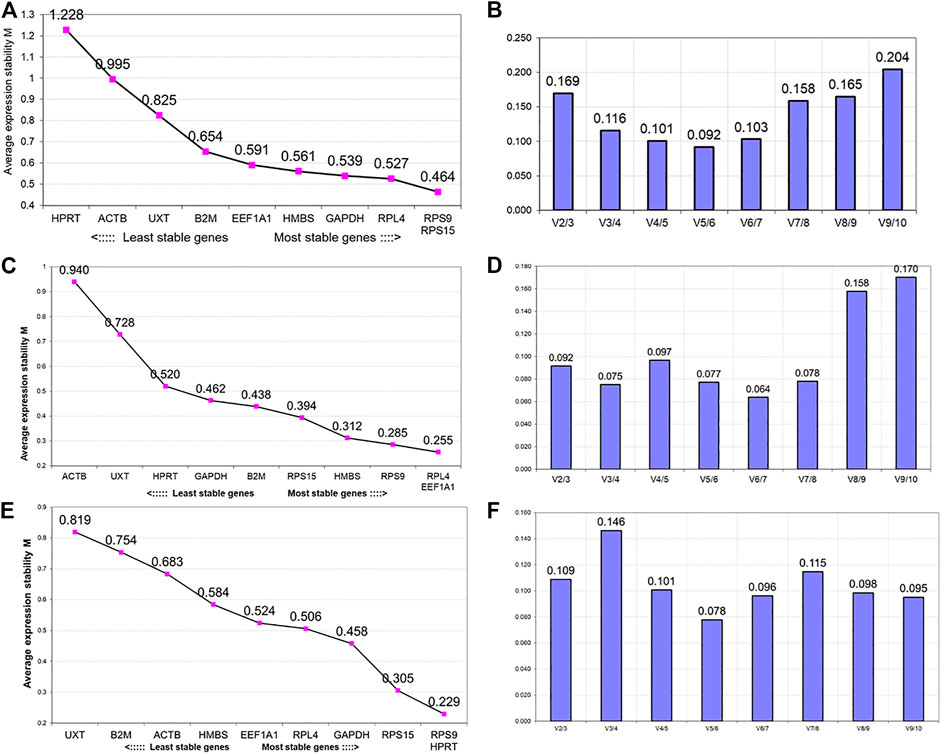
FIGURE 3. GeNorm analysis for ranking of genes based on average expression stability measure (M value) and pair-wise variation (Vn/Vn+ 1) between the normalisation factors NFn and NFn + 1 to determine the optimal number of reference genes. Analysis in the combined group (cold arid and hot arid) (A and B, respectively), cold arid hypoxia group (C and D, respectively), and hot arid normoxia group (E and F, respectively).

FIGURE 4. Expression stability of the three best stable RGs. (A) Combined group (cold arid and hot arid). (B) cold arid high-altitude hypoxia group, and (C) hot arid normoxia group.
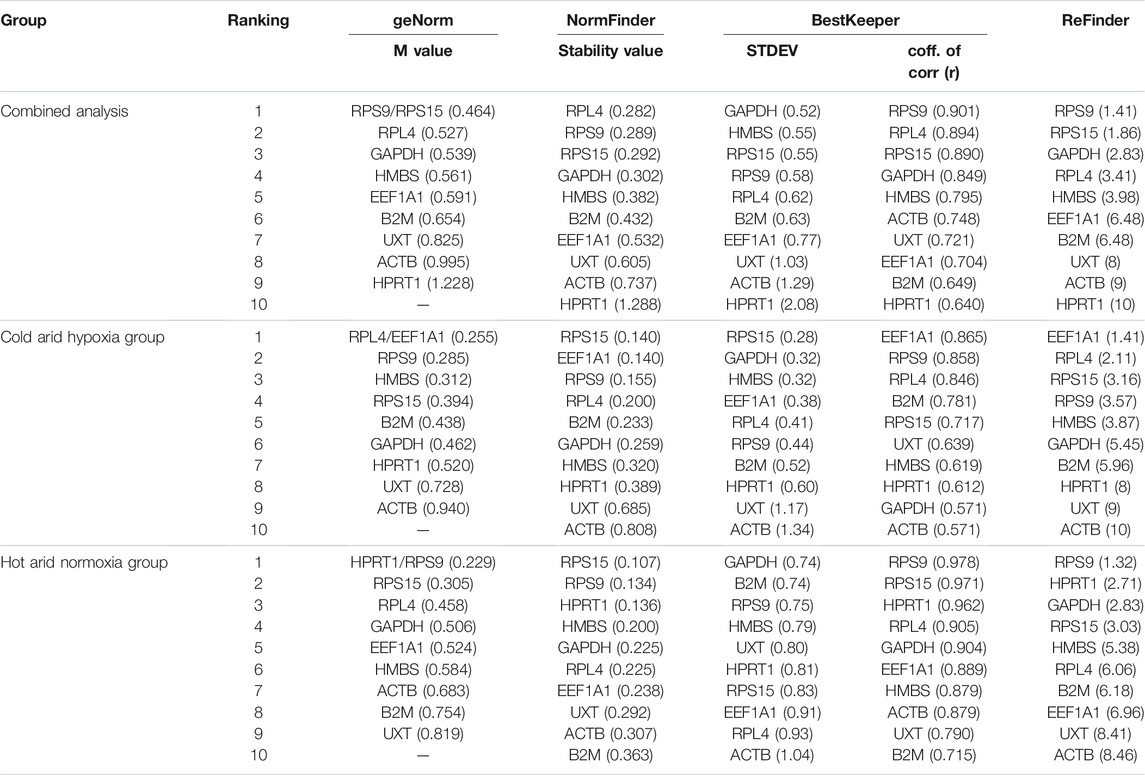
TABLE 3. Overall ranking of the best suitable reference genes in combined (cold arid and hot arid groups), Cold arid hypoxia group, and hot arid normoxia group analysis.
In addition to combined analysis, the geNorm tool was used to evaluate the expression stability of individual RGs separately in the cold arid hypoxia group (LAC, JYC, and HFX) and hot arid normoxia group (SAC, KFC, and HFC). The M values for all the 10 RGs in the hypoxia cold arid group were <1.5. The ranking of RGs in order of expression stability within this group were: RPL4 = EEF1A1 >RPS9> HMBS > RPS15 > B2M > GAPDH > HPRT11 > UXT > ACTB (Figure 3C; Table 3). RPL4 and EEF1A1 showed the highest expression stability (M = 0.255) followed by RPS9 (M = 0.285) and HMBS (M = 0.312), whereas ACTB was least stable (M = 0.940). The pair-wise variation analysis for different combinations of RGs was well below the threshold value of 0.15. The results obtained for V2/3 (0.092), V3/4 (0.075), V4/5 (0.097), and V5/6 (0.077) combinations indicated that RPL4 and EEF1A1 would provide the most accurate normalisation (Figure 3D). The expression stability of the three best RGs in combined analysis is shown in Figure 4B.
In the hot arid normoxia group (SAC, KFC, and HFC), the ranking of RGs in order of expression stability were: HPRT1 = RPS9> RPS15 > GAPDH > RPL4> EEF1A1> HMBS > ACTB > B2M > UXT (Figure 3E; Table 3). The M values for all the 10 RGs were <1.5. HPRT1 (M = 0.229) and RPS9 (M = 0.229) showed the highest stability followed by RSP15 (M = 0.305) whereas UXT was least stable (M = 0.819). The results for V2/3 (0.109), indicated that RPS9 and HPRT1 would provide reliable normalisation in PBMCs of the hot arid normoxia group (Figure 3F). The results of geNorm analysis for the three groups are summarized in Table 3. Overall, combined and group-wise analysis implied that RPL4, RPS9, RPS15, and EEF1A1 were the most stably expressed RGs (Figure 4C).
Selection of Reference Genes by NormFinder Analysis
In the NormFinder-based intergroup (combined) analysis covering both the conditions and all samples (cold arid hypoxia and hot arid normoxia), RPL4, RPS9, and RPS15 were found to be most stable with stability values of 0.282, 0.289, and 0.292 respectively. On the other hand, UXT, ACTB, and HPRT1 were least stable with stability values of 0.605, 0.737, and 1.288, respectively (Table 3). The graph showing intragroup variation of RGs in the combined dataset is shown in Figure 5A. Based on stability values, the RGs were ranked as RPL4> RPS9> RPS15 > GAPDH > HMBS > B2M > EEF1A1> UXT > ACTB > HPRT1. Within the cold arid hypoxia group, RPS15, EEF1A1, and RPS9 were the most stable RGs with stability values of 0.140, 0.140, and 0.155, respectively, whereas, ACTB was the least stable gene with the highest variability value of 0.808 (Table 3). The graph showing intragroup variation analysis of RGs is shown in Figure 5B. The RGs were ranked as RPS15> EEF1A1> RPS9> RPL4> B2M > GAPDH > HMBS > HPRT1>UXT > ACTB.
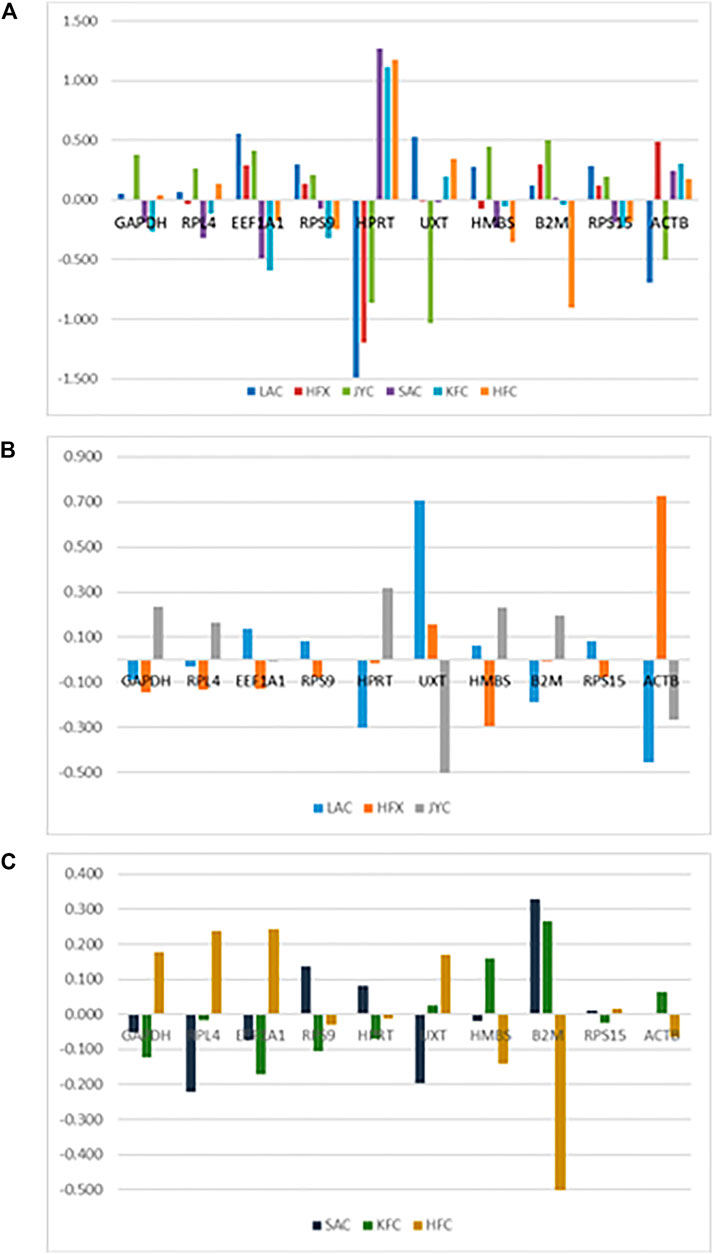
FIGURE 5. Inter-group variation analysis of RGs (A) Combined group (cold arid and hot arid). (B) cold arid hypoxia group, and (C) hot arid normoxia group.
Within the hot arid normoxia group, NormFinder analysis identified RPS15, RPS9, and HPRT1 as the three most stable RGs with stability values of 0.107, 0.134, and 0.136, respectively (Table 3). The graph showing intragroup variation analysis of RGs in the combined dataset is shown in Figure 5C. Based on stability values, the RGs were ranked as RPS15 > RPS9> HPRT1> HMBS > GAPDH > RPL4> EEF1A1> UXT > ACTB > B2M. Overall, there was a good agreement in geNorm and NormFinder outcomes for all the datasets (Table 3).
Selection of Reference Genes by BestKeeper Analysis
The descriptive statistics for BestKeeper analysis of the combined dataset are shown in Table 4. The analysis suggested stable expression (SD < 1) for the majority of genes: GAPDH (CV ± SD = 2.40 ± 0.52), HMBS (CV ± SD = 1.97 ± 0.55), RPS15 (CV ± SD = 2.85 ± 0.55), RPS9 (CV ± SD = 2.85 ± 0.58), RPL4 (CV ± SD = 3.15 ± 0.62), B2M (CV ± SD = 3.46 ± 0.63), and EEF1A1 (CV ± SD = 4.35 ± 0.77). Only three genes, UXT (CV ± SD = 4.18 ± 1.03), ACTB (CV ± SD = 5.81 ± 1.29), and HPRT1 (CV ± SD = 7.93 ± 2.07) showed SD > 1 and hence were considered unacceptable as RGs. Additionally, the BestKeeper software was used to measure the inter-gene relation amongst the 10 RGs in the combined dataset by calculating Pearson correlation coefficient (r) values. Several RG pairs GAPDH/RPL4 (r = 0.861) RPS9/RPS15 (r = 0.849), RPS9/HMBS (r = 0.847), RPL4/RPS9 (r = 0.834), and HMBS/RPS5 (r = 0.832) showed high correlation coefficients (Table 5). The RG pairs with high r values suggested that their expression pattern in PBMCs of cattle populations from two distinct climates and altitudes are more or less similar to each other. Further, the BestKeeper index (BI) calculated for each gene was used to estimate the correlation value between BI and each RG. As shown in Table 5, the best correlation values were obtained for RPS9 (r = 0.901), RPL4 (r = 0.894), RPS15 (r = 0.890), and GAPDH (r = 0.849). The high correlation values strongly suggested their suitability as reliable RGs in the experimental set up of the study.

TABLE 4. Combined (cold arid and hot arid groups) analysis of parameters-based quantitative cycling points (CP) for 10 candidate RGs

TABLE 5. Combined (cold arid and hot arid groups) analysis of repeated pair-wise correlation amongst genes with the BestKeeper index.
The BestKeeper analysis for the cold arid hypoxia group and hot arid normoxia group was also conducted separately. In the cold arid hypoxia group, the following 8 RGs showed lower a coefficient of variation (CV) and standard deviation (SD): RPS15 (CV ± SD = 1.44 ± 0.28), HMBS (CV ± SD = 1.14 ± 0.32), GAPDH (CV ± SD = 1.46 ± 0.32), EEF1A1 (CV±SD = 2.18 ± 0.38), RPL4 (CV ± SD = 2.04 ± 0.41), RPS9 (CV ± SD = 2.15 ± 0.44), B2M (CV ± SD = 2.85 ± 0.52), and HPRT1 (CV ± SD = 2.12 ± 0.60) (Table 6). The remaining two RGs showed high SD and CV values: ACTB (CV ± SD = 5.85 ± 1.34) and UXT (CV ± SD = 4.62 ± 1.17) and were unstable. The inter-gene relation showed very high correlation coefficient values (r) for EEF1A1/RPS9 (r = 0.93), EEF1A1/RPL4 (r = 0.90), and RPL4/RPS9 (r = 0.86) (Table 7). Further, the coefficient of correlation analysis (r) of individual RGs with the BestKeeper index resulted in high values for EEF1A1 (r = 0.865), RPS9 (r = 0.858), and RPL4 (r = 0.846). These results strongly suggest that EEF1A1, RPS9, and RPL4 with low CV, low SD, and high coefficient of correlation to the BestKeeper index should be the ideal panel for the cold arid high-altitude hypoxia group.

TABLE 6. Parameters-based quantitative cycling points (CP) for 10 RGs in PBMCs of cattle populations adapted to cold arid high-altitude hypoxia conditions.
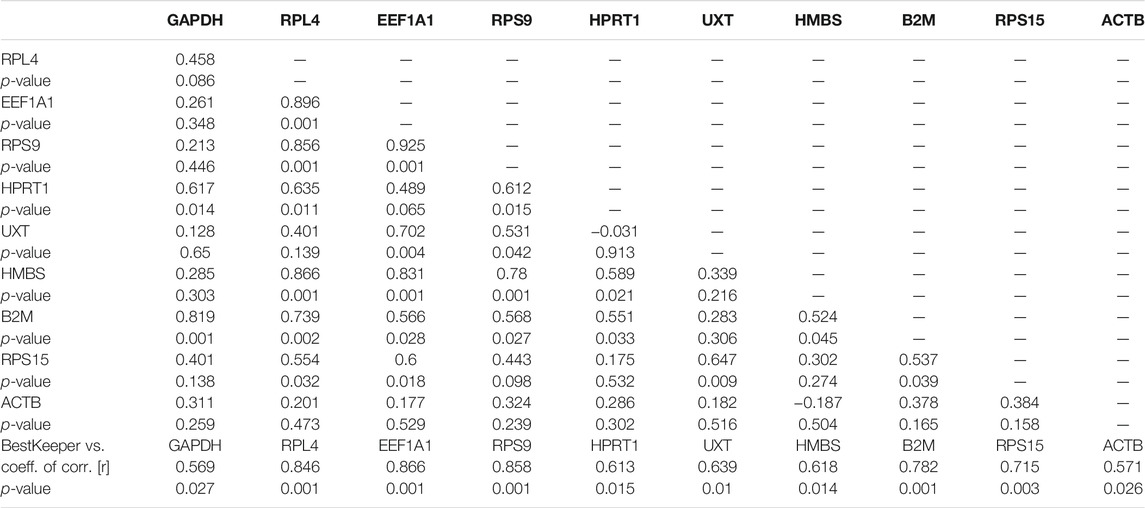
TABLE 7. Repeated pair-wise correlation amongst genes with the BestKeeper index in cattle populations adapted to cold arid high-altitude hypoxia conditions.
The BestKeeper analysis for the hot arid normoxia group also resulted in several RGs with SD < 1 (Table 8). The following nine RGs: GAPDH (CV ± SD = 3.44 ± 0.74), B2M (CV ± SD = 4.07 ± 0.74), HMBS (CV ± SD = 3.47 ± 0.96), RPS 9 (CV ± SD = 2.85 ± 0.79), UXT (CV ± SD = 3.28 ± 0.80), HPRT1 (CV ± SD = 3.35 ± 0.81), RPS15 (4.30 ± 0.83), EEF1A1 (CV ± SD = 5.09 ± 0.91), and RPL4 (CV ± SD = 4.75 ± 0.93) showed low SD and CV values. Whereas ACTB (CV ± SD = 54.82 ± 1.04) showed SD > 1 and hence was considered unstable.

TABLE 8. Parameters-based quantitative cycling points (CP) for 10 RGs in cattle populations adapted to hot arid normoxia conditions.
The inter-gene relation showed a strong correlation coefficient (r) for GAPDH/RPL4 (r = 0.930), EEF1A1/RPL4 (r = 0.951), RPS9/HPRT11 (r = 0.981), RPS15/HMBS (r = 0.923), HMBS/ACTB (r = 0.908), HPRT11/RPL4 (r = 874), HPRT11/EEF1A1 (r = 861), HMBS/RPS9 (r = 0.874), and RPS9/RPS15 (r = 0.965) (Table 9). The highest correlation coefficient of individual RGs with the BestKeeper index was observed for RPS9 (r = 0.978), RPS15 (0.971), HPRT1 (r = 0.962), RPL4 (0.905), and GAPDH (r = 0.904) (Table 9). The high correlation coefficient of these genes suggested their suitability as RGs in the hot arid normoxia group.
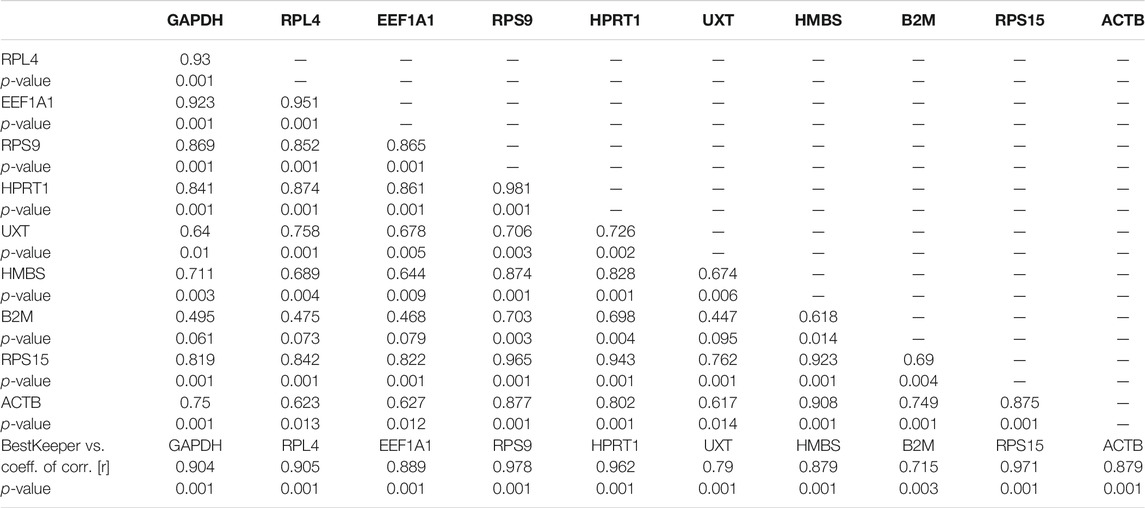
TABLE 9. Repeated pair-wise correlation amongst genes with the BestKeeper index of cattle populations adapted to hot arid normoxia conditions.
Selection of Reference Genes by RefFinder Analysis
Additionally, the RefFinder algorithm was used to evaluate the comprehensive ranking of individual RGs in combined, cold arid hypoxia, and hot arid normoxia group datasets (Xie et al., 2012). In the combined dataset, RefFinder ranked RPS9 (1.41), RPS15 (1.86), and GAPDH (2.83) as the three most stable RGs, followed by RPL4 (3.41), HMBS (3.98), EEF1A1 (6.48), and B2M (6.48), whereas UXT (8.00), ACTB (9.00), and HPRT1 (10.00) ranked as the three least stable RGs (Table 3). In the cold arid hypoxia group, RefFinder analysis ranked EEF1A1 (1.41), RPL4 (2.11), and RPS15 (3.16) as the most stable RGs; while HPRT11 (8.00), UXT (9.00), and ACTB (10.00) as the most unstable RGs. In the hot arid normoxia group, the analysis displayed RPS9 (1.32), HPRT1 (2.71), and GAPDH (2.83) as most stable while EEF1A1 (6.96), UXT (8.41), and ACTB (8.46) as unstable RGs.
Validation of Selected Reference Genes
To evaluate the reliability of the best suitable and worst panel of RGs, a validation qPCR experiment was performed using some of the known candidate target genes associated with high-altitude hypoxia and heat stress response. The qPCR data for two target genes associated with hypoxia and high altitude such as HIF-alpha and EPAS1 and two target genes associated with heat stress response such as HSP70 and HSP27 were generated in PBMC samples of high-altitude-adapted and tropically adapted cattle populations. As shown in Figure 6A, it is quite evident that the panel of best reference genes (RPS19, RPS15, and GAPDH) normalised the target gene data more accurately. We expected higher expression of high-altitude-associated genes in PBMCs of high-altitude cattle populations. On the other hand, genes related to heat stress response such as HSPs should have higher expression in PBMCs of cattle populations from the tropical region. As shown in Figure 6A, the expression of target genes such as HIF-alpha and EPAS1 was higher in high-altitude (HA)-adapted cattle while genes like HSP70 and HSP27 were more expressed in low-altitude (LA) cattle breeds. Further, the relative expression, standard deviation (SD), and standard error (SE) of the four target genes also supported the high quality of the panel of reference genes used (Supplementary Table S3).
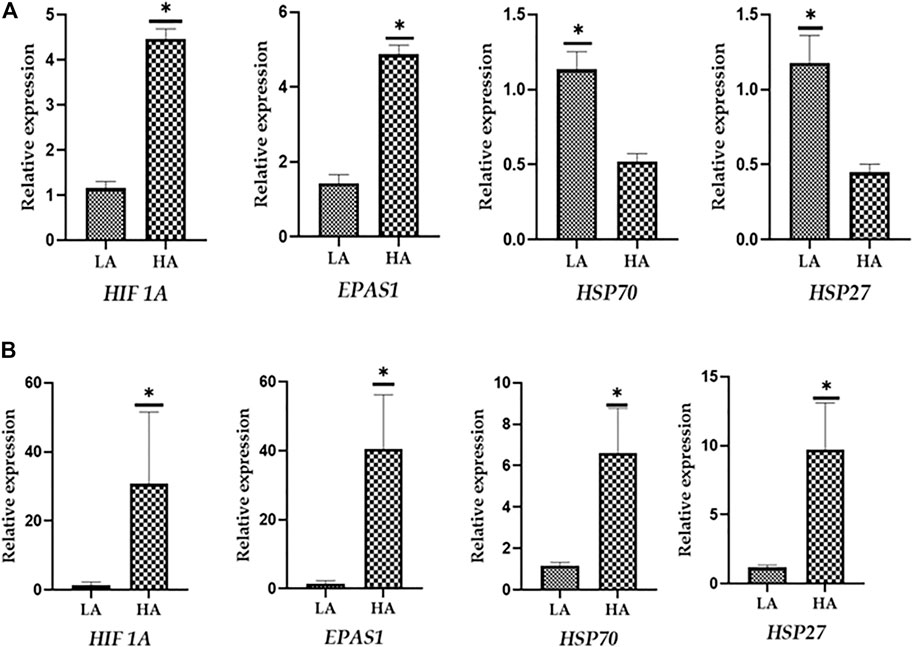
FIGURE 6. (A) Evaluation of best reference genes (RPS19, RPS15, and GAPDH) in normalising the target genes. (B) Evaluation of least stable reference genes (HPRT and ACTB) in normalising the target genes.
On the other hand, normalisation of same target genes with least stable genes (HPRT and ACTB) resulted in an unexpected pattern of expression. As shown in Figure 6B, HSPs showed higher expression in PBMCs of high-altitude cattle populations. Further, the use of least stable reference genes resulted in higher SD and SE values (Supplementary Table S4). Considering the above facts, it could be stated that the panel of RGs identified in the present study will be applicable for accurate normalisation of target genes in studies involving high and low-altitude cattle populations.
Discussion
In an era of high-throughput platforms, quantitative PCR (qRT-PCR) is being employed as a most preferred tool to validate gene expression data. Even though qRT-PCR is the most sensitive technique, it suffers from several analytical variations like differences in the amount of starting material, RNA extraction, and efficiency of the reverse transcription process. To a great extent the effect of these non-biological variables can be nullified by normalising gene expression data by a panel of stable reference genes (RGs). As suggested in the “Minimum information for publication of Quantitative Real-time PCR Experiments” (MIQE) guideline (Bustin et al., 2009), accuracy in gene expression is largely governed by the availability of reliable RGs. At present there is no consensus for the set of reference gene(s) that can be used universally for the normalisation purposes. In the past, several studies have utilized RGs without proper validation or arbitrarily selected commonly used reference genes such as ACTB and GAPDH. Unfortunately, the use of such empirical RGs might not provide accurate normalisation and create doubt on the reliable estimation of gene expression. Moreover, many reports showed the variable expression of commonly used reference genes in different cells, tissue, and conditions (Kim and Yun 2011; Zhao et al., 2012; Thomas et al., 2014).
The major challenge in any biological experiment involving different tissues, cell types, disease state, and physiological and or developmental stages is the knowledge about appropriate RGs whose expression remains constant without any observable variations across samples (Bustin 2002; Radonić et al., 2004). It has been seen that a particular RG appropriate in one condition might have variable expression in another set of conditions. Thus, identification and validation of proper RGs is the prerequisite for any specific experimental condition. Our group has successfully identified a panel of appropriate RGs for various cellular types and experimental conditions involving zebu cattle and riverine buffaloes (Kishore et al., 2013; Sood et al., 2017; Lagah et al., 2019). The present study was also conducted on similar lines to identify suitable reference genes for cattle populations from diverse environmental conditions. The 10 RGs (RGs selected for the present work were part of our earlier studies, wherein these genes were evaluated for their suitability as normalisers in different cell types, cattle breeds, and experimental conditions (Kishore et al., 2013; Jatav et al., 2016; Kaur et al., 2018)). Multiple RGs are generally preferred over a single RG to reduce the experimental variation for more effective normalisation (Vandesompele et al., 2002; Huang et al., 2014; Engdahl et al., 2016; Xu et al., 2016). Hence, in the present study, an optimal number of genes to be used as normalisers was identified. The data were analysed to identify the most appropriate panel of RGs for the combined dataset (cold arid and hot arid) and separately for the cold arid high-altitude hypoxia group and the hot arid normoxia group. Based on overall analysis, RPS9, RPS15, and GAPDH were marked as the most stable RGs for combined data. In the cold arid hypoxia group; RPL4, EEF1A1, and RPS15 were the most stable RGs, while in the hot arid normoxia cattle group, RPS9, HPRT1, and GAPDH were identified as the most stable RGs.
In the present analysis, RPS9, RPS15, and, to a certain extent, RPL4 genes were identified as stable RGs in the three groups (combined dataset, cold arid hypoxia group, and hot arid normoxia group). Both RPS9 and RPS15 genes are part of the ribosomal component of the small 40S subunit while RPL4 is a 60S ribosomal protein L4. In the past, these ribosomal genes were also identified as ideal reference genes in many studies involving the mammary gland of dairy cows (Bionaz and Loor 2007), mammary epithelial cells of native cows (Pradeep et al., 2014), different tissues of riverine buffaloes (Kaur et al., 2018), heat-stressed MECs of riverine buffaloes (Kapila et al., 2013), and PBMCs of native cows and riverine buffaloes (Kishore et al., 2013). It is known that these ribosomal proteins are highly conserved (Hsiao et al., 2001) and required by all life forms to synthesise new ribosomes. The unchanged expression of ribosomal proteins has also been reported in the red flour beetle (T. castaneum) during a fungal infection (Lu et al., 2018b). Similarly, stability of different ribosomal gene expressions has also been validated in several studies involving abiotic and biotic challenges (Ma et al., 2016; Yan et al., 2016; Lu et al., 2018a; Luo et al., 2018). In our study, the genes encoding ribosomal proteins also showed stabilised expression in PBMCs derived from different cattle types maintained at different altitudes. Based on current findings as well as previous studies, it could be concluded that ribosomal proteins exhibit higher expression stability and are good candidates as reference genes. GAPDH, the other stable RG in our study, has also been identified as an appropriate reference gene in several other studies (Lisowski et al., 2008; Yang et al., 2014; Engdahl et al., 2016; Jatav et al., 2016). Along with GAPDH, EEF1A1 and HPRT1 were the other genes that ranked amongst the first three most stable RGs in cold arid hypoxia and hot arid normoxia groups, respectively. EEF1A1 regulates the enzymatic delivery of aminoacyl tRNAs to the ribosome while HPRT11 catalyses the conversion of hypoxanthine to inosine monophosphate and guanine to guanosine monophosphate, and the regulates generation of purine nucleotides through the purine salvage pathway. To the best of our knowledge, this is the first study to assess the expression stability of 10 candidate RGs in cattle populations adapted to distinct altitudes.
Conclusion
This study has identified an altitude-specific panel of RGs in PBMCs of cattle populations from hot arid normoxia and cold arid high-altitude hypoxic environments. In the cold arid hypoxia group, RPL4, EEF1A1, and RPS15 RGs were the most stable, while in the hot arid normoxia group, RPS9, HPRT1, and GAPDH were identified as the most stable RGs. Further, the combined analysis resulted in identification of a panel of RPS9, RPS15, and GAPDH RGs that could act as a useful resource to unravel the accurate transcriptional profile of peripheral blood mononuclear cells of cattle populations adapted to tropical and high-altitude conditions.
Data Availability Statement
The original contributions presented in the study are included in the article/Supplementary Material, further inquiries can be directed to the corresponding author.
Ethics Statement
The animal study was reviewed and approved by Institute Animal Ethical Committee, ICAR-NBAGR, Karnal.
Author Contributions
MM, MS, and RK conceived and designed the study. VB, PD, SL, VS, NM, VP, and SN collected blood samples. PV, AS, and MT performed qRT-PCR experiments. PV, AS, MT, and MM conducted bioinformatics and data analysis. MS and MM drafted the manuscript. PD, SL, and VB supported in animal selection and data analysis.
Funding
The work was supported by the Indian Council of Agricultural Research, New Delhi, under the National Fellow Scheme (Grant number: 27 (3)/2010-HRD).
Conflict of Interest
The authors declare that the research was conducted in the absence of any commercial or financial relationships that could be construed as a potential conflict of interest.
Publisher’s Note
All claims expressed in this article are solely those of the authors and do not necessarily represent those of their affiliated organizations, or those of the publisher, the editors and the reviewers. Any product that may be evaluated in this article, or claim that may be made by its manufacturer, is not guaranteed or endorsed by the publisher.
Acknowledgments
The authors duly acknowledge the Director of NBAGR for providing research facilities for this work.
Supplementary Material
The Supplementary Material for this article can be found online at: https://www.frontiersin.org/articles/10.3389/fgene.2021.730599/full#supplementary-material
References
Aggarwal, J., Sharma, A., Kishore, A., Mishra, B. P., Yadav, A., Mohanty, A., et al. (2013). Identification of Suitable Housekeeping Genes for Normalization of Quantitative Real-Time PCR Data during Different Physiological Stages of Mammary Gland in Riverine Buffaloes (Bubalus Bubalis ). J. Anim. Physiol. Anim. Nutr. 97 (6), 1132–1141. doi:10.1111/jpn.12027
Andersen, C. L., Jensen, J. L., and Ørntoft, T. F. (2004). Normalization of Real-Time Quantitative Reverse Transcription-PCR Data: a Model-Based Variance Estimation Approach to Identify Genes Suited for Normalization, Applied to Bladder and colon Cancer Data Sets. Cancer Res. 64 (15), 5245–5250. doi:10.1158/0008-5472.CAN-04-0496
Bionaz, M., and Loor, J. J. (2007). Identification of Reference Genes for Quantitative Real-Time PCR in the Bovine Mammary Gland during the Lactation Cycle. Physiol. Genomics 29 (3), 312–319. doi:10.1152/physiolgenomics.00223.2006
Bustin, S. A., Benes, V., Garson, J. A., Hellemans, J., Huggett, J., Kubista, M., et al. (2009). The MIQE Guidelines: Minimum Information for Publication of Quantitative Real-Time PCR Experiments. Clin. Chem. 55, 611–622. doi:10.1373/clinchem.2008.112797
Bustin, S. A. (2010). Why the Need for qPCR Publication Guidelines?-The Case for MIQE. Methods 50 (4), 217–226. doi:10.1016/j.ymeth.2009.12.006
Bustin, S. (2002). Quantification of mRNA Using Real-Time Reverse Transcription PCR (RT-PCR): Trends and Problems. J. Mol. Endocrinol. 29, 23–39. doi:10.1677/jme.0.0290023
Castigliego, L., Armani, A., Li, X., Grifoni, G., Gianfaldoni, D., and Guidi, A. (2010). Selecting Reference Genes in the white Blood Cells of Buffalos Treated with Recombinant Growth Hormone. Anal. Biochem. 403 (1-2), 120–122. doi:10.1016/j.ab.2010.04.001
Crookenden, M. A., Walker, C. G., Kuhn-Sherlock, B., Murray, A., Dukkipati, V. S. R., Heiser, A., et al. (2017). Technical Note: Evaluation of Endogenous Control Gene Expression in Bovine Neutrophils by Reverse-Transcription Quantitative PCR Using Microfluidics Gene Expression Arrays. J. Dairy Sci. 100 (8), 6763–6771. doi:10.3168/jds.2016-12460
Die, J. V., Baldwin, R. L., Rowland, L. J., Li, R., Oh, S., Li, C., et al. (2017). Selection of Internal Reference Genes for Normalization of Reverse Transcription Quantitative Polymerase Chain Reaction (RT-qPCR) Analysis in the Rumen Epithelium. Plos one 12 (2), e0172674. doi:10.1371/journal.pone.0172674
Engdahl, E., Dunn, N., and Fogdell-Hahn, A. (2016). Investigation of Reference Gene Expression during Human Herpesvirus 6B Infection Indicates Peptidylprolyl Isomerase A as a Stable Reference Gene and TATA Box Binding Protein as a Gene Up-Regulated by This Virus. J. Virol. Methods 227, 47–49. doi:10.1016/j.jviromet.2015.10.011
Hsiao, L.-L., Dangond, F., Yoshida, T., Hong, R., Jensen, R. V., Misra, J., et al. (2001). A Compendium of Gene Expression in normal Human Tissues. Physiol. Genomics 7, 97–104. doi:10.1152/physiolgenomics.00040.2001
Huang, L., Yan, H., Jiang, X., Yin, G., Zhang, X., Qi, X., et al. (2014). Identification of Candidate Reference Genes in Perennial Ryegrass for Quantitative RT-PCR under Various Abiotic Stress Conditions. PloS one 9 (4), e93724. doi:10.1371/journal.pone.0093724
Huggett, J., Dheda, K., Bustin, S., and Zumla, A. (2005). Real-time RT-PCR Normalisation; Strategies and Considerations. Genes Immun. 6 (4), 279–284. doi:10.1038/sj.gene.6364190
Jatav, P., Sodhi, M., Sharma, A., Mann, S., Kishore, A., Shandilya, U. K., et al. (2016). Identification of Internal Control Genes in Milk-Derived Mammary Epithelial Cells during Lactation Cycle of Indian Zebu Cow. Anim. Sci. J. 87 (3), 344–353. doi:10.1111/asj.12384
Kapila, N., Kishore, A., Sodhi, M., Sharma, A., Kumar, P., Mohanty, A. K., et al. (2013). Identification of Appropriate Reference Genes for qRT-PCR Analysis of Heat-Stressed Mammary Epithelial Cells in Riverine Buffaloes (Bubalus Bubalis). ISRN Biotechnol. 2013, 1–9. doi:10.5402/2013/735053
Kaur, R., Sodhi, M., Sharma, A., Sharma, V. L., Verma, P., Swami, S. K., et al. (2018). Selection of Suitable Reference Genes for Normalization of Quantitative RT-PCR (RT-qPCR) Expression Data across Twelve Tissues of Riverine Buffaloes (Bubalus Bubalis). PloS one 13 (3), e0191558. doi:10.1371/journal.pone.0191558
Kim, H. K., and Yun, S. H. (2011). Evaluation of Potential Reference Genes for Quantitative RT-PCR Analysis in Fusarium Graminearum under Different Culture Conditions. Plant Pathol. J. 27 (301), 9. doi:10.5423/ppj.2011.27.4.301
Kishore, A., Sodhi, M., Khate, K., Kapila, N., Kumari, P., and Mukesh, M. (2013). Selection of Stable Reference Genes in Heat Stressed Peripheral Blood Mononuclear Cells of Tropically Adapted Indian Cattle and Buffaloes. Mol. Cell Probes 27 (3-4), 140–144. doi:10.1016/j.mcp.2013.02.003
Kishore, A., Sodhi, M., Kumari, P., Mohanty, A. K., Sadana, D. K., Kapila, N., et al. (2014). Peripheral Blood Mononuclear Cells: a Potential Cellular System to Understand Differential Heat Shock Response across Native Cattle (Bos indicus), Exotic Cattle (Bos taurus), and Riverine Buffaloes (Bubalus Bubalis) of India. Cell Stress and Chaperones 19 (5), 613–621. doi:10.1007/s12192-013-0486-z
Lagah, S. V., Sood, T. J., Palta, P., Mukesh, M., Chauhan, M. S., Manik, R. S., et al. (2019). Selection of Reference miRNAs for Relative Quantification in Buffalo (Bubalus Bubalis) Blastocysts Produced by Hand-Made Cloning and In Vitro Fertilization. Cell reprogramming 21 (4), 200–209. doi:10.1089/cell.2019.0022
Li, J., Jia, H., Han, X., Zhang, J., Sun, P., Lu, M., et al. (2016). Selection of Reliable Reference Genes for Gene Expression Analysis under Abiotic Stresses in the Desert Biomass Willow, Salix Psammophila. Front. Plant Sci. 7, 1505. doi:10.3389/fpls.2016.01505
Lisowski, P., Pierzchała, M., Gościk, J., Pareek, C. S., and Zwierzchowski, L. (2008). Evaluation of Reference Genes for Studies of Gene Expression in the Bovine Liver, Kidney, Pituitary, and Thyroid. J. Appl. Genet. 49 (4), 367–372. doi:10.1007/BF03195635
Lü, J., Yang, C., Zhang, Y., and Pan, H. (2018b). Selection of Reference Genes for the Normalization of RT-qPCR Data in Gene Expression Studies in Insects: a Systematic Review. Front. Physiol. 9, 1560. doi:10.3389/fphys.2018.01560
Lu, P., Magwanga, R., Lu, H., Kirungu, J., Wei, Y., Dong, Q., et al. (2018a). A Novel G-Protein-Coupled Receptors Gene from upland Cotton Enhances Salt Stress Tolerance in Transgenic Arabidopsis. Genes 9 (4), 209. doi:10.3390/genes9040209
Luo, M., Gao, Z., Li, H., Li, Q., Zhang, C., Xu, W., et al. (2018). Selection of Reference Genes for miRNA qRT-PCR under Abiotic Stress in grapevine. Sci. Rep. 8 (1), 1–11. doi:10.1038/s41598-018-22743-6
Ma, R., Xu, S., Zhao, Y., Xia, B., and Wang, R. (2016). Selection and Validation of Appropriate Reference Genes for Quantitative Real-Time PCR Analysis of Gene Expression in Lycoris Aurea. Front. Plant Sci. 7, 536. doi:10.3389/fpls.2016.00536
Pradeep, J., Monika, S., Ankita, S., Umesh, K. S., Amit, K., Ashok, M., et al. (2014). Expression Analysis of Solute Carrier (SLC2A) Genes in Milk Derived Mammary Epithelial Cells during Different Stages of Lactation in Sahiwal (Bos indicus) Cows. Research Article. J. Adv. Dairy Res. 2 (117), 2.
Radonić, A., Thulke, S., Mackay, I. M., Landt, O., Siegert, W., and Nitsche, A. (2004). Guideline to Reference Gene Selection for Quantitative Real-Time PCR. Biochem. Biophys. Res. Commun. 313 (4), 856–862. doi:10.1016/j.bbrc.2003.11.177
Rasmussen, R. (2001). “Quantification on the LightCycler,” in Rapid Cycle Real-Time PCR (Berlin, Heidelberg: Springer), 21-34. doi:10.1007/978-3-642-59524-0_3
Sang, J., Wang, Z., Li, M., Cao, J., Niu, G., Xia, L., et al. (2018). ICG: a Wiki-Driven Knowledgebase of Internal Control Genes for RT-qPCR Normalization. Nucleic Acids Res. 46 (D1), D121–D126. doi:10.1093/nar/gkx875
Sharma, P., Sharma, A., Sodhi, M., Verma, P., Parvesh, K., Swami, S. K., et al. (2019). Characterizing Binding Sites of Heat Responsive microRNAs and Their Expression Pattern in Heat Stressed PBMCs of Native Cattle, Exotic Cattle and Riverine Buffaloes. Mol. Biol. Rep. 46 (6), 6513–6524. doi:10.1007/s11033-019-05097-8
Sood, T. J., Lagah, S. V., Sharma, A., Singla, S. K., Mukesh, M., Chauhan, M. S., et al. (2017). Selection of Suitable Internal Control Genes for Accurate Normalization of Real-Time Quantitative PCR Data of buffalo (Bubalus Bubalis) Blastocysts Produced by SCNT and IVF. Cell Reprogramming 19 (5), 302–310. doi:10.1089/cell.2017.0010
Thomas, K. C., Zheng, X. F., Garces Suarez, F., Raftery, J. M., Quinlan, K. G. R., Yang, N., et al. (2014). Evidence Based Selection of Commonly Used RT-qPCR Reference Genes for the Analysis of Mouse Skeletal Muscle. PloS one 9 (2), e88653. doi:10.1371/journal.pone.0088653
Vandesompele, J., De Preter, K., Pattyn, F., Poppe, B., Van Roy, N., De Paepe, A., et al. (2002). Accurate Normalization of Real-Time Quantitative RT-PCR Data by Geometric Averaging of Multiple Internal Control Genes. Genome Biol. 3 (7), research0034–1. doi:10.1186/gb-2002-3-7-research0034
Verma, P., Sharma, A., Sodhi, M., Thakur, K., Bharti, V. K., Kumar, P., et al. (2018b). Overexpression of Genes Associated with Hypoxia in Cattle Adapted to Trans Himalayan Region of Ladakh. Cell. Biol. Int. 42 (9), 1141–1148. doi:10.1002/cbin.10981
Verma, P., Sharma, A., Sodhi, M., Thakur, K., Kataria, R. S., Niranjan, S. K., et al. (2018a). Transcriptome Analysis of Circulating PBMCs to Understand Mechanism of High Altitude Adaptation in Native Cattle of Ladakh Region. Sci. Rep. 8 (1), 1–15. doi:10.1038/s41598-018-25736-7
Xie, F., Xiao, P., Chen, D., Xu, L., and Zhang, B. (2012). miRDeepFinder: a miRNA Analysis Tool for Deep Sequencing of Plant Small RNAs. Plant Mol. Biol. 80 (1), 75–84. doi:10.1007/s11103-012-9885-2
Xu, H., Li, C., Zeng, Q., Agrawal, I., Zhu, X., and Gong, Z. (2016). Genome-wide Identification of Suitable Zebrafish Danio rerio Reference Genes for Normalization of Gene Expression Data by RT-qPCR. J. Fish. Biol. 88 (6), 2095–2110. doi:10.1111/jfb.12915
Yan, Q., Cui, X., Lin, S., Gan, S., Xing, H., and Dou, D. (2016). GmCYP82A3, a Soybean Cytochrome P450 Family Gene Involved in the Jasmonic Acid and Ethylene Signaling Pathway, Enhances Plant Resistance to Biotic and Abiotic Stresses. PloS one 11 (9), e0162253. doi:10.1371/journal.pone.0162253
Yang, Q., Yin, J., Li, G., Qi, L., Yang, F., Wang, R., et al. (2014). Reference Gene Selection for qRT-PCR in Caragana Korshinskii Kom. Under Different Stress Conditions. Mol. Biol. Rep. 41 (4), 2325–2334. doi:10.1007/s11033-014-3086-9
Zhao, D.-J., Guo, K., and Kang, L. (2012). Identification of Condition-specific Reference Genes from Microarray Data for Locusts Exposed to Hypobaric Hypoxia. FEBS open bio 2, 235–240. doi:10.1016/j.fob.2012.08.001
Keywords: reference genes, expression stability, qRT-PCR, normalization, hot arid, cold arid, cattle, PBMCs
Citation: Verma P, Sharma A, Sodhi M, Tiwari M, Vivek P, Kataria RS, Nirajan SK, Bharti VK, Singh P, Lathwal SS, Sharma V, Masharing N and Mukesh M (2022) Identification of Internal Reference Genes in Peripheral Blood Mononuclear Cells of Cattle Populations Adapted to Hot Arid Normoxia and Cold Arid Hypoxia Environments. Front. Genet. 12:730599. doi: 10.3389/fgene.2021.730599
Received: 25 June 2021; Accepted: 03 December 2021;
Published: 01 February 2022.
Edited by:
Mohammed Ali Al Abri, Sultan Qaboos University, OmanReviewed by:
Muhammad Ihsan Andi Dagong, Hasanuddin University, IndonesiaSajad Ahmad Wani, Ohio State University, United States
Copyright © 2022 Verma, Sharma, Sodhi, Tiwari, Vivek, Kataria, Nirajan, Bharti, Singh, Lathwal, Sharma, Masharing and Mukesh. This is an open-access article distributed under the terms of the Creative Commons Attribution License (CC BY). The use, distribution or reproduction in other forums is permitted, provided the original author(s) and the copyright owner(s) are credited and that the original publication in this journal is cited, in accordance with accepted academic practice. No use, distribution or reproduction is permitted which does not comply with these terms.
*Correspondence: Manishi Mukesh, bW11a2VzaF8yNkBob3RtYWlsLmNvbQ==
 Preeti Verma1
 Monika Sodhi
 Ranjit S. Kataria
 Vishal Sharma
 Manishi Mukesh