 Jack C. M. Ng
 C. Mary Schooling
- 1School of Public Health, Li Ka Shing Faculty of Medicine, The University of Hong Kong, Hong Kong Special Administrative Region, China
- 2Department of Environmental, Occupational, and Geospatial Health Sciences, Graduate School of Public Health and Health Policy, The City University of New York, New York, NY, United States
Background: Basal metabolic rate is associated with cancer, but these observations are open to confounding. Limited evidence from Mendelian randomization studies exists, with inconclusive results. Moreover, whether basal metabolic rate has a similar role in cancer for men and women independent of insulin-like growth factor 1 increasing cancer risk has not been investigated.
Methods: We conducted a two-sample Mendelian randomization study using summary data from the UK Biobank to estimate the causal effect of basal metabolic rate on cancer. Overall and sex-specific analysis and multiple sensitivity analyses were performed including multivariable Mendelian randomization to control for insulin-like growth factor 1.
Results: We obtained 782 genetic variants strongly (p-value < 5 × 10⁻⁸) and independently (r2 < 0.01) predicting basal metabolic rate. Genetically predicted higher basal metabolic rate was associated with an increase in cancer risk overall (odds ratio, 1.06; 95% confidence interval, 1.02–1.10) with similar estimates by sex (odds ratio for men, 1.07; 95% confidence interval, 1.002–1.14; odds ratio for women, 1.06; 95% confidence interval, 0.995–1.12). Sensitivity analyses including adjustment for insulin-like growth factor 1 showed directionally consistent results.
Conclusion: Higher basal metabolic rate might increase cancer risk. Basal metabolic rate as a potential modifiable target of cancer prevention warrants further study.
Introduction
Cancer mortality ranks second among causes of death worldwide (World Health Organization, 2018) despite significant advances in cancer treatment, provision of screening programs, and reduction of specific environmental hazards, such as smoking, asbestos, and cancer-provoking infections. Owing to its complex, varied, and multifactorial nature, prevention involves focusing on factors driving specific cancers as well as consideration of more broad factors, such as viral infections, diet, and lifestyle (Lampe, 2020), that generally increase vulnerability to cancer. To inform this wider perspective, concepts from evolutionary biology are increasingly being applied to develop novel prevention and treatment strategies (Aktipis and Nesse, 2013; Boddy et al., 2015; Schooling, 2017).
Evolutionary biology suggests reproductive success may take precedence over health and longevity (Wells et al., 2017). Faster growth and earlier maturation favor reproductive success (Aktipis and Nesse, 2013; Wells et al., 2017), possibly with different trade-offs by sex. Increasing evidence suggests that growth hormone and associated factors, such as insulin-like growth factor 1 (IGF1), which regulates cell growth, play a role in cancer (Swanson and Dantzer, 2014; Murphy et al., 2020a,b). Correspondingly, most Mendelian randomization (MR) studies have shown a positive association of IGF1 with different types of cancer (Cornish et al., 2020; Larsson et al., 2020; Murphy et al., 2020a,b; Watts et al., 2021). Interventions to reduce IGF1 are under investigation (Werner and Laron, 2020). Basal metabolic rate (BMR) is a related potential target of intervention. Observationally, BMR is associated with cancer (Kliemann et al., 2020). Observational studies are open to confounding, which may compromise internal validity. No randomized controlled trial has been performed to examine the effect of BMR on cancer. MR is a widely used alternative approach taking the advantage of Mendel’s second law, where genetic variants (GVs) randomly assort at conception are used to obtain unconfounded estimates (Smith and Ebrahim, 2003). MR studies on this topic are limited. One MR study reported that BMR was suggestively associated with colorectal cancer (Cornish et al., 2020). Another reported a null association with glioma (Saunders et al., 2020).
In the current study, we conducted an MR analysis to investigate the effect of BMR on cancer and neoplasms overall and by sex using summary data from the UK Biobank. We also conducted exploratory analysis for specific cancers, where possible. Given the interrelation between IGF1 and BMR (Swanson and Dantzer, 2014), we also examined whether any effects of BMR were independent of IGF1 using multivariable MR.
Materials and Methods
We performed a univariable and multivariable MR study of the association of BMR with cancer as the primary outcome and neoplasm as secondary outcome using a two-sample summary data approach, where we applied genetic predictors of the exposure, BMR, to genome-wide association studies (GWASs) of the outcomes. For exploratory purpose, we also considered several site-specific cancers based on the International Classification of Diseases-10 codes. As an instrumental variable analysis, MR assumes strong genetic predictors of the exposure, no confounding of the instruments or exposure on outcome, and that the instruments only affect the outcome via effects on the exposure.
Genetic Predictors of Basal Metabolic Rate
Genetic predictors of BMR were obtained from the summary statistics of the UK Biobank GWAS provided by the Neale Lab (2018). The UK Biobank is a population-based, prospective cohort study for different health outcomes that aimed to recruit >500,000 individuals aged 40 to 69 years during 2006 to 2010 (Sudlow et al., 2015). BMR (KJ) was inverse-ranked normalized (phenotype code, 23105_irnt), i.e., effect sizes, for all analyses. Neale Lab (2018) analyzed the genetic associations using multivariable linear regression in 361,194 people (54% women) of white British ancestry with adjustment for age, age × age, inferred sex, age × inferred sex, age × age × inferred sex, and the first 20 principal components in overall analysis and age, age × age, and the first 20 principal components in sex-specific analysis.
We excluded GVs that are non-biallelic, rare (minor allele frequency <0.01), not in Hardy-Weinberg equilibrium (p-value for Chi-squared test <0.05), and from sex chromosomes in overall-sex analysis. We did not exclude GVs from sex chromosomes in sex-specific analysis. Only GVs strongly (p-value < 5 × 10⁻⁸) and independently (r2 < 0.01) predicting BMR were retained. We used the “clump_data” function in the “TwoSampleMR” R package to identify independent GVs (Hemani et al., 2018).
Genetic Associations With Cancer and Neoplasm
Genetic associations with cancer and neoplasm obtained using multivariable linear regression were extracted from the same data source as for BMR (Neale Lab, 2018). The analyzed sample consisted of 28,509 cases of cancer diagnosed by doctor (phenotype code, 2453) and 70,178 cases of neoplasm (phenotype code, II_NEOPLASM).
Genetic Associations With Site-Specific Cancers
Genetic associations with several site-specific cancers, namely (i) cancer of lip, oral cavity, and pharynx, (ii) cancer of digestive organs, (iii) cancer of respiratory system and intrathoracic organs, (iv) skin cancer, (v) cancer of mesothelium and soft tissue, (vi) cancer of urinary organs, (vii) cancer of eye, brain, and central nervous system, (viii) cancer of endocrine gland, (ix) cancer of primary lymphoid and hematopoietic tissue, (x) cancer of genital organs in men, (xi) prostate cancer, (xii) breast cancer in women, and (xiii) cancer of genital cancers in women were obtained from the same data source as for BMR (Neale Lab, 2018). The Prostate Cancer Association Group to Investigate Cancer Associated Alterations in the Genome (PRACTICAL) Consortium (Schumacher et al., 2018) and the Breast Cancer Association Consortium (BCAC) (Zhang et al., 2020) were used for replication. The study details for each site-specific cancer are given in Supplementary Table 1.
Sex-Specific Analysis
We carried out sex-specific analysis for primary and secondary outcomes as well as cancer of genital organs in men and women, prostate cancer, and breast cancer in women using sex-specific genetic predictors of BMR and IGF1. We assessed sex differences for primary and secondary outcomes using a z-test (Paternoster et al., 1998).
Assessment of Confounding
To assess potential confounding, we checked whether the GVs predicting BMR were also related to five potential confounders of the BMR-cancer association, namely Townsend index (phenotype code, 189), age at completion of full-time education (phenotype code, 845), number of days per week walked for 10 + min (phenotype code, 864), current smoking (phenotype code, 1239), and alcohol intake frequency (phenotype code, 1558) using summary statistics from the same data source (Neale Lab, 2018), at Bonferroni-corrected p-value, i.e., 0.05/(number of GVs × number of traits).
Statistical Analysis
We aligned the effect of a GV across the exposure and outcome datasets based on the effect allele and reference allele and checked against the allele frequency. For palindromic GVs, i.e., GVs with allele pair of A/T or C/G, we discarded those with minor allele frequency ≥0.45 (close to 0.50) if the strand information was not given and the exposure and outcome originated from different data sources. Alternatively, we discarded all palindromic GVs, if both minor allele frequency and strand information were not available. The GV-specific Wald estimate was calculated as the ratio of the estimate of GV-outcome association to that of GV-exposure association (Wald, 1940; Palmer et al., 2011). The standard error of the Wald estimate was approximated from Fieller’s theorem (Fieller, 1954; Burgess et al., 2015), which effectively assumes “NO Measurement Error (NOME)” for the exposure (Bowden et al., 2016b).
We assessed the strength of instruments from the F-statistic using an approximation, i.e., dividing squared beta by squared standard error of the association of GV with exposure (Bowden et al., 2016b), with a value <10 indicating a weak instrument (Bowden et al., 2016b).
In the primary MR analysis, the GV-specific Wald estimates per 1 unit of effect size change in genetically predicted BMR were meta-analyzed using inverse-variance weighted with multiplicative random effects, which assumes balanced pleiotropy (Bowden et al., 2016b; Hemani et al., 2018). Other MR methods used as sensitivity analysis included weighted median and MR-Egger, using the “MendelianRandomization” R package (Yavorska and Burgess, 2017), as well as MR-pleiotropy residual sum and outlier (MR-PRESSO) (with 10,000 simulations performed), using the “MR-PRESSO” R package (Verbanck et al., 2018). The weighted median gives a consistent estimate when at least 50% of the weight is from valid GVs (Bowden et al., 2016a). MR-Egger gives a consistent estimate under the “Instrument Strength Independent of Direct Effect” assumption (Bowden et al., 2016b; Burgess and Thompson, 2017), for example, assuming the instrument does not affect an exposure-outcome confounder or affect survival when confounders of survival and outcome exist (Schooling et al., 2021). The I2GX statistic in MR-Egger reflects the instrument strength and the extent of violation of the “NOME” assumption (Bowden et al., 2016b). A low value indicates possible bias of the estimate towards null. A non-zero MR-Egger intercept indicates the presence of directional pleiotropy, which invalidates the inverse-variance-weighted estimate (Burgess and Thompson, 2017). MR-PRESSO identifies outliers as a statistical means to detect directional pleiotropy and correct the estimate by removing the outliers (Verbanck et al., 2018). In overall analysis on cancer and neoplasm, we also applied the contamination mixture method using the “MendelianRandomization” R package (Yavorska and Burgess, 2017) because simulation suggests it provides the most reliable MR estimate (Slob and Burgess, 2020).
To address the possibility of BMR affecting cancer via IGF1 rather than BMR, i.e., horizontal pleiotropy, given its correlation with BMR (Swanson and Dantzer, 2014), we also adjusted for IGF1 (nmol/L) that was inverse-rank normalized (phenotype code, 30770_irnt) by multivariable MR, using summary statistics from the same data source as for BMR (Neale Lab, 2018). We combined genetic predictors for BMR and IGF1 and dropped any correlated GVs. We assessed the instrument strength from the conditional F-statistic using the “MVMR” R package (Sanderson et al., 2019). We obtained the multivariable inverse-variance-weighted estimates with multiplicative random effects in primary analysis and multivariable MR-Egger estimates as a sensitivity analysis using the “MendelianRandomization” R package (Yavorska and Burgess, 2017). The MR-Egger intercept test is sensitive to the orientation of GVs (Burgess and Thompson, 2017) and the orientation may affect the estimates in multivariable MR-Egger (Rees et al., 2017). As BMR was the exposure of interest, we performed analysis by orientating the GVs with respect to the risk-increasing allele for BMR. The multivariable MR estimates represent the direct effect of the exposure on the outcome (Sanderson et al., 2019). We also assessed the heterogeneity of multivariable estimates by the modified Cochran’s Q statistic, which reflects the extent of residual horizontal pleiotropy, using the “MVMR” R package (Sanderson et al., 2019). Given, we used summary statistics for the exposures from the same study without accounting for their covariance, the conditional F-statistic likely represents a lower bound and the modified Cochran’s Q statistic likely represents an upper bound.
We repeated all MR analyses by excluding GVs associated with potential confounders at Bonferroni-corrected p-value.
MR estimates for cancer, neoplasm, and site-specific cancers in the UK Biobank were presented as odds ratio (OR) after converting the probability to log odds by an approximation as calculated by [(k + b)/(1 – k – b)] × [(1 – k)/k], where k is the proportion of cases in the sample and b is the MR estimate in probability (Lloyd-Jones et al., 2018).
Power calculations were performed for overall analysis using the approximation that the sample size of the outcome for an MR study is the sample size for exposure on outcome divided by the proportion of variance for instruments on exposure (Freeman et al., 2013), using an online calculator (Anonymous, 2021). The proportion of variance in BMR explained by the each GV was calculated by an approximation as beta2 × 2 × minor allele frequency × (1 – minor allele frequency), where beta is the effect size of the genetic association of GV with BMR and minor allele frequency is represented by effect allele frequency (Del Greco et al., 2017). An overall proportion of variance was obtained by summing GV-specific ones.
All statistical analyses were conducted using R (version 3.6.3, The R Foundation for Statistical Computing Platform, Vienna, Austria).
Ethics Approval
The current MR study used only publicly available summary data, with no original data collected. Ethical approval for the UK Biobank and the GWASs, including written informed consent from individual participants, can be found in the original publications.
Results
Genetic Predictors of Basal Metabolic Rate and Insulin-Like Growth Factor 1
We obtained 782 GVs strongly and independently predicting BMR (Supplementary Table 2), of which all were available for cancer and neoplasm since they originate from the same GWAS. Their mean F-statistic was 60 (range, 30 to 679) (Supplementary Table 3). Supplementary Table 4 shows the GVs predicting BMR associated with potential confounders. The GVs explained approximately 5.6% of the variance in BMR. The study has a power of >80% to detect an OR of 1.08 for cancer and an OR of 1.06 for neoplasm per 1 unit of effect size change in genetically predicted BMR.
We obtained 604 GVs strongly and independently predicting IGF1 (Supplementary Table 5), which also all were available for cancer and neoplasm. Their mean F-statistic was 77 (range, 30 to 1997) (Supplementary Table 4). Supplementary Table 6 shows the GVs predicting IGF1 associated with potential confounders.
Supplementary Tables 2, 5 show the associations of BMR and IGF1, respectively, with site-specific cancers.
The conditional F-statistic for the multivariable analysis of the association of BMR and IGF1 with cancer and neoplasm was 39 for BMR and 40 for IGF1 (Supplementary Table 7).
Genetic Associations of Basal Metabolic Rate With Cancer
BMR was positively associated with cancer (Table 1). Other MR methods and inclusion/exclusion of GVs associated with potential confounders showed directionally similar results. No MR-Egger intercept tests showed evidence of directional pleiotropy. BMR was positively associated with cancer using the contamination mixture method (odds ratio, 1.13; 95% confidence interval, 1.09 to 1.20). Exclusion of GVs associated with potential confounders showed directionally similar results.
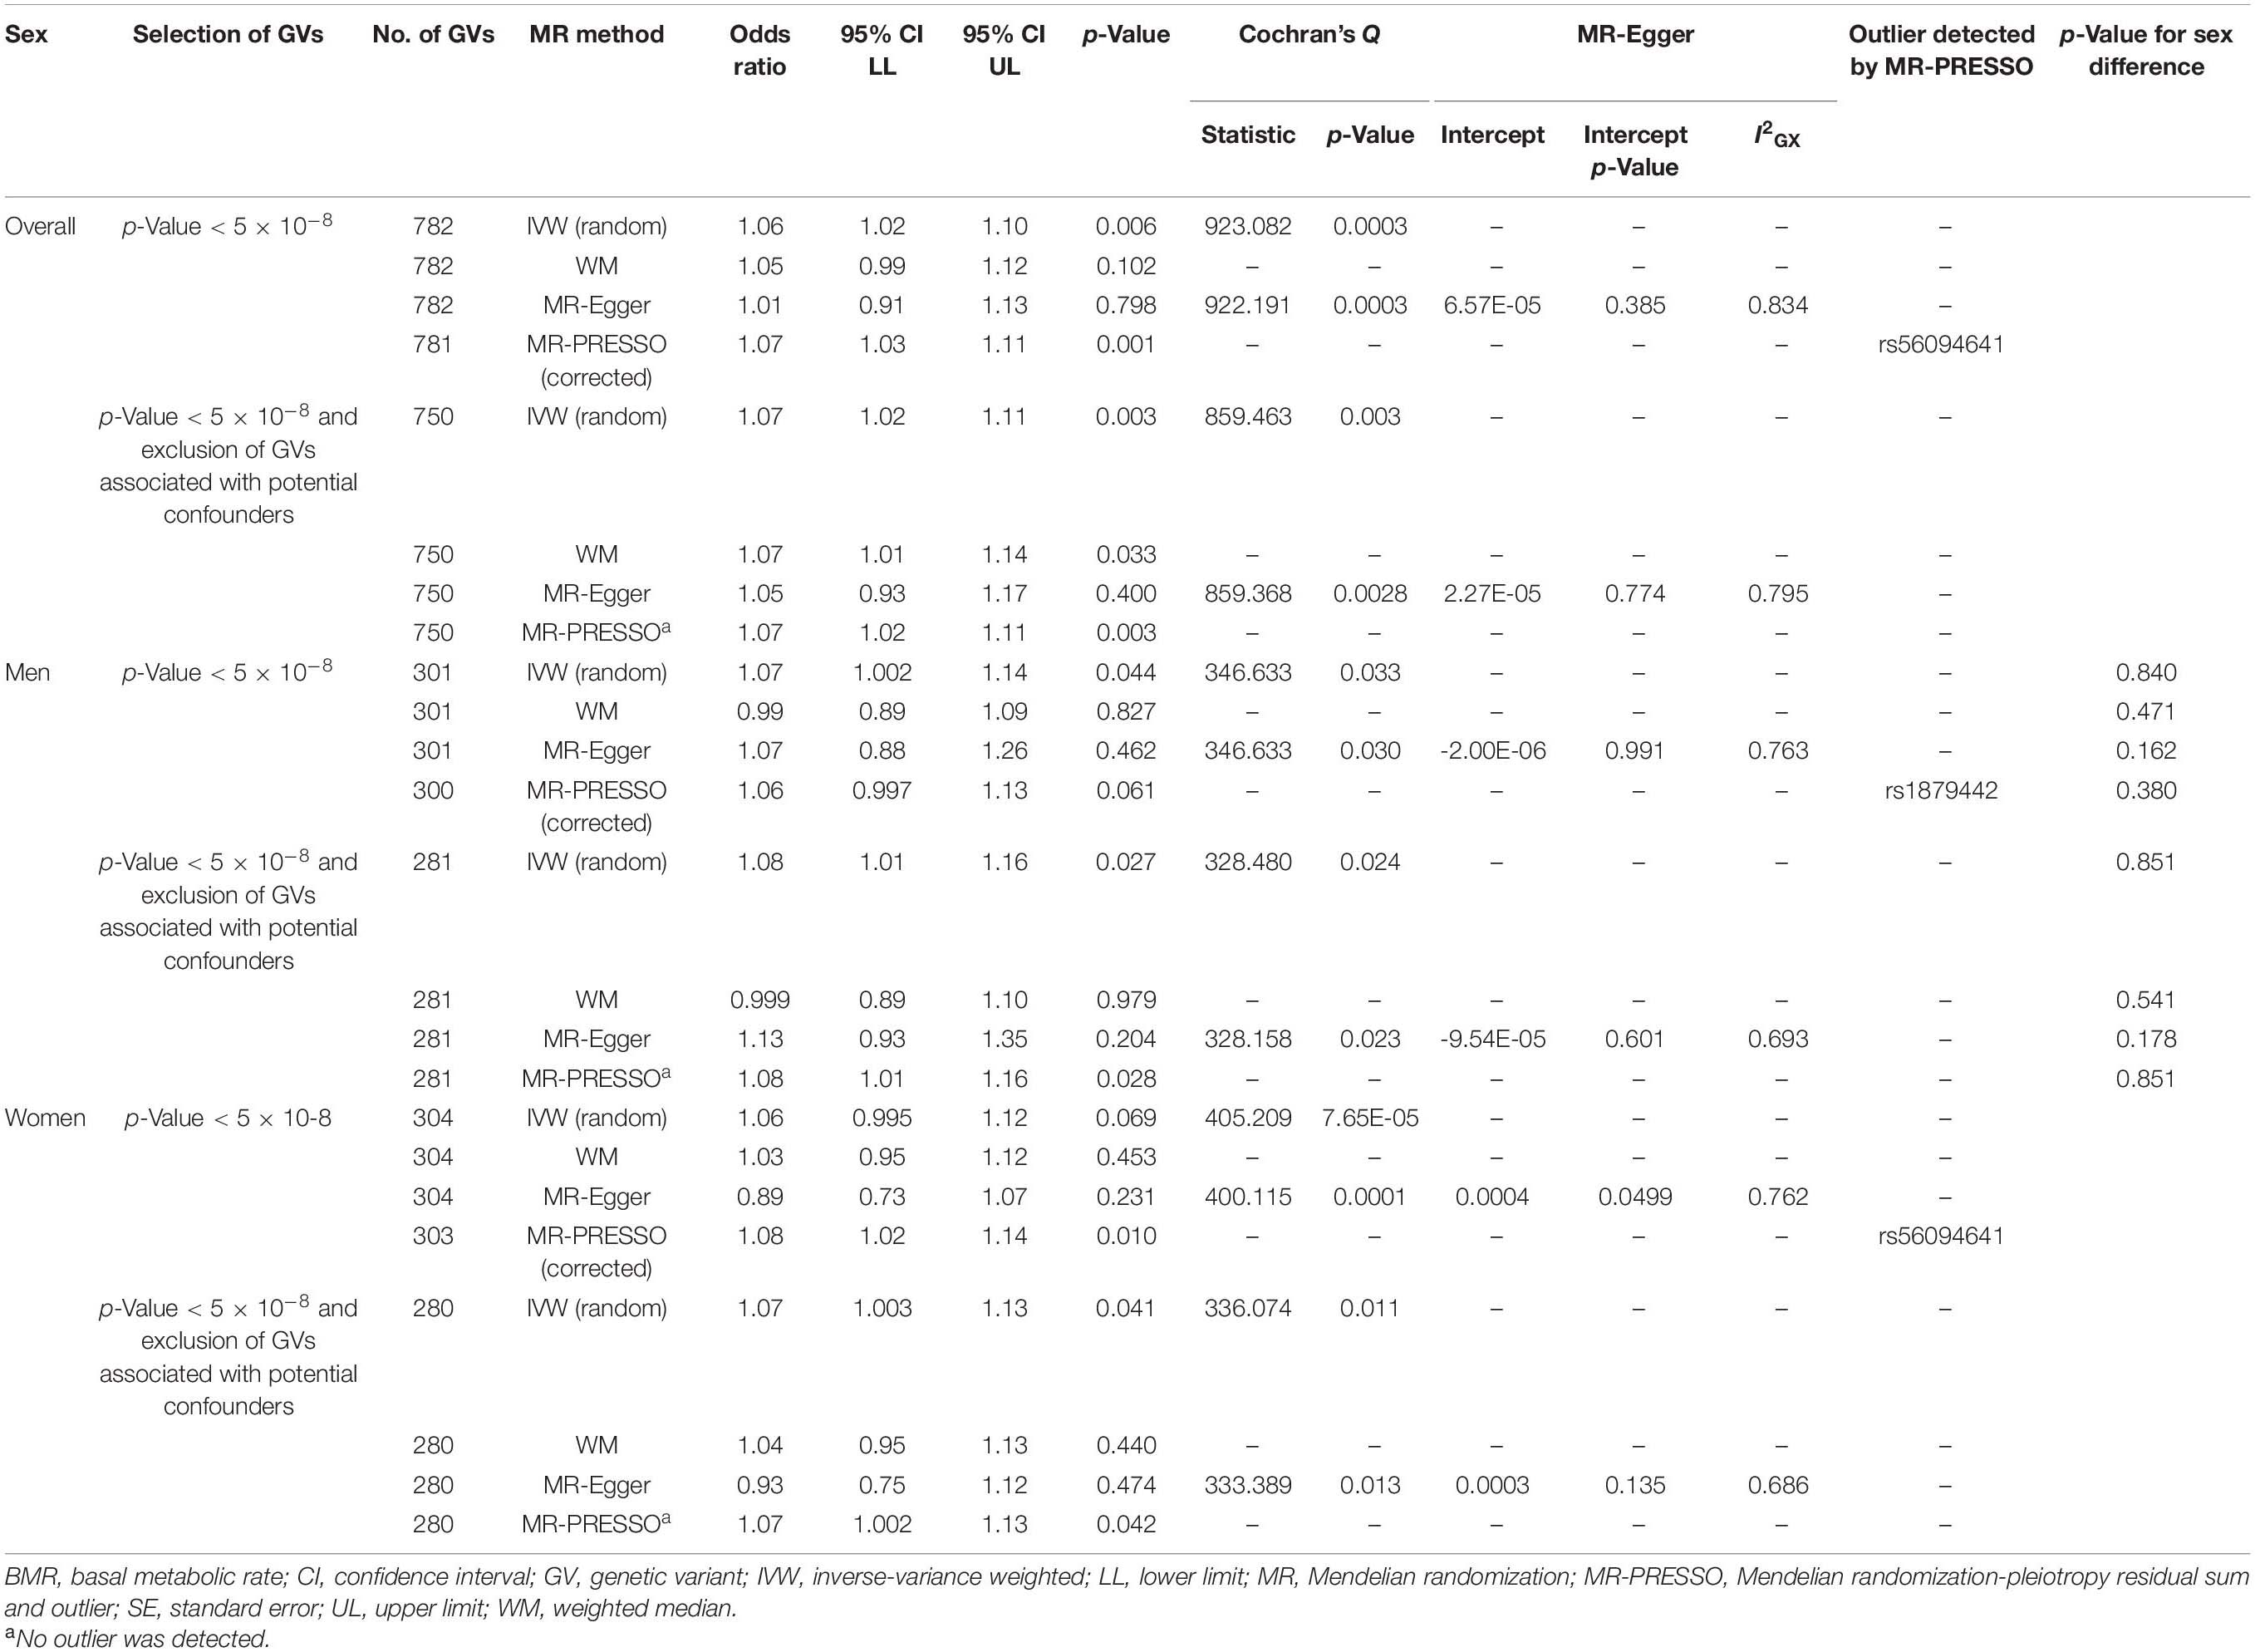
Table 1. Univariable Mendelian randomization association of basal metabolic rate with cancer.
In sex-specific analysis, estimates were similar to the overall estimates and by sex (Table 1). Other MR methods with inclusion/exclusion of GVs associated with potential confounders generally showed a positive association. Only the MR-Egger intercept test for the analysis without exclusion of GVs associated with potential confounders in women showed evidence of directional pleiotropy.
In multivariable MR, BMR was positively associated with cancer after adjusting for IGF1 overall and in women but not in men (Table 2). MR-Egger and inclusion/exclusion of GVs associated with potential confounders showed directionally similar results. No MR-Egger intercept showed evidence of directional pleiotropy.
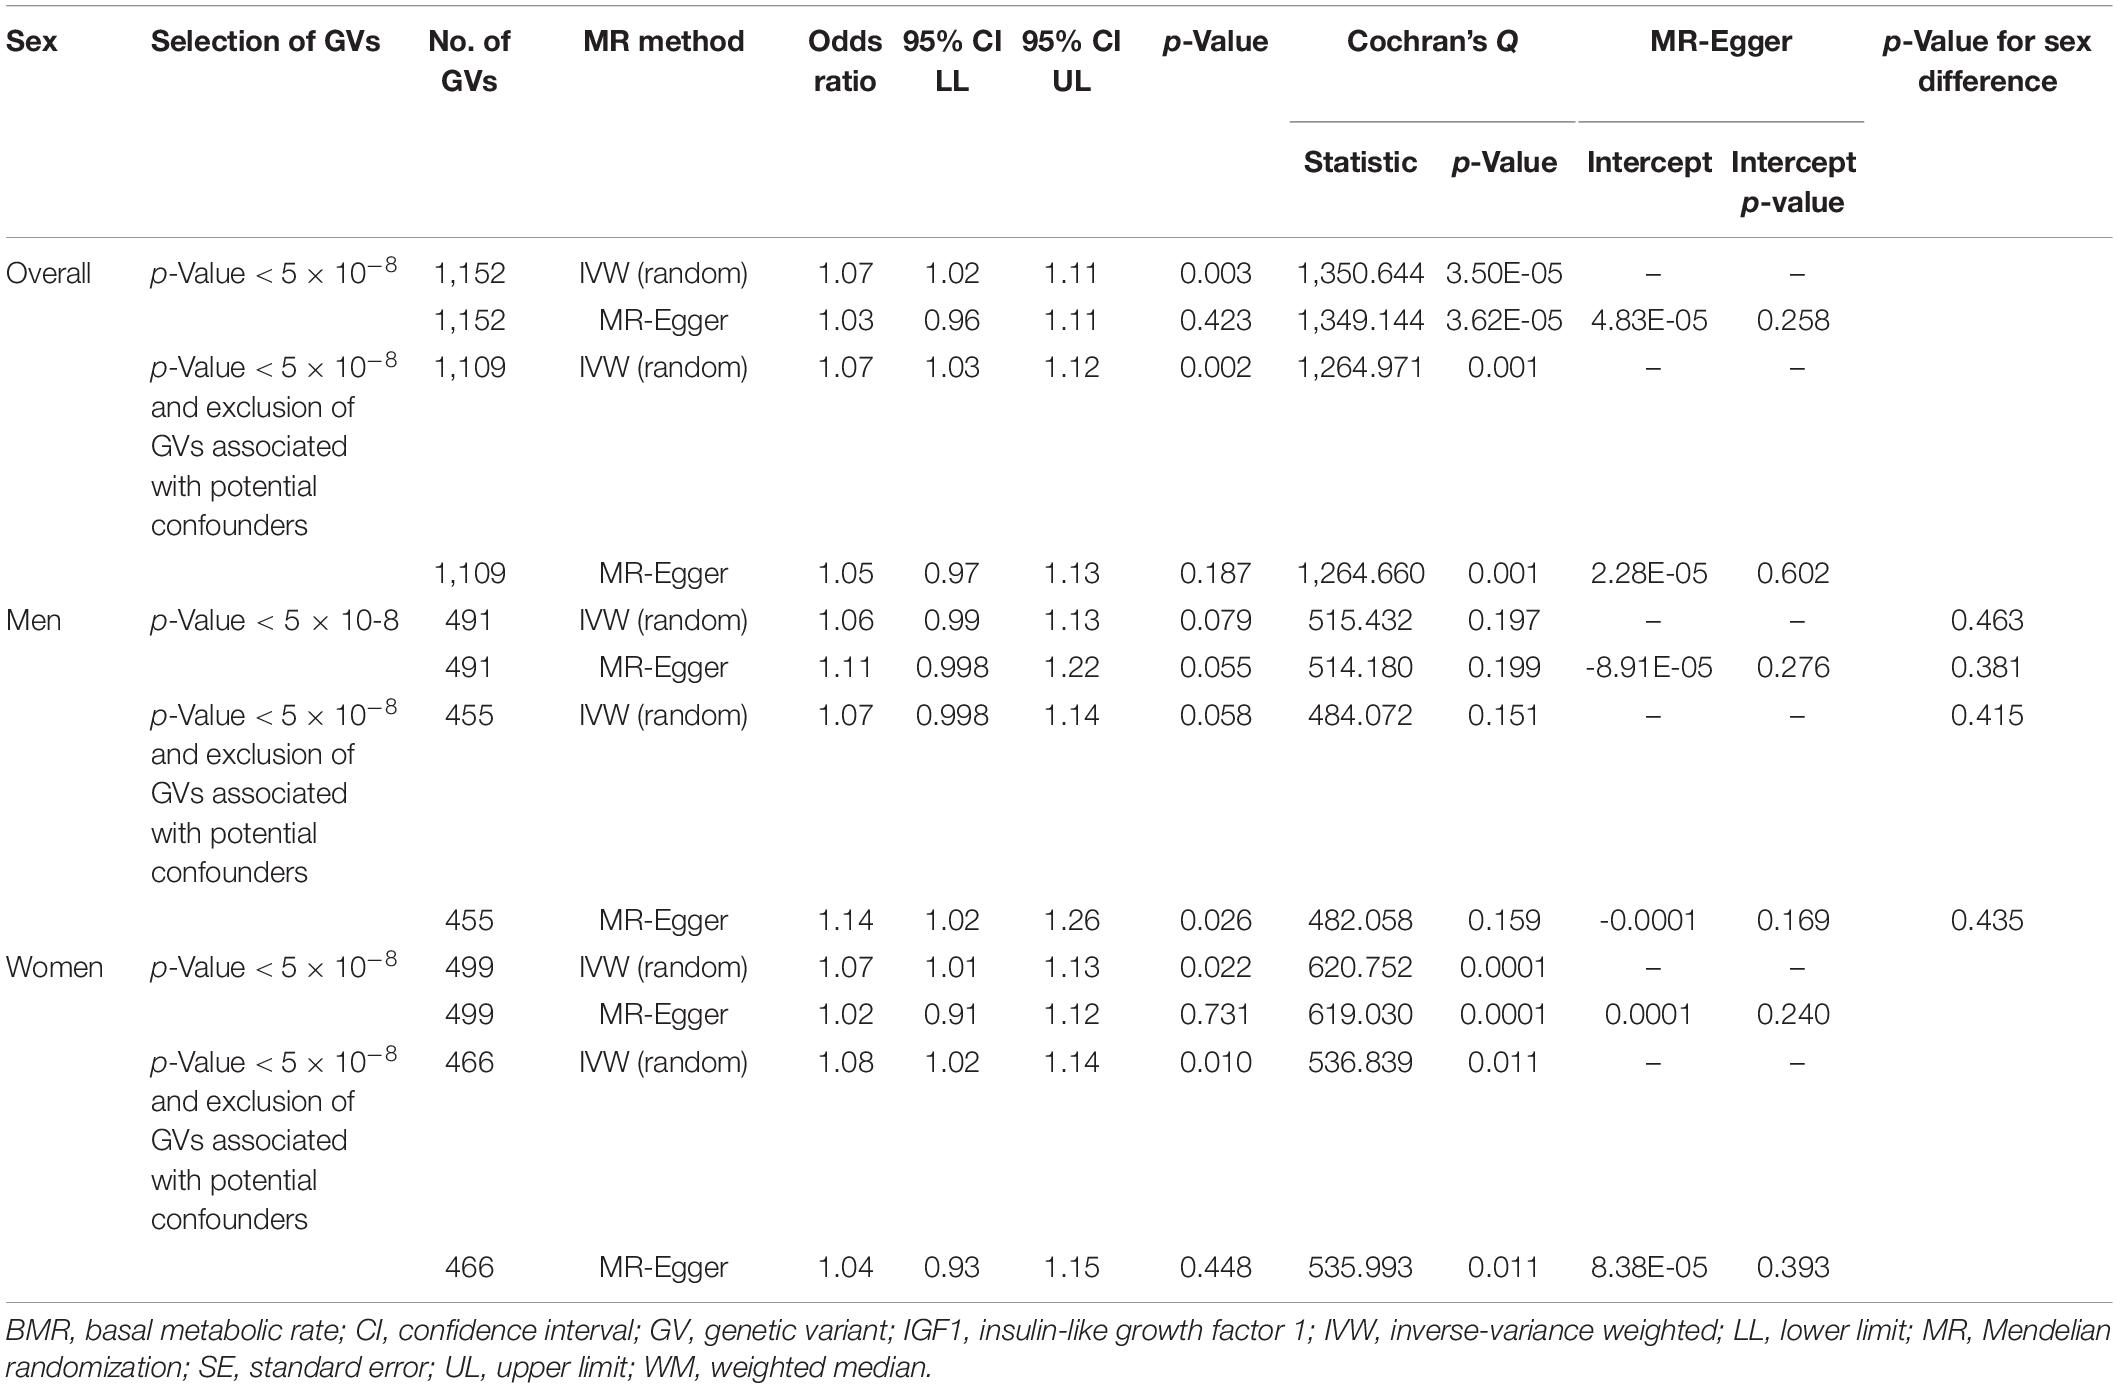
Table 2. Multivariable Mendelian randomization association of basal metabolic rate with cancer adjusted for insulin-like growth factor 1.
Genetic Associations of Basal Metabolic Rate With Neoplasm
BMR was positively associated with neoplasm overall, in men, and in women, with similar estimates (Table 3). Other MR methods and inclusion/exclusion of GVs associated with potential confounders showed directionally similar results. No MR-Egger intercept showed evidence of directional pleiotropy. BMR was positively associated with overall neoplasm using the contamination mixture method (odds ratio, 1.12; 95% confidence interval, 1.06 to 1.18). Exclusion of GVs associated with potential confounders showed directionally similar results.
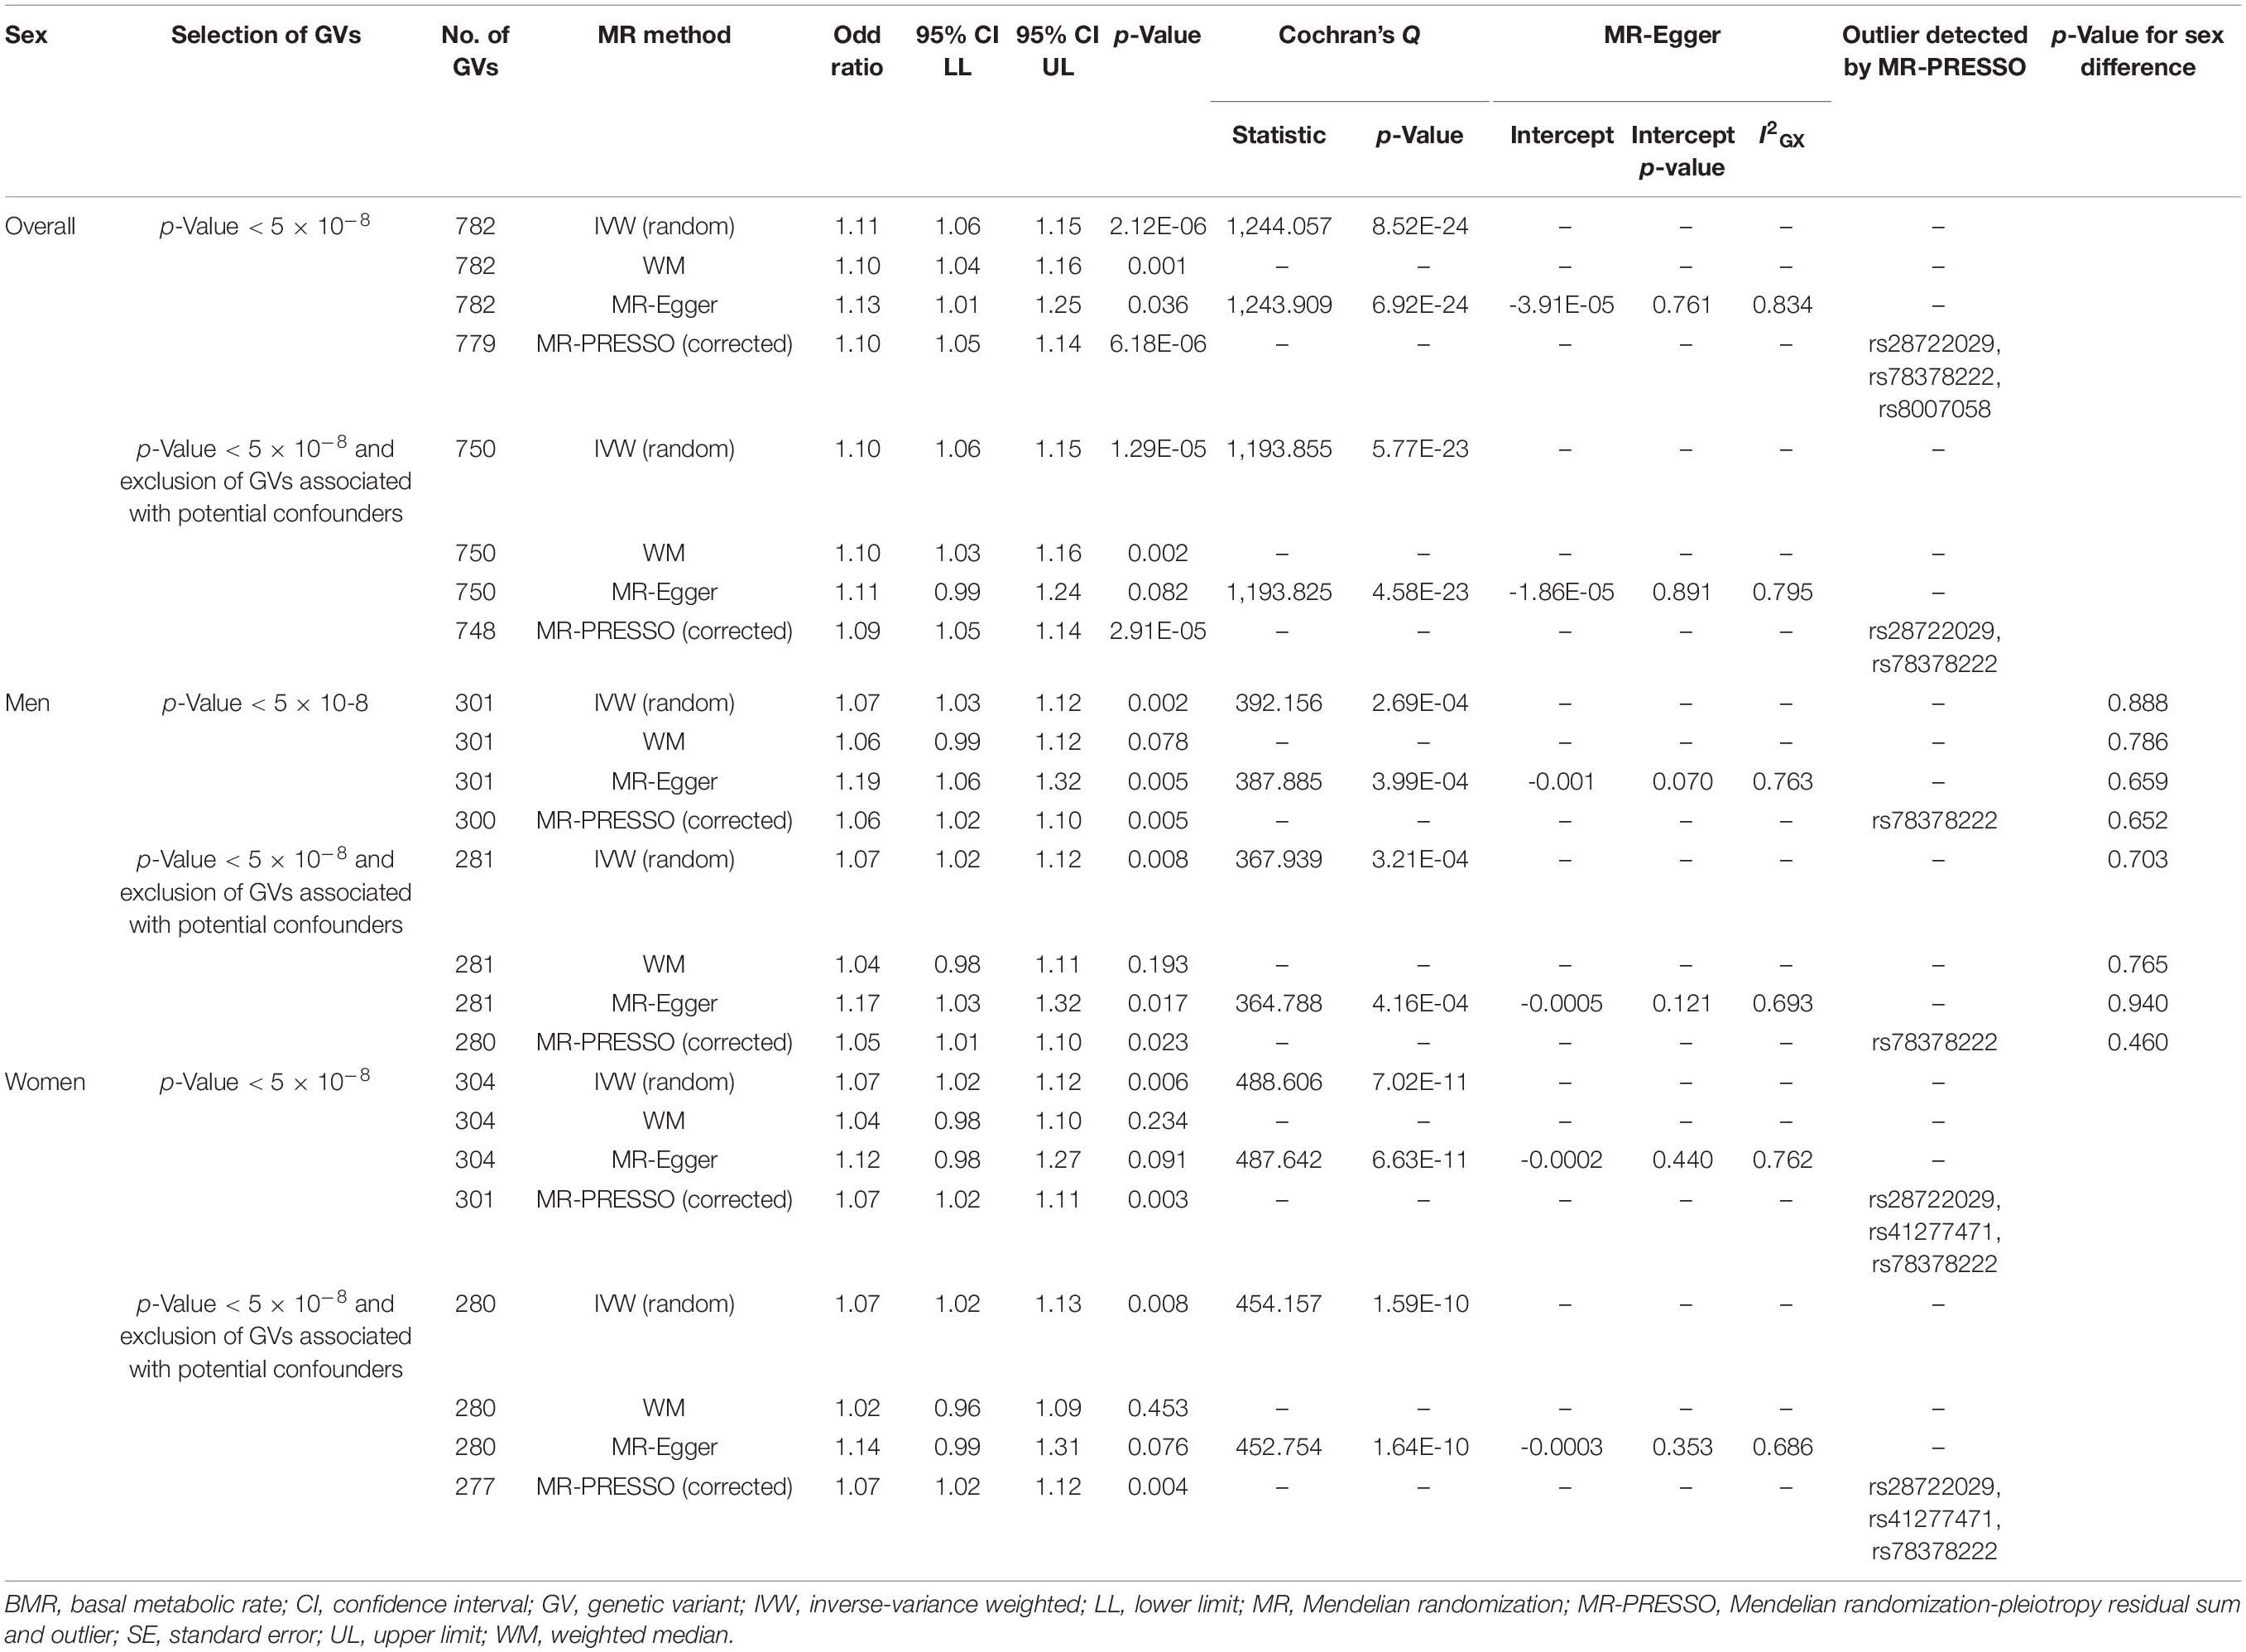
Table 3. Univariable Mendelian randomization association of basal metabolic rate with neoplasm.
In multivariable MR, BMR was consistently positively associated with neoplasm after adjusting for IGF1 overall, in men, and in women (Table 4). MR-Egger and inclusion/exclusion of GVs associated with potential confounders showed directionally similar results. No MR-Egger intercept showed evidence of directional pleiotropy.
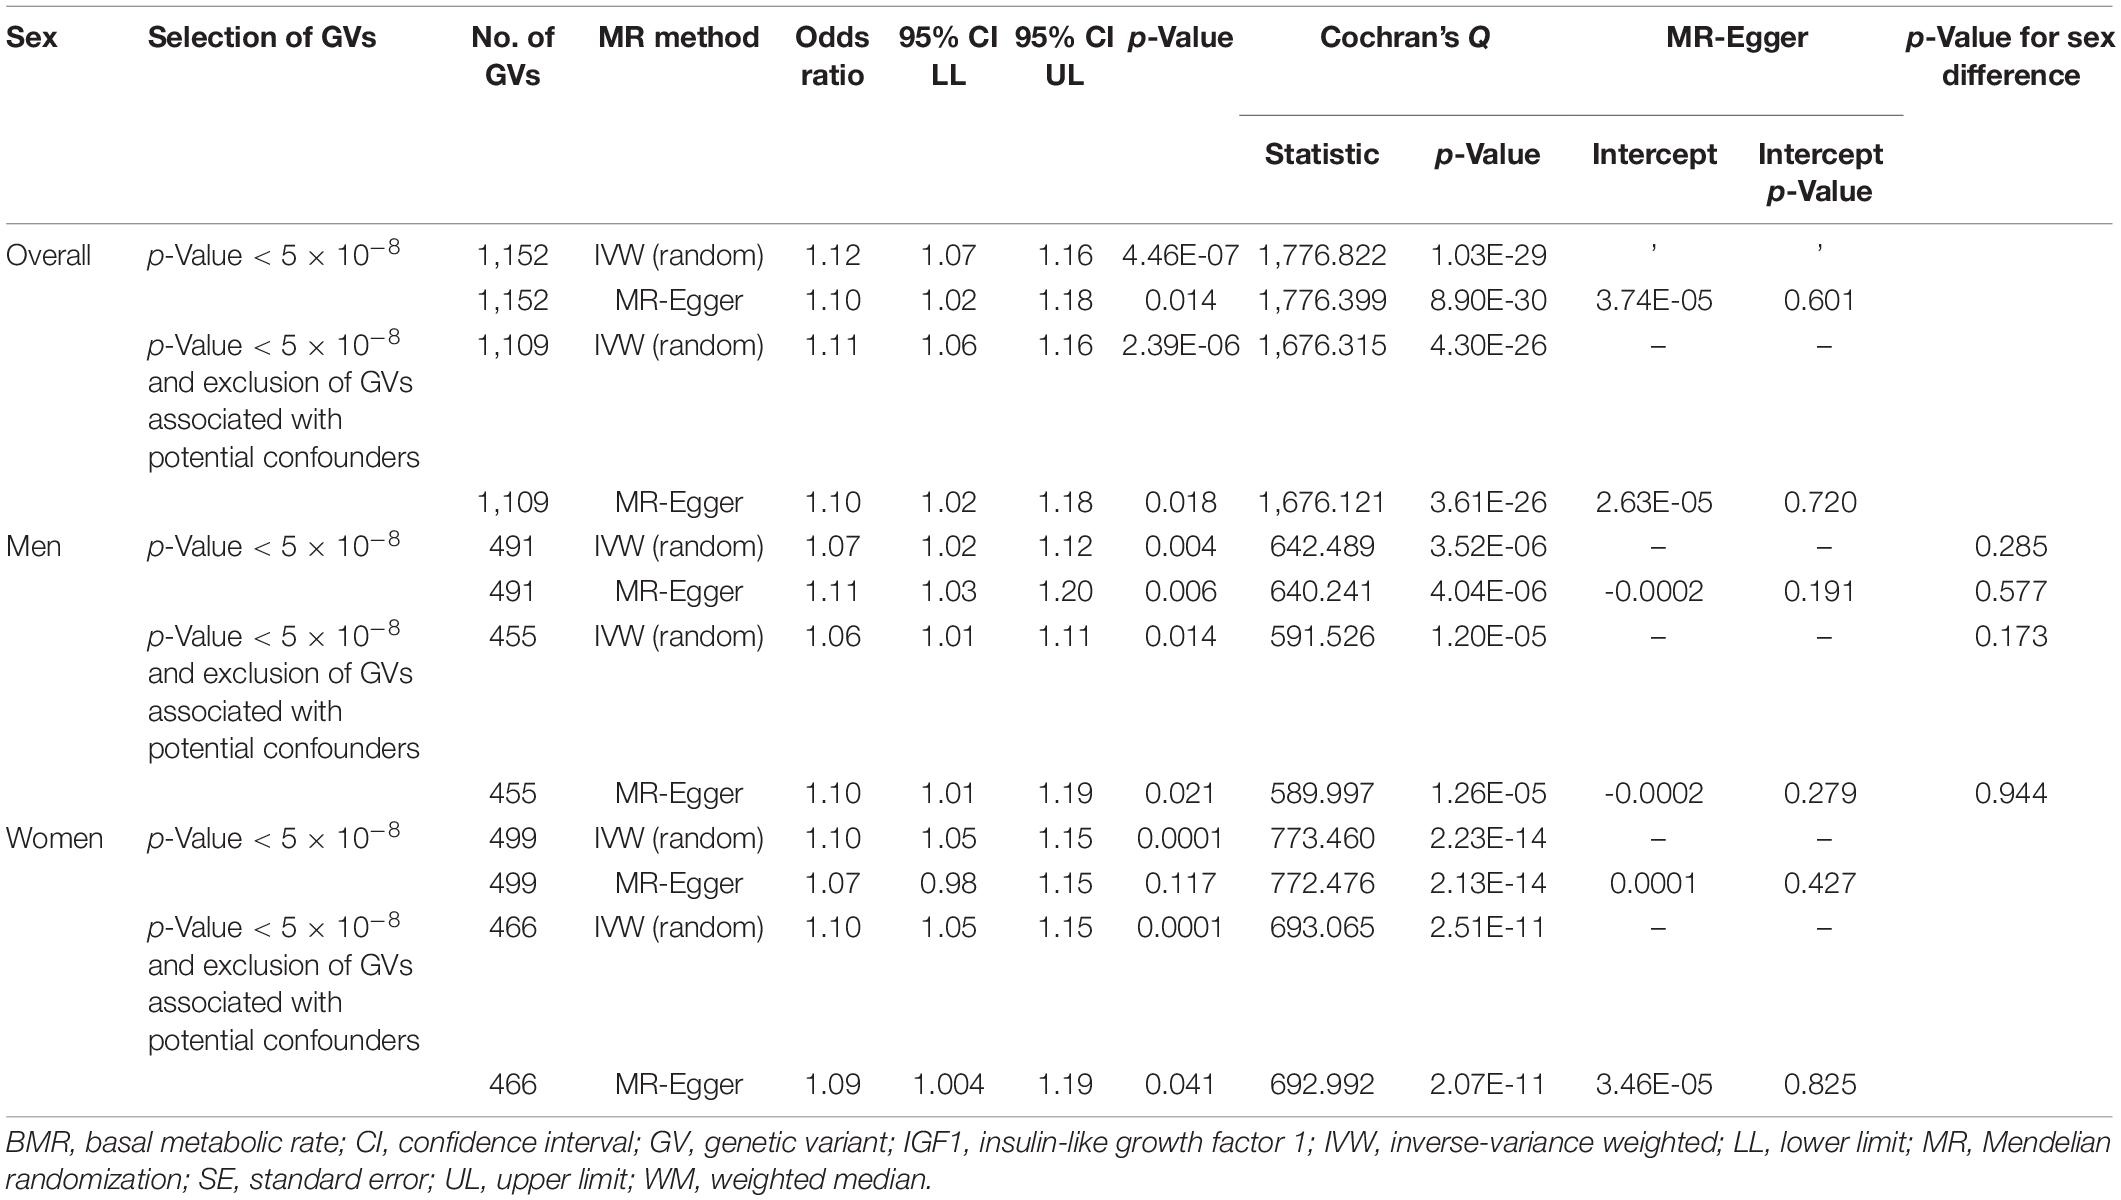
Table 4. Multivariable Mendelian randomization association of basal metabolic rate with neoplasm adjusted for insulin-like growth factor 1.
Genetic Associations of Basal Metabolic Rate With Site-Specific Cancers
Among the 13 cancer sites in the UK Biobank, BMR was positively associated with cancer of urinary organs, cancer of respiratory system and intrathoracic organs, cancer of primary lymphoid and hematopoietic tissue, and cancer of genital organs in women (Supplementary Table 8). For all these four cancer types, multivariable MR adjusted for IGF1 showed consistent results (Supplementary Table 9).
BMR was not associated with breast cancer in BCAC or with prostate cancer in PRACTICAL Consortium (Supplementary Table 8). For all these two cancer types, multivariable MR analysis adjusted for IGF1 showed consistent results (Supplementary Table 9).
Discussion
BMR was positively associated with cancer, consistent with theoretical expectations and previous observational and MR studies, which also suggested BMR as a risk factor or a causal risk factor of some cancers (Cornish et al., 2020; Kliemann et al., 2020). We also showed that BMR was related to benign tumors, and these associations were independent of IGF1.
Mendelian Randomization Assumptions
A valid MR relies on three key assumptions. First, GVs must be strongly associated with the exposure. We chose GVs associated with BMR at genome-wide association significance. The F-statistic of all GVs was >10, which provides assurance that a weak instrument is unlikely (Bowden et al., 2016b). Using genetic instruments selecting using a lower p-value cutoff (1 × 10⁻⁵) gave similar results (data not shown). Second, the GVs must not be associated with the confounders of the exposure-outcome association. Though this assumption cannot be tested completely, we examined the association between the GVs and some of the important potential confounders including lifestyle and socioeconomic status. Sensitivity analysis through excluding GVs associated with these potential confounders gave mostly consistent results. Third, GVs must only exert its effect on the outcome through affecting the exposure but not via other pathways, i.e., no horizontal pleiotropy and no selection bias. We used MR-PRESSO to detect and exclude GVs that exhibited directional pleiotropy. Since IGF1 and BMR are highly correlated exposures, where IGF1 can affect BMR (Swanson and Dantzer, 2014), we conducted multivariable MR to take into account the effect of GVs on cancer via IGF1 by adjusting for IGF1 (Burgess and Thompson, 2015; Sanderson et al., 2019), and the results were consistent. We cannot exclude the possibility that for some cancers, inevitable selection of survivors of BMR, the cancer in question, and other common causes of the survival and the cancer in question may bias the estimates (Schooling et al., 2021).
Limitations of Study
Some limitations in the current MR study are worth mentioning. First, we conducted the two-sample MR analysis using the same sample from the UK Biobank for exposures and outcomes. In the presence of weak instruments, overlapping samples in two-sample MR could result in bias toward the observational association (Burgess et al., 2016). However, the bias is proportional to the inverse of the F-statistics (Burgess et al., 2016), which were all > 10. Second, population stratification might have introduced confounding due to heterogeneity in allele frequencies between populations. However, the underlying population of the current MR study was restricted to individuals of white British ancestry, and the underlying studies address population stratification by principal component analysis. Third, cancer can be lethal so the study is open to selection bias from the inevitable selection only of survivors. Selecting only survivors of BMR and a specific cancer might attenuate or reverse estimates for cancers that are lethal at young ages, such as breast cancer, where a substantial proportion of breast cancer and breast cancer deaths occur at the age of 25 to 49 years in women in the UK (Cancer Research UK, 2021a), which could explain the null association of BMR with breast cancer in the UK Biobank, with an average age at recruitment of approximately 57 years (UK Biobank, 2020), and the null association in BCAC, where the women may be even older at recruitment (Zhang et al., 2020) as reflected by smaller estimates. A recent MR study has shown that hyperthyroidism, which raises BMR (Mullur et al., 2014), increased the risk of breast cancer, with magnitude also greater in the UK Biobank than BCAC (Yuan et al., 2020). Selecting only survivors of BMR and a competing risk of a specific cancer which might attenuate or reverse estimates for cancers that entailing survival to older ages, such as prostate cancer (Cancer Research UK, 2021b), where we observed a null association of BMR with prostate cancer in the UK Biobank and an insignificant inverse association in the PRACTICAL Consortium. The inclusion of a secondary outcome, neoplasm, which includes the less-lethal benign tumor, could serve as a validation to the results. As expected, the estimates were larger for the association of BMR with neoplasm than that for cancer using different MR methods. The larger number of cases of neoplasm (> 70,000) also allowed more consistent associations of BMR with neoplasm. Fourth, canalization, which refers to the adaptive change in genetics due to the disease, might have occurred. However, it generally biases estimates toward null (Zheng et al., 2017) and evaluation of such impact is currently not possible. Fifth, reverse causation, i.e., cancer increases BMR, may be the case. However, the mass of a cancer is unlikely to be large enough to influence BMR (Nguyen et al., 2016). Sixth, we assumed a linear association between BMR and cancer. Using summary data only, we were unable to assess any non-linear association.
Possible Biological Mechanisms
Faster metabolism has been suggested to play an important role in cancer development. During cell metabolism, reactive oxygen species are generated as a toxic by-product (Ruggiero et al., 2008; Maciak and Michalak, 2015), which activates mutational process when in excess. More active metabolism per se increases the rate of genetic mutations (Maciak and Michalak, 2015) and the chance of tumor formation (Boddy et al., 2015). Cancer risk may increase when these overwhelming mutational events cannot be hedged by somatic maintenance such as DNA repair (Aktipis and Nesse, 2013; Boddy et al., 2015; Maciak and Michalak, 2015) and tissue repair (Aktipis and Nesse, 2013). Higher BMR may also compromise immunity (Maciak and Michalak, 2015), which has also been suggested to link with higher cancer risk (Aktipis and Nesse, 2013; Boddy et al., 2015; Maciak and Michalak, 2015).
Clinical Relevance
A number of factors determine BMR, including age (Ruggiero et al., 2008; Sanchez Lopez de Nava and Raja, 2020), sex (Ruggiero et al., 2008; Jagim et al., 2019; Sanchez Lopez de Nava and Raja, 2020), ethnicity (Sanchez Lopez de Nava and Raja, 2020), lifestyle attributes like physical exercise and diet (Sanchez Lopez de Nava and Raja, 2020), and diseases like cancer (Sanchez Lopez de Nava and Raja, 2020). BMR may also be affected by body composition (Jagim et al., 2019). BMR is higher at younger ages (Ruggiero et al., 2008), in men (Ruggiero et al., 2008; Jagim et al., 2019), and in individuals with more lean body mass (Ruggiero et al., 2008; Jagim et al., 2019), similar to IGF1 (Murphy et al., 2020a). Physical activity is considered beneficial in protecting against cancer (Lugo et al., 2019). An MR study has also shown that accelerometer-measured physical activity was inversely associated with breast cancer and colorectal cancer (Papadimitriou et al., 2020). However, not all forms of physical activity affect BMR. A systematic review and meta-analysis has reported that resistant training but not aerobic exercise increases BMR (MacKenzie-Shalders et al., 2020). In rats, resistance training increases AMP-activated protein kinase level in rats (An et al., 2016), where activation of AMP-activated protein kinase inhibits mechanistic/mammalian target of rapamycin signaling which in turns suppresses cancer cell growth (Li et al., 2015). The effect of a particular type of physical activity on cancer risk through regulation of BMR requires further investigation.
Restricting caloric intake has been proposed to reduce BMR (Mole, 1990) and the effect may be independent of reduction in IGF1 (Kazemi et al., 2020). On the other hand, high protein intake increases IGF1 (Kazemi et al., 2020). Caloric restriction is beneficial in preventing cancer occurrence (Meynet and Ricci, 2014). Higher BMR was associated with higher mortality risk in a cohort study in the United States (Ruggiero et al., 2008). These findings are in line with evolutionary biology perspective that dietary restriction of specific pattern extends longevity (Soultoukis and Partridge, 2016), possibly through prevention of cancer, a major determinant of lifespan (Boddy et al., 2015). Hyperinsulinemia has been suggested as a risk factor of cancer (Vigneri et al., 2020), partly due to mitogenic effects (Vigneri et al., 2020). Notably, insulin raises free IGF1 (Vigneri et al., 2020), which in turn increases BMR (Swanson and Dantzer, 2014).
Conclusion
Overall, our results suggest that higher BMR might cause a higher cancer risk. Intervening on modifiable targets like diet and physical exercise may help reduce the burden of this life-threatening disease by reducing BMR.
Data Availability Statement
Publicly available datasets were analyzed in this study. This data can be found here: Website of the Breast Cancer Association Consortium (http://bcac.ccge.medschl.cam.ac.uk/) website of the Neale Lab (http://www.nealelab.is/uk-biobank/) website of the Prostate Cancer Association Group to Investigate Cancer Associated Alterations in the Genome Consortium (http://practical.icr.ac.uk/blog/).
Ethics Statement
The studies involving human participants were reviewed and approved by the original studies (UK Biobank and genome-wide association studies). The current Mendelian randomization study used only publicly available summary data, with no original data collected. Written informed consent for participation was not required for this study in accordance with the national legislation and the institutional requirements.
Author Contributions
CMS: conceptualization, formal analysis, supervision, and writing – review and editing. JCMN: formal analysis, writing – original draft, and writing – review and editing. Both authors contributed to the article and approved the submitted version.
Conflict of Interest
The authors declare that the research was conducted in the absence of any commercial or financial relationships that could be construed as a potential conflict of interest.
Publisher’s Note
All claims expressed in this article are solely those of the authors and do not necessarily represent those of their affiliated organizations, or those of the publisher, the editors and the reviewers. Any product that may be evaluated in this article, or claim that may be made by its manufacturer, is not guaranteed or endorsed by the publisher.
Acknowledgments
We acknowledge the use of summary-level data from the BCAC, Neale Lab, and PRACTICAL Consortium.
Supplementary Material
The Supplementary Material for this article can be found online at: https://www.frontiersin.org/articles/10.3389/fgene.2021.735541/full#supplementary-material
Supplementary Table 1 | Study details for site-specific cancers.
Supplementary Table 2 | Association of genetic variants predicting basal metabolic rate with cancer, neoplasm, and site-specific cancers.
Supplementary Table 3 | F-statistics for the association of basal metabolic rate and insulin-like growth factor 1 with cancer, neoplasm, and site-specific cancers.
Supplementary Table 4 | Genetic variants predicting basal metabolic rate that were associated with potential confounders at Bonferroni significance.
Supplementary Table 5 | Association of genetic variants predicting insulin-like growth factor 1 with cancer, neoplasm, and site-specific cancers.
Supplementary Table 6 | Genetic variants predicting insulin-like growth factor 1 that were associated with potential confounders at Bonferroni significance.
Supplementary Table 7 | Conditional F-statistics for the association of basal metabolic rate and insulin-like growth factor 1 with cancer, neoplasm, and site-specific cancers.
Supplementary Table 8 | Univariable Mendelian randomization association of basal metabolic rate with site-specific cancers.
Supplementary Table 9 | Multivariable Mendelian randomization association of basal metabolic rate with site-specific cancers adjusted for insulin-like growth factor 1.
Abbreviations
BCAC, Breast Cancer Association Consortium; BMR, basal metabolic rate; GV, genetic variant; GWAS, genome-wide association study; IGF1, insulin-like growth factor 1; MR, Mendelian randomization; MR-PRESSO, Mendelian randomization-pleiotropy residual sum and outlier; PRACTICAL, Prostate Cancer Association Group to Investigate Cancer Associated Alterations in the Genome.
References
Aktipis, C. A., and Nesse, R. M. (2013). Evolutionary foundations for cancer biology. Evol. Appl. 6, 144–159. doi: 10.1111/eva.12034
An, J. H., Yoon, J. H., Suk, M. H., and Shin, Y. A. (2016). Up-regulation of lipolysis genes and increased production of AMP-activated protein kinase protein in the skeletal muscle of rats after resistance training. J. Exerc. Rehabil. 12, 163–170. doi: 10.12965/jer.1632578.289
Anonymous. (2021). Online Sample Size and Power Calculator for Mendelian Randomization with a Binary Outcome. Available online at: https://sb452.shinyapps.io/power/ (accessed February 11, 2021).
Boddy, A. M., Kokko, H., Breden, F., Wilkinson, G. S., and Aktipis, C. A. (2015). Cancer susceptibility and reproductive trade-offs: a model of the evolution of cancer defences. Philos. Trans. R. Soc. Lond. B Biol. Sci. 370:20140220. doi: 10.1098/rstb.2014.0220
Bowden, J., Davey Smith, G., Haycock, P. C., and Burgess, S. (2016a). Consistent estimation in mendelian randomization with some invalid instruments using a weighted median estimator. Genet. Epidemiol. 40, 304–314. doi: 10.1002/gepi.21965
Bowden, J., Del Greco, M. F., Minelli, C., Davey Smith, G., Sheehan, N. A., and Thompson, J. R. (2016b). Assessing the suitability of summary data for two-sample Mendelian randomization analyses using MR-Egger regression: the role of the I2 statistic. Int. J. Epidemiol. 45, 1961–1974. doi: 10.1093/ije/dyw220
Burgess, S., and Thompson, S. G. (2015). Multivariable Mendelian randomization: the use of pleiotropic genetic variants to estimate causal effects. Am. J. Epidemiol. 181, 251–260. doi: 10.1093/aje/kwu283
Burgess, S., and Thompson, S. G. (2017). Interpreting findings from Mendelian randomization using the MR-Egger method. Eur. J. Epidemiol. 32, 377–389. doi: 10.1007/s10654-017-0255-x
Burgess, S., Davies, N. M., and Thompson, S. G. (2016). Bias due to participant overlap in two-sample Mendelian randomization. Genet. Epidemiol. 40, 597–608. doi: 10.1002/gepi.21998
Burgess, S., Scott, R. A., Timpson, N. J., Davey Smith, G., Thompson, S. G., and Consortium, E.-I. (2015). Using published data in Mendelian randomization: a blueprint for efficient identification of causal risk factors. Eur. J. Epidemiol. 30, 543–552. doi: 10.1007/s10654-015-0011-z
Cancer Research UK. (2021a). Cancer Mortality by Age. Available online at: https://www.cancerresearchuk.org/health-professional/cancer-statistics/mortality/age (accessed February 11, 2021).
Cancer Research UK. (2021b). Prostate Cancer Statistics. Available online at: https://www.cancerresearchuk.org/health-professional/cancer-statistics/statistics-by-cancer-type/prostate-cancer (accessed February 11, 2021).
Cornish, A. J., Law, P. J., Timofeeva, M., Palin, K., Farrington, S. M., Palles, C., et al. (2020). Modifiable pathways for colorectal cancer: a mendelian randomisation analysis. Lancet Gastroenterol. Hepatol. 5, 55–62. doi: 10.1016/S2468-1253(19)30294-8
Del Greco, M. F., Foco, L., Pichler, I., Eller, P., Eller, K., Benyamin, B., et al. (2017). Serum iron level and kidney function: a Mendelian randomization study. Nephrol. Dial. Transplant. 32, 273–278. doi: 10.1093/ndt/gfw215
Fieller, E. C. (1954). Some problems in interval estimation. J. R. Stat. Soc. Series B Stat. Methodol. 16, 175–185. doi: 10.1111/j.2517-6161.1954.tb00159.x
Freeman, G., Cowling, B. J., and Schooling, C. M. (2013). Power and sample size calculations for Mendelian randomization studies using one genetic instrument. Int. J. Epidemiol. 42, 1157–1163. doi: 10.1093/ije/dyt110
Hemani, G., Zheng, J., Elsworth, B., Wade, K. H., Haberland, V., Baird, D., et al. (2018). The MR-Base platform supports systematic causal inference across the human phenome. eLife. 7:e34408. doi: 10.7554/eLife.34408
Jagim, A. R., Camic, C. L., Askow, A., Luedke, J., Erickson, J., Kerksick, C. M., et al. (2019). Sex differences in resting metabolic rate among athletes. J. Strength Cond. Res. 33, 3008–3014. doi: 10.1519/JSC.0000000000002813
Kazemi, A., Speakman, J. R., Soltani, S., and Djafarian, K. (2020). Effect of calorie restriction or protein intake on circulating levels of insulin like growth factor I in humans: a systematic review and meta-analysis. Clin. Nutr. 39, 1705–1716. doi: 10.1016/j.clnu.2019.07.030
Kliemann, N., Murphy, N., Viallon, V., Freisling, H., Tsilidis, K. K., Rinaldi, S., et al. (2020). Predicted basal metabolic rate and cancer risk in the European Prospective Investigation into Cancer and Nutrition. Int. J. Cancer 147, 648–661. doi: 10.1002/ijc.32753
Lampe, J. W. (2020). Diet and Cancer Prevention Research: From Mechanism to Implementation. J. Cancer Prev. 25, 65–69. doi: 10.15430/JCP.2020.25.2.65
Larsson, S. C., Carter, P., Vithayathil, M., Kar, S., Mason, A. M., and Burgess, S. (2020). Insulin-like growth factor-1 and site-specific cancers: a Mendelian randomization study. Cancer Med. 9, 6836–6842. doi: 10.1002/cam4.3345
Li, W., Saud, S. M., Young, M. R., Chen, G., and Hua, B. (2015). Targeting Ampk for cancer prevention and treatment. Oncotarget 6, 7365–7378. doi: 10.18632/oncotarget.3629
Lloyd-Jones, L. R., Robinson, M. R., Yang, J., and Visscher, P. M. (2018). Transformation of summary statistics from linear mixed model association on all-or-none traits to odds ratio. Genetics 208, 1397–1408. doi: 10.1534/genetics.117.300360
Lugo, D., Pulido, A. L., Mihos, C. G., Issa, O., Cusnir, M., Horvath, S. A., et al. (2019). The effects of physical activity on cancer prevention, treatment and prognosis: a review of the literature. Complement Ther. Med. 44, 9–13. doi: 10.1016/j.ctim.2019.03.013
Maciak, S., and Michalak, P. (2015). Cell size and cancer: a new solution to Peto’s paradox? Evol. Appl. 8, 2–8. doi: 10.1111/eva.12228
MacKenzie-Shalders, K., Kelly, J. T., So, D., Coffey, V. G., and Byrne, N. M. (2020). The effect of exercise interventions on resting metabolic rate: a systematic review and meta-analysis. J. Sports Sci. 38, 1635–1649. doi: 10.1080/02640414.2020.1754716
Meynet, O., and Ricci, J. E. (2014). Caloric restriction and cancer: molecular mechanisms and clinical implications. Trends Mol. Med. 20, 419–427. doi: 10.1016/j.molmed.2014.05.001
Mole, P. A. (1990). Impact of energy intake and exercise on resting metabolic rate. Sports Med. 10, 72–87. doi: 10.2165/00007256-199010020-00002
Mullur, R., Liu, Y. Y., and Brent, G. A. (2014). Thyroid hormone regulation of metabolism. Physiol. Rev. 94, 355–382. doi: 10.1152/physrev.00030.2013
Murphy, N., Carreras-Torres, R., Song, M., Chan, A. T., Martin, R. M., Papadimitriou, N., et al. (2020a). Circulating levels of Insulin-Like Growth Factor 1 and Insulin-Like Growth Factor Binding Protein 3 associate with risk of colorectal cancer based on serologic and Mendelian randomization analyses. Gastroenterology 158, 1300–1312.e20. doi: 10.1053/j.gastro.2019.12.020
Murphy, N., Knuppel, A., Papadimitriou, N., Martin, R. M., Tsilidis, K. K., Smith-Byrne, K., et al. (2020b). Insulin-like growth factor-1, insulin-like growth factor-binding protein-3, and breast cancer risk: observational and Mendelian randomization analyses with approximately 430 000 women. Ann. Oncol. 31, 641–649. doi: 10.1016/j.annonc.2020.01.066
Neale Lab. (2018). Ukbb Gwas Imputed V3 - File Manifest Release 20180731. Available online at: http://www.nealelab.is/uk-biobank/ (accessed February 11, 2021).
Nguyen, T. Y., Batterham, M. J., and Edwards, C. (2016). Comparison of resting energy expenditure between cancer subjects and healthy controls: a meta-analysis. Nutr. Cancer 68, 374–387. doi: 10.1080/01635581.2016.1153667
Palmer, T. M., Sterne, J. A., Harbord, R. M., Lawlor, D. A., Sheehan, N. A., Meng, S., et al. (2011). Instrumental variable estimation of causal risk ratios and causal odds ratios in Mendelian randomization analyses. Am. J. Epidemiol. 173, 1392–1403. doi: 10.1093/aje/kwr026
Papadimitriou, N., Dimou, N., Tsilidis, K. K., Banbury, B., Martin, R. M., Lewis, S. J., et al. (2020). Physical activity and risks of breast and colorectal cancer: a Mendelian randomisation analysis. Nat. Commun. 11:597. doi: 10.1038/s41467-020-14389-8
Paternoster, R., Brame, R., Mazerolle, P., and Piquero, A. (1998). Using the correct statistical test for the equality of regression coefficients. Criminology 36, 859–866.
Rees, J. M. B., Wood, A. M., and Burgess, S. (2017). Extending the MR-Egger method for multivariable Mendelian randomization to correct for both measured and unmeasured pleiotropy. Stat. Med. 36, 4705–4718. doi: 10.1002/sim.7492
Ruggiero, C., Metter, E. J., Melenovsky, V., Cherubini, A., Najjar, S. S., Ble, A., et al. (2008). High basal metabolic rate is a risk factor for mortality: the Baltimore Longitudinal Study of Aging. J. Gerontol. A Biol. Sci. Med. Sci. 63, 698–706. doi: 10.1093/gerona/63.7.698
Sanchez Lopez de Nava, A., and Raja, A. (2020). Physiology, Metabolism. Available online at: https://www.ncbi.nlm.nih.gov/pubmed/31536296 (accessed February 11, 2021).
Sanderson, E., Davey Smith, G., Windmeijer, F., and Bowden, J. (2019). An examination of multivariable Mendelian randomization in the single-sample and two-sample summary data settings. Int. J. Epidemiol. 48, 713–727. doi: 10.1093/ije/dyy262
Saunders, C. N., Cornish, A. J., Kinnersley, B., Law, P. J., Claus, E. B., Il’yasova, D., et al. (2020). Lack of association between modifiable exposures and glioma risk: a Mendelian randomization analysis. Neuro Oncol. 22, 207–215. doi: 10.1093/neuonc/noz209
Schooling, C. M. (2017). Tachykinin neurokinin 3 receptor antagonists: a new treatment for cardiovascular disease? Lancet. 390, 709–711. doi: 10.1016/S0140-6736(16)31648-8
Schooling, C. M., Lopez, P. M., Yang, Z., Zhao, J. V., Au Yeung, S. L., and Huang, J. V. (2021). Use of multivariable mendelian randomization to address biases due to competing risk before recruitment. Front. Genet. 11:610852. doi: 10.3389/fgene.2020.610852
Schumacher, F. R., Al Olama, A. A., Berndt, S. I., Benlloch, S., Ahmed, M., Saunders, E. J., et al. (2018). Association analyses of more than 140,000 men identify 63 new prostate cancer susceptibility loci. Nat. Genet. 50, 928–936. doi: 10.1038/s41588-018-0142-8
Slob, E. A. W., and Burgess, S. (2020). A comparison of robust Mendelian randomization methods using summary data. Genet. Epidemiol. 44, 313–329. doi: 10.1002/gepi.22295
Smith, G. D., and Ebrahim, S. (2003). ‘Mendelian randomization’: can genetic epidemiology contribute to understanding environmental determinants of disease? Int. J. Epidemiol. 32, 1–22. doi: 10.1093/ije/dyg070
Soultoukis, G. A., and Partridge, L. (2016). Dietary protein, metabolism, and aging. Annu. Rev. Biochem. 85, 5–34. doi: 10.1146/annurev-biochem-060815-014422
Sudlow, C., Gallacher, J., Allen, N., Beral, V., Burton, P., Danesh, J., et al. (2015). UK biobank: an open access resource for identifying the causes of a wide range of complex diseases of middle and old age. PLoS Med. 12:e1001779. doi: 10.1371/journal.pmed.1001779
Swanson, E. M., and Dantzer, B. (2014). Insulin-like growth factor-1 is associated with life-history variation across mammalia. Proc. Biol. Sci. 281:20132458. doi: 10.1098/rspb.2013.2458
UK Biobank. (2020). Ukb : Data-Field 21022. Available online at: https://biobank.ndph.ox.ac.uk/ukb/field.cgi?id=21022 (accessed February 11, 2021).
Verbanck, M., Chen, C. Y., Neale, B., and Do, R. (2018). Detection of widespread horizontal pleiotropy in causal relationships inferred from Mendelian randomization between complex traits and diseases. Nat. Genet. 50, 693–698. doi: 10.1038/s41588-018-0099-7
Vigneri, R., Sciacca, L., and Vigneri, P. (2020). Rethinking the relationship between insulin and cancer. Trends Endocrinol. Metab. 31, 551–560. doi: 10.1016/j.tem.2020.05.004
Wald, A. (1940). The fitting of straight lines if both variables are subject to error. Ann. Math. Statist. 11, 284–300. doi: 10.1214/aoms/1177731868
Watts, E. L., Fensom, G. K., Smith Byrne, K., Perez-Cornago, A., Allen, N. E., Knuppel, A., et al. (2021). Circulating insulin-like growth factor-i. total and free testosterone concentrations and prostate cancer risk in 200 000 men in UK Biobank. Int. J. Cancer. 148, 2274–2288. doi: 10.1002/ijc.33416
Wells, J. C. K., Nesse, R. M., Sear, R., Johnstone, R. A., and Stearns, S. C. (2017). Evolutionary public health: introducing the concept. Lancet 390, 500–509. doi: 10.1016/S0140-6736(17)30572-X
Werner, H., and Laron, Z. (2020). Role of the Gh-Igf1 system in progression of cancer. Mol. Cell. Endocrinol. 518:111003. doi: 10.1016/j.mce.2020.111003
World Health Organization. (2018). Cancer. Available online at: https://www.who.int/news-room/fact-sheets/detail/cancer (accessed April 13, 2020).
Yavorska, O. O., and Burgess, S. (2017). Mendelianrandomization: an R package for performing Mendelian randomization analyses using summarized data. Int. J. Epidemiol. 46, 1734–1739. doi: 10.1093/ije/dyx034
Yuan, S., Kar, S., Vithayathil, M., Carter, P., Mason, A. M., Burgess, S., et al. (2020). Causal associations of thyroid function and dysfunction with overall, breast and thyroid cancer: a two-sample Mendelian randomization study. Int. J. Cancer 147, 1895–1903. doi: 10.1002/ijc.32988
Zhang, H., Ahearn, T. U., Lecarpentier, J., Barnes, D., Beesley, J., Qi, G., et al. (2020). Genome-wide association study identifies 32 novel breast cancer susceptibility loci from overall and subtype-specific analyses. Nat. Genet. 52, 572–581. doi: 10.1038/s41588-020-0609-2
Keywords: cancer, Mendelian randomization, basal metabolic rate, metabolism, evolutionary biology
Citation: Ng JCM and Schooling CM (2021) Effect of Basal Metabolic Rate on Cancer: A Mendelian Randomization Study. Front. Genet. 12:735541. doi: 10.3389/fgene.2021.735541
Received: 02 July 2021; Accepted: 16 August 2021;
Published: 09 September 2021.
Edited by:
Kristina Allen-Brady, The University of Utah, United StatesReviewed by:
Xiao Chang, Children’s Hospital of Philadelphia, United StatesMartha Guevara-Cruz, Instituto Nacional de Ciencias Médicas y Nutrición Salvador Zubirán (INCMNSZ), Mexico
Copyright © 2021 Ng and Schooling. This is an open-access article distributed under the terms of the Creative Commons Attribution License (CC BY). The use, distribution or reproduction in other forums is permitted, provided the original author(s) and the copyright owner(s) are credited and that the original publication in this journal is cited, in accordance with accepted academic practice. No use, distribution or reproduction is permitted which does not comply with these terms.
*Correspondence: C. Mary Schooling, Y21zMUBoa3UuaGs=; bWFyeS5zY2hvb2xpbmdAc3BoLmN1bnkuZWR1; orcid.org/0000-0001-9933-5887