 Roberta Cavalcante Cracco1
 Fernando de Oliveira Bussiman2
 Guilherme Henrique Gebim Polizel1
 Édison Furlan1
 Nara Pontes Garcia2
 Diego Angelo Schmidt Poit3
 Guilherme Pugliesi3
 Miguel Henrique de Almeida Santana1*
- 1Department of Animal Science, College of Animal Science and Food Engineering – USP, Pirassununga, Brazil
- 2Departament of Veterinary Medicine, College of Animal Science and Food Engineering – USP, Pirassununga, Brazil
- 3Department of Animal Reproduction, College of Veterinary Medicine and Animal Science - USP, Pirassununga, Brazil
Maternal nutrition during pregnancy influences postnatal life of animals; nevertheless, few studies have investigated its effects on the productive performance and reproductive development of heifers. This study evaluated the performance, reproductive development, and correlation between reproduction × fat thickness and performance × ribeye area (REA) traits of heifers. We also performed an exploratory genomic association during the rearing period in heifers submitted to fetal programming. The study comprised 55 Nellore heifers born to dams exposed to one of the following nutritional planes: control, without protein-energy supplementation; PELT, protein-energy last trimester, protein-energy supplementation offered in the final third of pregnancy; and PEWG, protein-energy whole gestation, protein-energy supplementation upon pregnancy confirmation. Protein-energy supplementation occurred at the level of 0.3% live weight. After weaning, heifers were submitted to periodic evaluations of weight and body composition by ultrasonography. From 12 to 18 months, we evaluated the reproductive tract of heifers to monitor its development for sexual precocity and ovarian follicle population. The treatments had no effect (p > 0.05) on average daily gain; however, the weight of the animals showed a significant difference over time (p = 0.017). No differences were found between treatments for REA, backfat, and rump fat thickness, nor for puberty age, antral follicular count, and other traits related to reproductive tract development (p > 0.05). The correlation analysis between performance traits and REA showed high correlations (r > 0.37) between REA at weaning and year versus weight from weaning until yearling; however, no correlation was found for reproductive development traits versus fat thickness (p > 0.05). The exploratory genomic association study showed one single-nucleotide polymorphism (SNP) for each treatment on an intergenic region for control and PEWG, and the one for PELT on an intronic region of RAPGEF1 gene. Maternal nutrition affected only the weight of the animals throughout the rearing period.
1 Introduction
The concept of fetal programming has emerged in recent decades and is used to explain metabolic and systemic changes due to events during fetal life (Barker, 1990). Nutritional changes, such as over- or under-nutrition, may occur with the mother and result in fetal programming, as reported by several studies (Wu et al., 2006; Long et al., 2009; Duarte et al., 2014). Systemic changes due to maternal nutrition include low birth weight, hormonal imbalances, and changes in organ development and functionality (Long et al., 2009; Micke et al., 2010a).
Moreover, studies show that fetal programming affects the reproductive system of both genders (Funston and Summers, 2013; Mossa et al., 2013; Mossa et al., 2017; Polizel et al., 2021). Other studies (Martin et al., 2007; Funston et al., 2010a) report the effects of nutrition during pregnancy on sexual precocity and pregnancy rate in heifers as well as on the reproductive potential of heifers in ovarian follicular reserve, even without changing other phenotypic characteristics (Mossa et al., 2013). Puberty is one of the most important periods for heifers, since it directly affects their productive, reproductive, and economic efficiency (Monteiro et al., 2013). The production of precocious animals is desirable, mainly to reduce the use of resources.
In Brazil, dams commonly undergo nutritional restriction due to the dry season present in tropical and subtropical conditions, especially during the second and third trimesters of pregnancy; therefore, investigations of undernutrition effects on progenies are needed to seek viable alternatives to overcome nutrient restriction during dry periods. In addition, few studies have investigated the effects of fetal programming on the performance of heifers in the rearing phase (Micke et al., 2010a; Long et al., 2012; Noya et al., 2019; Long et al., 2021).
The post-weaning period is crucial for the reproductive development of heifers, since the animals need to reach adequate body weight to attain puberty rapidly and then become replacement heifers or ready for finishing and slaughter. This study assessed the performance, reproductive development, and correlation between traits of heifers. We also performed an exploratory genomic association study during the rearing period in heifers submitted to different planes of maternal nutrition, with the objective of showing possible genotype–environment interactions, evaluating how individual genetic variants respond to nutritional stimuli. Therefore, our hypothesis is that different prenatal supplementation strategies influence weight gain and reproductive traits and that genetic variants influence the nutritional response in female offspring of Nellore dams.
2 Materials and Methods
2.1 Experimental Design
The study comprised 126 Nellore dams, which were fixed-time artificially inseminated (FTAI) with semen of four bulls with known genetic value, representing the majority of national Nellore animals. After confirmation of pregnancy at 30 days after FTAI, the animals were separated into three treatments: control, without protein-energy supplementation; PELT, protein-energy last trimester, protein-energy supplementation in the final third of pregnancy; and PEWG, protein-energy whole gestation, protein-energy supplementation upon pregnancy confirmation. The 126 animals were homogenized in the groups based on age (3–8 years), parity, body weight, and body condition score (Table 1), in order to make the groups as homogeneous as possible. Animals were allocated to pasture paddocks of Brachiaria brizantha cv. Marandu with access to the supplement (0.03% live weight for control and 0.3% live weight for PELT and PEWG) (Table 2) and water ad libitum. More details can be found on Polizel et al. (2021).
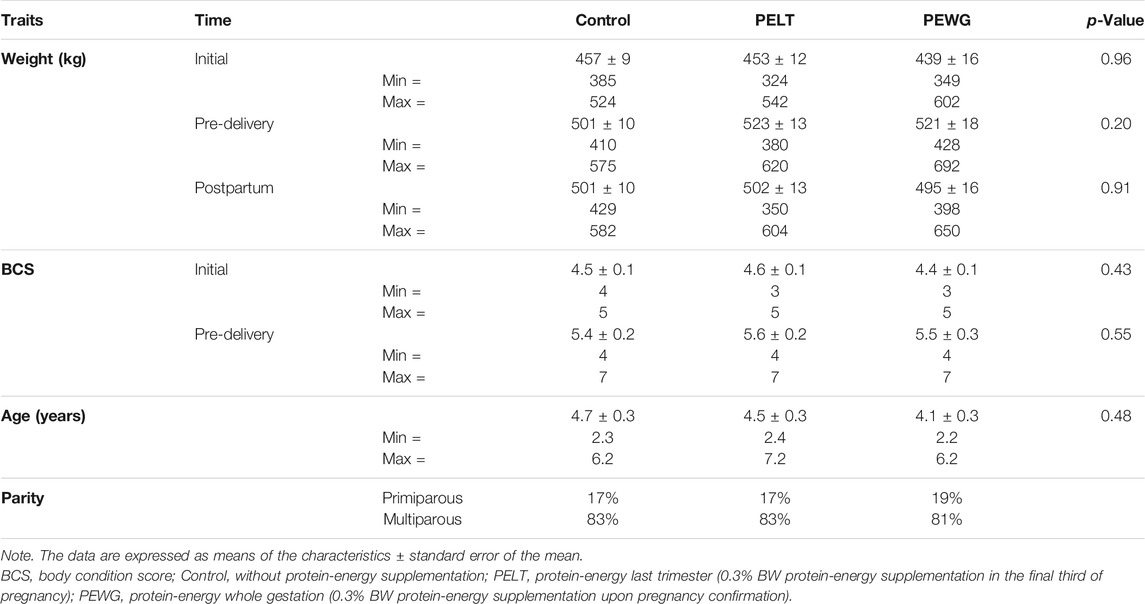
TABLE 1. Weight and BCS of dams on the beginning and end of gestation.
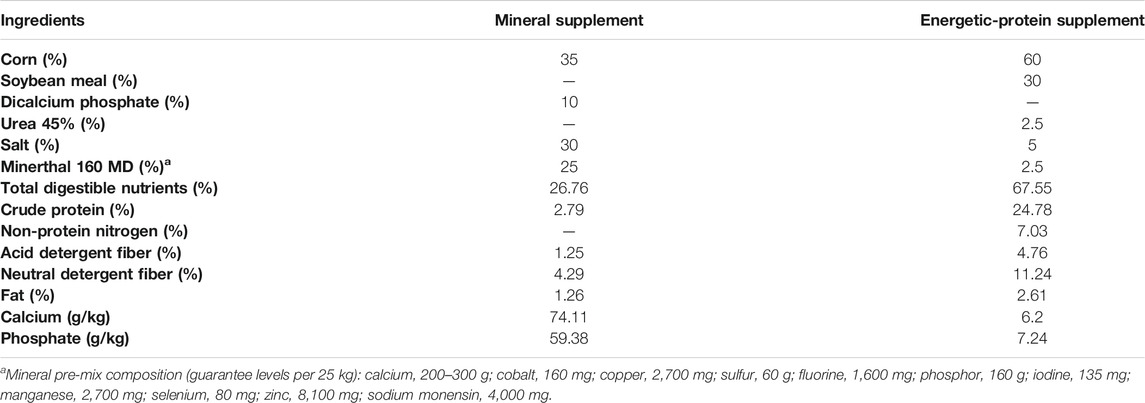
TABLE 2. Ingredients and nutrients content of the dams supplement.
After calving, protein-energy supplementation ceased, and all animals remained together until weaning (average 220 days old), regardless of the treatment. The animals were subjected to the same sanitary, vaccination, and feeding protocols already implemented on the farm where the experiment was conducted. After weaning, the animals were divided by sex, regardless of treatment, and placed in separate pastures, where they remained throughout the breeding. The females remained on the pasture until the beginning of the reproductive season at 24 months. This trial comprised 55 heifers (control = 19, PELT = 22, and PEWG = 14), which were evaluated for reproductive development and performance regularly.
2.2 Reproductive Tract Assessment
The females were evaluated to determine the stage of reproductive development every 30 days from 12 months of age onward. Puberty was characterized based on the presence of corpus luteum (CL), and puberty age referred to the age in days of the animal of the first CL. A single specialized operator used an ultrasound machine equipped with a transrectal transducer (Mindray Z5 VET; Shenzhen Mindray Bio-Medical Electronics Co., Shenzhen, Guangdong, China) to qualify the CL presence. Antral follicle count (AFC) was performed to estimate the ovarian reserve at the same time that the presence of CL occurred, where a single operator visually enumerated the antral follicles ≥3.00 mm. Each ovary was investigated exhaustively throughout to standardize the count, identifying the positions of the antral follicles and capturing images of different sections of the organ. The size of each ovary was measured using its largest diameter, and the average size between the two ovaries was considered for each animal for statistical purposes. The thickness of the endometrial wall was also measured right after the corneal bifurcation during ultrasound, as described by Souza et al. (2011). The tonus and uterine sizes were also accessed through transrectal palpation, assigning scores (tonus = flaccid, minimal tonus or medium tonus; uterine size = infant, small, medium or developed) according to the perception of the evaluator and as proposed by Holm et al. (2009). For the statistical analysis, we used assessments at 12, 15, and 18 months, when evaluations of the reproductive tract ended.
2.3 Performance Evaluation
The performance of animals was evaluated in the periods of weaning, year (12 months), yearling (18 months), and 24 months, measuring weight and average daily gain (ADG). The ultrasound was used to measure ribeye area (REA), backfat thickness (BFT), and rump fat thickness (RFT). Weights were obtained regularly during the rearing period using an electronic scale from Coimma (Coimma Scales, Dracena, São Paulo State, Brazil) coupled to the trunk. The linear regression was performed using all collections between weaning and 24 months, totaling seven collections of weight, to obtain the ADG.
The body composition was evaluated by ultrasound using an Aloka SSD-500 ultrasound equipped with a 17-cm linear transducer at 3.5-MHz frequency (Aloka Co. Ltd., Wallingford, CT, USA). Vegetable oil was used as coupling to optimize the contact of the transducer with the skin of the animals. The REA and BFT were measured by images in sections of the longissimus dorsi muscle, between the 12th and 13th ribs, while the RFT was measured by positioning the transducer in the final portion of the ileum, between the junction of the biceps femoris and the middle gluteal muscle. The images were captured using the Lince software and later analyzed by a certified technician.
2.4 Nutrigenetic Evaluation
The DNA material was obtained from tail hair bulb; DNA extraction from the bulb of these hairs was performed by MICRO LAB ID STARlet® automated robot (Hamilton Company, Reno, NV, USA) using the NucleoSpin® 96 extraction kit (Macherey-Nagel, Düren, Germany). The 55 Nellore heifers were genotyped with the low-density panel GeneSeek® Genomic Profiler Bos Indicus GGP Nellore LD BeadChip containing 35,339 markers; and before the imputation process, all single-nucleotide polymorphism (SNP) arrays had their maps converted to the new ARS UCD 1.2 reference genome. Imputation procedure was implemented using the FIMPUTE 2.2 software (Sargolzaei et al., 2014), and all genotypes were imputed to a panel containing 735,965 markers. A reference population with 2,502 sires and dams genotyped with the Illumina BovineHD BeadChip (Illumina Inc., San Diego, CA, USA) containing 777,962 markers was used. This population contains important and representative sires and dams within the Nellore breed, whose genetic material is widely used in breeding programs. Prior to imputation, samples were edited for call rate (<90%) for the genotyped and the reference populations. SNPs unassigned to any chromosome and those assigned to sexual chromosomes were removed from the dataset. After imputation, accuracy obtained was a mean (SD) of 0.93 (0.02), and genotypes presenting less than 0.90 of imputation accuracy were not considered in further analysis. The relationship degree between the target and reference population, was, on average (SD) of 0.08 (0.01).
We performed the genomic association analysis to understand the nutrigenetic effects of fetal programming, using the imputed SNP panel (35K) for reproductive characteristics (12, 15, and 18 months) and performance (weaning, year, yearling, and 24 months). Statistical information on models used can be found in Nutrigenetics. We used the packages SNPStats (Solé et al., 2006), gdata (Warnes et al., 2017), qvalue, data.table, ggplot2 (Wickham, 2011), and qqman (Turner, 2018). Concerning quality control (QC) for genomic data, all markers on sexual chromosome were removed from analysis, as well as markers with call rate <0.95 (0), with minor allele frequency <0.01 (209,831), p-value from the Hardy–Weinberg equilibrium <1 × 10⁻¹⁰ (26), and monomorphic (86,070). In addition, individuals with call rate <0.90 were also removed. Thus, the final genotypic data were left after QC with 55 individuals and 440,038 markers.
2.5 Statistical Analysis
2.5.1 Phenotypes
All procedures were performed using the MIXED procedure of the statistical package SAS® version 9.4 (SAS Institute Inc., Raleigh, NC, USA). From data obtained, residues were submitted to the Shapiro–Wilk test for normality implemented at UNIVARIATE procedure, where measurements that did not follow normality were transformed using log (i.e., ln(trait + 1)). The homocedasticity of residuals for principal effects was tested in the groups using Levene’s test. Then, the effects of treatments (control, PELT, and PEWG) on phenotypes were evaluated using the ANOVA, and the means were compared by the Tukey–Kramer test, with contrasts considered significant when p < 0.05 and trend when p < 0.10. The age of the animals, age of the dams, and sire were also considered in the linear model. Regarding the repeated measures, the same variables than linear model were considered, and time of data collection was also included in the ANOVA. The covariance structure for the residuals was tested for each variable and chosen based on the Bayesian information criteria (BICs). They were different for each variable, as follows: AFC used variance components (vc); weight used an autoregressive of first order (ar); REA used a compound symmetry structure for the residuals (cs); BFT used a heterogeneous compound symmetry (csh); and RFT used an autoregressive structure with moving average (arma).
For those analyses, the model was as follows:
where
The Kruskal–Wallis test was performed due to the scalar nature of the data collected for the characteristics of tonus and uterine sizes.
2.5.2 Nutrigenetics
For nutrigenetics, two models were implemented through the “LM” function in R to correct the phenotype for the fixed effects, as follows:
where
Under matrix notation, the models can be written as follows:
where
After the solutions for
where
2.5.3 Correlation Between Performance, Body, and Reproductive Characteristics
Pearson’s correlation analysis was performed using the LM function of the statistical environment R to elucidate the relationship between the variables of weight, ADG, REA, BFT, RFT, age at puberty, AFC, ovary size, and endometrium thickness.
3 Results
On repeated measures, the interaction between time and treatment was not statistically significant for all studied traits (p > 0.05), but time was significant (p < 0.05) in all of them.
3.1 Weight and Average Daily Gain/Performance at Rearing Phase
The heifer’s weight in the three treatments was similar in all periods evaluated (p > 0.05); however, when an analysis was carried out over time, a significant difference occurred among the treatments (p = 0.017), where control was heavier and differed from the others. The ADG of the period showed no statistical difference between treatments (p > 0.05) with homogeneous weight gain (Table 3).
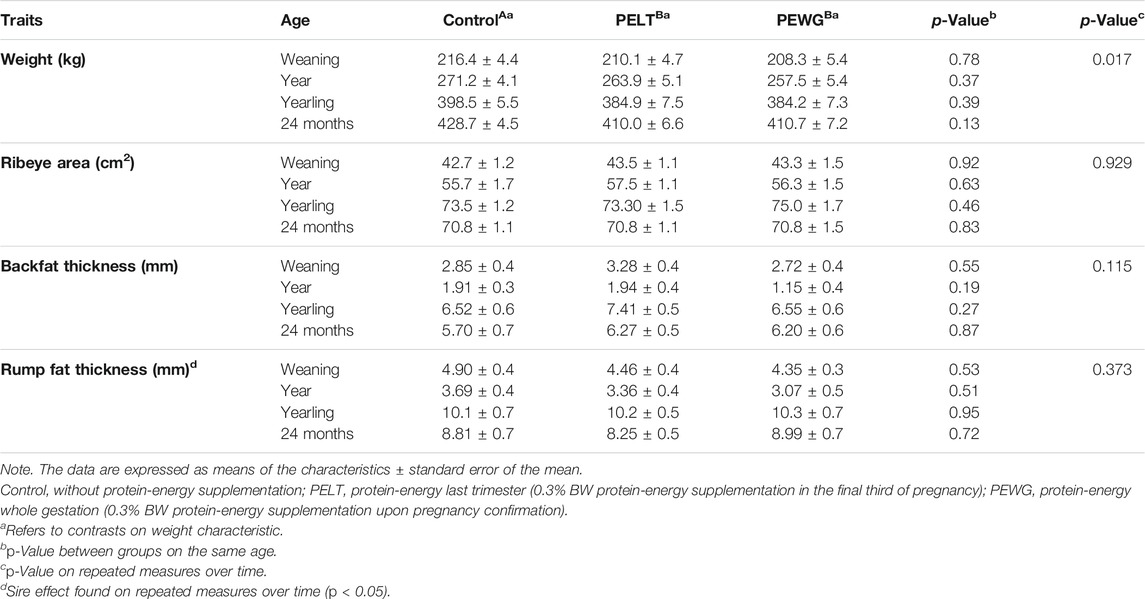
TABLE 3. Performance traits of Nellore heifers submitted to fetal programming.
3.2 Fat Thickness and Ribeye Area
The body traits measured by ultrasound had no differences in the periods (p > 0.05), not even when the analysis was performed for repeated measurements over time, showing homogeneous fat and muscle deposition in these locations. However, in the RFT measurements, a difference related to a sire effect was found (p < 0.01) (Table 3).
3.3 Reproduction Traits
Puberty age and AFC of the treatments showed no significant differences between periods or over time (p > 0.05). There was no significant difference for ovary size and endometrial thickness in the periods and in the repeated measurements over time. However, ovary size had a significant difference for the age of animals (12, 15, and 18 months) (p < 0.05). The uterine size and tonus classificatory variables also displayed no differences between treatments (p > 0.05) (Table 4).
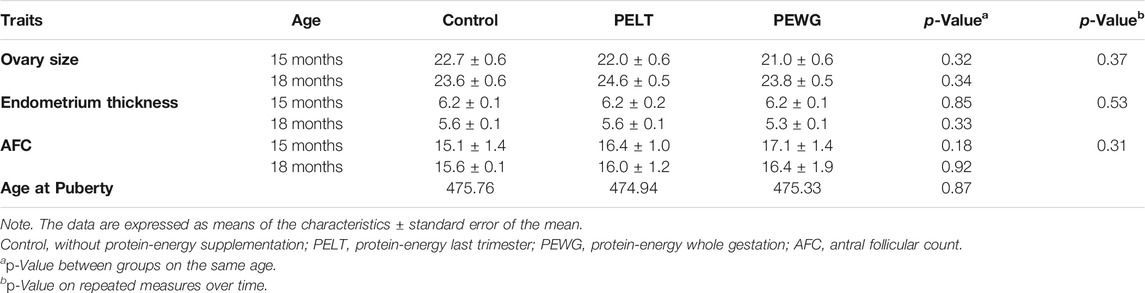
TABLE 4. Maternal nutritional effect on reproductive traits of Nellore offspring heifers.
3.4 Phenotypic Correlations
The correlation analysis between performance characteristics and REA showed a positive high correlation in weight at weaning vs. REA at weaning (r = 0.63), weight at year vs. REA at weaning (r = 0.55), weight at yearling vs. REA at weaning (r = 0.45), weight at weaning vs. REA at year (r = 0.41), weight at year vs. REA at year (0.53), weight at yearling vs. REA at year (r = 0.49), and weight at 24 months vs. REA at year (r = 0.37; p < 0.01). A positive moderate correlation was shown between weaning weight vs. REA at yearling (r = 0.30), weight at 24 months vs. REA at weaning (r = 0.28), weight at 24 months vs. REA at 24 months (r = 0.26), and ADG vs. REA at 24 months (r = 0.30; p < 0.05) (Table 5). When relating reproduction characteristics and fat thickness, no significant correlations were found between puberty ages, AFC and BFT, and RFT for the periods analyzed (p > 0.05) (Table 6).
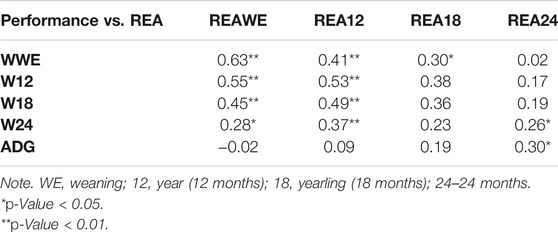
TABLE 5. Pearson’s correlation between performance traits and ribeye area (REA).
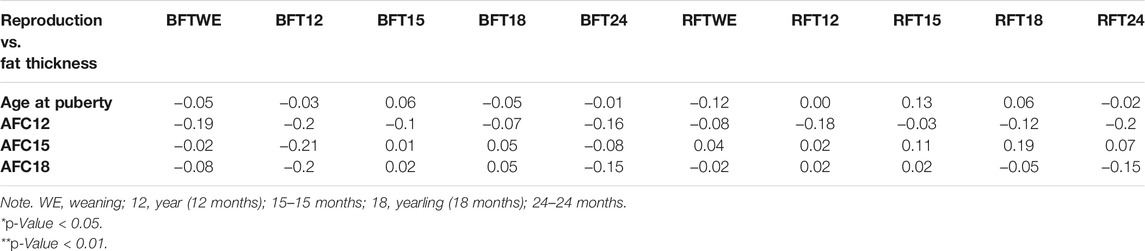
TABLE 6. Pearson’s correlation between reproductive traits and fat thickness.
3.5 Exploratory Genomic Association Study
When all animals were analyzed, no SNP had significance for any of the characteristics. However, when performing the analysis within each group, a significant SNP was identified for each treatment, with control in the trait AFC at yearling, PELT for weight at yearling, and for PEWG, and BFT at year (Figures 1, 2). The SNPs of the control and PEWG treatments are in the intergenic region, and the SNP of the PELT treatment is an intron variant of RAPGEF1 gene (Table 7). For the SNPs in the intergenic region, we considered candidate genes within a window of 1 Mb around the marker. Only one gene, in AFC at yearling’s SNP (GFRA2), was as close as 100 kb from the marker. The data for traits that had significant SNPs can be found in the Supplementary Table S1.
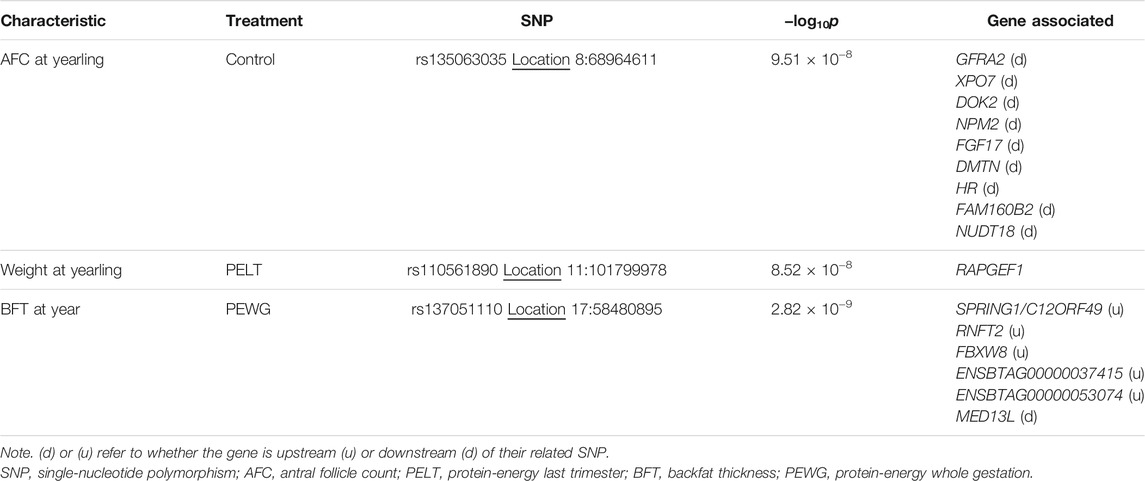
TABLE 7. SNPs highlighted by the exploratory genomic association analysis.
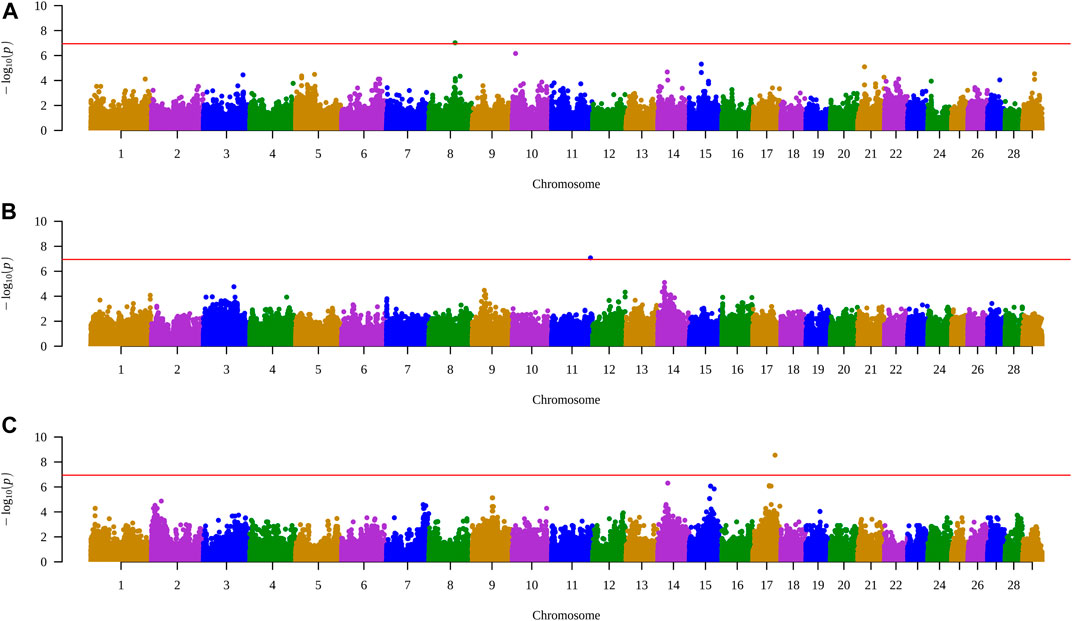
FIGURE 1. Manhattan plots of traits with SNPs highlighted by the exploratory genomic association analysis in each treatment. (A) AFC at yearling in control group. (B) Weight at yearling in PELT group. (C) BFT at year in PEWG group. SNPs, single-nucleotide polymorphisms; AFC, antral follicle count; PELT, protein-energy last trimester; BFT, backfat thickness; PEWG, protein-energy whole gestation.
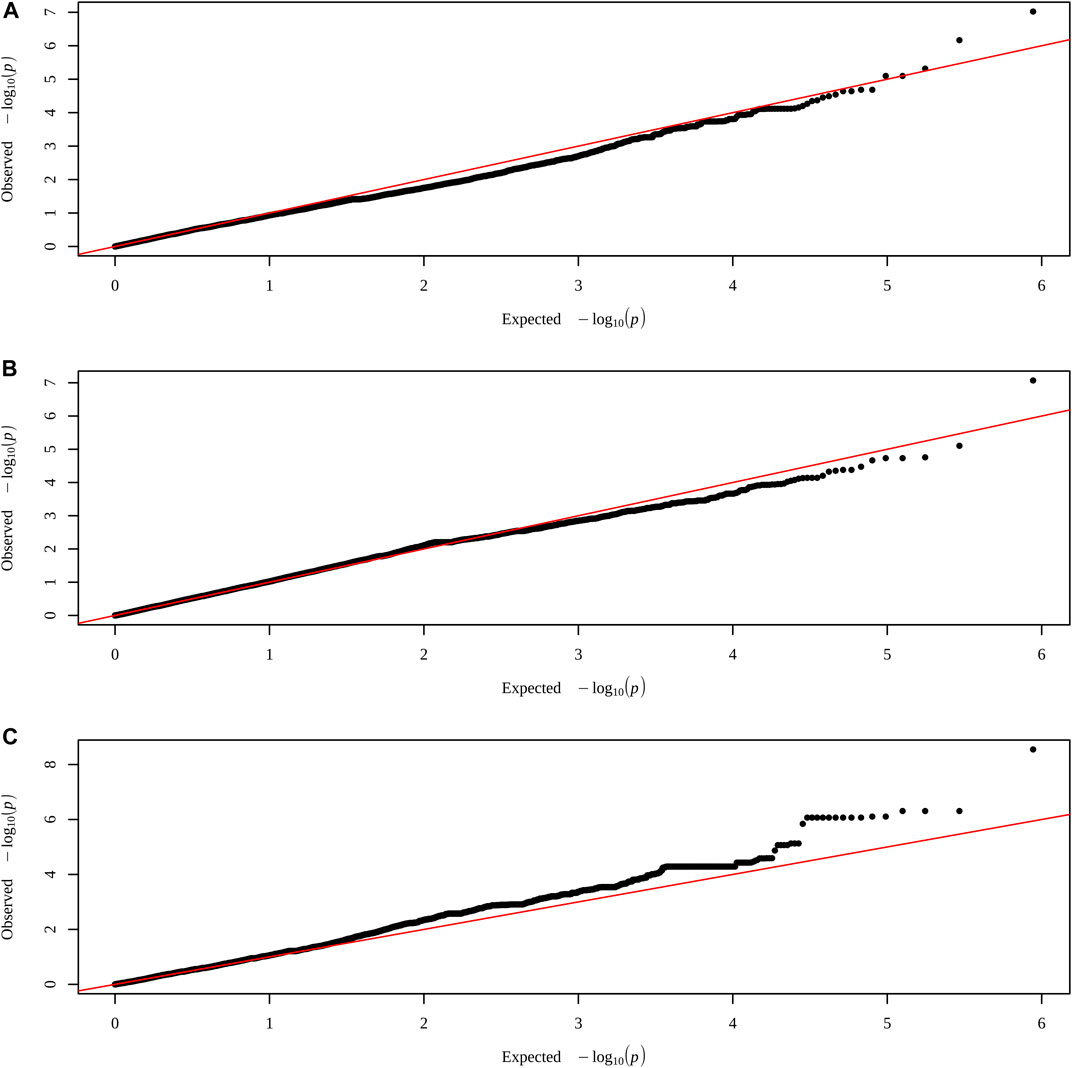
FIGURE 2. QQ plots of traits with SNPs highlighted by the exploratory genomic association analysis in each treatment. (A) AFC at yearling in control group. (B) Weight at yearling in PELT group. (C) BFT at year in PEWG group. SNPs, single-nucleotide polymorphisms; AFC, antral follicle count; PELT, protein-energy last trimester; BFT, backfat thickness; PEWG, protein-energy whole gestation.
4 Discussion
This study investigated the potential effects of protein and energy supplementation on dams during the entire gestation and in the final third of gestation as well as on cows that did not receive supplementation, regarding performance in the rearing season and reproductive tract development. To date, few studies have related the rearing phase of beef heifers to fetal programming. Here, we did not find differences in sexual development; however, there were differences in body weight throughout the rearing period, showing the contribution of this study to this research field.
Some studies have shown that energy restriction during fetal life can negatively affect growth and performance in postnatal life, including body composition (Daniel et al., 2007; Du et al., 2010); nevertheless, few studies report its effects on females, especially on Bos indicus heifers. Micke et al. (2010b) reported that supplemented heifers were heavier than nonsupplemented ones. However, Long et al. (2012) found no difference between treatments. That study used heifers from dams with or without nutritional restriction during the final third of gestation and identified no differences between the groups for weight, ADG, and REA in the analyzed periods. In the same study, the authors reported that the progeny of dams that underwent undernutrition in the final third of gestation had greater deposition of internal fat, which may help explain why the control group was heavier than the others over time. Daniel et al. (2007) observed that ewes that were nutrient-restricted during pregnancy showed no effect of maternal nutrition on the deposition rate of muscle and fat in the progeny, corroborating our results of REA, BFT, and RFT. Reis et al. (2015) studied calves that underwent or not creep-feeding during the nursing period and reported no differences for BFT between treatments. The contradictory results of several studies reinforce the need to further investigate the mechanisms of fetal programming.
Puberty in heifers is defined as the age when the animal experiences its first ovulation accompanied by visual signs of estrus and normal luteal function (Moran et al., 1989), an important characteristic, as pregnancy success during the breeding season is associated with the number of heifers that reached puberty before the season (Short and Bellows, 1971). Weight is the most important factor for puberty onset, since puberty is achieved when the animal is between 55% and 60% of its mature body weight, regardless of the breed (Freetly et al., 2011). Studies on fetal programming show the effects of supplementation during pregnancy on puberty age in heifers (Guzmán et al., 2006; Funston et al., 2010b; Harvey et al., 2021). Other investigations show no effects (Cushman et al., 2014; Gunn et al., 2015; Nepomuceno et al., 2017), corroborating the lack of difference between treatments. Previous studies have indicated that maternal nutrition during pregnancy can interact with nutrition in early postnatal life to determine the puberty age in heifers (Cardoso et al., 2020). Furthermore, although postnatal nutrition has more significant effects than maternal nutrition, heifers from mothers that underwent nutritional restriction were more sensitive to the negative effects of limited postnatal growth (O’Neil et al., 2019). Therefore, it is justifiable that the heifers used in our study do not show differences of puberty ages when they start receiving the same environmental conditions, regardless of maternal treatment groups, and did not undergo nutritional restrictions that could limit their postnatal growth in their first months of life, since the animals were born in the rainy season. Moreover, although there was no difference between groups, the mean age at puberty (16 months) was earlier than the Nellore mean, between 22 and 36 months (Nogueira, 2004); also the body weight of the animals in this study was greater than literature reports for Nellore females (Boligon and Albuquerque, 2011). A point to be reinforced is that up to 24 months, animals received an excellent nutritional management, which contributed to body development in general. However, the effect under more restricted conditions can produce different results and needs to be evaluated in future research.
The AFC is an important marker of ovarian follicle reserve (Mossa et al., 2012) and thus of the animal reproductive efficiency. Studies associate maternal malnutrition during pregnancy to a low AFC (Mossa et al., 2013). The formation of primordial cells, precursors of follicles, begins between the 90th and 140th days of fetal life in cattle (Yang and Fortune, 2008); therefore, in our study, the treatments without supplementation in this period (second third of gestation; control and PELT) may have suffered the undernutrition effects due to the dry season. Nevertheless, undernutrition was possibly not severe enough. In our study, we used cows, which possibly affected these results. On the other hand, Mossa et al. (2013) used heifers, which are still growing in addition to having to spend energy for their maintenance and gestation, as hypothesized by Cushman et al. (2014).
One way to assess pubertal status indirectly is through palpation of the reproductive tract (Holm et al., 2009). Andersen et al. (1991) developed a standard method for the reproductive tract score, a tool to access the animal proximity to puberty by the uterine size and tonus sizes of ovary and structures in the organ. In our study, we used these characteristics to investigate effects of maternal nutrition in the gestational period on the development of the reproductive tract of heifers. However, with the absence of statistical differences in these characteristics and in the puberty ages between treatments, we can suggest that maternal nutrition did not affect the offspring’s reproductive tract development.
The correlation between the phenotypes shows the association degree between them, or a measurement of the joint variation degree. According to the results in Table 3, REA at weaning and at 1 year of age showed a positive correlation with weights between weaning and 24 months. This correlation can be explained by animal growth, since heavier heifers have greater REA (Minick et al., 2002). At 18 months, the correlation between REA and weight is practically nonexistent, possibly because the animals entered puberty and decreased muscle deposition, switching it for fat deposition (Owens et al., 1995). Since the phenotypes were corrected for the fixed effects before calculating the correlation, part of this coefficient takes into account the genetic value of the animals. Therefore, despite the small size of the database, it is still plausible to assume that part of this coefficient is a good approximation for the genetic correlation. Studies show a correlation between weight and REA (Lamb et al., 1990; Splan et al., 1998) and between ADG and REA (Mahmood et al., 2016). The correlation between reproductive tract and fat thicknesses showed a possible association between the characteristics, since RFT was already related to the reproductive tract and became more significant, as the heifers became more mature (Minick et al., 2002). Another factor with a great effect on the expected result is the relationship between leptin and puberty onset. Leptin is a hormone produced by adipose tissue and has a direct action on the hypothalamus–pituitary–ovary axis, causing an increase in peaks of GnRH (Zambrano et al., 2006; Duittoz et al., 2016; Perry, 2016).
In addition, we conducted an exploratory study on the genomic association that resulted in a significant SNP for each treatment. SNPs related to control and PEWG treatments are located in the intergenic regions, and the affected genes are often difficult to determine (Brodie et al., 2016). However, some genes found near the intergenic regions of SNPs have functions related to the characteristic in which it was identified. The SNP related to the control treatment is linked to the characteristic AFC at yearling. NPM2 gene relates to the function of the ovarian and reproductive tract and encodes an oocyte-specific nuclear protein, with great importance in early embryonic development (Lingenfelter et al., 2011). FGF17 gene plays a role in the differentiation of granulosa cells (Machado et al., 2009) and also in hypogonadism (Miraoui et al., 2013). On the other hand, GFRA2 gene, the only gene within 100 kb from the marker, has an important role in the differentiation of stem cells in the pituitary (Pradilla et al., 2021), and important organ related to reproductive development. Gene XPO7 has been linked to ovarian cancer (Cáceres-Gorriti et al., 2014), and DOK2 gene was related to fetal programming, having its gene expression reduced in offspring of animals that underwent uteroplacental insufficiency (Master et al., 2015).
Several genes related to lipid metabolism were found close to the SNP for BFT at year, which is related to the PEWG treatment. SPRING1 gene, also known as C12orf49, is an important regulator of lipid metabolism homeostasis (Aregger et al., 2020; Girardi and Superti-Furga, 2020). Studies on characteristics of buffalo milk link RNFT2 gene to the production of fat, proteins, and milk (Venturini et al., 2014; Du et al., 2019). FBXW8 gene was associated with fetal programming in a study that analyzed intrauterine growth restriction (Gascoin-Lachambre et al., 2010). MED13L gene is associated with heart development in humans (Napoli et al., 2019). RAPGEF1, the significant gene for the PELT treatment, has been studied and found to be related to persistence of lactation (Do et al., 2017) and mastitis in dairy cows (Chen et al., 2015) also to the lipomatous myopathy disease in Piedmontese cattle (Peletto et al., 2017). Nevertheless, these results need to be considered with great parsimony, since the sample size used in the analysis is small, which can lead to false-positive results. Our work investigated possible genotype–environment interactions in animals submitted to fetal programming. This is an innovative study, since no studies evaluated animals under these conditions and phenotypes. Furthermore, the data presented will attain greater accuracy in future studies, as the fetal programming database increases its amount of information.
5 Conclusion
Protein-energy supplementation at different gestation periods in Nellore cows did not affect the reproductive tract development or body composition and ADG during the rearing period of their daughters. However, the treatment affected weight over time, and the animals of the control group were heavier. The exploratory genomic association study showed one SNP on an intergenic region for control and PEWG, and one for PELT in an intronic region of RAPGEF1 gene. Our study provided insights into the effects of fetal programming on Nellore heifers, showing that protein-energy supplementation may not affect their sexual development. However, this field requires further studies once the results found in literature are still contradictory and research with exploratory GWASs in animals that have undergone fetal programming is still scarce.
Data Availability Statement
The raw data supporting the conclusion of this article will be made available by the authors, without undue reservation.
Ethics Statement
This study was approved by the Research Ethics Committee of FZEA / USP, under protocol No. 1843241117, according to the guidelines of the National Council for the Control of Animal Experimentation (CONCEA).
Author Contributions
MHdAS and GP concepted, designed and planned the experiment and revised the manuscript. RCC planned the experiment, collected data, did the statistical analysis and wrote the manuscript with input from all authors. FdOB performed statistical analysis and revised the manuscript. GHGP collected data, assisted the statistical analysis and revised the manuscript. EF, NPG and DASP did data collection and organized the database. All authors contributed to the final version of the manuscript.
Funding
This work was supported by São Paulo Research Foundation (FAPESP) (grant numbers 2017/12105-2 and 2020/11515-5) and National Council for Scientific and Technological Development (CNPq) (grant number 432270/2018-3).
Conflict of Interest
The authors declare that the research was conducted in the absence of any commercial or financial relationships that could be construed as a potential conflict of interest.
The reviewer JP declared a shared affiliation with the authors to the handling editor at the time of the review.
Publisher’s Note
All claims expressed in this article are solely those of the authors and do not necessarily represent those of their affiliated organizations, or those of the publisher, the editors, and the reviewers. Any product that may be evaluated in this article, or claim that may be made by its manufacturer, is not guaranteed or endorsed by the publisher.
Acknowledgments
The authors acknowledge the College of Animal Science and Food Engineering (FZEA-USP) for providing all human and infrastructure resource that made this study possible.
Supplementary Material
The Supplementary Material for this article can be found online at: https://www.frontiersin.org/articles/10.3389/fgene.2021.737382/full#supplementary-material
References
Andersen, K., Lefever, D., Brinks, J., and Odde, K. (1991). The Use of Reproductive Tract Scoring in Beef Heifers. Agri-Practice 12, 19–23.
Aregger, M., Lawson, K. A., Billmann, M., Costanzo, M., Tong, A. H. Y., Chan, K., et al. (2020). Systematic Mapping of Genetic Interactions for De Novo Fatty Acid Synthesis Identifies C12orf49 as a Regulator of Lipid Metabolism. Nat. Metab. 2, 499–513. doi:10.1038/s42255-020-0211-z
Barker, D. J. (1990). The Fetal and Infant Origins of Adult Disease. Bmj 301, 1111. doi:10.1136/bmj.301.6761.1111
Boligon, A. A., and Albuquerque, L. G. (2011). Genetic Parameters and Relationships of Heifer Pregnancy and Age at First Calving with Weight Gain, Yearling and Mature Weight in Nelore Cattle. Livestock Sci. 141, 12–16. doi:10.1016/j.livsci.2011.04.009
Brodie, A., Azaria, J. R., and Ofran, Y. (2016). How Far from the SNP May the Causative Genes Be?. Nucleic Acids Res. 44, 6046–6054. doi:10.1093/nar/gkw500
Cáceres-Gorriti, K. Y., Carmona, E., Barrès, V., Rahimi, K., Létourneau, I. J., Tonin, P. N., et al. (2014). RAN Nucleo-Cytoplasmic Transport and Mitotic Spindle Assembly Partners XPO7 and TPX2 are New Prognostic Biomarkers in Serous Epithelial Ovarian Cancer. PLoS One 9, e91000. doi:10.1371/journal.pone.0091000
Cardoso, R. C., West, S. M., Maia, T. S., Alves, B. R. C., and Williams, G. L. (2020). Nutritional Control of Puberty in the Bovine Female: Prenatal and Early Postnatal Regulation of the Neuroendocrine System. Domest. Anim. Endocrinol. 73, 106434. doi:10.1016/j.domaniend.2020.106434
Chen, X., Cheng, Z., Zhang, S., Werling, D., and Wathes, D. C. (2015). Combining Genome Wide Association Studies and Differential Gene Expression Data Analyses Identifies Candidate Genes Affecting Mastitis Caused by Two Different Pathogens in the Dairy Cow. Open J. Anim. Sci. 05, 358–393. doi:10.4236/ojas.2015.54040
Cushman, R. A., McNeel, A. K., and Freetly, H. C. (2014). The Impact of Cow Nutrient Status during the Second and Third Trimesters on Age at Puberty, Antral Follicle Count, and Fertility of Daughters. Livestock Sci. 162, 252–258. doi:10.1016/j.livsci.2014.01.033
Daniel, Z. C. T. R., Brameld, J. M., Craigon, J., Scollan, N. D., and Buttery, P. J. (2007). Effect of Maternal Dietary Restriction during Pregnancy on Lamb Carcass Characteristics and Muscle Fiber Composition1. J. Anim. Sci. 85, 1565–1576. doi:10.2527/jas.2006-743
Do, D. N., Bissonnette, N., Lacasse, P., Miglior, F., Sargolzaei, M., Zhao, X., et al. (2017). Genome-wide Association Analysis and Pathways Enrichment for Lactation Persistency in Canadian Holstein Cattle. J. Dairy Sci. 100, 1955–1970. doi:10.3168/jds.2016-11910
D. Turner, S. (2018). Qqman: an R Package for Visualizing GWAS Results Using Q-Q and manhattan Plots. Joss 3, 731. doi:10.21105/joss.00731
Du, C., Deng, T., Zhou, Y., Ye, T., Zhou, Z., Zhang, S., et al. (2019). Systematic Analyses for Candidate Genes of Milk Production Traits in Water buffalo (Bubalus bubalis). Anim. Genet. 50, 207–216. doi:10.1111/age.12739
Du, M., Tong, J., Zhao, J., Underwood, K. R., Zhu, M., Ford, S. P., et al. (2010). Fetal Programming of Skeletal Muscle Development in Ruminant Animals1. J. Anim. Sci. 88, E51–E60. doi:10.2527/jas.2009-2311
Duarte, M. S., Gionbelli, M. P., Paulino, P. V. R., Serão, N. V. L., Nascimento, C. S., Botelho, M. E., et al. (2014). Maternal Overnutrition Enhances mRNA Expression of Adipogenic Markers and Collagen Deposition in Skeletal Muscle of Beef Cattle Fetuses1. J. Anim. Sci. 92, 3846–3854. doi:10.2527/jas.2014-7568
Duittoz, A. H., Tillet, Y., Le Bourhis, D., and Schibler, L. (2016). The Timing of Puberty (Oocyte Quality and Management). Anim. Reprod. 13, 313–333. doi:10.21451/1984-3143-AR874
Freetly, H. C., Kuehn, L. A., and Cundiff, L. V. (2011). Growth Curves of Crossbred Cows Sired by Hereford, Angus, Belgian Blue, Brahman, Boran, and Tuli Bulls, and the Fraction of Mature Body Weight and Height at Puberty1,2. J. Anim. Sci. 89, 2373–2379. doi:10.2527/jas.2011-3847
Funston, R. N., Larson, D. M., and Vonnahme, K. A. (2010a). Effects of Maternal Nutrition on Conceptus Growth and Offspring Performance: Implications for Beef Cattle Production1. J. Anim. Sci. 88, E205–E215. doi:10.2527/jas.2009-2351
Funston, R. N., Martin, J. L., Adams, D. C., and Larson, D. M. (2010b). Winter Grazing System and Supplementation of Beef Cows During Late Gestation Influence Heifer Progeny1. J. Anim. Sci. 88, 4094–4101. doi:10.2527/jas.2010-3039
Funston, R. N., and Summers, A. F. (2013). Effect of Prenatal Programming on Heifer Development. Vet. Clin. North America: Food Anim. Pract. 29, 517–536. doi:10.1016/j.cvfa.2013.07.001
Gascoin-Lachambre, G., Buffat, C., Rebourcet, R., Chelbi, S. T., Rigourd, V., Mondon, F., et al. (2010). Cullins in Human Intra-uterine Growth Restriction: Expressional and Epigenetic Alterations. Placenta 31, 151–157. doi:10.1016/j.placenta.2009.11.008
Girardi, E., and Superti-Furga, G. (2020). Caught in the Genetic Network: a Novel Regulator of Lipid Metabolism. Nat. Metab. 2, 483–484. doi:10.1038/s42255-020-0218-5
Gunn, P. J., Schoonmaker, J. P., Lemenager, R. P., and Bridges, G. A. (2015). Feeding Distiller's Grains as an Energy Source to Gestating and Lactating Beef Heifers: Impact on Female Progeny Growth, Puberty Attainment, and Reproductive Processes1. J. Anim. Sci. 93, 746–757. doi:10.2527/jas.2014-8130
Guzmán, C., Cabrera, R., Cárdenas, M., Larrea, F., Nathanielsz, P. W., and Zambrano, E. (2006). Protein Restriction during Fetal and Neonatal Development in the Rat Alters Reproductive Function and Accelerates Reproductive Ageing in Female Progeny. J. Physiol. 572, 97–108. doi:10.1113/jphysiol.2005.103903
Harvey, K. M., Cooke, R. F., Colombo, E. A., Rett, B., Sousa, O. A. de., Harvey, L. M., et al. (2021). Supplementing Organic-Complexed or Inorganic Co, Cu, Mn, and Zn to Beef Cows during Gestation: post-weaning Responses of Offspring Reared as Replacement Heifers or Feeder Cattle. J. Anim. Sci. 53, 1689–1699. doi:10.1093/jas/skab082
Holm, D. E., Thompson, P. N., and Irons, P. C. (2009). The Value of Reproductive Tract Scoring as a Predictor of Fertility and Production Outcomes in Beef Heifers1. J. Anim. Sci. 87, 1934–1940. doi:10.2527/jas.2008-1579
Lamb, M., Robison, O., and Tess, M. (1990). Genetic Parameters for Carcass Traits in Hereford Bulls. J. Anim. Sci. 68, 64–69. doi:10.1093/ansci/68.1.64
Lingenfelter, B. M., Tripurani, S. K., Tejomurtula, J., Smith, G. W., and Yao, J. (2011). Molecular Cloning and Expression of Bovine Nucleoplasmin 2 (NPM2): A Maternal Effect Gene Regulated by miR-181a. Reprod. Biol. Endocrinol. 9, 1–9. doi:10.1186/1477-7827-9-40
Long, J. M., Trubenbach, L. A., Pryor, J. H., Long, C. R., Wickersham, T. A., Sawyer, J. E., et al. (2021). Maternal Nutrient Restriction Alters Endocrine Pancreas Development in Fetal Heifers. Domest. Anim. Endocrinol. 74, 106580. doi:10.1016/j.domaniend.2020.106580
Long, N. M., Tousley, C. B., Underwood, K. R., Paisley, S. I., Means, W. J., Hess, B. W., et al. (2012). Effects of Early- to Mid-gestational Undernutrition with or without Protein Supplementation on Offspring Growth, Carcass Characteristics, and Adipocyte Size in Beef Cattle1. J. Anim. Sci. 90, 197–206. doi:10.2527/jas.2011-4237
Long, N. M., Vonnahme, K. A., Hess, B. W., Nathanielsz, P. W., and Ford, S. P. (2009). Effects of Early Gestational Undernutrition on Fetal Growth, Organ Development, and Placentomal Composition in the Bovine1. J. Anim. Sci. 87, 1950–1959. doi:10.2527/jas.2008-1672
Machado, M. F., Portela, V. M., Price, C. A., Costa, I. B., Ripamonte, P., Amorim, R. L., et al. (2009). Regulation and Action of Fibroblast Growth Factor 17 in Bovine Follicles. J. Endocrinol. 202, 347–353. doi:10.1677/JOE-09-0145
Mahmood, S., Basarab, J. A., Dixon, W. T., and Bruce, H. L. (2016). Relationship between Phenotype, Carcass Characteristics and the Incidence of Dark Cutting in Heifers. Meat Sci. 121, 261–271. doi:10.1016/j.meatsci.2016.06.020
Martin, J. L., Vonnahme, K. A., Adams, D. C., Lardy, G. P., and Funston, R. N. (2007). Effects of Dam Nutrition on Growth and Reproductive Performance of Heifer Calves1. J. Anim. Sci. 85, 841–847. doi:10.2527/jas.2006-337
Master, J. S., Thouas, G. A., Harvey, A. J., Sheedy, J. R., Hannan, N. J., Gardner, D. K., et al. (2015). Fathers that Are Born Small Program Alterations in the Next-Generation Preimplantation Rat Embryos. J. Nutr. 145, 876–883. doi:10.3945/jn.114.205724
Micke, G. C., Sullivan, T. M., Gatford, K. L., Owens, J. A., and Perry, V. E. A. (2010a). Nutrient Intake in the Bovine during Early and Mid-gestation Causes Sex-specific Changes in Progeny Plasma IGF-I, Liveweight, Height and Carcass Traits. Anim. Reprod. Sci. 121, 208–217. doi:10.1016/j.anireprosci.2010.05.017
Micke, G. C., Sullivan, T. M., Soares Magalhaes, R. J., Rolls, P. J., Norman, S. T., and Perry, V. E. A. (2010b). Heifer Nutrition during Early- and Mid-pregnancy Alters Fetal Growth Trajectory and Birth Weight. Anim. Reprod. Sci. 117, 1–10. doi:10.1016/j.anireprosci.2009.03.010
Minick, J. A., Wilson, D. E., Rouse, G. H., Hassen, A., Pence, M., Sealock, R., et al. (2002). Relationship between Body Composition and Reproduction in Heifers. Beef Res. Rep. - Iowa State. Univ., 145–148. Available at: http://www.beefpoint.com.br/radares-tecnicos/melhoramento-genetico/relacoes-entre-as-medidas-de-carcacas-pelo-uso-da-ultra-sonografia-e-o-inicio-da-puberdade-em-novilhas-de-reposicao-19526/.
Miraoui, H., Dwyer, A. A., Sykiotis, G. P., Plummer, L., Chung, W., Feng, B., et al. (2013). Mutations in FGF17, IL17RD, DUSP6, SPRY4, and FLRT3 Are Identified in Individuals with Congenital Hypogonadotropic Hypogonadism. Am. J. Hum. Genet. 92, 725–743. doi:10.1016/j.ajhg.2013.04.008
Monteiro, F. M., Mercadante, M. E. Z., Barros, C. M., Satrapa, R. A., Silva, J. A. V., Oliveira, L. Z., et al. (2013). Reproductive Tract Development and Puberty in Two Lines of Nellore Heifers Selected for Postweaning Weight. Theriogenology 80, 10–17. doi:10.1016/j.theriogenology.2013.02.013
Moran, C., Quirke, J. F., and Roche, J. F. (1989). Puberty in Heifers: A Review. Anim. Reprod. Sci. 18, 167–182. doi:10.1016/0378-4320(89)90019-5
Mossa, F., Carter, F., Walsh, S. W., Kenny, D. A., Smith, G. W., Ireland, J. L. H., et al. (2013). Maternal Undernutrition in Cows Impairs Ovarian and Cardiovascular Systems in Their Offspring1. Biol. Reprod. 88, 92–93. doi:10.1095/biolreprod.112.107235
Mossa, F., Walsh, S. W., Butler, S. T., Berry, D. P., Carter, F., Lonergan, P., et al. (2012). Low Numbers of Ovarian Follicles ≥3 Mm in Diameter Are Associated with Low Fertility in Dairy Cows. J. Dairy Sci. 95, 2355–2361. doi:10.3168/jds.2011-4325
Mossa, F., Walsh, S. W., Evans, A. C. O., Jimenez-Krassel, F., and Ireland, J. J. (2017). “Early Developmental Programming of the Ovarian Reserve, Ovarian Function, and Fertility,” in Animal Models and Human Reproduction. John Wiley & Sons, 91–108. doi:10.1002/9781118881286.ch4
Napoli, C., Schiano, C., and Soricelli, A. (2019). Increasing Evidence of Pathogenic Role of the Mediator (MED) Complex in the Development of Cardiovascular Diseases. Biochimie 165, 1–8. doi:10.1016/J.BIOCHI.2019.06.014
Nepomuceno, D. D., Pires, A. V., Ferraz, M. V. C., Biehl, M. V., Gonçalves, J. R. S., Moreira, E. M., et al. (2017). Effect of Pre-partum Dam Supplementation, Creep-Feeding and post-weaning Feedlot on Age at Puberty in Nellore Heifers. Livestock Sci. 195, 58–62. doi:10.1016/j.livsci.2016.11.008
Nogueira, G. P. (2004). Puberty in South American Bos indicus (Zebu) Cattle. Anim. Reprod. Sci., 361–372. doi:10.1016/j.anireprosci.2004.04.007
Noya, A., Casasús, I., Ferrer, J., and Sanz, A. (2019). Effects of Developmental Programming Caused by Maternal Nutrient Intake on Postnatal Performance of Beef Heifers and Their Calves. Animals 9, 1072. doi:10.3390/ani9121072
O’Neil, M. M., West, S. M., Maia, T. S., Cardoso, R. C., and Williams, G. L. (2019). 374 Effects of Maternal Nutrition on Secretion of Leptin in the Neonatal Heifer and Interaction of Maternal and Postnatal Nutrition on Age at Puberty and Postpubertal Secretion of Luteinizing Hormone. J. Anim. Sci. 97, 140–141. doi:10.1093/jas/skz258.287
Owens, F. N., Gill, D. R., Secrist, D. S., and Coleman, S. W. (1995). Review of Some Aspects of Growth and Development of Feedlot Cattle. J. Anim. Sci. 73, 3152–3172. doi:10.2527/1995.73103152x
Peletto, S., Strillacci, M. G., Capucchio, M. T., Biasibetti, E., Modesto, P., Acutis, P. L., et al. (2017). Genetic Basis of Lipomatous Myopathy in Piedmontese Beef Cattle. Livestock Sci. 206, 9–16. doi:10.1016/j.livsci.2017.09.027
Perry, G. A. (2016). Factors Affecting Puberty in Replacement Beef Heifers. Theriogenology 86, 373–378. doi:10.1016/j.theriogenology.2016.04.051
Polizel, G. H. G., Fantinato-Neto, P., Rangel, R. B., Grigoletto, L., Bussiman, F. d. O., Cracco, R. C., et al. (2021). Evaluation of Reproductive Traits and the Effect of Nutrigenetics on Bulls Submitted to Fetal Programming. Livestock Sci. 247, 104487. doi:10.1016/j.livsci.2021.104487
Pradilla, D. A., García, L. M., Pérez-Romero, S., Graça, F. J. A., Kupari, J., Japón, M., et al. (2021). GFRα2 as a GPS Marker: Role of GFRα2 in Pituitary Gland. Ejea 73. doi:10.1530/endoabs.73.oc8.3
Reis, M. M., Cooke, R. F., Cappellozza, B. I., Marques, R. S., Guarnieri Filho, T. A., Rodrigues, M. C., et al. (2015). Creep-feeding to Stimulate Metabolic Imprinting in Nursing Beef Heifers: Impacts on Heifer Growth, Reproductive and Physiological Variables. Animal 9, 1500–1508. doi:10.1017/S1751731115000828
Sargolzaei, M., Chesnais, J. P., and Schenkel, F. S. (2014). A New Approach for Efficient Genotype Imputation Using Information from Relatives. BMC Genomics 15 15, 478–12. doi:10.1186/1471-2164-15-478
Searle, S. R. (1997). The Matrix Handling of BLUE and BLUP in the Mixed Linear Model. Linear Algebra its Appl. 264, 291–311. doi:10.1016/S0024-3795(96)00400-4
Short, R. E., and Bellows, R. A. (1971). Relationships Among Weight Gains, Age at Puberty and Reproductive Performance in Heifers. J. Anim. Sci. 32, 1–5. doi:10.2527/jas1971.321127x
Solé, X., Guinó, E., Valls, J., Iniesta, R., and Moreno, V. (2006). SNPStats: A Web Tool for the Analysis of Association Studies. Bioinformatics 22, 1928–1929. doi:10.1093/bioinformatics/btl268
Souza, A. H., Silva, E. P. B., Cunha, A. P., Gümen, A., Ayres, H., Brusveen, D. J., et al. (2011). Ultrasonographic Evaluation of Endometrial Thickness Near Timed AI as a Predictor of Fertility in High-Producing Dairy Cows. Theriogenology 75, 722–733. doi:10.1016/j.theriogenology.2010.10.013
Splan, R. K., Cundiff, L. V., and Van Vleck, L. D. (1998). Genetic Parameters for Sex-specific Traits in Beef Cattle. J. Anim. Sci. 76, 2272–2278. doi:10.2527/1998.7692272x
VanRaden, P. M. (2008). Efficient Methods to Compute Genomic Predictions. J. Dairy Sci. 91, 4414–4423. doi:10.3168/jds.2007-0980
Venturini, G. C., Cardoso, D. F., Baldi, F., Freitas, A. C., Aspilcueta-Borquis, R. R., Santos, D. J. A., et al. (2014). Association between Single-Nucleotide Polymorphisms and Milk Production Traits in buffalo. Genet. Mol. Res. 13, 10256–10268. doi:10.4238/2014.December.4.20
Warnes, G. R., Bolker, B., Gorjanc, G., Grothendieck, G., Korosec, A., Lumley, T., et al. (2017). CRAN - Package Gdata. Available at: http://cran.ma.imperial.ac.uk/web/packages/gdata/ (Accessed May 13, 2021).
Wu, G., Bazer, F. W., Wallace, J. M., and Spencer, T. E. (2006). BOARD-INVITED REVIEW: Intrauterine Growth Retardation: Implications for the Animal Sciences1. J. Anim. Sci. 84, 2316–2337. doi:10.2527/jas.2006-156
Yang, M. Y., and Fortune, J. E. (2008). The Capacity of Primordial Follicles in Fetal Bovine Ovaries to Initiate Growth In Vitro Develops During Mid-gestation and Is Associated with Meiotic Arrest of Oocytes1. Biol. Reprod. 78, 1153–1161. doi:10.1095/biolreprod.107.066688
Zambrano, E., Bautista, C. J., Deás, M., Martínez-Samayoa, P. M., González-Zamorano, M., Ledesma, H., et al. (2006). A Low Maternal Protein Diet during Pregnancy and Lactation Has Sex- and Window of Exposure-specific Effects on Offspring Growth and Food Intake, Glucose Metabolism and Serum Leptin in the Rat. J. Physiol. 571, 221–230. doi:10.1113/jphysiol.2005.100313
Keywords: beef heifer, fetal programming, Nellore, nutrigenetic, performance, reproduction
Citation: Cracco RC, Bussiman FdO, Polizel GHG, Furlan É, Garcia NP, Poit DAS, Pugliesi G and Santana MHdA (2021) Effects of Maternal Nutrition on Female Offspring Weight Gain and Sexual Development. Front. Genet. 12:737382. doi: 10.3389/fgene.2021.737382
Received: 06 July 2021; Accepted: 04 October 2021;
Published: 23 November 2021.
Edited by:
Wellison J. S. Diniz, Auburn University, United StatesReviewed by:
Kate Keogh, Teagasc Food Research Centre (Ireland), IrelandSonia Moisa, The University of Tennessee, Knoxville, United States
Juliana Petrini, University of São Paulo, Brazil
Copyright © 2021 Cracco, Bussiman, Polizel, Furlan, Garcia, Poit, Pugliesi and Santana. This is an open-access article distributed under the terms of the Creative Commons Attribution License (CC BY). The use, distribution or reproduction in other forums is permitted, provided the original author(s) and the copyright owner(s) are credited and that the original publication in this journal is cited, in accordance with accepted academic practice. No use, distribution or reproduction is permitted which does not comply with these terms.
*Correspondence: Miguel Henrique de Almeida Santana, bWhhc2FudGFuYUB1c3AuYnI=