 Xubin Lu1,2
 Abdelaziz Adam Idriss Arbab1
 Ismail Mohamed Abdalla1
 Dingding Liu1
 Zhipeng Zhang1
 Tianle Xu3
 Guosheng Su2*
 Zhangping Yang1*
- 1College of Animal Science and Technology, Yangzhou University, Yangzhou, China
- 2Center for Quantitative Genetics and Genomics, Aarhus University, Tjele, Denmark
- 3Joint International Research Laboratory of Agriculture and Agri-Product Safety, Yangzhou University, Yangzhou, China
Accurately estimating the genetic parameters and revealing more genetic variants underlying milk production and quality are conducive to the genetic improvement of dairy cows. In this study, we estimate the genetic parameters of five milk-related traits of cows—namely, milk yield (MY), milk fat percentage (MFP), milk fat yield (MFY), milk protein percentage (MPP), and milk protein yield (MPY)—based on a random regression test-day model. A total of 95,375 test-day records of 9,834 cows in the lower reaches of the Yangtze River were used for the estimation. In addition, genome-wide association studies (GWASs) for these traits were conducted, based on adjusted phenotypes. The heritability, as well as the standard errors, of MY, MFP, MFY, MPP, and MPY during lactation ranged from 0.22 ± 0.02 to 0.31 ± 0.04, 0.06 ± 0.02 to 0.15 ± 0.03, 0.09 ± 0.02 to 0.28 ± 0.04, 0.07 ± 0.01 to 0.16 ± 0.03, and 0.14 ± 0.02 to 0.27 ± 0.03, respectively, and the genetic correlations between different days in milk (DIM) within lactations decreased as the time interval increased. Two, six, four, six, and three single nucleotide polymorphisms (SNPs) were detected, which explained 5.44, 12.39, 8.89, 10.65, and 7.09% of the phenotypic variation in MY, MFP, MFY, MPP, and MPY, respectively. Ten Kyoto Encyclopedia of Genes and Genomes pathways and 25 Gene Ontology terms were enriched by analyzing the nearest genes and genes within 200 kb of the detected SNPs. Moreover, 17 genes in the enrichment results that may play roles in milk production and quality were selected as candidates, including CAMK2G, WNT3A, WNT9A, PLCB4, SMAD9, PLA2G4A, ARF1, OPLAH, MGST1, CLIP1, DGAT1, PRMT6, VPS28, HSF1, MAF1, TMEM98, and F7. We hope that this study will provide useful information for in-depth understanding of the genetic architecture of milk production and quality traits, as well as contribute to the genomic selection work of dairy cows in the lower reaches of the Yangtze River.
Introduction
The production and quality of milk are key factors that influence the profitability of dairy enterprises. Most milk-related traits, including the milk yield (MY), milk fat percentage (MFP), milk fat yield (MFY), milk protein percentage (MPP), and milk protein yield (MPY), are quantitative traits, which are controlled by multiple genes and are sensitive to environmental influences (Wang et al., 2019a). Understanding the genetic architecture, estimating the genetic parameters, and revealing more quantitative trait loci (QTL) regions underlying these milk-related traits are beneficial to the genetic improvement of dairy cows, as the genetic variation information could be utilized more rationally and effectively.
The reliability of genetic parameter estimation is one of the important factors affecting population genetic improvement. The random regression test-day model has been widely applied to the genetic evaluation of traits that are measured repeatedly at different time points, as it simulates the environmental and genetic effects along the lactation trajectory, and provides higher accuracy (with a 6%–8% increase) than genetic evaluation based on the lactation model (using full or extended 305-day lactation records) in cows (Li et al., 2020). In addition, it is convenient to infer the total variance components of performance during the entire lactation period based on the variance components estimated from test-day records, without requiring individuals to have a record every day of the lactation period (Wahinya et al., 2020). Due to the goodness-of-fit and the low correlation among parameters, Legendre polynomials (LP)—especially the high-order polynomials—have generally been used to model the lactation curve of cows (Silvestre et al., 2006; Bignardi et al., 2009a). However, when estimating variance components (genetic parameters) using LP of the order higher than three, the further improvement becomes small, and the model generally has difficulty in converging (Li et al., 2020). Therefore, the appropriate selection of the LP order can improve the calculation efficiency and the goodness-of-fit, thus, resulting in a high accuracy of the genetic parameter evaluation in the test-day model (Pereira et al., 2013; Li et al., 2020).
A genome-wide association study (GWAS) can effectively identify the potential genetic variants that are associated with quantitative traits, and can also facilitate molecular breeding of animals (Hayes and Goddard, 2010). Previous studies have reported that the QTLs detected by GWASs are helpful in improving the accuracy of whole-genome prediction (Zhang et al., 2014), and constructing the genomic kinship matrix by all the causative quantitative trait nucleotides (QTNs) could maximize the genomic prediction accuracy (Fragomeni et al., 2017). Therefore, the discovery of more QTLs that affect milk-related traits could provide support for the genetic selection progress of dairy cows.
Chinese Holsteins are the crossbred progeny of the imported Holstein bulls from Europe and North America and the native yellow cattle breeds, thus, having complicated genetic background (Li et al., 2017). It has been reported that approximately 13% of Chinese Holstein blood comes from local breeds, and a considerable number of Chinese Holsteins are descendants of native Chinese cattle breeds (Liu et al., 2014; Liu et al., 2020). A study has revealed that the Chinese Holstein cattle population from Beijing showed a higher level of haplotype diversity than those in other regions, and part of Holstein bulls in Qinghai Province were crossed with the local yellow cattle and yak to improve milk production of the local breeds (Ferreri et al., 2011). Another study has also shown that the Chinese Holstein cows from southern China are more adapted to the hot and humid climate than the cows from northern China (Liu et al., 2014). Therefore, the proper genetic evaluation of dairy cows in different regions is necessary.
The lower reaches of the Yangtze River experience a temperate climate, with warm springs, hot and rainy summers, cool autumns, and relatively cold winters for the latitude (Ding et al., 2017). The cows in this region are susceptible to mastitis and heat stress in summer, as well as cold stress in winter, resulting in performance differences of milk-related traits, compared with farms in other areas (Yang et al., 2019). Among previous GWASs on the milk-related traits of the Chinese Holstein cows, most of the research populations were in the west or north of China (Jiang et al., 2010; Liu et al., 2020), and there have been very few association studies or estimation of genetic parameters on the milk-related traits based on the random regression test-day model focused on Chinese Holstein cows in the lower reaches of the Yangtze River. In this study, we estimated the genetic parameters of MY, MFP, MFY, MPP, and MPY of Chinese Holstein cows in the lower reaches of the Yangtze River, and conducted a GWAS on these traits. We expect that the estimates of genetic variance, as well as the newly identified genetic variants, may contribute to the genomic selection and genetic improvement of dairy cows in the lower reaches of the Yangtze River.
Materials and methods
Ethical Statement
This research was carried out in strict compliance with the Institutional Animal Care and Use Committee of the School of the Yangzhou University Animal Experiments Ethics Committee [Permit Number: SYXK(Su)IACUC 2012–0029], in the process of sample collection and data collection, and no animals felt uncomfortable or experienced malnutrition during this research.
Research Population and Phenotype Collection
The research population in this study was 15,216 Holstein cows from four farms in Jiangsu Province, China, and 149,065 test-day records of these cows over 9 years (2010–2019) were collected. All of the records were measured by the Nanjing Dairy Cattle Performance Measurement Center (Nanjing, China). Five traits evaluating the milk performance of dairy cows were selected for genetic parameter evaluation and association analyses; namely, MY, MFP, MFY, MPP, and MPY. The phenotypic quality control of each cow was carried out following the criteria that the test-day records were from parity 1 to parity 3, the first calving age was between 22 and 36 months, the DIM was between 5 and 305, the number of records in a parity was greater than 6, and the milk production ranged from 5 to 80 kg in each record. After quality control, 9,834 Holstein cows and 95,375 test-day records from them were retained for the subsequent analysis. These cows were the offspring of 599 bulls. The pedigrees of these cows were traced to at least three generations, and were used to estimate genetic parameters of the traits with a random regression test-day model. The summary statistics of the phenotypes are presented in Table 1, and the distribution and correlation of the phenotypes are shown in Supplementary Figure S2.

TABLE 1. Descriptive statistics of test-day records and estimated heritability of 305-day performance of the milk-related traits in the study population.
Genotypic Data
Among the 9,834 cows that passed the phenotypic quality control, hair samples from the tails of 999 cows were collected for DNA extraction and genotyping. The genotyping work was conducted at Neogen Biotechnology Co., Ltd. (MI, United States) using GGPBovine 100K SNP Chips, and the ARS-UCD 1.2 assembly of the Bos taurus genome was used as the reference genome. In total, 95,256 variants were derived from the 30 chromosomes of each cow. All of the variants were filtered, according to the following quality control standards: Call rate of variant >90%, minor allele frequency (MAF) >0.95, and Hardy–Weinberg Equilibrium (HWE) >1.0 × 10⁻⁶. In addition, it required that the call rate of individual genotypes be >0.95 (Marees et al., 2018). Finally, 984 cows and 84,407 variants passed the quality control, and were used in the association analysis.
Estimated Genetic Parameters
A random regression test-day model was used for estimation of variance components of the milk-related traits using the DMU software (Madsen et al., 2006). In this model, we considered the herd-test days, parties, and first calving ages as fixed effects, the functions of DIM as fixed regression effects, and the individual additive genetic effects and individual permanent environmental effects as the random regression effects (Liu et al., 2020). The first calving ages of dairy cows were divided into four levels (age ≤23 months; 24 ≤ age ≤ 27; 28 ≤ age ≤ 31; and age ≥ 32). The DIM effect was fitted by a sixth-order Legendre polynomial, and the individual additive genetic effects and individual permanent environmental effects were fitted by a third-order Legendre polynomial (Li et al., 2020). The random regression test-day model was as follows (Li et al., 2020):
where the
After removing the fixed effects, all traits were calibrated to the 305-day performance and were then used as the adjusted phenotypes for the subsequent association analysis. The adjustment process of each trait was as follows:
where the
where
Principal Component Analysis
The dairy cow populations used in this study came from four different farms. To identify the population stratification, a principal component analysis (PCA) was performed on the 984 genotyped cows using the FactoMineR package in the R language (Le et al., 2008).
Genome-Wide Association Studies
The FarmCPU (Fixed and random model Circulating Probability Unification) method, based on the multilocus linear mixed model, was used to perform the genome-wide association analysis in this study (Liu et al., 2016). The SNP genotypes coded for the association analyses were converted to 0, 1, and 2 using the Plink software v1.90 (Purcell et al., 2007). Two models were included in the FarmCPU method: a fixed effects model and a random effects model. The markers that exceeded the significant threshold in the fixed effects model were detected as pseudo quantitative trait nucleotides (QTNs). Then, the pseudo QTNs were further verified by the random effect model, where the kinships were constructed using alternative sets of pseudo QTNs (Liu et al., 2016). Iterative calculations were carried out through the fixed effects model and the random effects model, until no updated pseudo QTNs exceeded the significance threshold (Liu et al., 2016). The first five highest principal components (PCs), which explained 40% of the population stratification, were considered as covariates in the fixed effects model, in order to account for the other genetic variations except for the pseudo QTNs (Marees et al., 2018). The fixed effects model was as follows (Liu et al., 2016):
where
where
where
The Bonferroni correction method (Armstrong, 2014) was used as the threshold to verify the significance of SNPs, the type I error rate in hypothesis testing was set to 5%, and the significance threshold of the association analysis was 5.90 × 10⁻⁷ (0.05/84,407).
Annotation and Enrichment Analysis of Candidate Genes
The nearest genes and the genes within 200 kilobases (kb) of the significant SNPs were selected as the candidate genes of traits, according to the bovine reference genome ARS-UCD1.2 in the UCSC database (ftp://hgdownload.soe.ucsc.edu/goldenPath/bosTau9/). To better understand the biological interactions between these candidate genes, the Kyoto Encyclopedia of Genes and Genomes (KEGG) pathways analysis and Gene Ontology (GO) analysis were conducted using the Database for Annotation, Visualization, and Integrated Discovery (DAVID) online software (https://david.ncifcrf.gov) (Dennis et al., 2003).
Results
Variance Components and Genetic Parameters
The heritabilities of the 305-day MY, MFP, MFY, MPP, and MPY were 0.34, 0.29, 0.27, 0.32, and 0.28, respectively (Table 1). The variance components and heritability of these five milk-related traits at different DIMs are shown in Figure 1. In the early lactation period (5–100 days), the additive genetic variances
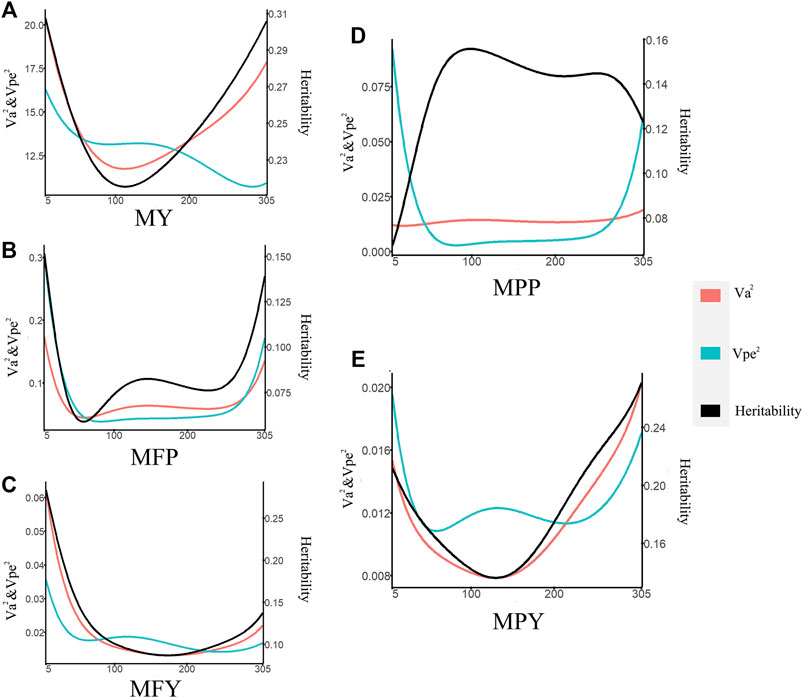
FIGURE 1. Variance component estimates of milk-related traits during the lactation (red line, additive genetic variance; blue line, permanent environmental variance; black line, heritability; (A) MY, milk yield; (B) MFP, milk fat percentage; (C) MFY, milk fat yield; (D) MPP, milk protein percentage; (E) MPY, milk protein yield).
The changes in the permanent environmental variance (
Genetic Correlations and Permanent Environmental Correlations
The genetic correlations between MY, MFP, MFY, MPP, and MPY and DIM are shown in Figure 2. The genetic correlations between the DIM of the five milk-related traits showed downward trends as the time interval increased, and the lowest genetic correlations were between the beginning of the early lactation (5–100 days) and the end of late lactation (200–305 days; Figure 2). The genetic correlations between the DIM for MY and MPY were higher within each lactation stage than in different lactation stages, and as the DIM interval increased, they decreased gradually (Figures 2A,E). However, for MFP, MFY, and MPP, the genetic correlations between DIM were high (>0.8) from the beginning to the middle of the early lactation period (5–100 days), and from the middle of the early lactation period (5–100 days) to the end of the entire lactation, as shown in Figures 2B–D.
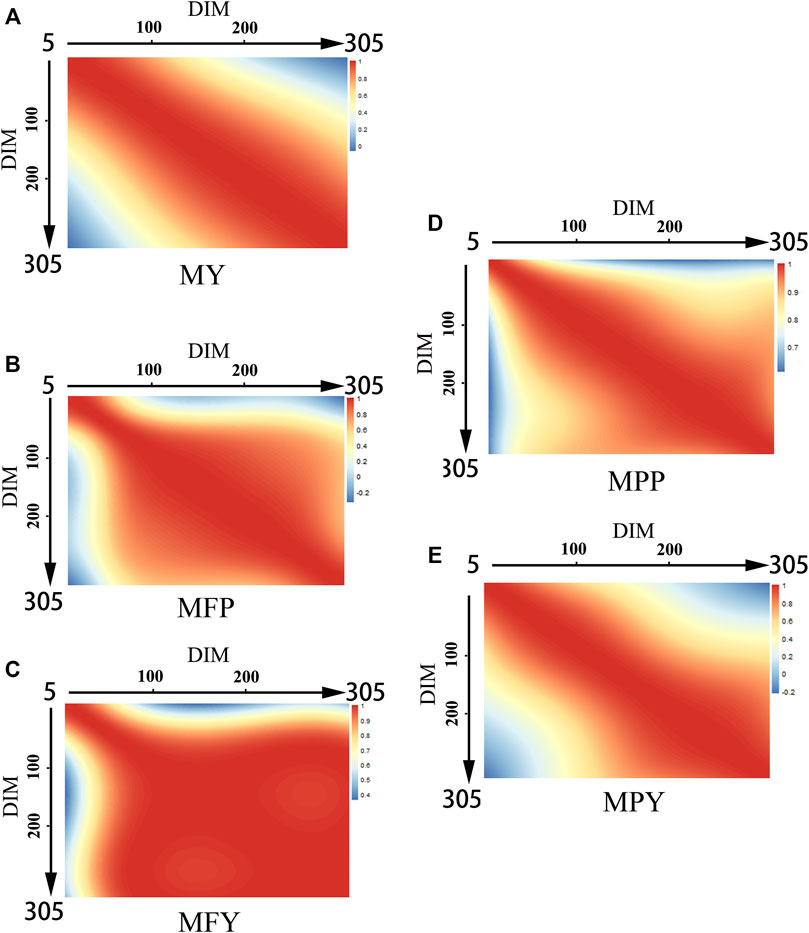
FIGURE 2. Genetic correlations of milk-related traits in different DIM during lactation ((A) MY, milk yield; (B) MFP, milk fat percentage; (C) MFY, milk fat yield; (D) MPP, milk protein percentage; (E) MPY, milk protein yield).
The permanent environmental correlations between MY, MFP, MFY, MPP, and MPY and DIM are shown in Supplementary Figure S1. The permanent environmental correlations between DIM and MY were high (>0.8) within each lactation stage, and the correlations showed a gradually declining trend as the time interval increased (Supplementary Figure S1A). For MFY and MPY, the permanent environmental correlations between DIM were high (>0.8) from the beginning to the middle of the early lactation period (5–100 days), and from the middle of the early lactation period (5–100 days) to the end of the entire lactation stage (Supplementary Figures S1C,E). For MFP and MPP, the permanent environmental correlations between DIM were high (>0.8) from the middle of the early lactation period (5–100 days) to the middle of late lactation (200–305 days). For these two traits, although the correlations were high during the period from the beginning to the middle of early lactation, and from the middle to the end of late lactation, the correlation between early lactation and late lactation was low (<0.2), or even negative (Supplementary Figures S1B,D).
Distributions and Correlations of Phenotypes
The distributions and the correlations of the phenotypes and the adjusted phenotypes of these milk-related traits are shown in Supplementary Figures S2, S3. The distribution of raw phenotypic values was irregular (Supplementary Figure S2), and after adjustment, the adjusted phenotypes were approximately normally distributed (Supplementary Figure S3). The correlations among the adjusted phenotypes of the five traits all significantly differed from zero (p < 0.05; Supplementary Figure S3). The correlations among the adjusted values of MY, MFY, and MPY were high (>0.78), and even reached 0.91 between MY and MPY. The correlations between the adjusted values of MY and MFP, and MY and MPP were significantly negative (Supplementary Figure S3). The correlations between the adjusted values of MFP and MFY were significantly positive (0.28), contrary to the correlations between MPP and MPY (−0.25; Supplementary Figure S3).
Marker Information and Population Structure
After quality control, a total of 84,407 variants on 30 chromosomes remained for association analysis. The relationship between the linkage disequilibrium (LD) value (r2) and the average distance of markers is shown in Figure 3A. As the distance increased, the average LD value between markers decreased, and the average r2 exceeded 0.35 when the distance of markers was less than 200 kb (Figure 3A).
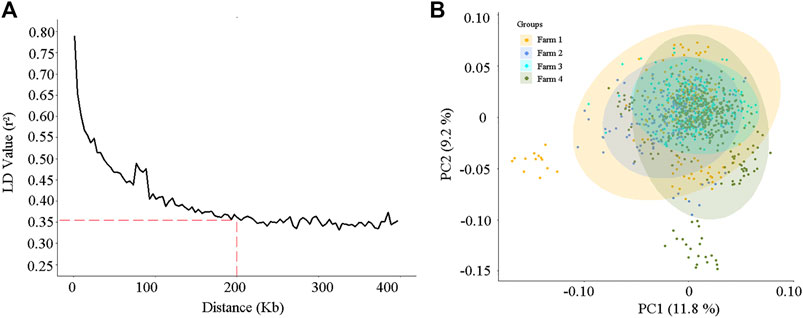
FIGURE 3. The linkage disequilibrium decay analysis (A) and the principal component analysis (B) according to the 84,407 single nucleotide polymorphisms (SNPs) for the 984 cows.
Principal component analysis (PCA) was conducted on the 984 cows, according to the variant information. As shown in Figure 3B, stratification existed in our study population, and some cows in farms 1 and 4 were separated from other individuals. The first two highest PCs explained 11.8% and 9.2% of the variation, respectively (Figure 3B). To reduce the spurious genetic associations generated by population stratification, the first five PCs, which explained 40% of the population variation, were considered and incorporated into the fixed effect model of GWAS.
Genome-Wide Association Study
In this study, 21 SNPs passed the Bonferroni correction threshold (0.05/84,407) and were significantly associated with the five milk-related traits (Figure 4A). Two SNPs (rs108962265 and rs110246034), located on chromosomes 13 and 3, were significantly associated with the trait MY, and the nearest genes to them were PITRM1 (194 kb) and PRMT6 (788 kb), respectively. Six SNPs (rs137071126, rs109278135, rs109595510, rs210744919, rs133996308, and rs133840542), located on chromosomes 14, 24, 3, 5, 28, and 12, were significantly associated with the trait MFP, with the nearest genes to them being SLC52A2 (within), NOL4 (139 kb), RCSD1 (within), MGST1 (within), PLAU (1 kb), and SUPT20H (within), respectively. Four SNPs (rs137260850, rs43527533, rs42206791, and rs109656599), located on chromosomes 16, 7, 15, and 18, were significantly associated with the trait MFY, and the nearest genes to them were PLA2G4A (75 kb), TENM2 (within), METTL15 (314 kb), and CDH13 (within), respectively. Six SNPs (rs43002440, rs135708753, rs110387086, rs132711282, rs43496186, and rs109425744), located on chromosomes 14, 12, 17, 14, 7, and 10, were significantly associated with the trait MPP, and the nearest genes to them were KHDRBS3 (31 kb), ATP11A (within), MLXIP (within), FBXO43 (within), WNT9A (44 kb), and CORO2B (37 kb), respectively. Three SNPs (rs109957491, rs109097262, and rs41906111), located on chromosomes 1, 13, and 19, were significantly associated with the trait MPY, the nearest genes to them being MFSD1 (40 kb), PLCB1 (288 kb), and MYO1D (8 kb), respectively. The detected significant SNPs explained 5.44%, 12.39%, 8.89%, 10.65%, and 7.09% of the phenotypic variation of MY, MFP, MFY, MPP, and MPY, respectively. The summary statistics of these 21 SNPs are presented in Table 2.
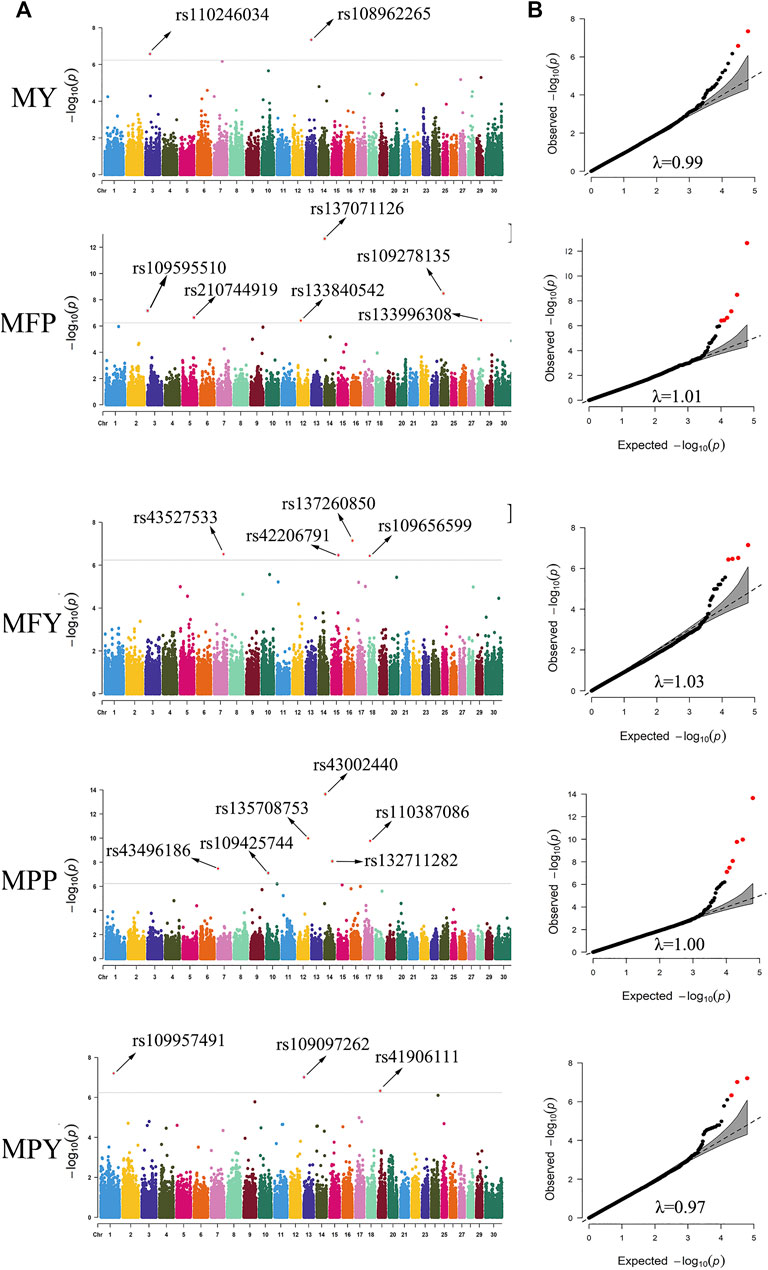
FIGURE 4. Manhattan plots (A) and quantile-quantile (QQ) plots (B) demonstrated from the genome-wide association study (GWAS) results of the milk-related traits. The significance threshold was 5.90 × 10⁻⁷. The red dots represent the significant SNPs. The abscissas and ordinates in the Manhattan plots represent the 30 chromosomes of cows and the negative logarithms of the p-values of the variants, respectively (A). The abscissas and ordinates in the QQ plots represent negative logarithms of the expected p-values and negative logarithms of the observed p-values of each SNP (B) (MY. milk yield; MFP. milk fat percentage; MFY. milk fat yield; MPP. milk protein percentage; MPY. milk protein yield, λ. inflation factor value).
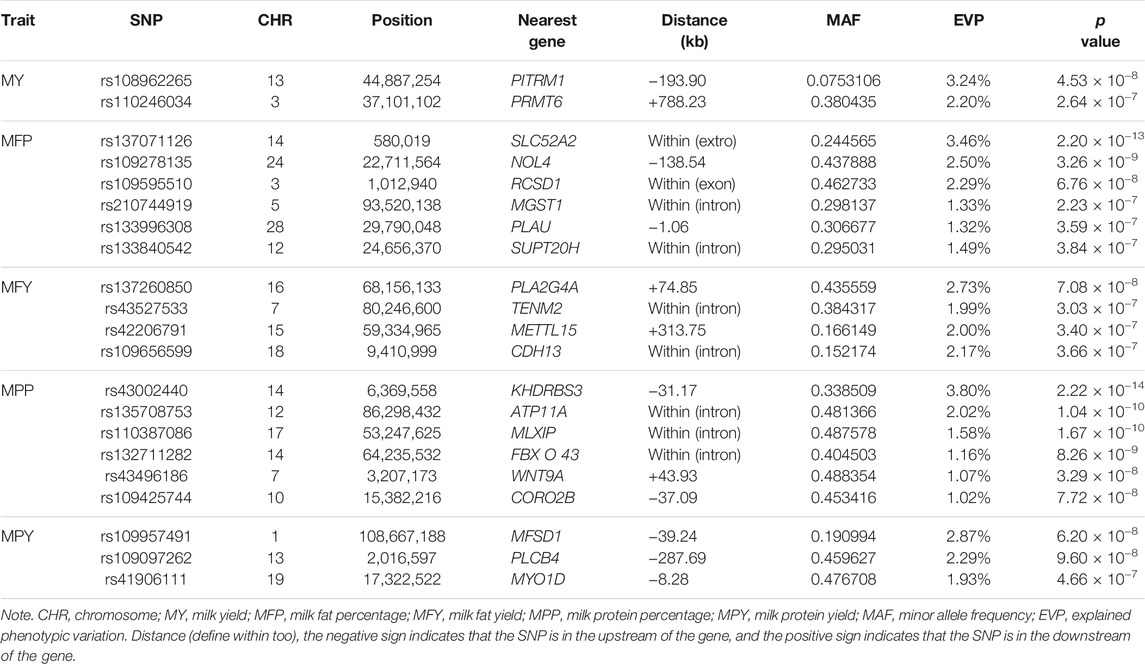
TABLE 2. Information of the identified 21 variants in the association analysis.
To evaluate the statistical validity and rationality of the association analysis, quantile–quantile (QQ) plots of the five milk-related traits were generated (Figure 4B). The vast majority of the SNPs conformed to the expected p-values, and the inflation factor (λ) values of the five milk-related traits were all close to 1 (Figure 4B), which illustrated that false positive and false negative results were well avoided in the process of association analysis. The QQ plots, as well as Manhattan plots, of the five milk-related traits are shown in Figure 4.
Enrichment Analysis
To deeply understand the biological functions of the 21 significant SNPs related to the five milk-related traits of cows (MY, MFP, MFY, MPP, and MPY), KEGG and GO analyses were conducted on the nearest genes and genes within 200 kb of these SNPs. In total, 101 genes were obtained (Supplementary Table S1). These genes were significantly enriched in metabolism and decomposition of amino acids pathways and nerve signal transduction pathways (Table 3, p < 0.05), such as melanogenesis, Wnt signaling pathway, GnRH signaling pathway, circadian entrainment, signaling pathways regulating the pluripotency of stem cells, phospholipase D signaling pathway, oxytocin signaling pathway, glutathione metabolism, mTOR signaling pathway, and long-term potentiation (Table 3). Twenty-five GO terms were significantly enriched (Supplementary Table S2, p < 0.05). After removing the terms that contained only one gene and the genes that were enriched in only one term, 13 GO terms enriched by eight genes were retained (Figure 5), which mainly participated in the progress of metabolism of fat and protein, as well as regulation of transcription, such as neutral lipid biosynthetic process, acylglycerol biosynthetic process, negative regulation of the cellular metabolic process, acylglycerol metabolic process, neutral lipid metabolic process, negative regulation of macromolecule metabolic process, protein processing, glycerolipid biosynthetic process, negative regulation of nitrogen compound metabolic process, protein maturation, negative regulation of transcription, DNA-templated negative regulation of RNA biosynthetic process, and negative regulation of nucleic acid-templated transcription. Eight of the 101 genes were detected in the above 13 biological processes (Figure 5).
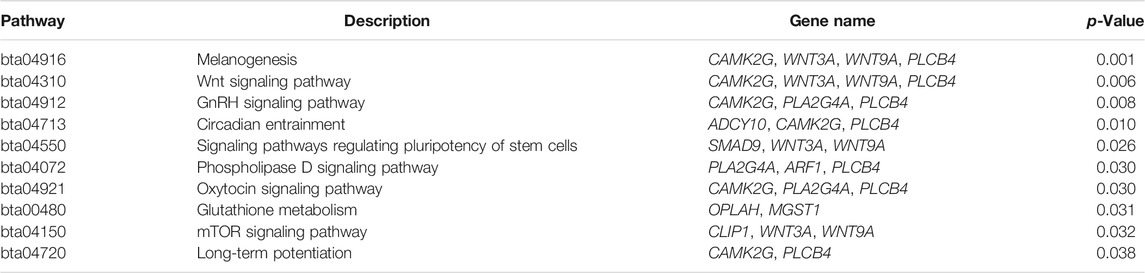
TABLE 3. Details of the Kyoto Encyclopedia of Genes and Genomes (KEGG) pathways significantly enriched from the nearest genes and the genes within 200 kb of the significant single-nucleotide polymorphisms (SNPs).
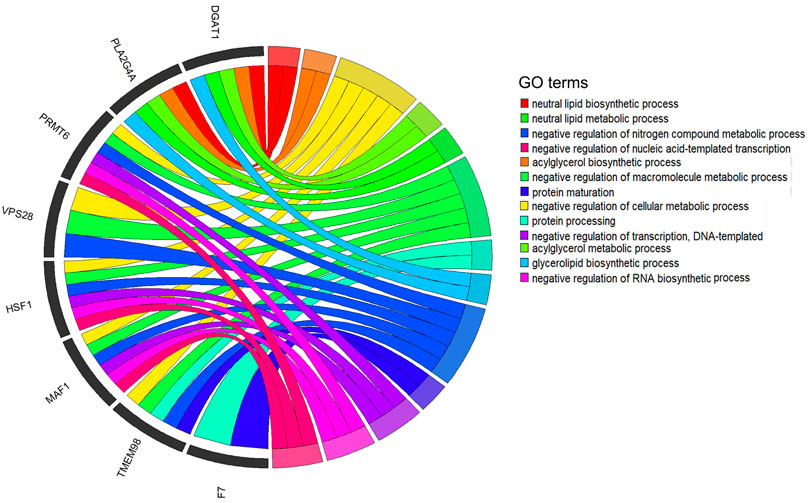
FIGURE 5. Significant Gene Ontology (GO) terms enriched by the genes within 200 kb of significant SNPs. After quality control, 13 GO terms that are enriched by eight genes are revealed in the circus plots (p < 0.05).
Discussion
A test-day model (TDM) can account for the persistence and the test-day effect on individual phenotypes, making it a powerful method to improve the reliability of EBV estimation (Schaeffer et al., 2000). The additive genetic variances, permanent environmental variances, and the heritabilities of five milk-related traits changing during lactation were assessed in this study (Figure 1), which revealed that the genes or the expression of genes that control these milk-related traits might differ along the lactation trajectory of cows (Wahinya et al., 2020). The scope of the additive genetic variances of the MY in this study (Figure 1A) was higher than that in cows in North Carolina and Portugal (Silvestre et al., 2005), but was in the same range as the cows in medium- and high-production systems in Kenya (Wahinya et al., 2020). Furthermore, the trend and range of additive genetic variations of MY during lactation (Figure 1A) were consistent with those of Japanese Holstein cows (Togashi et al., 2008). Many studies have shown that the cows with high MY have greater genetic variances than low-yield cows (Togashi et al., 2008; Wahinya et al., 2020). These higher additive variances indicate that the cows are more genetically diverse (Wahinya et al., 2020). The genetic variances and heritability at the DIM5–DIM50 and DIM250–DIM305, with respect to the MY, were higher than in other periods in this study, indicating that genetic improvement for performance during these two periods by selection could be more efficient than when considering other periods (Figure 1A).
The trajectories of additive genetic variances and the heritability of MFY and MPY with DIM (Figures 1C,E) were the same in the studies performed on cows in the United States; that is, they decreased in early lactation and then increased until the end of the lactation, while in the middle lactation stage, they all reached the minimum values over the whole lactation (DeGroot et al., 2007). Therefore, in the mid lactation period, the genetic improvement space for MFY and MPY of dairy cows was smaller than that in the early and late lactation periods. The scope and trend of the heritability of MFY (Figure 1C) were also the same as those for Tunisian Holsteins, but the trend for MPY was different (Figure 1E) (Hammami et al., 2008), which may have been due to the permanent environmental variances during the mid lactation period of the Tunisian Holstein population in the study of Hammami, being less than that observed in the cows in our research. The changes in the genetic variances and the heritability with DIM of MFP were similar to those of MFY, but the lowest values of the genetic variances and the heritability of MFP appeared in the middle of the early lactation period, earlier than for MFY (Figures 1B, C). The genetic variances of MPP were very stable over the whole lactation, but the permanent environmental variances at the beginning and the end of lactation changed dramatically, which resulted in the heritability of MPP reaching the lowest value at the beginning of early lactation (Figure 1D). This may be due to the specific environmental influences in the different farms, such as calving preparation and dry cow management (Gengler and Wiggans, 2001; Hammami et al., 2008). Our study also found that heritability of milk fat traits (MFY and MFR) was, most of the time during lactation (89.70% and 91.69%, respectively), lower than that for the corresponding milk protein traits (MPY and MPP; Figure 1), which was in agreement with previous studies (Tijani et al., 1999; Silvestre et al., 2005).
The genetic correlations between the DIM for the five milk-related traits were high through the adjacent days, and then decreased gradually as the time interval increased (Figure 2), similar to the results of the group of Wahinya (Wahinya et al., 2020). The genetic correlations between the beginning of the early lactation period and the end of the late lactation period were not high (<0.4), sometimes even being negative (MFP and MPY; Figures 2B,E). This indicated that it might not be reasonable to predict the milk potential of cows according to only their performance during the early lactation period (Bignardi et al., 2009b; Ojango et al., 2019). Therefore, keeping a record along the whole lactation is necessary for a reliable genetic evaluation of dairy cows in the lower reaches of the Yangtze River, especially for MY and MPY, due to the genetic correlation between DIM during different lactation stages being lower than that within each lactation stage (Figures 2A,E). For MFP, MFY, and MPP, the genetic correlations from DIM50 to DIM305 were as high than 0.8, and extremely few individual records missing in the middle and late stages of lactation might not make an excessive impact on the accuracy of the overall genetic evaluation (Figures 2B–D).
Analyses of linkage disequilibrium (LD) and population stratification are the premises and important steps for association studies (Bulik-Sullivan et al., 2015; Lu et al., 2021). In this study, the degree of LD (r2) showed a downward trend as the average distance between SNPs increased (Figure 3A). It is worth noting that in beef cattle populations, such as Angus cattle, Brahman cattle, Belmont Red cattle, Santa Gertrudis cattle, and Iranian water buffalo (Porto-Neto et al., 2014; Mokhber et al., 2019), the decay rate is much higher than that observed for the dairy cows in this research. This might be due to the process of artificial domestication and selection in beef cattle being slower than that for dairy cows (Porto-Neto et al., 2014). In the present study, the r2 of the LD was approximately equal to 0.35 when the average distance of SNPs was 200 kb, and it increased as the average SNPs distance decreased (Figure 3A). Two hundred kilobases is a common distance, which has been used to find and annotate genes related to SNPs in previous association studies (Sanchez et al., 2017; Mota et al., 2020; Lu et al., 2021). Selecting the most significant principal components (PCs), which were constructed from the SNP variables of the research population, as the covariates in the fixed effect model of the GWAS provides an effective method to reduce the effects produced by population stratification (Marees et al., 2018; Jiang et al., 2019b). In the present study, the PCA scatter plot showed that population stratification, indeed, appeared in our study population, and the highest two PCs explained 21% of the variation (Figure 3B). After proper correction, the inflation factor (λ) values of the five milk-related traits were all close to 1 (Figure 4B), and the overwhelming majority of observed p-values of the SNPs were in line with our expectations (Figure 4B), indicating that the population stratification was effectively in control (Price et al., 2010).
In this study, a total of 21 SNPs exceeding the significance threshold (5.90 × 10⁻⁷) were identified to be associated with MY, MFP, MFY, MPP, and MPY (Figure 4A). Among these SNPs, some were in QTL regions that have been reported previously, such as rs137071126 (Buitenhuis et al., 2014; Fang et al., 2014), rs42206791 (Jiang J. et al., 2019), rs43002440 (Jiang J. et al., 2019), rs132711282 (Jiang J. et al., 2019), and rs109097262 (Cole et al., 2011). The genes nearest these 21 SNPs are shown in Table 2, some of which have been confirmed to be related to the corresponding milk-related traits. PITRM1 has been reported to be related to the milk production progress in Reggiana cows (Bertolini et al., 2020). SLC52A2 plays a potential role in the mammary gland and affects the fatty acid content in dairy cows (Palombo et al., 2018). MGST1 has been identified to be highly associated with MFP and other milk composition traits in cattle (Littlejohn et al., 2016). It was reported that the expression level of PLAU activity is high in the peak lactation periods of dairy cows and could affect the composition of milk fatty acids (Wickramasinghe et al., 2012). PLA2G4A participates in catalyzing the hydrolysis of membrane glycerophospholipids, promoting the production of free fatty acids in milk (Diouf et al., 2006). CDH13 has been reported to be associated with milk cholesterol in cows (Do et al., 2018). FBXO43 has been primarily implicated in the MPY of cows (Tribout et al., 2020). PLCB4 is a significant gene included in the phosphatidylinositol pathway and may affect the stability of the cream emulsion in milk (Dadousis et al., 2017b).
To further reveal the functional orientation of the significant SNPs, an enrichment analysis was performed for the genes nearest or within 200 kb of these variants, and 101 genes were found (Supplementary Table S1). Due to the high phenotypic (Supplementary Figures S2, S3) and genetic correlations (Liu et al., 2020) of these five milk-related traits, we conducted the enrichment analysis for all the candidate genes of the five traits, and 10 KEGG pathways were significantly enriched (p < 0.05, Table 3). All of these pathways have been reported to be highly related to milk-related traits in cattle. The melanogenesis pathway has been significantly related to the MY of river buffaloes (Menon et al., 2016). The Wnt signaling pathway has been found to be essential for the development of the mammary gland during lactation in Holstein cows (Wang et al., 2013). GnRH is synthesized and released in the hypothalamus from the GnRH neurons, and GnRH and oxytocin are strongly related to reproduction in mammals (Schneider et al., 2006); Furthermore, a close relationship has been revealed between reproduction and milk production in dairy cows (Dadousis et al., 2017a). Phospholipase D, from the phospholipase D signaling pathway, is not only the key enzyme for the generation of phosphatidic acid but also the main molecular substance in the synthesis of milk fat. In Thai multibreed dairy population, the Wnt signaling pathway, the phospholipase D signaling pathway, and circadian entrainment could explain 0.31, 0.47, and 0.38% of the genetic variance in MY, respectively, and explained 0.30, 0.44, and 0.36% of the genetic variance in MFY, respectively (Laodim et al., 2019). Folic acid regulates many key metabolic-related genes in the glutathione metabolism pathway, and the secretion of folic acid may increase milk yield in the perinatal period of dairy cows (Khan et al., 2020). Melatonin can inhibit the mTOR signaling pathway and suppress milk fat synthesis in bovine mammary epithelial cells (Wang Y. et al., 2019). Long-term potentiation has been related to the amino acid composition of the MFP, which could affect the taste and flavor of milk (Dadousis et al., 2017a). We speculate that genes in these pathways could be candidate genes for milk-related traits in cows.
The genes nearest or within 200 kb of the significant SNPs were significantly enriched in 25 GO terms (p < 0.05, Supplementary Table S2). To discover the core terms and genes affecting the milk performance of cows, the GO terms that contained only one gene and the genes enriched in only one term were removed. Finally, 13 GO terms enriched by eight genes remained for analysis (Figure 5). These 13 terms were mainly involved in the lipid biosynthetic and metabolic process, protein maturation process, regulation of transcription process, and regulation of macromolecule metabolic processes (Figure 5), which are all highly related to milk-related traits of cows (Bauman et al., 2006; Osorio et al., 2016). Furthermore, eight of the candidate genes were detected in these processes frequently (Figure 5). It is well known that the DGAT1 gene is a fundamental metabolic enzyme that plays important roles in triglyceride biosynthesis, glyceride metabolism, and the digestion and absorption of the fat in milk (Yen et al., 2008). Many previous studies have revealed the relationships between DGAT1 and milk-related traits, especially that the polymorphism of K232A in DGAT1 significantly influences the MFY and MPY (Bovenhuis et al., 2016; Yao et al., 2021). VPS28 may regulate milk fat synthesis through ubiquitylation in bovine mammary epithelial cells (Liu and Zhang, 2020). It has been reported that a single nucleotide polymorphism of HSF1 is related to the milk fatty acid composition in Italian Holstein cows (Palombo et al., 2018). MAF1 is a candidate gene related to MY and MPY in Canadian Holstein cows (Oliveira et al., 2018). One nonsynonymous coding SNP (rs136905662, p.Gly265Val, c.794G>T) on the F7 gene has been reported to be associated with the content of caproic acid in milk (Ibeagha-Awemu et al., 2016). Therefore, we speculated that these genes may play key roles in the variation of these milk-related traits.
Conclusion
In this study, we estimated the genetic parameters of five milk-related traits using a random regression test-day model, and performed genome-wide association analyses on these traits. The additive genetic variances, the permanent environmental variances, and the heritabilities of these traits constantly changed throughout the whole lactation, and the genetic correlations and permanent environmental correlations between different DIMs within lactation decreased as the time interval increased. A total of 21 SNPs were detected as being significantly associated with these milk-related traits, five of which were located in QTL regions that have been previously reported. We also found 17 candidate genes that may play key roles in the phenotypic variation of these traits. The presented results could be useful for understanding the basis of quantitative genetics and the genetic architecture of milk-related traits in dairy cows, thus, contributing to the genetic improvement of dairy cows in the lower reaches of the Yangtze River.
Data Availability Statement
The original contributions presented in the study are included in the article/Supplementary Material, further inquiries can be directed to the corresponding authors.
Ethics Statement
The animal study was reviewed and approved by the Institutional Animal Care and Use Committee of the School of the Yangzhou University Animal Experiments Ethics Committee (Permit Number: SYXK(Su)IACUC 2012-0029).
Author Contributions
XL, GS, and ZY conceived and designed the study. XL wrote the original draft. XL, AA, IA, and DL conducted all analysis. ZZ and TX revised the manuscript. ZZ, TX, and DL helped with the data collection and project coordination. All authors provided critical feedback and helped shape the manuscript, and all authors have read and agreed to the published version of the manuscript.
Funding
This research was funded by the Earmarked Fund for Jiangsu Agricultural Industry Technology System (JATS(2021)486) and the Postgraduate Research and Practice Innovation Program of Yangzhou University (XKYCX20_026).
Conflict of Interest
The authors declare that the research was conducted in the absence of any commercial or financial relationships that could be construed as a potential conflict of interest.
Publisher’s Note
All claims expressed in this article are solely those of the authors and do not necessarily represent those of their affiliated organizations, or those of the publisher, the editors, and the reviewers. Any product that may be evaluated in this article, or claim that may be made by its manufacturer, is not guaranteed or endorsed by the publisher.
Acknowledgments
We thank Yongjiang Mao of the Yangzhou University for his professional genetic evaluation and statistical analysis guidance in this study. We thank the China Scholarship Council for funding the exchange study of XL at Aarhus University.
Supplementary Material
The Supplementary Material for this article can be found online at: https://www.frontiersin.org/articles/10.3389/fgene.2021.799664/full#supplementary-material
References
Armstrong, R. A. (2014). When to Use the Bonferroni Correction. Ophthalmic Physiol. Opt. 34 (5), 502–508. doi:10.1111/opo.12131
Bauman, D. E., Mather, I. H., Wall, R. J., and Lock, A. L. (2006). Major Advances Associated with the Biosynthesis of Milk. J. Dairy Sci. 89 (4), 1235–1243. doi:10.3168/jds.S0022-0302(06)72192-0
Bertolini, F., Schiavo, G., Bovo, S., Sardina, M. T., Mastrangelo, S., Dall’Olio, S., et al. (2020). Comparative Selection Signature Analyses Identify Genomic Footprints in Reggiana Cattle, the Traditional Breed of the Parmigiano-Reggiano Cheese Production System. Animal 14 (5), 921–932. doi:10.1017/S1751731119003318
Bignardi, A. B., El Faro, L., Cardoso, V. L., Machado, P. F., and Albuquerque, L. G. (2009a). Parametric Correlation Functions to Model the Structure of Permanent Environmental (Co)variances in Milk Yield Random Regression Models. J. Dairy Sci. 92 (9), 4634–4640. doi:10.3168/jds.2009-2128
Bignardi, A. B., El Faro, L., Cardoso, V. L., Machado, P. F., and de Albuquerque, L. G. (2009b). Random Regression Models to Estimate Test-Day Milk Yield Genetic Parameters Holstein Cows in Southeastern Brazil. Livestock Sci. 123 (1), 1–7. doi:10.1016/j.livsci.2008.09.021
Bionaz, M., Loor, J., and Loor, J. J. (2008b). Gene Networks Driving Bovine Milk Fat Synthesis during the Lactation Cycle. BMC Genomics 9, 366. doi:10.1186/1471-2164-9-366
Bovenhuis, H., Visker, M. H. P. W., Poulsen, N. A., Sehested, J., van Valenberg, H. J. F., van Arendonk, J. A. M., et al. (2016). Effects of the Diacylglycerol O-Acyltransferase 1 (DGAT1) K232A Polymorphism on Fatty Acid, Protein, and mineral Composition of Dairy Cattle Milk. J. Dairy Sci. 99 (4), 3113–3123. doi:10.3168/jds.2015-10462
Buitenhuis, B., Janss, L. L., Poulsen, N. A., Larsen, L. B., Larsen, M. K., and Sørensen, P. (2014). Genome-wide Association and Biological Pathway Analysis for Milk-Fat Composition in Danish Holstein and Danish Jersey Cattle. BMC Genomics 15 (1), 1112. doi:10.1186/1471-2164-15-1112
Bulik-Sullivan, B. K., Loh, P. R., Loh, P.-R., Finucane, H. K., Ripke, S., Yang, J., et al. (2015). LD Score Regression Distinguishes Confounding from Polygenicity in Genome-wide Association Studies. Nat. Genet. 47 (3), 291–295. doi:10.1038/ng.3211
Cole, J. B., Wiggans, G. R., Ma, L., Sonstegard, T. S., Lawlor, T. J., Crooker, B. A., et al. (2011). Genome-wide Association Analysis of Thirty One Production, Health, Reproduction and Body Conformation Traits in Contemporary U.S. Holstein Cows. BMC Genomics 12 (1), 408. doi:10.1186/1471-2164-12-408
Dadousis, C., Pegolo, S., Rosa, G. J. M., Bittante, G., and Cecchinato, A. (2017a). Genome-wide Association and Pathway-Based Analysis Using Latent Variables Related to Milk Protein Composition and Cheesemaking Traits in Dairy Cattle. J. Dairy Sci. 100 (11), 9085–9102. doi:10.3168/jds.2017-13219
Dadousis, C., Pegolo, S., Rosa, G. J. M., Gianola, D., Bittante, G., and Cecchinato, A. (2017b). Pathway-based Genome-wide Association Analysis of Milk Coagulation Properties, Curd Firmness, Cheese Yield, and Curd Nutrient Recovery in Dairy Cattle. J. Dairy Sci. 100 (2), 1223–1231. doi:10.3168/jds.2016-11587
DeGroot, B. J., Keown, J. F., Van Vleck, L. D., and Kachman, S. D. (2007). Estimates of Genetic Parameters for Holstein Cows for Test-Day Yield Traits with a Random Regression Cubic Spline Model. Genet. Mol. Res. 6 (2), 434–444.
Dennis, G., Sherman, B. T., Hosack, D. A., Yang, J., Gao, W., Lane, H. C., et al. (2003). DAVID: Database for Annotation, Visualization, and Integrated Discovery. Genome Biol. 4 (9). doi:10.1186/gb-2003-4-9-r60
Ding, Y., Wang, W., Song, R., Shao, Q., Jiao, X., and Xing, W. (2017). Modeling Spatial and Temporal Variability of the Impact of Climate Change on rice Irrigation Water Requirements in the Middle and Lower Reaches of the Yangtze River, China. Agric. Water Manag. 193, 89–101. doi:10.1016/j.agwat.2017.08.008
Diouf, M. N., Sayasith, K., Lefebvre, R., Silversides, D. W., Sirois, J., and Lussier, J. G. (2006). Expression of Phospholipase A2 Group IVA (PLA2G4A) Is Upregulated by Human Chorionic Gonadotropin in Bovine Granulosa Cells of Ovulatory Follicles1. Biol. Reprod. 74 (6), 1096–1103. doi:10.1095/biolreprod.105.048579
Do, D. N., Schenkel, F. S., Miglior, F., Zhao, X., and Ibeagha-Awemu, E. M. (2018). Genome Wide Association Study Identifies Novel Potential Candidate Genes for Bovine Milk Cholesterol Content. Sci. Rep. 8 (1), 13239. doi:10.1038/s41598-018-31427-0
Fang, M., Fu, W., Jiang, D., Zhang, Q., Sun, D., Ding, X., et al. (2014). A Multiple-SNP Approach for Genome-wide Association Study of Milk Production Traits in Chinese Holstein Cattle. PLoS ONE 9 (8), e99544. doi:10.1371/journal.pone.0099544
Ferreri, M., Gao, J., Wang, Z., Chen, L., Su, J., and Han, B. (2011). Chinese Holstein Cattle Shows a Genetic Contribution from Native Asian Cattle Breeds: A Study of Shared Haplotypes and Demographic History. Asian Australas. J. Anim. Sci. 24 (8), 1048–1052. doi:10.5713/ajas.2011.10461
Fragomeni, B. O., Lourenco, D. A. L., Masuda, Y., Legarra, A., and Misztal, I. (2017). Incorporation of Causative Quantitative Trait Nucleotides in Single-step GBLUP. Genet. Sel Evol. 49 (1), 59. doi:10.1186/s12711-017-0335-0
Gengler, N., and Wiggans, G. (2001). Variance of Effects of Lactation Stage within Herd by Herd Yield. J. Anim. Sci. 79, 216.
Hammami, H., Rekik, B., Soyeurt, H., Ben Gara, A., and Gengler, N. (2008). Genetic Parameters for Tunisian Holsteins Using a Test-Day Random Regression Model. J. Dairy Sci. 91 (5), 2118–2126. doi:10.3168/jds.2007-0382
Hayes, B., and Goddard, M. (2010). Genome-wide Association and Genomic Selection in Animal breedingThis Article Is One of a Selection of Papers from the Conference "Exploiting Genome-wide Association in Oilseed Brassicas: a Model for Genetic Improvement of Major OECD Crops for Sustainable Farming". Genome 53 (11), 876–883. doi:10.1139/g10-076
Ibeagha-Awemu, E. M., Peters, S. O., Akwanji, K. A., Imumorin, I. G., and Zhao, X. (2016). High Density Genome Wide Genotyping-By-Sequencing and Association Identifies Common and Low Frequency SNPs, and Novel Candidate Genes Influencing Cow Milk Traits. Sci. Rep. 6 (1), 31109. doi:10.1038/srep31109
Jiang, J., Ma, L., Prakapenka, D., VanRaden, P. M., Cole, J. B., and Da, Y. (2019a). A Large-Scale Genome-wide Association Study in U.S. Holstein Cattle. Front. Genet. 10, 412. doi:10.3389/fgene.2019.00412
Jiang, L., Zheng, Z., Qi, T., Kemper, K. E., Wray, N. R., Visscher, P. M., et al. (2019b). A Resource-Efficient Tool for Mixed Model Association Analysis of Large-Scale Data. Nat. Genet. 51(12), 1749-1755. doi:10.1038/s41588-019-0530-8
Khan, M. Z., Liu, L., Zhang, Z., Khan, A., Wang, D., Mi, S., et al. (2020). Folic Acid Supplementation Regulates Milk Production Variables, Metabolic Associated Genes and Pathways in Perinatal Holsteins. J. Anim. Physiol. Anim. Nutr. 104 (2), 483–492. doi:10.1111/jpn.13313
Laodim, T., Elzo, M. A., Koonawootrittriron, S., Suwanasopee, T., and Jattawa, D. (2019). Pathway Enrichment and Protein Interaction Network Analysis for Milk Yield, Fat Yield and Age at First Calving in a Thai Multibreed Dairy Population. Asian-australas. J. Anim. Sci. 32 (4), 508–518. doi:10.5713/ajas.18.0382
Lê, S., Josse, J., and Husson, F. (2008). FactoMineR: AnRPackage for Multivariate Analysis. J. Stat. Soft. 25 (1), 1–18. doi:10.18637/jss.v025.i01
Li, J., Gao, H., Madsen, P., Li, R., Liu, W., Bao, P., et al. (2020). Impact of the Order of Legendre Polynomials in Random Regression Model on Genetic Evaluation for Milk Yield in Dairy Cattle Population. Front. Genet. 11 (1269). doi:10.3389/fgene.2020.586155
Li, X., Lund, M. S., Janss, L., Wang, C., Ding, X., Zhang, Q., et al. (2017). The Patterns of Genomic Variances and Covariances across Genome for Milk Production Traits between Chinese and Nordic Holstein Populations. BMC Genet. 18 (1), 26. doi:10.1186/s12863-017-0491-9
Littlejohn, M. D., Tiplady, K., Fink, T. A., Lehnert, K., Lopdell, T., Johnson, T., et al. (2016). Sequence-based Association Analysis Reveals an MGST1 eQTL with Pleiotropic Effects on Bovine Milk Composition. Sci. Rep. 6 (1), 25376. doi:10.1038/srep25376
Liu, L., and Zhang, Q. (2020). Comparative Proteome Analysis Reveals VPS28 Regulates Milk Fat Synthesis through Ubiquitylation in Bovine Mammary Epithelial Cells. PeerJ 8, e9542. doi:10.7717/peerj.9542
Liu, L., Zhou, J., Chen, C. J., Zhang, J., Wen, W., Tian, J., et al. (2020). GWAS-based Identification of New Loci for Milk Yield, Fat, and Protein in Holstein Cattle. Animals 10 (11), 2048. doi:10.3390/ani10112048
Liu, S., Tan, H., Yang, L., and Yi, J. (2014). Genetic Parameter Estimates for Selected Type Traits and Milk Production Traits of Holstein Cattle in Southern China. Turkish J. Vet. Anim. Sci. 38 (5), 552–556.
Liu, X., Huang, M., Fan, B., Buckler, E. S., and Zhang, Z. (2016). Iterative Usage of Fixed and Random Effect Models for Powerful and Efficient Genome-wide Association Studies. Plos Genet. 12 (2), e1005767. doi:10.1371/journal.pgen.1005767
Liu Y, Y., Xu, L., Yang, L., Zhao, G., Li, J., Liu, D., et al. (20201649). Discovery of Genomic Characteristics and Selection Signatures in Southern Chinese Local Cattle. Front. Genet. 11. doi:10.3389/fgene.2020.533052
Lu, X., Abdalla, I. M., Nazar, M., Fan, Y., Zhang, Z., Wu, X., et al. (2021). Genome-Wide Association Study on Reproduction-Related Body-Shape Traits of Chinese Holstein Cows. Animals 11 (7), 1927. doi:10.3390/ani11071927
Madsen, P., Milkevych, V., Gao, H., Christensen, O. F., and Jensen, J. (2014). "DMU - A Package for Analyzing Multivariate Mixed Models in Quantitative Genetics and Genomics").
Marees, A. T., de Kluiver, H., Stringer, S., Vorspan, F., Curis, E., Marie-Claire, C., et al. (2018). A Tutorial on Conducting Genome-wide Association Studies: Quality Control and Statistical Analysis. Int. J. Methods Psychiatr. Res. 27 (2), e1608. doi:10.1002/mpr.1608
Menon, R., Patel, A. B., and Joshi, C. (2016). Comparative Analysis of SNP Candidates in Disparate Milk Yielding River Buffaloes Using Targeted Sequencing. PeerJ 4, e2147. doi:10.7717/peerj.2147
Mokhber, M., Shahrbabak, M. M., Sadeghi, M., Shahrbabak, H. M., Stella, A., Nicolzzi, E., et al. (2019). Study of Whole Genome Linkage Disequilibrium Patterns of Iranian Water buffalo Breeds Using the Axiom Buffalo Genotyping 90K Array. PLoS ONE 14 (5), e0217687. doi:10.1371/journal.pone.0217687
Mota, L. F. M., Lopes, F. B., Fernandes Júnior, G. A., Rosa, G. J. M., Magalhães, A. F. B., Carvalheiro, R., et al. (2020). Genome-wide Scan Highlights the Role of Candidate Genes on Phenotypic Plasticity for Age at First Calving in Nellore Heifers. Sci. Rep. 10 (1), 6481. doi:10.1038/s41598-020-63516-4
Ojango, J. M. K., Mrode, R., Rege, J. E. O., Mujibi, D., Strucken, E. M., Gibson, J., et al. (2019). Genetic Evaluation of Test-Day Milk Yields from Smallholder Dairy Production Systems in Kenya Using Genomic Relationships. J. Dairy Sci. 102 (6), 5266–5278. doi:10.3168/jds.2018-15807
Oliveira, H., Silva, F., Brito, L., Jamrozik, J., Lourenco, D., and Schenkel, F. (2018). Genome-wide Association Study for Milk, Fat and Protein Yields in Different Lactation Stages in Canadian Holstein and Jersey Cattle.
Osorio, J. S., Lohakare, J., and Bionaz, M. (2016). Biosynthesis of Milk Fat, Protein, and Lactose: Roles of Transcriptional and Posttranscriptional Regulation. Physiol. Genomics 48 (4), 231–256. doi:10.1152/physiolgenomics.00016.2015
Palombo, V., Milanesi, M., Sgorlon, S., Capomaccio, S., Mele, M., Nicolazzi, E., et al. (2018). Genome-wide Association Study of Milk Fatty Acid Composition in Italian Simmental and Italian Holstein Cows Using Single Nucleotide Polymorphism Arrays. J. Dairy Sci. 101 (12), 11004–11019. doi:10.3168/jds.2018-14413
Pereira, R. J., Bignardi, A. B., El Faro, L., Verneque, R. S., Vercesi Filho, A. E., and Albuquerque, L. G. (2013). Random Regression Models Using Legendre Polynomials or Linear Splines for Test-Day Milk Yield of Dairy Gyr (Bos indicus) Cattle. J. Dairy Sci. 96 (1), 565–574. doi:10.3168/jds.2011-5051
Porto-Neto, L. R., Kijas, J. W., and Reverter, A. (2014). The Extent of Linkage Disequilibrium in Beef Cattle Breeds Using High-Density SNP Genotypes. Genet. Sel Evol. 46 (1), 22. doi:10.1186/1297-9686-46-22
Price, A. L., Zaitlen, N. A., Reich, D., and Patterson, N. (2010). New Approaches to Population Stratification in Genome-wide Association Studies. Nat. Rev. Genet. 11 (7), 459–463. doi:10.1038/nrg2813
Purcell, S., Neale, B., Todd-Brown, K., Thomas, L., Ferreira, M. A. R., Bender, D., et al. (2007). A Tool Set for Whole-Genome Association and Population-Based Linkage Analyses. Am. J. Hum. Genet. 81 (3), 559–575. doi:10.1086/519795
Sanchez, M.-P., Govignon-Gion, A., Croiseau, P., Fritz, S., Hozé, C., Miranda, G., et al. (2017). Within-breed and Multi-Breed GWAS on Imputed Whole-Genome Sequence Variants Reveal Candidate Mutations Affecting Milk Protein Composition in Dairy Cattle. Genet. Sel Evol. 49 (1), 68. doi:10.1186/s12711-017-0344-z
Schaeffer, L. R., Jamrozik, J., Kistemaker, G. J., and Van Doormaal, J. (2000). Experience with a Test-Day Model. J. Dairy Sci. 83 (5), 1135–1144. doi:10.3168/jds.S0022-0302(00)74979-4
Schneider, F., Tomek, W., and Gründker, C. (2006). Gonadotropin-releasing Hormone (GnRH) and its Natural Analogues: A Review. Theriogenology 66 (4), 691–709. doi:10.1016/j.theriogenology.2006.03.025
Silvestre, A. M., Petim-Batista, F., and Colaço, J. (2005). Genetic Parameter Estimates of Portuguese Dairy Cows for Milk, Fat, and Protein Using a Spline Test-Day Model. J. Dairy Sci. 88 (3), 1225–1230. doi:10.3168/jds.S0022-0302(05)72789-2
Silvestre, A. M., Petim-Batista, F., and Colaço, J. (2006). The Accuracy of Seven Mathematical Functions in Modeling Dairy Cattle Lactation Curves Based on Test-Day Records from Varying Sample Schemes. J. Dairy Sci. 89 (5), 1813–1821. doi:10.3168/jds.S0022-0302(06)72250-0
Tijani, A., Wiggans, G. R., Van Tassell, C. P., Philpot, J. C., and Gengler, N. (1999). Use of (Co)Variance Functions to Describe (Co)Variances for Test Day Yield1. J. Dairy Sci. 82 (1), 226.e221–226.e214. doi:10.3168/jds.S0022-0302(99)75228-8
Togashi, K., Lin, C. Y., Atagi, Y., Hagiya, K., Sato, J., and Nakanishi, T. (2008). Genetic Characteristics of Japanese Holstein Cows Based on Multiple-Lactation Random Regression Test-Day Animal Models. Livestock Sci. 114 (2), 194–201. doi:10.1016/j.livsci.2007.04.023
Tribout, T., Croiseau, P., Lefebvre, R., Barbat, A., Boussaha, M., Fritz, S., et al. (2020). Confirmed Effects of Candidate Variants for Milk Production, Udder Health, and Udder Morphology in Dairy Cattle. Genet. Sel Evol. 52. doi:10.1186/s12711-020-00575-1
Wahinya, P. K., Jeyaruban, M. G., Swan, A. A., Gilmour, A. R., and Magothe, T. M. (2020). Genetic Parameters for Test-Day Milk Yield, Lactation Persistency, and Fertility in Low-, Medium-, and High-Production Systems in Kenya. J. Dairy Sci. 103 (11), 10399–10413. doi:10.3168/jds.2020-18350
Wang, D., Ning, C., Liu, J.-F., Zhang, Q., and Jiang, L. (2019a). Short Communication: Replication of Genome-wide Association Studies for Milk Production Traits in Chinese Holstein by an Efficient Rotated Linear Mixed Model. J. Dairy Sci. 102 (3), 2378–2383. doi:10.3168/jds.2018-15298
Wang, W., Pan, Y.-W., Wietecha, T., Zou, J., Abel, G. M., Kuo, C. T., et al. (2013). Extracellular Signal-Regulated Kinase 5 (ERK5) Mediates Prolactin-Stimulated Adult Neurogenesis in the Subventricular Zone and Olfactory Bulb. J. Biol. Chem. 288 (4), 2623–2631. doi:10.1074/jbc.m112.401091
Wang, Y., Guo, W., Xu, H., Tang, K., Zan, L., and Yang, W. (2019b). Melatonin Suppresses Milk Fat Synthesis by Inhibiting the mTOR Signaling Pathway via the MT1 Receptor in Bovine Mammary Epithelial Cells. J. Pineal Res. 67 (3), e12593. doi:10.1111/jpi.12593
Wickramasinghe, S., Rincon, G., Islas-Trejo, A., and Medrano, J. F. (2012). Transcriptional Profiling of Bovine Milk Using RNA Sequencing. BMC Genomics 13 (1), 45. doi:10.1186/1471-2164-13-45
Yang, F., Chen, F., Li, L., Yan, L., Badri, T., Lv, C., et al. (2019). Three Novel Players: PTK2B, SYK, and TNFRSF21 Were Identified to Be Involved in the Regulation of Bovine Mastitis Susceptibility via GWAS and Post-transcriptional Analysis. Front. Immunol. 10, 1579. doi:10.3389/fimmu.2019.01579
Yao, D. W., Ma, J., Yang, C. L., Chen, L. L., He, Q. Y., Coleman, D. N., et al. (2021). Phosphatase and Tensin Homolog (PTEN) Suppresses Triacylglycerol Accumulation and Monounsaturated Fatty Acid Synthesis in Goat Mammary Epithelial Cells. J. Dairy Sci. 104 (6), 7283–7294. doi:10.3168/jds.2020-18784
Yen, C.-L. E., Stone, S. J., Koliwad, S., Harris, C., and Farese, R. V. (2008). Thematic Review Series: Glycerolipids. DGAT Enzymes and Triacylglycerol Biosynthesis. J. Lipid Res. 49 (11), 2283–2301. doi:10.1194/jlr.r800018-jlr200
Keywords: Chinese holstein, milk-related traits, test-day model, genetic parameters, genome-wide association study (GWAS)
Citation: Lu X, Arbab AAI, Abdalla IM, Liu D, Zhang Z, Xu T, Su G and Yang Z (2022) Genetic Parameter Estimation and Genome-Wide Association Study-Based Loci Identification of Milk-Related Traits in Chinese Holstein. Front. Genet. 12:799664. doi: 10.3389/fgene.2021.799664
Received: 21 October 2021; Accepted: 07 December 2021;
Published: 28 January 2022.
Edited by:
Peixin Jiao, Northeast Agricultural University, ChinaReviewed by:
Runjun Yang, Jilin University, ChinaHuaiping Shi, Northwest A and F University, China
Sutian Wang, Guangdong Academy of Agricultural Sciences, China
Copyright © 2022 Lu, Arbab, Abdalla, Liu, Zhang, Xu, Su and Yang. This is an open-access article distributed under the terms of the Creative Commons Attribution License (CC BY). The use, distribution or reproduction in other forums is permitted, provided the original author(s) and the copyright owner(s) are credited and that the original publication in this journal is cited, in accordance with accepted academic practice. No use, distribution or reproduction is permitted which does not comply with these terms.
*Correspondence: Guosheng Su, Z3Vvc2hlbmcuc3VAcWdnLmF1LmRr; Zhangping Yang, eXpwQHl6dS5lZHUuY24=