 Xi Zhang1,2*
 David Roy Smith3*
- 1Department of Biochemistry and Molecular Biology, Dalhousie University, Halifax, NS, Canada
- 2Institute for Comparative Genomics, Dalhousie University, Halifax, NS, Canada
- 3Department of Biology, Western University, London, ON, Canada
Gene duplication plays an important role in evolutionary mechanism, which can act as a new source of genetic material in genome evolution. However, detecting duplicate genes from genomic data can be challenging. Various bioinformatics resources have been developed to identify duplicate genes from single and/or multiple species. Here, we summarize the metrics used to measure sequence identity among gene duplicates within species, compare several computational approaches that have been used to predict gene duplicates, and review recent advancements of a Basic Local Alignment Search Tool (BLAST)-based web tool and database, allowing future researchers to easily identify intra-species gene duplications. This article is a quick reference guide for research tools used for detecting gene duplicates.
Introduction
Gene duplication can generate new genetic functions, a phenomenon which has been widely evidenced across the eukaryotic Tree of Life (Conant and Wolfe, 2008). There exist various models and mechanisms to explain the formation and retention of duplicated genes within genomes (Koonin, 2005; Innan and Kondrashov, 2010). For example, neutral processes can contribute to the evolution of gene duplication via genetic drift (Lynch, 2007; Brunet and Doolittle, 2018). Various adaptive hypotheses are available to explain how duplicate genes can be retained within species, such as the gene dosage hypothesis (Qian and Zhang, 2008) and the “escape from adaptive conflict” model (Des Marais and Rausher, 2008). There are five broad classes of mechanisms for generating gene duplicates, including whole-genome duplication (WGD) events, tandem duplications, transposon-mediated duplications, segmental duplications (also known as highly homologous sequence elements), and retroduplications, resulting from the “copy and paste” mechanism during reverse transcription (Panchy et al., 2016). In some instances, environmental conditions can impact the rate of fixation/loss of gene duplicates. For example, studies were carried out on the retention of duplicated genes involved in stress response, sensory functions, transport, and/or metabolism given specific environmental conditions (Kondrashov, 2012). Likewise, the yeast genomes Saccharomyces cerevisiae and Schizosaccharomyces pombe were explored to evidence gene duplication in organismal adaptation (Qian and Zhang, 2014). A large-scale genomic analysis of land plants was carried out to support gene duplication assisting the evolution of novel functions, such as the production of specific floral structures and disease resistance (Panchy et al., 2016). Regarding algae, it was discovered that gene dosage might play a role in the survival of the Antarctic green alga Chlamydomonas sp. UWO241 (renamed Chlamydomonas priscuii) via the retention of highly similar duplicate genes (HSDs) (Cvetkovska et al., 2018; Zhang et al., 2021a; Stahl-Rommel et al., 2022).
Multidomain protein structures, functional redundancy, and/or extensive small-scale duplication events are some of the major challenges in detecting gene duplicates (Li et al., 2001; Prince and Pickett, 2002; Li et al., 2003b). Moreover, when trying to identify duplicate genes within or across species it is often difficult to distinguish between orthologs vs. paralogs. The latter are homologous genes descended from a common ancestor via duplication events, while the former are homologs derived by speciation events (Lallemand et al., 2020). When identifying homologous genes within species, it is common practice to identify paralogs using similarity assessment metrics. When exploring homologous genes across multiple species, it becomes more challenging to differentiate paralogs and orthologs, especially among more distantly related species. However, there are some publicly available genome databases providing the classification and identification of paralogs and orthologs, such as NCBI (Pruitt et al., 2005) and Ensembl (Birney et al., 2004; Howe et al., 2021). The former allows users to select and compare gene orthologs in closely related species, while the latter allows researchers to analyze the submitted sequences in a tree-based pipeline (https://useast.ensembl.org/info/genome/compara/homology_method.html) where the gene trees are reconciled against species trees to distinguish duplication and speciation events (i.e., paralogues and orthologues). Besides, there are various available methods for identifying orthologous genes by building orthologous groups in multispecies (Kuzniar et al., 2008; Altenhoff and Dessimoz, 2012). For example, tree-based methods usually recognize groups of genes based on the inferred types of relationship ahead of building a phylogenetic tree, such as TreeFam (Schreiber et al., 2014) and PhylomeDB (Huerta-Cepas et al., 2014); however, the multispecies, graph-based methods need to form the homology graph first and then build sets of genes dependent on the types of suggested relationships, such as OrthoMCL (Li et al., 2003a) and OrthoFinder (Emms and Kelly, 2019).
Here, we focus on gene duplication detection resources for intra-species analyses and review recent advancements in this area. We first summarize the metrics used to measure the similarity of gene duplicates within species, then compare several computational approaches that have been used to predict and collect gene duplicates within a particular genome. In addition, we review the recent development of a Basic Local Alignment Search Tool (BLAST)-based web tool (HSDFinder) (Zhang et al., 2021b; Zhang et al., 2021c) and database (HSDatabase) (Zhang et al., 2022). Using these two bioinformatics resources, a comparative platform can be built to understand the role of gene duplication in genome evolution.
Metrics for measuring sequence similarity of gene duplicates
Measuring duplicated genes within species typically involves the gene structure method and/or sequence similarity method. For example, three metrics are usually applied to evaluate the sequence similarity of the paralogous relationships in genes, such as aligned length, sequence identity and E-value (Lallemand et al., 2020). Other kinds of metrics are also available, but they are not necessarily as straightforward to measure (e.g., bit-score). Sequence similarity and alignment length of genes can be rapidly quantified by many tools, including DIAMOND (Buchfink et al., 2015) and BLAST (Kent, 2002). When identifying gene duplicates, the amino acid sequence is typically preferred over the nucleotide sequence as the former is more evolutionarily conserved providing more reliable sequence alignments as compared to DNA sequences. This is also why many gene duplication detection tools have the input files running from BLASTP or BLASTX (Kent, 2002). Furthermore, the timescale of the gene duplicates can greatly impact the selection of different metrics in the alignment software. Filtering recent gene duplicates usually requires more restrictive thresholds and vice versa. The metrics used to define the paralogs in a BLAST all-against-all amino acids sequence search usually include a smaller E-value cut-off (e.g., ≤ 1e-5), a higher identity score (e.g., ≥ 30%), and a longer aligned length (e.g., ≥ 150 amino acids) (Sander and Schneider, 1991; Maere et al., 2005; Panchy et al., 2016).
To overcome the limitations of similarity-based assessments, efforts have been made in developing various similarity-based metrics. For example, the homology-derived secondary structures of proteins (HSSP) method (Sander and Schneider, 1991) creates a formula to help researchers quantify genetic paralogous relationships (Rost, 1999; Li et al., 2001). Many databases have been developed to collect the conserved domains and pathways, which can be used to infer gene similarity (Lallemand et al., 2020), such as Pfam database (El-Gebali et al., 2019), InterPro pattern (Mitchell et al., 2019), and KEGG pathway (Kanehisa and Goto, 2000). But it should be noted that the quality of the genome assembly and annotation can play a key role in the accuracy of gene similarity assessement analyses. For example, ‘duplicate’ contigs from different haplotypes can remain in the final genome assemblies (especially for heterozygous genomes), potentially leading to false detection of gene duplicates; although this has been improved considerably with long-read sequencing technologies. In Table 1, various species were assessed for gene similarity showing that the observed numbers of gene duplicates can be distinct with each given threshold and assembled genome.
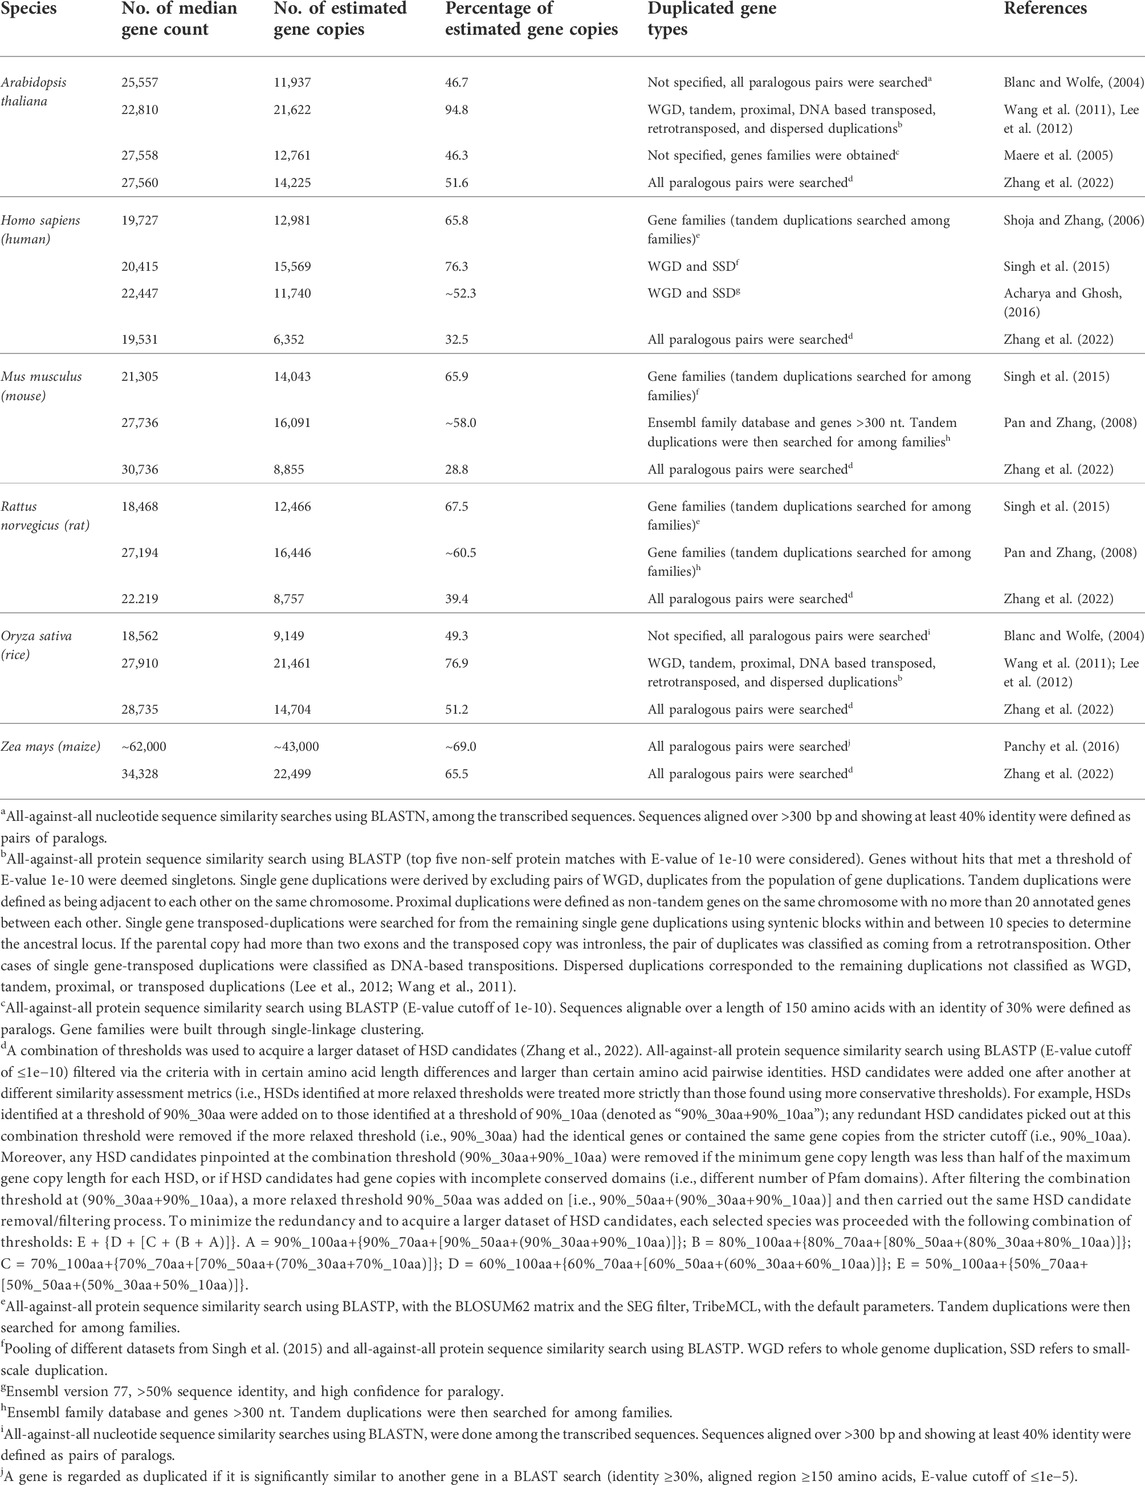
TABLE 1. Estimation of the amount of duplicated genes in different species. Adapted from (Lallemand et al., 2020) under the creative commons attribution license.
Bioinformatics approaches to identify gene duplicates
Researchers have been studying gene duplication for years, which has led to the development of various bioinformatics databases and tools for within and/or among genomes/species analyses (Lallemand et al., 2020). It is important to know how these tools function in order to choose the correct one for studying gene duplicates. There are a few factors for future researchers to consider, such as genome structure (e.g., diploid or haploid; plant or animal; eukaryotic or prokaryotic), the specific questions being asked (e.g., WGD genes or retrogenes; tandem duplicates or segmental duplicates), and the bioinformatics skills needed (e.g., command line environment or graphical user interface). Also, as noted above, the challenges associated with distinguishing orthologs from paralogs increase when exploring homologous genes between distant species. But there are still some tools available, such as the graph-based duplication prediction software OrthoMCL (Li et al., 2003a), which has a built-in Markovian Cluster algorithm, and the popular orthologous protein-coding genes database OrthoDB (Zdobnov et al., 2017). Besides, researchers developed an efficient and simple-to-use tool OrthoFinder (Emms and Kelly, 2015; Emms and Kelly, 2019) aimed at detecting the relationship of orthologous groups between/among species, especially one-to-many and many-to-many relationships between orthologues. This allows unique orthologous genes can to be collected using a reciprocal best hits (RBH) approach, which gets more complex as the number of gene duplication events increases. OrthoFinder can detect these relationships and provide comprehensive statistics for comparative genomic analyses via protein sequence files (one per species) in FASTA format. Despite the convenience of these tools, there is still an increasing need for bioinformatics tools and databases for studying specific types of gene duplications within a particular genome.
There are many web tools and databases devoted to within-species gene duplication analysis, some of which are no longer maintained. Table 2 presents the different types of algorithms used in these software/databases with a focus on those that are recently developed and/or actively maintained. For example, co-localized gene duplicates were collected from nine species in an early developed database named Duplicated Gene Database (DGD); however, it appears that no new species have been added since 2012 (Ouedraogo et al., 2012). Two genes are treated as co-localized relationship in the DGD only when they fit in the 100 gene window of all-against-all BLAST results and meet the following criteria (I’ = I x Min(n1/L1,n2/L2); I’ ≥30% if L ≥ 150 amino acids; I is the sequence identity, Li is the length of sequence, ni is the number of amino acids in the aligned region) and formula (I ≥ 0.01n+4.8L−0.32(1+exp(−L/1000))) (Li et al., 2001). The database RetrogeneDB provides detailed data on retrogene duplicates, which must have at least 50% amino acid identity and coverage to the location from which they initially arose from, and be at least 150 bp long (Kabza et al., 2014; Rosikiewicz et al., 2017). PTGBase is built as an integrated database focusing on tandemly duplicated genes in plants; the tandem duplicates were collected by looking at if two or more genes from the same orthologous group are next to each other in the target genome (Yu et al., 2015). Similarly, gene and genome duplication of representative plant genomes were collected in the Plant Genome Duplication Database (PGDD) (Lee et al., 2012; Lee et al., 2017). More recently, Wang and colleagues developed a duplication events detection pipeline, called DupGen_finder, which has the built-in algorithm of MCScanX (Wang et al., 2013) and can identify duplicates of different type, such as tandem, whole-genome, transposed, proximal, or dispersed duplications (Wang et al., 2011; Qiao et al., 2019).
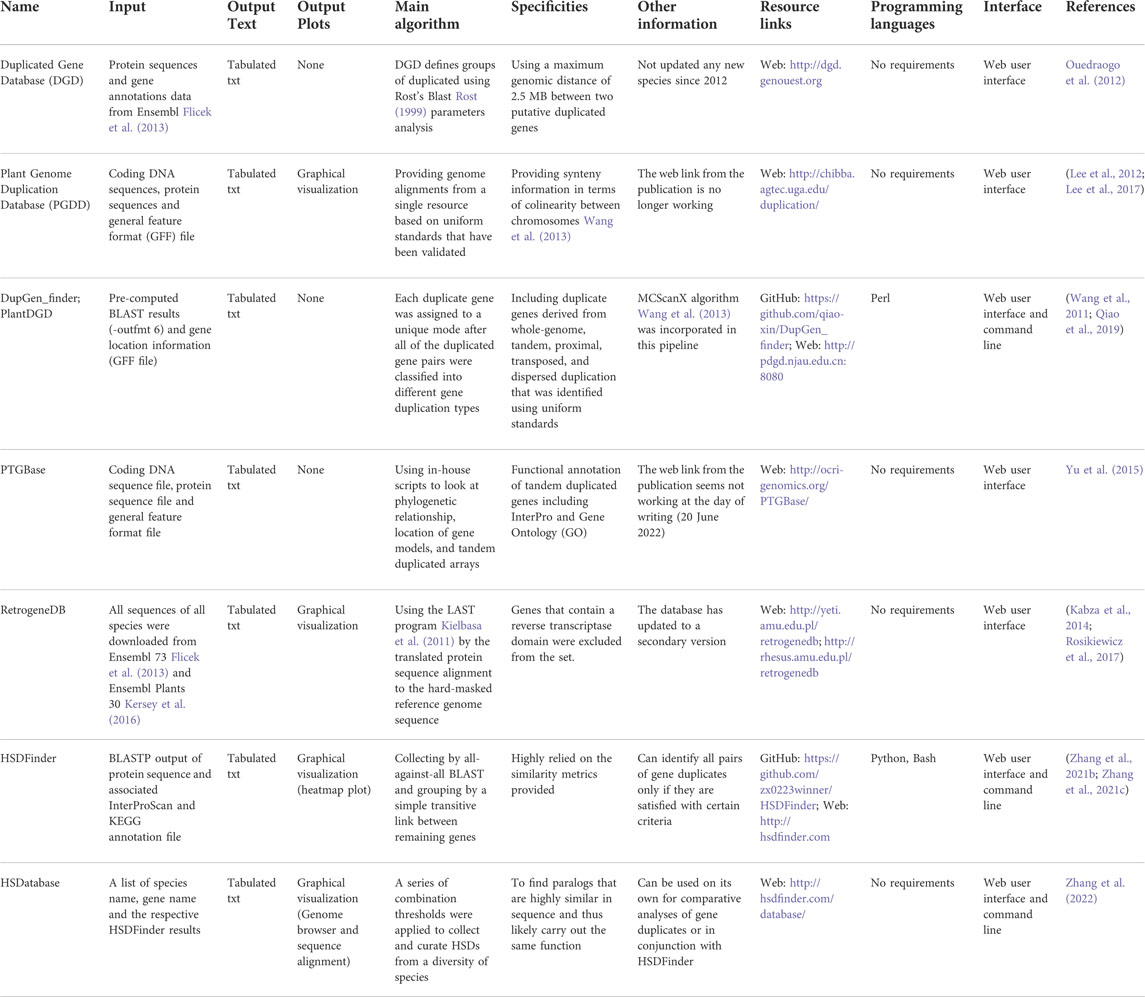
TABLE 2. Summary of the characteristics of different existing tools for identifying gene duplicates.
Recent advancement of a BLAST-based web tool and database
The psychrophilic, Antarctic green alga Chlamydomonas priscuii was recently shown to contain hundreds of highly similar duplicate genes, which may be helping this species survive extreme conditions via a gene dosage effect (Cvetkovska et al., 2018; Zhang et al., 2021a; Stahl-Rommel et al., 2022). A novel HSD detection tool, called HSDFinder, was developed for analyzing gene duplicates in C. priscuii (Zhang et al., 2021b; Zhang et al., 2021c). This tool has now been applied to many other eukaryotic genomes, the results of which are available in a online database called HSDatabase, housing 117,864 HSDs arising from 40 eukaryotic species (Zhang et al., 2022). HSDatabase contains an assortment of user-friendly features allowing users to glean important information on HSDs, including alignment length and percentage identify, and it provides external links to NCBI’s genome browser, Pfam protein domains, and KEGG pathways. Furthermore, HSDatabase has a built-in BLAST tool for users to search genes of interest.
With this newly developed tool, BLAST all-against-all amino acid sequences can be used as the input file for the web server - HSDFinder (Zhang et al., 2021b) to furtherly explore sequence similarity. With a user-friendly interface, amino acid length variance and sequence identity can be conveniently submitted as similarity assessment metrics. By using these metrics, duplicate genes are grouped by a simple transitive link between remaining genes. There is an online heatmap option for users to compare intra-species gene duplicates under different thresholds. The KEGG pathway framework is used to categorize the detected duplicates in the heatmap.
A combination of thresholds (relaxed ones added onto stricter ones) was developed to acquire a larger dataset of HSD candidates in HSDatabase (Zhang et al., 2022). Also, any HSD candidates were screened out if the minimum length of gene copy was less than half of the maximum length of gene copy for every HSD group. Incomplete or unequal conserved protein family domains of HSD candidates will also result in the removal of the HSD group. But due to the limitation of this strategy, it should be noted that there are some large groups of HSD candidates in the database that likely diverged in function from one another. In the database, those putatively diverged HSD groups were labelled as “candidate HSDs” and a warning note was added that users should proceed with caution when working with these types of datasets.
Concluding perspectives
There is no stand-alone software that can detect all types of gene duplicates within and across species. There are many factors that can influence the choice of tools being used for gene duplication detection. These include, for instance, the kinds of questions being asked and the genomes being analyzed as well as the bioinformatics skills of the user. For developers, a lot of features and statistics can be added to assist future researchers, such as the rates of synonymous and nonsynonymous substitutions (dN/dS rates) and differential expression levels in different gene duplicates. One of the big challenges moving forward is how to properly help users select an appropriate threshold for their given dataset/genome and provide them with the freedom to fine-tune specific metrics. In the future, it is likely that users will be aided by species-specific gene threshold values for gene duplication detection tools. With more and more genomes being sequenced and re-sequenced, gene duplicate data from highly polished model genomes will broaden our understanding of the role of gene duplication in genome evolution and adaptation to extreme environments.
Author contributions
The study was conceptualized by XZ and DS. XZ wrote the initial draft and performed the data analysis. DS contributed to the manuscript editing. All authors commented to produce the manuscript for peer review.
Funding
The authors gratefully acknowledge funding of Discovery Grants from the Natural Sciences and Engineering Research Council of Canada (NSERC).
Acknowledgments
We appreciate the constructive suggestions from all the reviewers. Due to the length of the review, we apologize for not citing all relevant literatures.
Conflict of interest
The authors declare that the research was conducted in the absence of any commercial or financial relationships that could be construed as a potential conflict of interest.
Publisher’s note
All claims expressed in this article are solely those of the authors and do not necessarily represent those of their affiliated organizations, or those of the publisher, the editors and the reviewers. Any product that may be evaluated in this article, or claim that may be made by its manufacturer, is not guaranteed or endorsed by the publisher.
References
Acharya, D., and Ghosh, T. C. (2016). Global analysis of human duplicated genes reveals the relative importance of whole-genome duplicates originated in the early vertebrate evolution. BMC genomics 17, 71–14. doi:10.1186/s12864-016-2392-0
Altenhoff, A., and Dessimoz, C. (2012). Inferring orthology and paralogy in: Evolutionary genomics. Totowa, New Jersey, United States: Humana Press.
Birney, E., Andrews, T. D., Bevan, P., Caccamo, M., Chen, Y., Clarke, L., et al. (2004). An overview of Ensembl. Genome Res. 14, 925–928. doi:10.1101/gr.1860604
Blanc, G., and Wolfe, K. H. (2004). Widespread paleopolyploidy in model plant species inferred from age distributions of duplicate genes. Plant Cell 16, 1667–1678. doi:10.1105/tpc.021345
Brunet, T., and Doolittle, W. F. (2018). The generality of constructive neutral evolution. Biol. Philos. 33, 2–25. doi:10.1007/s10539-018-9614-6
Buchfink, B., Xie, C., and Huson, D. H. (2015). Fast and sensitive protein alignment using DIAMOND. Nat. Methods 12, 59–60. doi:10.1038/nmeth.3176
Conant, G. C., and Wolfe, K. H. (2008). Turning a hobby into a job: How duplicated genes find new functions. Nat. Rev. Genet. 9, 938–950. doi:10.1038/nrg2482
Cvetkovska, M., Szyszka-Mroz, B., Possmayer, M., Pittock, P., Lajoie, G., Smith, D. R., et al. (2018). Characterization of photosynthetic ferredoxin from the Antarctic alga Chlamydomonas sp. UWO241 reveals novel features of cold adaptation. New Phytol. 219, 588–604. doi:10.1111/nph.15194
Des Marais, D. L., and Rausher, M. D. (2008). Escape from adaptive conflict after duplication in an anthocyanin pathway gene. Nature 454, 762–765. doi:10.1038/nature07092
El-Gebali, S., Mistry, J., Bateman, A., Eddy, S. R., Luciani, A., Potter, S. C., et al. (2019). The Pfam protein families database in 2019. Nucleic Acids Res. 47, D427–D432. doi:10.1093/nar/gky995
Emms, D. M., and Kelly, S. (2019). OrthoFinder: Phylogenetic orthology inference for comparative genomics. Genome Biol. 20, 238–314. doi:10.1186/s13059-019-1832-y
Emms, D. M., and Kelly, S. (2015). OrthoFinder: Solving fundamental biases in whole genome comparisons dramatically improves orthogroup inference accuracy. Genome Biol. 16, 157–214. doi:10.1186/s13059-015-0721-2
Flicek, P., Ahmed, I., Amode, M. R., Barrell, D., Beal, K., Brent, S., et al. (2013). Ensembl 2013. Nucleic Acids Res. 41, D48–D55. doi:10.1093/nar/gks1236
Howe, K. L., Achuthan, P., Allen, J., Allen, J., Alvarez-Jarreta, J., Amode, M. R., et al. (2021). Ensembl 2021. Nucleic Acids Res. 49, D884–D891. doi:10.1093/nar/gkaa942
Huerta-Cepas, J., Capella-Gutierrez, S., Pryszcz, L. P., Marcet-Houben, M., and Gabaldon, T. (2014). PhylomeDB v4: Zooming into the plurality of evolutionary histories of a genome. Nucleic Acids Res. 42, D897–D902. doi:10.1093/nar/gkt1177
Innan, H., and Kondrashov, F. (2010). The evolution of gene duplications: Classifying and distinguishing between models. Nat. Rev. Genet. 11, 97–108. doi:10.1038/nrg2689
Kabza, M., Ciomborowska, J., and Makałowska, I. (2014). RetrogeneDB—A database of animal retrogenes. Mol. Biol. Evol. 31, 1646–1648. doi:10.1093/molbev/msu139
Kanehisa, M., and Goto, S. (2000). Kegg: Kyoto encyclopedia of genes and genomes. Nucleic Acids Res. 28, 27–30. doi:10.1093/nar/28.1.27
Kent, W. J. (2002). BLAT—The BLAST-like alignment tool. Genome Res. 12, 656–664. doi:10.1101/gr.229202
Kersey, P. J., Allen, J. E., Armean, I., Boddu, S., Bolt, B. J., Carvalho-Silva, D., et al. (2016). Ensembl genomes 2016: More genomes, more complexity. Nucleic Acids Res. 44, D574–D580. doi:10.1093/nar/gkv1209
Kielbasa, S. M., Wan, R., Sato, K., Horton, P., and Frith, M. C. (2011). Adaptive seeds tame genomic sequence comparison. Genome Res. 21, 487–493. doi:10.1101/gr.113985.110
Kondrashov, F. A. (2012). Gene duplication as a mechanism of genomic adaptation to a changing environment. Proc. Biol. Sci. 279, 5048–5057. doi:10.1098/rspb.2012.1108
Koonin, E. V. (2005). Orthologs, paralogs, and evolutionary genomics. Annu. Rev. Genet. 39, 309–338. doi:10.1146/annurev.genet.39.073003.114725
Kuzniar, A., van Ham, R. C., Pongor, S., and Leunissen, J. A. (2008). The quest for orthologs: Finding the corresponding gene across genomes. Trends Genet. 24, 539–551. doi:10.1016/j.tig.2008.08.009
Lallemand, T., Leduc, M., Landès, C., Rizzon, C., and Lerat, E. (2020). An overview of duplicated gene detection methods: Why the duplication mechanism has to be accounted for in their choice. Genes 11, 1046. doi:10.3390/genes11091046
Lee, T.-H., Kim, J., Robertson, J. S., and Paterson, A. H. (2017). “Plant genome duplication database,” in Plant genomics databases. Editor D. Aalt (Berlin, Germany: Springer).
Lee, T.-H., Tang, H., Wang, X., and Paterson, A. H. (2012). PGDD: A database of gene and genome duplication in plants. Nucleic Acids Res. 41, D1152–D1158. doi:10.1093/nar/gks1104
Li, L., Stoeckert, C. J., and Roos, D. S. (2003a). OrthoMCL: Identification of ortholog groups for eukaryotic genomes. Genome Res. 13, 2178–2189. doi:10.1101/gr.1224503
Li, W.-H., Gu, Z., Cavalcanti, A. O., and Nekrutenko, A. (2003b). Detection of gene duplications and block duplications in eukaryotic genomes. J. Struct. Funct. Genomics 3, 27–34. doi:10.1023/a:1022644628861
Li, W.-H., Gu, Z., Wang, H., and Nekrutenko, A. (2001). Evolutionary analyses of the human genome. Nature 409, 847–849. doi:10.1038/35057039
Lynch, M. (2007). The frailty of adaptive hypotheses for the origins of organismal complexity. Proc. Natl. Acad. Sci. U. S. A. 104, 8597–8604. doi:10.1073/pnas.0702207104
Maere, S., De Bodt, S., Raes, J., Casneuf, T., Van Montagu, M., Kuiper, M., et al. (2005). Modeling gene and genome duplications in eukaryotes. Proc. Natl. Acad. Sci. U. S. A. 102, 5454–5459. doi:10.1073/pnas.0501102102
Mitchell, A. L., Attwood, T. K., Babbitt, P. C., Blum, M., Bork, P., Bridge, A., et al. (2019). InterPro in 2019: Improving coverage, classification and access to protein sequence annotations. Nucleic Acids Res. 47, D351–D360. doi:10.1093/nar/gky1100
Ouedraogo, M., Bettembourg, C., Bretaudeau, A., Sallou, O., Diot, C., Demeure, O., et al. (2012). The duplicated genes database: Identification and functional annotation of co-localised duplicated genes across genomes. PloS one 7, e50653. doi:10.1371/journal.pone.0050653
Pan, D., and Zhang, L. (2008). Tandemly arrayed genes in vertebrate genomes. Comp. Funct. Genomics 2008, 1–11. doi:10.1155/2008/545269
Panchy, N., Lehti-Shiu, M., and Shiu, S.-H. (2016). Evolution of gene duplication in plants. Plant Physiol. 171, 2294–2316. doi:10.1104/pp.16.00523
Prince, V. E., and Pickett, F. B. (2002). Splitting pairs: The diverging fates of duplicated genes. Nat. Rev. Genet. 3, 827–837. doi:10.1038/nrg928
Pruitt, K. D., Tatusova, T., and Maglott, D. R. (2005). NCBI reference sequence (RefSeq): A curated non-redundant sequence database of genomes, transcripts and proteins. Nucleic Acids Res. 33, D501–D504. doi:10.1093/nar/gki025
Qian, W., and Zhang, J. (2008). Gene dosage and gene duplicability. Genetics 179, 2319–2324. doi:10.1534/genetics.108.090936
Qian, W., and Zhang, J. (2014). Genomic evidence for adaptation by gene duplication. Genome Res. 24, 1356–1362. doi:10.1101/gr.172098.114
Qiao, X., Li, Q., Yin, H., Qi, K., Li, L., Wang, R., et al. (2019). Gene duplication and evolution in recurring polyploidization–diploidization cycles in plants. Genome Biol. 20, 38–23. doi:10.1186/s13059-019-1650-2
Rosikiewicz, W., Kabza, M., Kosiński, J. G., Ciomborowska-Basheer, J., Kubiak, M. R., and Makałowska, I. (2017). RetrogeneDB–a database of plant and animal retrocopies. Database (Oxford). 2017, bax038. doi:10.1093/database/bax038
Rost, B. (1999). Twilight zone of protein sequence alignments. Protein Eng. 12, 85–94. doi:10.1093/protein/12.2.85
Sander, C., and Schneider, R. (1991). Database of homology‐derived protein structures and the structural meaning of sequence alignment. Proteins 9, 56–68. doi:10.1002/prot.340090107
Schreiber, F., Patricio, M., Muffato, M., Pignatelli, M., and Bateman, A. (2014). TreeFam v9: A new website, more species and orthology-on-the-fly. Nucleic Acids Res. 42, D922–D925. doi:10.1093/nar/gkt1055
Shoja, V., and Zhang, L. (2006). A roadmap of tandemly arrayed genes in the genomes of human, mouse, and rat. Mol. Biol. Evol. 23, 2134–2141. doi:10.1093/molbev/msl085
Singh, P. P., Arora, J., and Isambert, H. (2015). Identification of ohnolog genes originating from whole genome duplication in early vertebrates, based on synteny comparison across multiple genomes. PLoS Comput. Biol. 11, e1004394. doi:10.1371/journal.pcbi.1004394
Stahl-Rommel, S., Kalra, I., D’Silva, S., Hahn, M. M., Popson, D., Cvetkovska, M., et al. (2022). Cyclic electron flow (CEF) and ascorbate pathway activity provide constitutive photoprotection for the photopsychrophile, Chlamydomonas sp. UWO 241 (renamed Chlamydomonas priscuii). Photosynth. Res. 151, 235–250. doi:10.1007/s11120-021-00877-5
Wang, Y., Li, J., and Paterson, A. H. (2013). MCScanX-transposed: Detecting transposed gene duplications based on multiple colinearity scans. Bioinformatics 29, 1458–1460. doi:10.1093/bioinformatics/btt150
Wang, Y., Wang, X., Tang, H., Tan, X., Ficklin, S. P., Feltus, F. A., et al. (2011). Modes of gene duplication contribute differently to genetic novelty and redundancy, but show parallels across divergent angiosperms. PloS one 6, e28150. doi:10.1371/journal.pone.0028150
Yu, J., Ke, T., Tehrim, S., Sun, F., Liao, B., and Hua, W. (2015). PTGBase: An integrated database to study tandem duplicated genes in plants. Database. 2015, bav017. doi:10.1093/database/bav017
Zdobnov, E. M., Tegenfeldt, F., Kuznetsov, D., Waterhouse, R. M., Simao, F. A., Ioannidis, P., et al. (2017). OrthoDB v9. 1: Cataloging evolutionary and functional annotations for animal, fungal, plant, archaeal, bacterial and viral orthologs. Nucleic Acids Res. 45, D744–D749. doi:10.1093/nar/gkw1119
Zhang, X., Cvetkovska, M., Morgan-Kiss, R., Hüner, N. P., and Smith, D. R. (2021a). Draft genome sequence of the Antarctic green alga Chlamydomonas sp. UWO241. iScience 24, 102084. doi:10.1016/j.isci.2021.102084
Zhang, X., Hu, Y., and Smith, D. R. (2022). HSDatabase—a database of highly similar duplicate genes from plants, animals, and algae. Database 2022, baac086. doi:10.1093/database/baac086
Zhang, X., Hu, Y., and Smith, D. R. (2021b). HSDFinder: A BLAST-based strategy for identifying highly similar duplicated genes in eukaryotic genomes. Front. Bioinform. 1, 803176. doi:10.3389/fbinf.2021.803176
Keywords: comparative genomics, genome duplication, genome evolution, gene duplication, paralogous genes
Citation: Zhang X and Smith DR (2022) An overview of online resources for intra-species detection of gene duplications. Front. Genet. 13:1012788. doi: 10.3389/fgene.2022.1012788
Received: 05 August 2022; Accepted: 20 September 2022;
Published: 13 October 2022.
Edited by:
Mehdi Pirooznia, Johnson & Johnson, United StatesReviewed by:
Martijn Derks, Wageningen University and Research, NetherlandsCopyright © 2022 Zhang and Smith. This is an open-access article distributed under the terms of the Creative Commons Attribution License (CC BY). The use, distribution or reproduction in other forums is permitted, provided the original author(s) and the copyright owner(s) are credited and that the original publication in this journal is cited, in accordance with accepted academic practice. No use, distribution or reproduction is permitted which does not comply with these terms.
*Correspondence: Xi Zhang, eGkuemhhbmdAZGFsLmNh; David Roy Smith, ZHNtaXQyNDJAdXdvLmNh