 Jinjie Zhao
 Xinyuan Pu1
 Meng Li
- 1State Key Laboratory for Conservation and Utilization of Bio-Resources in Yunnan, Research Center for Perennial Rice Engineering and Technology of Yunnan, School of Agriculture, Yunnan University, Kunming, Yunnan, China
- 2Yunnan Academy of Tobacco Science, Kunming, Yunnan, China
Plant phospholipase D (PLD) exerts important roles in various biological processes, such as intracellular signaling and morphological development. Our knowledge about early land plant PLDs is still underdeveloped. In this study, we identified 84 PLD genes in six mosses, i.e., Physcomitrella patens, Ceratodon purpureus, Fontinalis antipyretica, Pleurozium schreberi, Sphagnum magellanicum, and Sphagnum fallax. These PLDs were classified into four clades (I–IV). We showed that PLD underwent rapid expansion in mosses. A total of six conserved domains and two core HKD motifs were detected. Structure analysis uncovered that the moss PLDs from within a clade generally exhibited similar exon-intron organization. Cis-elements prediction and expression analyses indicated that P. patens PLDs had key roles in stress responsiveness and plant development. Particularly, about half of the P. patens PLDs (e.g., PpPLD1, PpPLD2, and PpPLD5) were differentially expressed under biotic and abiotic stresses. We also determined the expression pattern of P. patens PLD genes in various tissues and at different stages of development. Although the moss, clubmoss, liverwort, and fern PLDs evolved largely under functional constraints, we found episodic positive selection in the moss PLDs, e.g., C. purpureus PLD2 and P. patens PLD11. We infer that the evolutionary force acting on the PLDs may have facilitated moss colonization of land. Our work provides valuable insights into the diversification of moss PLD genes, and can be used for future studies of their functions.
Introduction
Phospholipase D (PLD) is a class of enzymes belonging to the phospholipase superfamily (Wang, 2000; Jang et al., 2012). The hydrolysis of phospholipids into phosphatidic acid has a wide impact on biological processes, such as, intracellular signaling, lipid remodeling, cytoskeletal reorganization, and vesicular trafficking (Zhang et al., 2010). In plants, PLDs are implicated in resistance to abiotic and biotic stresses (Pinosa et al., 2013; Ufer et al., 2017), growth (Hong et al., 2009), and seed development (Ryu et al., 1996). Based on the presence of either the calcium/lipid-binding (C2) or the phox/pleckstrin homology (PX/PH) domains, PLDs can be divided into C2 and PX/PH PLDs. The C2 domain regulates Ca2+-dependent activity (Kopka et al., 1998), while the PX/PH domains target phosphoinositide-rich membrane compartments (Hong et al., 2017). In addition to C2 and PX/PH PLDs, there is another type of phospholipase referred to as signal peptide (SP) PLD, which lacks the C2 and PX/PH domains but carrying an N-terminal signal peptide (Selvy et al., 2011). With the help of a signal peptide, SP PLD is secreted into the extracellular spaces to hydrolyze its substrates (Qu et al., 2021). In rice, SP PLD expression was downregulated during the entire reproductive stage (Singh et al., 2012).
The Arabidopsis thaliana PLDs include six subfamilies, i.e., α, β, γ, δ, ε, and ζ (Wang, 2005). The calcium/lipid-binding C2 domain is common in PLDα, β, γ, δ, and ε, and the PX/PH domains are prevalent in PLDζ. The α subfamily has the most redundant PLDs in both A. thaliana (three PLDαs) and Oryza sativa (eight PLDαs), and this may also be true in other seed plants (Bourtsala et al., 2017). Previous studies indicate that PLDα is involved in response to diverse stresses, including drought, freezing, physical injury, and high salinity (Mane et al., 2007; Hong et al., 2008; Kargiotidou et al., 2010; Bourtsala et al., 2017; Ufer et al., 2017). It is also suggested that PLDs from distinct subfamilies are active at different steps of a single biological process. For instance, PLDα and PLDδ are activated at different time points in cotton (Gossypium hirsutum) wound signaling (Bourtsala et al., 2017). In addition to those of A. thaliana and O. sativa, PLDs in various angiosperms have been investigated. For example, 10 and 16 PLDs were found in the genome of pineapple (Ananas comosus) and potato (Solanum tuberosum), respectively (Hong et al., 2017; Li et al., 2021). When treated with hexaldehyde, the expression of PLD2 in pineapple fruit was upregulated (Hong et al., 2017). A total of 17 and 11 PLDs were identified in poplar (Populus trichocarpa), and grape (Vitis vinifera), respectively. In poplar, a fast expansion constituted by five species-specific PLD gene duplications was reported (Liu et al., 2010).
Mosses are different from angiosperms in many aspects, such as morphology (Beerling et al., 2001), secondary metabolism (Pichersky and Gang, 2000), and life cycle (Boyce, 2008). Knowledge about PLDs in bryophytes is still limited, although several moss genomes have been sequenced (https://www.plabipd.de/plant_genomes_pn.ep). As such, in this study we performed a genome-wide identification of PLDs in six moss genomes, i.e., Physcomitrella patens, Ceratodon purpureus, Fontinalis antipyretica, Pleurozium schreberi, Sphagnum magellanicum, and Sphagnum fallax. The phylogenetic and molecular evolution of PLDs in mosses were thoroughly explored to elucidate the evolutionary divergence of the moss PLD gene family. We also considered conserved sequence characteristics and expression patterns. This provides foundational knowledge for understanding the diversification of moss PLD genes.
Materials and methods
Data sources and identification of PLD homologs
The proteome and genome files of P. patens (v3.3), C. purpureus (GG1, v1.1), Ceratopteris richardii (v2.1), Marchantia polymorpha (v3.1), and Selaginella moellendorffii (v1.0) were downloaded from the Joint Genome Institute (DOE-JGI, https://phytozome-next.jgi.doe.gov/). The sequence data of Azolla filiculoides and Salvinia cucullate were obtained from Fernbase (https://www.fernbase.org/) (Li et al., 2018). The genome data of F. antipyretica was acquired from GigaDB (http://gigadb.org/dataset/100748) (Yu et al., 2020). The proteome of P. schreberi was retrieved from GitHub project webpage (https://github.com/PycnopodiaD/Pleurozium_schreberi_annotated_genome_files) (Pederson et al., 2019). Using A. thaliana and O. sativa PLD sequences as queries, BLASTP (Camacho et al., 2009) and hmmsearch (http://hmmer.org/) were employed to search against the collected protein sequence datasets. For S. magellanicum and S. fallax, online BLASTP searches were performed at the phytozome website (DOE-JGI, https://phytozome-next.jgi.doe.gov/blast-search). Additional BLASTP searches were performed on the NCBI nonredundant (nr) database to obtain as many PLD candidates as possible. A candidate was considered a PLD when either the phospholipase D domain or the phospholipase D C terminal domain was detected.
Sequence alignment and phylogenetic tree reconstruction
The PLD protein sequences were aligned in MAFFT (v7.450), using the strategy determined by '--auto’ option (Katoh and Standley, 2013). Poorly aligned positions were eliminated using trimAl (v1.4), by allowing a maximum of 30% gaps per sequence (Capella-Gutierrez et al., 2009). IQ-TREE (v1.5.4) with options “-nt AUTO -m TEST -bb 1000 -alrt 1000” was used to identify the best-fit amino acid substitution model for the PLD sequence alignment (LG + I + G was selected according to the BIC score), and then to reconstruct the maximum likelihood phylogenetic tree (Nguyen et al., 2015). Bootstrap values were estimated by 1000 ultrafast bootstrap and SH-like approximate likelihood ratio tests. Bayesian analysis was performed using MrBayes (v3.2.7) (Ronquist et al., 2012). Two independent runs with eight chains each were calculated simultaneously and iteratively until the average standard deviation of the split frequencies was below 0.05 (The Markov chain Monte Carlo chain was run for more than 400 million generations). Trees were sampled every 100 generations. After discarding the first 25% of sampled trees, the posterior probability values were produced. The final tree was visualized in Figtree (v1.4.4, http://tree.bio.ed.ac.uk/software/figtree/).
Detection of domains, motifs, and signal peptide sequences
Identification of conserved domains was performed by searching the Pfam (Finn et al., 2013) and SMART (Letunic et al., 2020) databases. Conserved motifs were determined using the MEME/MAST software (Bailey and Gribskov, 1998). SignalP (http://www.cbs.dtu.dk/services/SignalP-4.1/) (Nielsen, 2017) was used to predict the signal peptide sequences.
Gene structure analyses
Gene structure information was retrieved from genome annotation files or GenBank. For genes with two or more transcripts, the exon number referred to the average number of exons. Group differences of exon number were tested by ANOVA followed by a pairwise t test with Bonferroni correction (Fisher, 1992). All statistical analyses were performed using R (v3.6.2, https://www.r-project.org/) software.
Analysis of cis-regulatory elements in the promoter region of PpPLDs
The 2-kb promoter sequences upstream of the PpPLDs extracted from the P. patens genome were submitted to the PlantCARE database (http://bioinformatics.psb.ugent.be/webtools/plantcare/html/) to perform the cis-acting element analysis. The identified cis-elements were displayed using a custom script written in the R programming language (v3.6.2, https://www.r-project.org/).
Expression analyses
RNA-seq data used for expression analyses were retrieved from the NCBI Sequence Read Archive (SRA) database: P. patens: PRJDB6633; C. purpureus: PRJNA622159—PRJNA622174, and PRJNA622207; F. antipyretica: PRJEB21674; C. richardii: PRJNA681601; A. filiculoide: PRJNA264391 and PRJEB25913; S. cucullate: PRJNA430459; M. polymorpha: PRJNA554398, PRJDB6783, and PRJNA350270. Reads were mapped to the reference coding sequences by using kallisto (v0.46.1) (Bray et al., 2016). Expression levels were evaluated by transcripts per million (TPM). If more than one transcript were present, the average TPM would be calculated for following analyses. Expression data for S. moellendorffii were extracted from the eFP Browser (http://bar.utoronto.ca/) of Selaginella. No RNA-seq data were publicly available for S. fallax, S. magellanicum, and P. schreberi. For P. patens PLDs, expression profiles of different tissues, including spores, caulonema, chloronema, protoplast, rhizoids, gametophore, archegonia, and sporophytes from the S1, S2, S3, and M stages, were collected from the Physcomitrella eFP Browser (Ortiz-Ramirez et al., 2016). The P. patens RNA-seq data (PRJNA611083) generated after inoculation of fungal pathogen (Botrytis cinerea) were downloaded to analyze biotic stress-induced expression of PpPLDs. The RNA-seq data (PRJNA596891) of P. patens plants grown under a salinity stress condition (200 mM NaCl) were used to examine abiotic stress-induced expression pattern.
Molecular evolutionary analyses
The PLD coding sequences were aligned using the program “reportGapsAA2NT” implemented in MACSE (v2.05) (Ranwez et al., 2018). To avoid bias introduced by short sequences, 11 out of the identified 132 PLDs whose coding sequence length <900 bp (The average coding sequence length of the identified moss, clubmoss, fern, and liverwort PLDs is 2400 bp), e.g., M. polymorpha PLDs 8–10, were excluded from evolutionary pressure analyses. Molecular evolutionary analyses were applied to the SP PLDs separately, because they shared low sequence similarities to C2 and PX/PH PLDs. Positive and purifying selection were determined by the ratio of non-synonymous to synonymous nucleotide substitutions (ω, also known as dN/dS). The Fast, Unconstrained Bayesian AppRoximation (FUBAR) (Murrell et al., 2013), Mixed Effects Model of Evolution (MEME) (Murrell et al., 2012), Branch-Site Unrestricted Statistical Test for Episodic Diversification (BUSTED) (Murrell et al., 2015), and adaptive Branch-Site Random Effects Likelihood (aBSREL) (Smith et al., 2015) methods were run using the HyPhy software package (Kosakovsky Pond et al., 2020). Changes in selection intensity were estimated using the RELAX method (Wertheim et al., 2015). The branch-site model analysis was conducted using the CODEML program from the PAML package (v4.9j) (Yang, 2007).
Three-dimensional structure prediction
AlphaFold v2.0 (Jumper et al., 2021) was used to predict the 3D structures for PpPLD11, with the resources and default parameters provided at the ColabFold website (https://colab.research.google.com/github/sokrypton/ColabFold/blob/main/AlphaFold2.ipynb). To perform homology modeling, the protein sequence of PpPLD11 was analyzed by searching the SWISS-MODEL database (http://swissmodel.expasy.org/) (Waterhouse et al., 2018). The quality of the predicted 3D structure was assessed using SAVES (https://saves.mbi.ucla.edu/). Pymol software (https://pymol.org/) was applied to visualize the 3D structure.
Results
Identification and annotation of PLDs in available moss genomes
To gain insights into the distribution of PLD in mosses, we mined homologous PLD genes from the genomes and proteomes of six bryophytes, P. patens, C. purpureus, F. antipyretica. P. schreberi, S. magellanicum, and S. fallax. A total of 14, 13, 12, 11, 14, and 20 PLDs were identified in these species, respectively (Supplementary Table S1). Further, we investigated the presence of PLDs in another five early land plant species, categorized as clubmosses (S. moellendorffii), ferns (C. richardii, A. filiculoides, and S. cucullate), and liverworts (M. polymorpha). In total, 132 PLD homologous sequences were identified (Supplementary Table S1). As shown in Figure 1, the number of PLD genes varies widely between species, ranging from six (S. moellendorffii) to 20 (S. fallax). These PLD homologs were named according to a common nomenclature consisting of the first letters of both the genus (upper case) and the species (lower case), followed by the PLD identifier and a number arranged by its order of domain conservation.
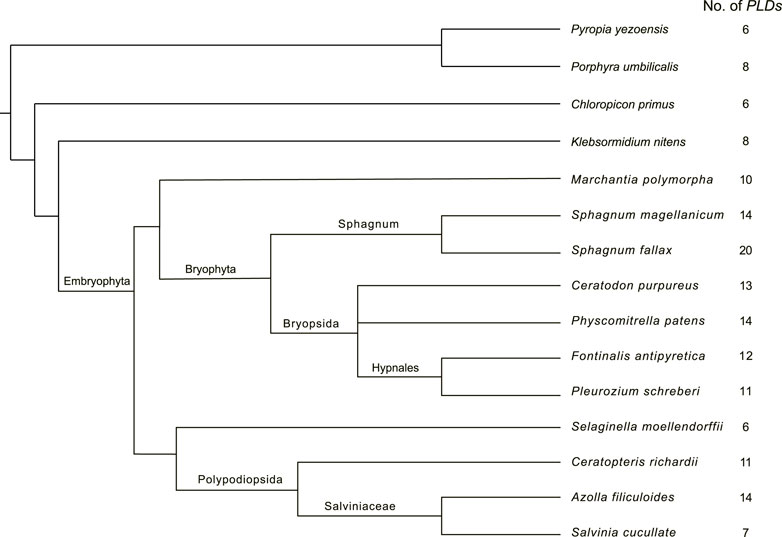
FIGURE 1. Species tree of the studied mosses, clubmosses, ferns, liverworts, and algae. This tree was drawn according to Harris et al. (2020). The column on the right indicates the number of PLD genes.
We further analyzed the genomic location of the identified PLDs. In the P. patens genome, 12 of 14 PLDs were mapped separately onto 12 chromosomes (chromosomes 2, 3, 7, 8, 10, 12–14, 17, 18, 22, and 23. Figures 2A,B, and Supplementary Figure S1). On chromosome 20, PpPLD6 was located nearly adjacent to PpPLD11. Similar patterns were also observed in S. magellanicum, S. fallax, C. richardii, and C. purpureus (Supplementary Figure S1). Such co-locations were not found for PLDs in F. antipyretica, P. schreberi, S. moellendorffii, A. filiculoides, S. cucullate, and M. polymorpha, partly because genomes of these species were not fully assembled.
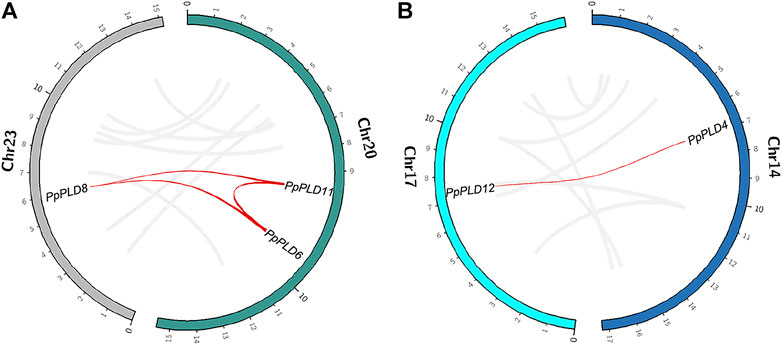
FIGURE 2. Genomic location of species-specific duplicated PLDs in P. patens. (A). PLDs 6, 8, and 11. (B). PLDs 4 and 12. Gray lines indicate synteny blocks, and red lines indicate species-specific PLD duplications.
Origin and diversification of the moss PLDs
Phylogenetic analyses were carried out on the above-mentioned moss, clubmoss, fern, and liverwort PLDs, together with another 55 from A. thaliana, O. sativa, Thuja plicata, and red and green algae to explore the origin of the moss PLDs. The phylogenetic trees reconstructed using the maximum likelihood and Bayesian methods shared a similar topology. As displayed in Figure 3; Supplementary Figure S2, the green plant PLDs are classified into four clades (I–IV). The C2 PLDs clustered within clades I and II, and PX/PH PLDs clustered within clade III. The SP PLDs were located in clade IV. For A. thaliana and O. sativa, the α and ε PLDs were grouped into clade I. The β, γ, and δ PLDs were grouped into clade II. The ζ and ϕ PLDs were clustered in clades III and IV, respectively.
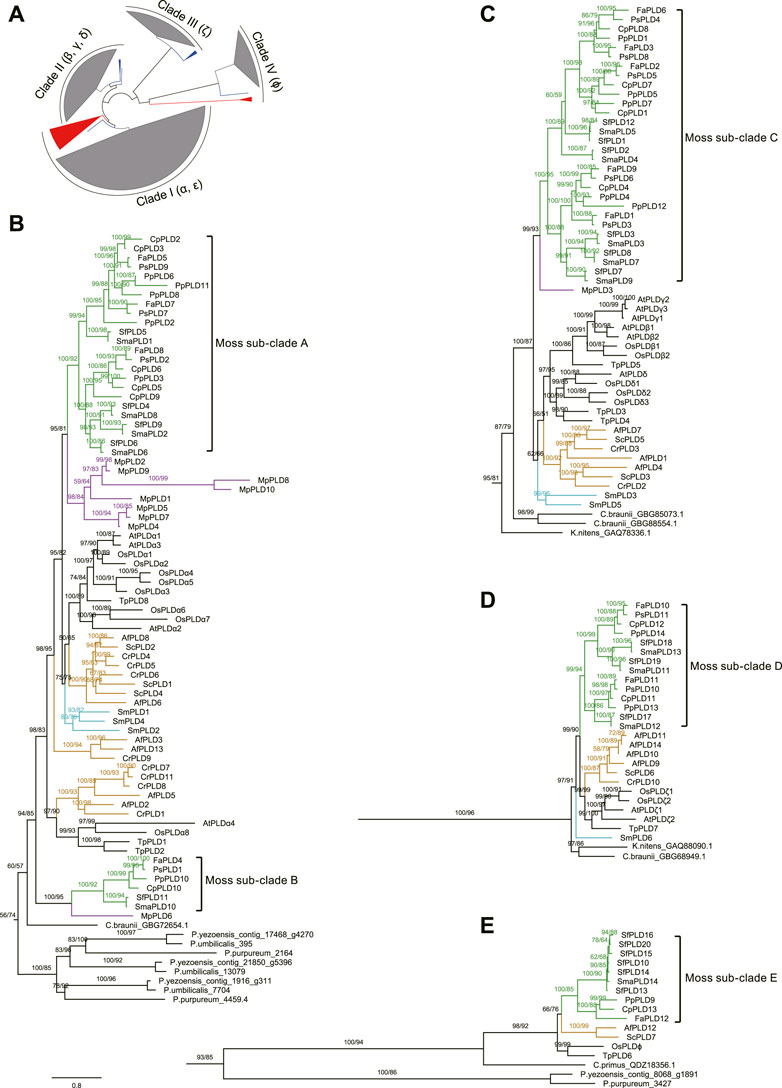
FIGURE 3. Phylogenetic unrooted tree of PLDs from mosses, clubmosses, liverworts, ferns, angiosperms, and algae. Because it was not clear when the C2, PX/PH, and SP PLD subfamilies diverged (perhaps long before the emergence of red algae), no outgroup was used for this tree. (A): A simplified overview of the entire phylogenetic tree with clades I, II, III, and IV collapsed. Blocks colored in grey, red, and blue represent PLDs of land plants (mosses, clubmosses, liverworts, ferns, and angiosperms) and red and green algae, respectively. (B–E): Phylogenetic topologies within clades I, II, III, and IV, respectively. The original phylogenetic tree is displayed in Supplementary Figure S2. The sequence alignment used was provided in supplementary data sheet 1. Above branches are bootstrap supports from maximum likelihood and Bayesian analyses, respectively. The bootstrap value below 50% is not shown. The green, purple, orange, and cyan color on the branches refer to mosses, liverworts, ferns, and clubmosses, respectively. Scale bar represents substitution numbers per amino-acid site for (B–E). The abbreviations used are as follows: Pp, P. patens; Cp, C. purpureus; Fa, F. antipyretica; Ps, P. schreberi; Sma, S. magellanicum; Sf, S. fallax; Sm, S. moellendorffii; Cr, C. richardii; Af, A. filiculoides; Sc, S. cucullate; Mp, M. polymorpha; At, A. thaliana; Os, O. sativa; Tp, T. plicata.
According to the phylogeny, the most ancient PLDs in clade I (PLDαs and PLDεs) could be found in three red algae species Pyropia yezoensis, Porphyridium purpureum, and Porphyra umbilicalis. For clade II (β, γ, and δ) PLDs, orthologs from Klebsormidium nitens and Chara braunii, two charophytic algae very closely related to land plants, were placed on the root. Similarly, the most ancient orthologs of clade III PLDs (PLDζs) came from K. nitens and C. braunii. For clade IV PLDs (PLDϕs), we identified one homolog from Chloropicon primus, a tiny marine green alga, and two homologs from P. yezoensis and P. purpureum.
Within each PLD clade, the PLDs of peatmosses and true mosses (Bryopsida) were clustered tightly together, forming five separate sub-clades (A–E) (Figure 3), consistent with their taxonomic classification. It was noteworthy that three of these five moss sub-clades (i.e., sub-clades A, C, and D) could be further divided into two groups, each comprising PLDs from S. magellanicum, S. fallax, C. purpureus, P. patens, F. antipyretica, and P. schreberi. Furthermore, phylogenetic analysis suggested that the PLD family underwent four species-specific gene duplications in mosses, that is, CpPLDs 2 and 3; PpPLDs 6, 8 and 11; PpPLDs 4 and 12; SfPLDs 10, 13–16, and 20 (Figure 3).
Conserved domains and motifs in the moss PLDs
The phospholipase D, phospholipase D C terminal, C2, and PX/PH domains commonly reported in angiosperm PLDs were identified in moss PLDs (Supplementary Table S2; Supplementary Figure S3). In mosses, clubmosses, ferns, and liverworts, most of the obtained PLDs contained the phospholipase D domain, except for MpPLDs 8–10 and AfPLD14 (Supplementary Table S2). The phospholipase D C terminal and C2 domain were found in moss PLDs within clades I and II (α, β, γ, ε, and δ PLDs), with a few exceptions. For example, the C2 domain was missing in PpPLD11, PpPLD12, PsPLDs 1–4 and 8, FaPLDs 4 and 6, and CpPLD10. The PX/PH domains were specific to clade III PLDs (PLDζs) (Figure 4). However, in moss clade III PLDs (PLDζs), FaPLD10 did not contain the PX domain, and SfPLD18 and SmaPLD13 did not have the PH domain. In addition, signal peptide sequences were observed in the moss clade IV (ϕ) PLDs (SfPLDs 10, 14, and 20, SmaPLD14, FaPLD12, and PpPLD9).
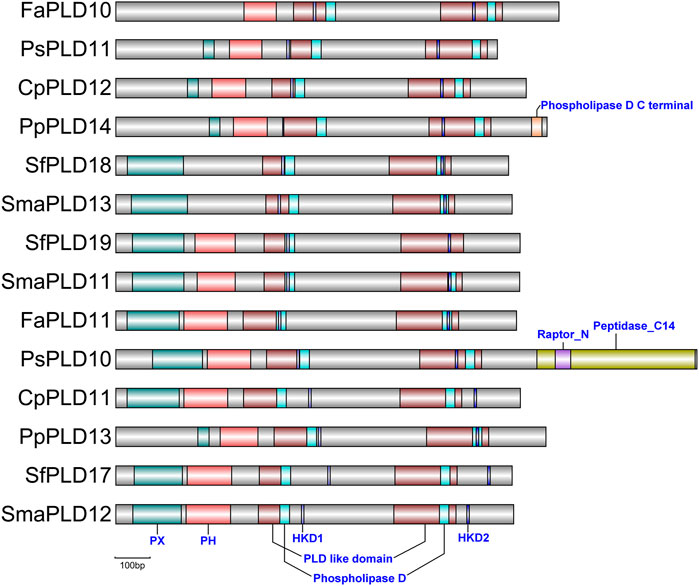
FIGURE 4. Conserved domains and motifs observed in moss clade III (PX/PH) PLDs. The full conserved domains and motifs detected in all PLDs were displayed in Supplementary Table S2 due to page limitation. The PLDs are ordered according to the phylogenetic tree displayed in Figure 3. The grey bars indicate the PLD protein sequences. The phospholipase D (Pfam accession number: PF00614) and PLD like domains (Pfam accession number: PF13091/PF13918) are indispensable for hydrolyzing phosphatidylcholine into phosphatidic acid. The phospholipase D C terminal (Pfam accession number: PF12357) can bind to calcium. The PX domain (Pfam accession number: PF00787) contains a pbox consensus sequence. The PH (Pfam accession number: PF00169) is a pleckstrin homology domain approximately 120 amino acids in length. The HKD1 and HKD2 motifs contain the core sequence “H×K××××D”.
The HKD (H×K××××D) motifs are also frequently noted characteristics in angiosperm PLDs (Elias et al., 2002). Using the MEME/MAST software (Bailey and Gribskov, 1998), we found that HKD1 and HKD2 motifs were present in most of the moss PLDs, with a few exceptions (Figure 4; Supplementary Figure S3; Supplementary Table S2). For instance, the HKD1 motif was absent in PpPLD12, PsPLDs 1 and 2, FaPLD12, and SfPLDs 14, 15, and 20. A total of 18 moss PLDs lacked the HKD2 motif, e.g., CpPLD13, PpPLD9, and SmaPLD14.
Gene structure analyses in the moss PLDs
Given that the diversity of gene structure is important for the evolution of a gene family (Liu et al., 2009), the exon-intron structures of moss PLDs were analyzed. As shown in Supplementary Figure S4, PLDs within a clade generally share similar exon-intron structures, in a manner roughly consistent with their phylogenetic relationships. For instance, both SfPLD4 and SmaPLD8 contained five exons, with almost identical exon-intron structures. In these two genes, the first and second exons were about 600 and 150 bp, respectively, with the first intron measuring about 170 bp. Another representative case was the pair of SfPLD11 and SmaPLD10, both of which possessed three exons, and shared highly similar gene structures. When the PLDs of clubmosses, ferns, and liverworts were taken into consideration, the clade II (β, γ, and δ) PLDs had the largest average number of exons, approximately 9.6 per gene (Supplementary Figure S5), significantly more than those of clades I and IV (α, ε, and ϕ PLDs, 3.8 and 6 average exons per gene, respectively). Interestingly, PX/PH PLDs (ζ, clade III) of peatmosses and true mosses had an average of 2.6 exons per gene, significantly fewer than those of ferns, clubmosses and K. nitens (on average 16.9, 20, and 16 exons per gene, respectively), suggesting intron loss in the moss PX/PH (ζ) PLDs.
Examination of cis-elements in promoters of P. patens PLD genes
Cis-elements of the promoter region can regulate gene transcription and function. As shown in Figure 5, the cis-acting elements observed in PpPLD gene promoters can be divided into four general groups, i.e., stress-, light-, phytohormone-, and growth and development-correlated motifs. Five stress associated (drought, salt, low-temperature, wound, and anaerobic) responsive elements consisting of P-box, ARE, DRE1, WRE3, WUN-motif, MYB, MYC, MBS, LTR, GC-motif, STRE, and AIRE, constituted the most redundant cis-elements in PpPLD genes. Specifically, several stress related elements were extensively dispersed in PpPLDs 3 and 9. The light response involved motifs were the second-most enriched cis-elements in the PpPLD gene promoters. The identified light responsive elements included 3-AF1 binding site, AAAC-motif, ACE, AE-box, AT1-motif, ATC-motif, ATCT-motif, Box 4, Box II, chs-CMA1a, chs-Unit 1 m1, GA-motif, Gap-box, GATA-motif, G-box, GT1-motif, GTGGC-motif, I-box, LAMP-element, L-box, MRE, Sp1, TCCC-motif, and TCT-motif. Additionally, we found phytohormone-correlated motifs, including ABRE, ERE, CGTCA-motif, TGACG-motif, AuxRR-core, GARE-motif, as-1, and TGA-box. The plant growth and development related motifs were comprised of circadian (involved in circadian regulatory), O2-site (associated with zein metabolism regulation), and CAT-box (related to meristem expression).
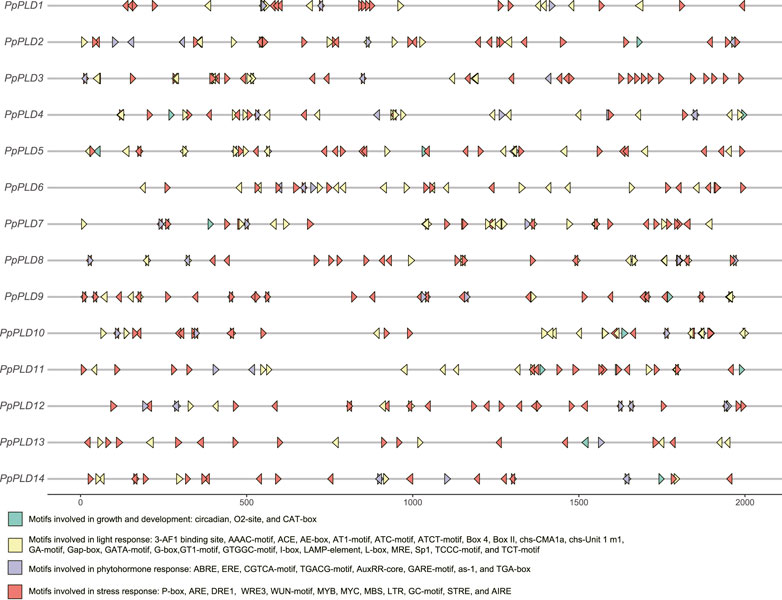
FIGURE 5. Predicted cis-elements in the promoter regions of the PpPLD genes.
Expression profiles of the moss PLD genes
The expression profile of a gene can provide useful information about its molecular function (Brown et al., 2005; Hansen et al., 2014). To analyze the transcriptional activity of the PLDs, we performed expression analyses. Publicly available RNA-seq data were found for P. patens, C. purpureus, F. antipyretica, C. richardii, A. filiculoide, S. cucullate, and M. polymorpha (Supplementary Table S3). For each of these species, an average of 165.25 GB of transcriptome data were collected. The expression level was estimated by TPM. As a result, most of the investigated moss, clubmoss, fern, and liverwort PLDs were expressed under certain conditions (Figure 6 and Supplementary Table S4). For instance, 11 of 14 P. patens PLDs were expressed; among these, PpPLD3 was the most highly expressed (TPM = 81.88), suggesting it had a critical function in these experimental studies. Additionally, of the tested plants, in species other than F. antipyretica and A. filiculoides, both the highest and lowest expressed PLDs were found in clade I (PLDαs and PLDεs). These results suggested that clade I PLDs maintained differentiated functions in the tested conditions.
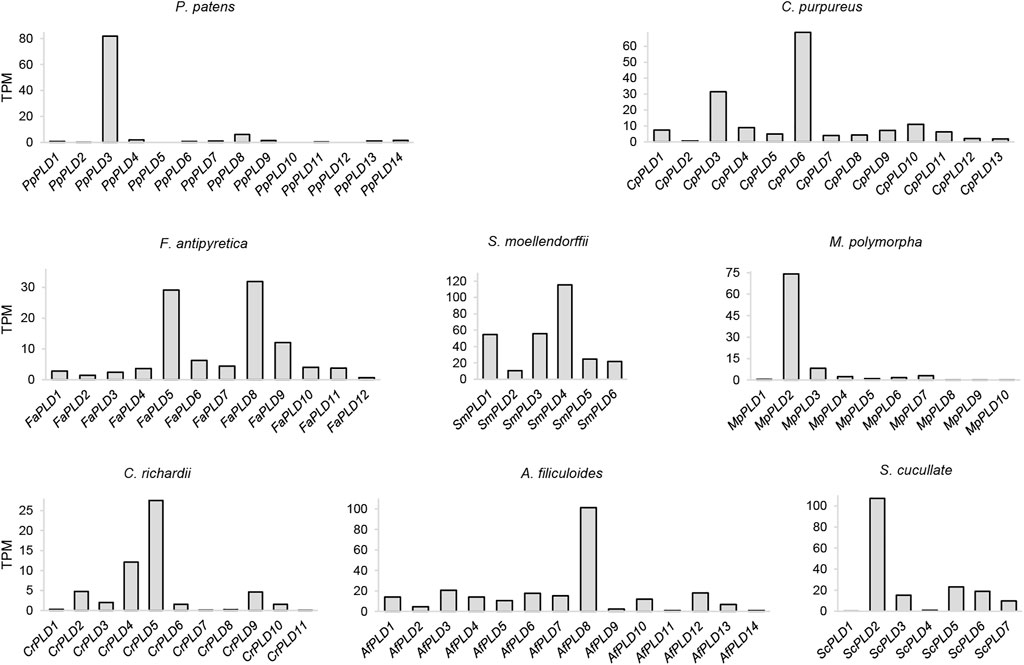
FIGURE 6. Expression profiles of the moss, clubmoss, liverwort, and fern PLDs. This figure is based on data collected from different RNA-seq experiments and demonstrates the expression of PLDs for each species regardless of the tested conditions. The expression value is not intended for comparison among species. TPM: transcripts per million. The BioProject IDs of the transcriptome experiments are listed in Supplementary Table S3.
Analysis of PLD expression profiles in different tissues of P. patens
Tissue-specific expression profiles of PpPLD genes were examined in 11 various tissues, including caulonema, chloronema, protoplast, rhizoids, gametophore, archegonia, spores, and four developmental sporophytic stages, i.e., sporophyte S1, S2, S3, and M, using microarray expression data obtained from the Physcomitrella eFP Browser. In line with the RNA-seq results, PpPLD3 was the top expressed in all tested tissues. For most P. patens tissues, the second highest expression levels were detected in PpPLDs 4, 7, and 8, and the lowest detectable expression level was found in PpPLD5 (Figure 7A). The results also showed that PpPLD expression varied among tissues. For instance, PpPLDs 1 and 7 were preferentially expressed in protoplast; PpPLDs 2, 13, and 14 were most highly expressed in spores; Expression of PpPLDs 3, 4, and 10 were strongest in gametophore; expression of PpPLDs 5 and 6 were highest in archegonia; and PpPLDs 8 and 9 were most abundantly expressed in sporophyte M and chloronema, respectively. Additionally, in chloronema, expression of PpPLDs 2, 4, and 9 were moderate (the expression values ranged from 2000 to 3000). While in gametophore, moderate expression was observed in PpPLDs 1, 2, 10, and 13. In closely related tissues, such as caulonema and chloronema, several PLD genes showed similar expression levels, e.g., PpPLDs 1, 3, 5, 7, and 8. During the sporophyte development, PpPLD6 was highly expressed at the S1 stage and decreased after that, whereas expression of PpPLD8 continued to increase after the S1 stage.
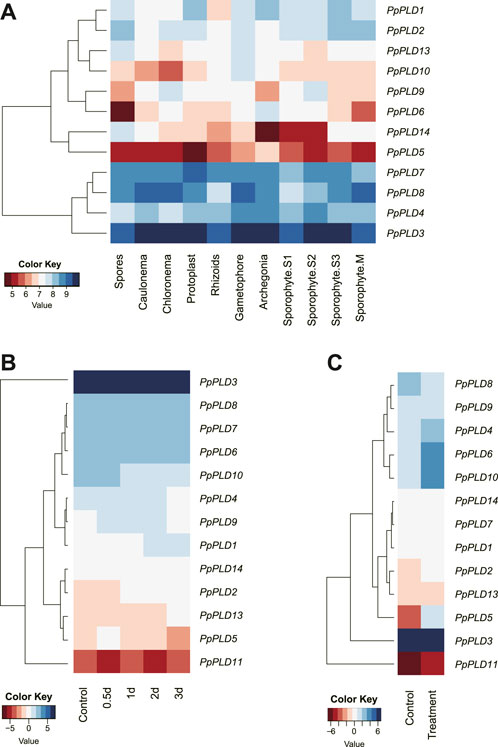
FIGURE 7. Hierarchical clustering of the P. patens PLD expression profiles. (A). Expression data in different tissues including caulonema, chloronema, protoplast, rhizoids, gametophore, archegonia, spores, and four sporophytic stages. The sporophyte S1, S2, S3, and M stages referred to the development stages 7, 15, 20, and 33 days after fertilization (Ortiz-Ramirez et al., 2016). (B) Expression data obtained from infected and uninfected P. patens plants. Total RNA from infected plants were extracted 0.5, 1, 2, and 3 days after inoculation with Botrytis cinerea. (C) Transcriptional expression of PpPLDs under salt stress and control conditions. P. patens plants were grown under salinity (200 mM NaCl) and control (0 mM NaCl) conditions for 7 days. Genomic RNA was extracted from protonema tissue. The log-transformed values of the expression levels of PLD genes were used (original data are shown in Supplementary Table S4).
Expression analyses of PpPLDs under biotic and abiotic stress conditions
The cis-element analysis suggested that PpPLDs played an important role in stress-responsive behavior. Therefore, we analyzed expression patterns of PpPLD genes under different biotic and abiotic stress conditions, including fungal pathogens and salt. For biotic stress, the RNA-seq data were generated at 0.5, 1, 2, and 3 days after infection of Botrytis cinerea. Expression of seven PpPLDs (i.e., PpPLD1, PpPLD2, PpPLD5, PpPLD6, PpPLD10, PpPLD11, and PpPLD13) were found to be significantly induced at least in one time point (≥1.5-fold change, Figure 7B). For instance, PpPLD2 showed higher expression at 1 dpi (days after inoculation) (1.52 fold), 2 dpi (1.90 fold), and 3 dpi (1.71 fold). PpPLD11 was upregulated at 0.5 dpi (2.67 fold), and downregulated at 2 dpi (2.00 fold). Under salinity stress, eight PpPLDs showed differential expression (≥1.5-fold change, Figure 7C). Upregulated genes included PpPLD2 (1.71 fold), PpPLD4 (2.38 fold), PpPLD5 (27.55 fold), PpPLD6 (3.47 fold), PpPLD10 (5.53 fold), and PpPLD11 (2.29 fold). PpPLD7 and PpPLD8 exhibited decreased expression (1.51 and 2.15-fold, respectively) when treated with NaCl.
Selection pressures on the evolution of PLD genes of mosses
To unravel the molecular evolutionary mechanisms underlying the PLDs of mosses, clubmosses, ferns, and liverworts, the FUBAR method which can detect pervasive positive and negative selection at specific sites, alignment-wide (Murrell et al., 2013), was applied. We found no sites under positive selection, 193 sites from clades I–III (α, β, γ, δ, ε, and ζ PLDs), and 282 sites from clade IV (PLDϕs), with evidence of purifying selection at a posterior probability >0.9 (Supplementary Table S5). Because selection is often transient rather than pervasive, we therefore restricted the analysis to moss PLDs, and adopted the MEME method (Murrell et al., 2012), which can identify individual sites that have experienced episodic positive selection under a proportion of branches. We found evidence of positive selection at 11 sites of the moss clades I–III (α, β, γ, δ, ε, and ζ) PLDs, and at 16 sites of the moss clade IV PLDs (PLDϕs) (p < 0.05, Supplementary Table S5). The MEME method can detect selection at site-level, but cannot detect gene-wide selection. To detect gene-wide positive selection acting on the moss PLDs, we used the BUSTED method which can test for positive selection on a subset of branches and at a proportion of sites (Murrell et al., 2015). As a result, about 0.90% sites of the moss PLDs from clades I–III (α, β, γ, δ, ε, and ζ PLDs) were found to be evolving with ω >1 [likelihood ratio test statistic (LRT) = 34.56, p = 1.56 × 10⁻⁸, Table 1]. For the moss PLDs from clade IV (PLDϕs), 3.74% sites showed evidence of episodic positive selection (ω = 8.48, LRT = 19.20, p = 3.38 × 10⁻⁵, Table 1). In addition to site-level and gene-wide selections, we also examined the branch-level episodic diversifying selection acting on the moss PLDs, using the aBSREL method (Smith et al., 2015). Episodic positive selections were identified on 3% sites of CpPLD2 (ω2 = 455.26, LRT = 21.57, p = 8.87 × 10⁻⁴) and 22% sites of PpPLD11 (ω2 = 9.62, LRT = 17.07, p = 0.01, Supplementary Table S5). Since the aBSREL method does not report exactly which sites are under positive selection, we additionally performed the branch-site model analysis (by setting the CpPLD2 and PpPLD11 as foreground branches) using the CODEML program implemented in the PAML package. The likelihood ratio test comparing the modified model A (alternative model, fix_omega = 0) with the corresponding null model (fix_omega = 1) reached a significant level of p = 3.46 × 10⁻⁷. The alternative model reported that 24% sites of CpPLD2 and PpPLD11 had an estimate of ω2 = 7.44, among which 12 were statistically significant (p > 95%; 188T, 225K, 227P, 234E, 238L, 242C, 262K, 263F, 265Y, 334K, 366R, and 375Q of PpPLD11; Table 2).
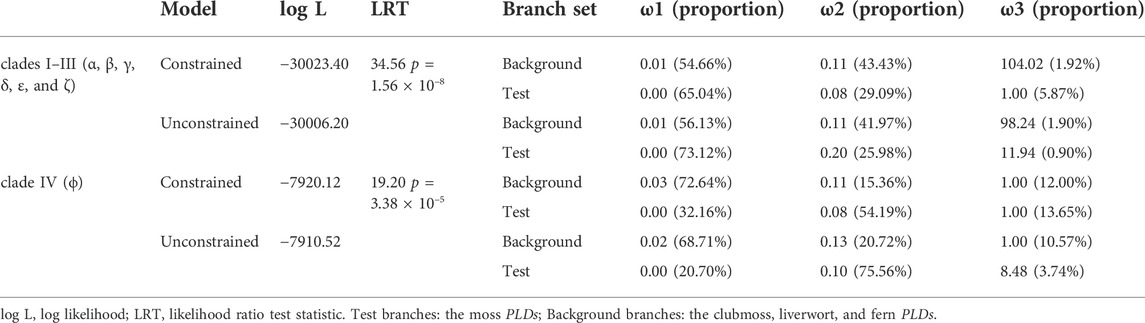
TABLE 1. The branch-site unrestricted statistical test for episodic diversification (BUSTED) results for moss PLDs.

TABLE 2. The branch-site model test result for CpPLD2 and PpPLD11.
To ascertain if the selection pressures (both positive and purifying) observed on the moss PLDs were relaxed or intensified, we adopted the RELAX method which introduces an intensity parameter (k). k >1 and k <1 indicate selective relaxation and intensification, respectively (Wertheim et al., 2015). Intensified selection was found in the moss sub-clade B PLDs comprising FaPLD4, PsPLD1, PpPLD10, CpPLD10, SfPLD11, and SmaPLD10 (k = 4.21, p = 1.36 × 10⁻⁶, LRT = 23.34), and in the moss sub-clade D (ζ) PLDs (k = 1.23, p = 0.01, LRT = 6.62). Additionally, we found evidence of relaxed selection in the moss sub-clade C PLDs (β, γ and δ) (k = 0.75, p < 0.05, LRT = 3.96).
Three-dimensional structure prediction of PpPLD11
To gain insights into the function of the positively selected sites of PpPLD11, we predicted its crystal structure using AlphaFold (Figure 8). The per-residue confidence score (pLDDT, a value between 0 and 100) indicated that the PpPLD11 protein tertiary structure model had a high confidence. For homology modeling method, the protein sequence of Arabidopsis PLDα1 (6 kz8.1A, which shared an identity of 56.9% with PpPLD11) was used as the template. The 3D structure of the PpPLD11 protein constructed by homology modeling had a global model quality estimate (GMQE, a value between 0 and 1) of 0.77 (Supplementary Figure S6). On these two models, nine positively selected sites (188T, 225K, 227P, 234E, 238L, 262K, 263F, 265Y, and 334K) were present in the loop region, and three positively selected sites (242C, 366R, and 375Q) were distributed in the helix. Interestingly, these 12 positively selected sites were located on the surface of the 3D structures (Figure 8C and Supplementary Figure S6).
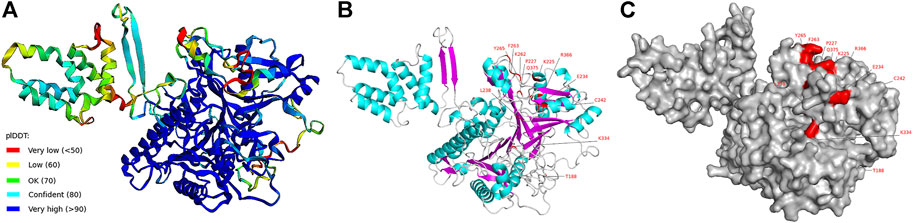
FIGURE 8. Three-dimensional structure of PLD11 predicted by AlphaFold. (A) Schematic diagram of 3D structure of PpPLD11 colored by the pLDDT score. (B) View of positively selected amino acid sites on the 3D structure of PpPLD11. Helix, sheet, and loop are represented by cyan, magenta, and light grey, respectively. (C) View of positively selected amino acid sites on the surface of PpPLD11. The positively selected sites are colored in red.
Discussion
Despite that the PLD gene members have been widely documented in various angiosperms, such as A. thaliana, Gossypium arboretum, and Camellia sinensis, (Qin and Wang, 2002; Tang et al., 2016; Roshan et al., 2021), little is known about the diversification of moss PLDs. To fill this gap in our knowledge, we performed a genome-wide comparative analysis of PLD genes among six mosses, one clubmoss, one liverwort, and three ferns. The 132 PLDs identified were not considered the result of sequencing contamination, because they were mapped to well-assembled scaffolds or chromosomes, and most of them were found to be expressed. However, it is still possible that several PLD genes (e.g., M. polymorpha PLDs 8–10) may suffer from genome assembly errors considering that their protein sequences are unusually short.
The phylogenetic analysis divided the plant PLDs into four distinct clades (I–IV), mostly consistent with the categorization of C2, PX/PH, and SP PLDs. Our results suggested that the origin of land plant C2, PX/PH, and SP PLDs could be traced back at least to the emergence of green algae. Furthermore, we reconstructed a hypothetical evolutionary pattern for moss PLDs (Figure 9). Three ancestral C2 PLDs (clades I and II, i.e., α, β, γ, ε, and δ PLDs) were predicted to have diverged before the most recent common ancestor (MRCA) of land plants. The first and second ancestral C2 PLD copies (e.g., the homologs of the moss sub-clades A and C, respectively) were expanded in mosses. The rapid expansion of the first ancestral copy was also observed in all investigated liverworts, clubmosses, and ferns. The third ancestral C2 PLD copy (e.g., the homologs of the moss sub-clade B) was highly conserved in mosses, with exactly one homolog per species. For both PX/PH and SP PLDs, only one ancestral PLD was present in the MRCA of land plants. The primary expansion of moss PX/PH PLD had occurred before the splitting of the bryophyte lineage. Of note, duplication of SP PLD was observed in S. fallax but not in other investigated mosses. The S. fallax SP PLDs are believed to emerge from one segmental duplication and four tandem duplications.
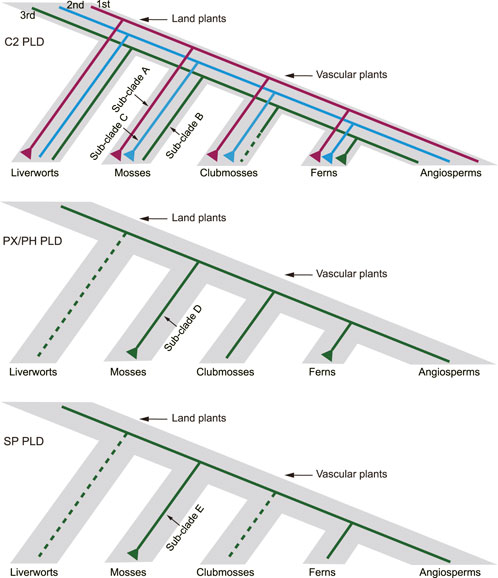
FIGURE 9. Hypothetical scheme of the expansion history of PLDs in mosses, clubmosses, liverworts, and ferns. Dashed lines indicate putative gene loss events.
In P. patens, it was reported that two separate whole genome duplication (WGD) events occurred 27–35 and 40–48 million years ago (Lang et al., 2018). Here, we demonstrated that WGD greatly contributed to the recent P. patens-specific PLD duplications. This expansion pattern differed from the small-scale gene duplications (e.g., tandem and proximal gene duplications) that mainly occurred to PLDs of S. fallax and C. purpureus. For instance, PpPLD2 and PpPLD8 were located on chromosomes 8 and 23, respectively, and both PpPLD6 and PpPLD11 were anchored to chromosome 20. Together with the fact that chromosomes 8, 20, and 23 are derived from a common ancestor (Lang et al., 2018), it is likely that the primary WGD generated PpPLD2 and the ancestor of PpPLDs 6, 8, and 11, and the second WGD yielded PpPLD8 and the ancestor of PpPLD6 and PpPLD11, with a subsequent tandem duplication on chromosome 20 producing the current PpPLD6 and PpPLD11.
In the same PLD clade, the domains, motifs, and exons had similar arrangements, lending further support to the aforementioned classification of the four clades. The N-terminal C2 domain prevalent in clade I and II (i.e., α, β, γ, ε, and δ) PLDs is a Ca2+-dependent phospholipid binding region critical for the affinity to substrates (Wang, 2005). The PX/PH domains specific to the clade III PLDs (PLDζs) are crucial to PLD phosphoinositide binding activity, subcellular distribution and intracellular trafficking (Morris, 2007). The HKD1 and HKD2 motifs can be packed against each other, forming the core structure essential for PLD catalysis (Li et al., 2020). Our work revealed that more than 82% of the PLDs identified in mosses, liverworts, clubmosses, and ferns contained certain clade-specific sequence similarities (the C2, PX/PH domains, or the signal peptide sequences), and over 95% shared the HKD1 or HKD2 motifs, implying high inter- and intra-clade genetic conservation. In addition, we found moss-specific intron removal in PX/PH (ζ) PLDs. Such intron losses may provide evolutionary advantages through expression regulation and functional differentiation (Park et al., 2010; Wang H. et al., 2014).
Identification of the drought, salt, low-temperature, wound, and anaerobic related cis-elements in the PpPLD promoter regions suggested that these genes are associated with P. patens response to various stresses. For example, the LTR cis-acting element was involved in low-temperature responsiveness (Brown et al., 2001). The wheat cytosolic glyceraldehyde-3-phosphate dehydrogenase 1 gene, which contained the LTR and MBS cis-acting elements in its promoters, showed an upregulated expression under salt stress (Fei et al., 2017). Our results also suggested that PpPLDs were likely related to light and phytohormone responses, and body development, through cis-elements such as Gap-box, ABRE, and CAT-box (Park et al., 1996; Choi et al., 2000).
RNA-seq based gene expression analysis revealed that most PLDs of mosses, clubmosses, ferns, and liverworts were expressed in transcriptome experiments. Among the PLDs of P. patens and C. purpureus, PpPLD3 and CpPLD6 (both from moss sub-clade A, PLDαs) exhibited the most abundant expression, suggesting that in the experimental studies, the α PLDs might provide important functions to these two closely related mosses. For P. patens, 12 of the 14 PLDs were expressed in different life cycle phases, implying a crucial role in plant growth and development. We also found that about half of the P. patens PLD genes responded to environmental stresses. In particular, four α PLDs, i.e., PpPLD2, PpPLD6, PpPLD10, and PpPLD11, were involved in biotic and abiotic stress responses. These findings are expected given that PLDαs are known to function in stress-induced signaling in angiosperms (Kargiotidou et al., 2010; Bourtsala et al., 2017; Ufer et al., 2017).
A previous adaptive evolution analysis suggested that positive selection drove the evolution of PX/PH and SP PLDs of Arabidopsis, rice, poplar, and grape (Liu et al., 2010). In the present study, we found evidence that most of the C2, PX/PH, and SP PLDs of mosses, clubmosses, liverworts, and ferns were subject to ongoing purifying selection, indicating the dominance of non-synonymous mutations during the evolution of early land plant PLD gene family. In addition, both relaxed and intensified selections were found in moss C2 PLDs. These results suggested that the C2 PLDs were particularly diversified and might be a potential source of new biological functions during moss evolution. In support of this conclusion, the moss C2 PLDs were found to display highly diverse gene structures and were the most differentially expressed.
Mosses are considered one of the earliest colonizers of land. During their transition from aquatic to terrestrial habitat, mosses had to tolerate biotic and abiotic stresses such as viruses, drought and salinity (Yue et al., 2012). Intriguingly, our results obtained through multiple methods suggested that several sites and/or branches of clade I–IV PLDs (C2, PX/PH, and SP PLDs) experienced an episode of positive selection in the moss lineage. Among them, the strongest positive selection signals were detected in the moss C2 PLDs, e.g., P. patens PLD11 and C. purpureus PLD2. The predicted three-dimensional model of PpPLD11 revealed that the 12 positively selected sites existed on the enzyme’s surface, suggesting that they may affect substrate binding ability. In angiosperms, C2 PLDs are implicated in response to diverse environmental stressors (Wang, 2005; Zhao, 2015). For example, overexpression of the heterologous C2 PLDs (PLDαs) in Arabidopsis and tobacco (Nicotiana spp.) improved the tolerance of these plants to drought and osmotic stress (Wang J. et al., 2014; Ji et al., 2017). We reason that the evolution of PpPLDs might confer beneficial traits particularly associated with stress regulatory networks, and thereby facilitated P. patens adaptation to terrestrial environments.
In summary, we revealed 84 PLD genes in six mosses, and investigated their evolutionary history. Conserved sequence characteristics (e.g., domain, motif, and gene structure), and expression of these PLDs, especially P. patens PLDs were examined. Although purifying selection largely drove the evolution of PLDs of mosses, liverworts, clubmosses, and ferns, episodic positive selection left footprints in the genetic diversity of moss PLDs. Our results will be informative for designing experiments to better understand the biological functions of PLDs in mosses. Future exploration of PLDs from more different plant groups and deciphering their functions may help dissect the evolution of PLD-mediated signaling in plants.
Data availability statement
The datasets presented in this study can be found in online repositories. The names of the repository/repositories and accession number(s) can be found in the article/Supplementary Material.
Author contributions
ML and JZ conceived the study and wrote the manuscript. ML, JZ, XP, and WL participated in the data analysis. All authors approved the final version to be submitted for publication.
Funding
This work was supported by a grant from the Yunnan Fundamental Research Projects (grant No. 202001AU070044) to ML and from the Yunnan University’s Research Innovation Fund for Graduate Students (No. 2020Z80) to JZ.
Acknowledgments
The authors thank Fengyi Hu for his helpful suggestions.
Conflict of interest
The authors declare that the research was conducted in the absence of any commercial or financial relationships that could be construed as a potential conflict of interest.
Publisher’s note
All claims expressed in this article are solely those of the authors and do not necessarily represent those of their affiliated organizations, or those of the publisher, the editors and the reviewers. Any product that may be evaluated in this article, or claim that may be made by its manufacturer, is not guaranteed or endorsed by the publisher.
Supplementary material
The Supplementary Material for this article can be found online at: https://www.frontiersin.org/articles/10.3389/fgene.2022.1015393/full#supplementary-material
References
Bailey, T. L., and Gribskov, M. (1998). Combining evidence using p-values: Application to sequence homology searches. Bioinformatics 14, 48–54. doi:10.1093/bioinformatics/14.1.48
Beerling, D. J., Osborne, C. P., and Chaloner, W. G. (2001). Evolution of leaf-form in land plants linked to atmospheric CO2 decline in the Late Palaeozoic era. Nature 410, 352–354. doi:10.1038/35066546
Bourtsala, A., Farmaki, T., and Galanopoulou, D. (2017). Phospholipases Dα and δ are involved in local and systemic wound responses of cotton (G. hirsutum). Biochem. Biophys. Rep. 9, 133–139. doi:10.1016/j.bbrep.2016.12.001
Boyce, C. K. (2008). How green was cooksonia? The importance of size in understanding the early evolution of physiology in the vascular plant lineage. Paleobiology 34, 179–194. doi:10.1666/0094-8373(2008)034[0179:Hgwcti]2.0.Co;2
Bray, N. L., Pimentel, H., Melsted, P., and Pachter, L. (2016). Near-optimal probabilistic RNA-seq quantification. Nat. Biotechnol. 34, 525–527. doi:10.1038/nbt.3519
Brown, A. P. C., Dunn, M. A., Goddard, N. J., and Hughes, M. A. (2001). Identification of a novel low-temperature-response element in the promoter of the barley (Hordeum vulgare L) gene blt101.1. Planta 213, 770–780. doi:10.1007/s004250100549
Brown, D. M., Zeef, L. a. H., Ellis, J., Goodacre, R., and Turner, S. R. (2005). Identification of novel genes in Arabidopsis involved in secondary cell wall formation using expression profiling and reverse genetics. Plant Cell 17, 2281–2295. doi:10.1105/tpc.105.031542
Camacho, C., Coulouris, G., Avagyan, V., Ma, N., Papadopoulos, J., Bealer, K., et al. (2009). BLAST+: Architecture and applications. BMC Bioinforma. 10, 421. doi:10.1186/1471-2105-10-421
Capella-Gutierrez, S., Silla-Martinez, J. M., and Gabaldon, T. (2009). trimAl: a tool for automated alignment trimming in large-scale phylogenetic analyses. Bioinformatics 25, 1972–1973. doi:10.1093/bioinformatics/btp348
Choi, H.-I., Hong, J.-H., Ha, J.-O., Kang, J.-Y., and Kim, S. Y. (2000). ABFs, a family of ABA-responsive element binding factors. J. Biol. Chem. 275, 1723–1730. doi:10.1074/jbc.275.3.1723
Elias, M., Potocky, M., Cvrckova, F., and Zarsky, V. (2002). Molecular diversity of phospholipase D in angiosperms. BMC Genomics 3, 2. doi:10.1186/1471-2164-3-2
Fei, Y., Xue, Y., Du, P., Yang, S., and Deng, X. (2017). Expression analysis and promoter methylation under osmotic and salinity stress of TaGAPC1 in wheat (Triticum aestivum L). Protoplasma 254, 987–996. doi:10.1007/s00709-016-1008-5
Finn, R. D., Bateman, A., Clements, J., Coggill, P., Eberhardt, R. Y., Eddy, S. R., et al. (2013). Pfam: The protein families database. Nucleic Acids Res. 42, D222–D230. doi:10.1093/nar/gkt1223
Fisher, R. A. (1992). “Statistical methods for research workers,” in Breakthroughs in statistics: Methodology and distribution. Editors S. Kotz, and N. L. Johnson (New York, NY: Springer New York), 66–70. doi:10.1007/978-1-4612-4380-9_6
Hansen, B. O., Vaid, N., Musialak-Lange, M., Janowski, M., and Mutwil, M. (2014). Elucidating gene function and function evolution through comparison of co-expression networks of plants. Front. Plant Sci. 5, 394. doi:10.3389/fpls.2014.00394
Harris, B. J., Harrison, C. J., Hetherington, A. M., and Williams, T. A. (2020). Phylogenomic evidence for the monophyly of bryophytes and the reductive evolution of stomata. Curr. Biol. 30, 2001–2012. doi:10.1016/j.cub.2020.03.048
Hong, Y., Pan, X., Welti, R., and Wang, X. (2008). Phospholipase Dα3 is involved in the hyperosmotic response in Arabidopsis. Plant Cell 20, 803–816. doi:10.1105/tpc.107.056390
Hong, Y., Devaiah, S. P., Bahn, S. C., Thamasandra, B. N., Li, M., Welti, R., et al. (2009). Phospholipase D epsilon and phosphatidic acid enhance Arabidopsis nitrogen signaling and growth. Plant J. 58, 376–387. doi:10.1111/j.1365-313X.2009.03788.x
Hong, K., Zhang, L., Zhan, R., Huang, B., Song, K., and Jia, Z. (2017). Identification and characterization of phospholipase D genes putatively involved in internal browning of pineapple during postharvest storage. Front. Plant Sci. 8, 913. doi:10.3389/fpls.2017.00913
Jang, J. H., Lee, C. S., Hwang, D., and Ryu, S. H. (2012). Understanding of the roles of phospholipase D and phosphatidic acid through their binding partners. Prog. Lipid Res. 51, 71–81. doi:10.1016/j.plipres.2011.12.003
Ji, T., Li, S., Huang, M., Di, Q., Wang, X., Wei, M., et al. (2017). Overexpression of cucumber phospholipase D alpha gene (CsPLDα) in tobacco enhanced salinity stress tolerance by regulating Na+–K+ balance and lipid peroxidation. Front. Plant Sci. 8, 499. doi:10.3389/fpls.2017.00499
Jumper, J., Evans, R., Pritzel, A., Green, T., Figurnov, M., Ronneberger, O., et al. (2021). Highly accurate protein structure prediction with AlphaFold. Nature 596, 583–589. doi:10.1038/s41586-021-03819-2
Kargiotidou, A., Kappas, I., Tsaftaris, A., Galanopoulou, D., and Farmaki, T. (2010). Cold acclimation and low temperature resistance in cotton: Gossypium hirsutum phospholipase dalpha isoforms are differentially regulated by temperature and light. J. Exp. Bot. 61, 2991–3002. doi:10.1093/jxb/erq124
Katoh, K., and Standley, D. M. (2013). MAFFT multiple sequence alignment software version 7: Improvements in performance and usability. Mol. Biol. Evol. 30, 772–780. doi:10.1093/molbev/mst010
Kopka, J., Pical, C., Hetherington, A. M., and Muller-Rober, B. (1998). Ca2+/phospholipid-binding (C2) domain in multiple plant proteins: Novel components of the calcium-sensing apparatus. Plant Mol. Biol. 36, 627–637. doi:10.1023/a:1005915020760
Kosakovsky Pond, S. L., Poon, A. F. Y., Velazquez, R., Weaver, S., Hepler, N. L., Murrell, B., et al. (2020). HyPhy 2.5—A customizable platform for evolutionary hypothesis testing using phylogenies. Mol. Biol. Evol. 37, 295–299. doi:10.1093/molbev/msz197
Lang, D., Ullrich, K. K., Murat, F., Fuchs, J., Jenkins, J., Haas, F. B., et al. (2018). The Physcomitrella patens chromosome-scale assembly reveals moss genome structure and evolution. Plant J. 93, 515–533. doi:10.1111/tpj.13801
Letunic, I., Khedkar, S., and Bork, P. (2020). Smart: Recent updates, new developments and status in 2020. Nucleic Acids Res. 49, D458–D460. doi:10.1093/nar/gkaa937
Li, F.-W., Brouwer, P., Carretero-Paulet, L., Cheng, S., De Vries, J., Delaux, P.-M., et al. (2018). Fern genomes elucidate land plant evolution and cyanobacterial symbioses. Nat. Plants 4, 460–472. doi:10.1038/s41477-018-0188-8
Li, J., Yu, F., Guo, H., Xiong, R., Zhang, W., He, F., et al. (2020). Crystal structure of plant PLDα1 reveals catalytic and regulatory mechanisms of eukaryotic phospholipase D. Cell Res. 30, 61–69. doi:10.1038/s41422-019-0244-6
Li, L., Zhang, C., Zhang, M., Yang, C., Bao, Y., Wang, D., et al. (2021). Genome-wide analysis and expression profiling of the phospholipase D gene family in Solanum tuberosum. Biology 10, 741. doi:10.3390/biology10080741
Liu, Q., Zhang, C., Yang, Y., and Hu, X. (2010). Genome-wide and molecular evolution analyses of the phospholipase D gene family in Poplar and Grape. BMC Plant Biol. 10, 117. doi:10.1186/1471-2229-10-117
Liu, S.-L., Zhuang, Y., Zhang, P., and Adams, K. L. (2009). Comparative analysis of structural diversity and sequence evolution in plant mitochondrial genes transferred to the nucleus. Mol. Biol. Evol. 26, 875–891. doi:10.1093/molbev/msp011
Mane, S. P., Vasquez-Robinet, C., Sioson, A. A., Heath, L. S., and Grene, R. (2007). Early PLDalpha-mediated events in response to progressive drought stress in Arabidopsis: A transcriptome analysis. J. Exp. Bot. 58, 241–252. doi:10.1093/jxb/erl262
Morris, A. J. (2007). Regulation of phospholipase D activity, membrane targeting and intracellular trafficking by phosphoinositides. Biochem. Soc. Symp. 74, 247–257. doi:10.1042/BSS0740247
Murrell, B., Moola, S., Mabona, A., Weighill, T., Sheward, D., Kosakovsky Pond, S. L., et al. (2013). Fubar: A fast, unconstrained bayesian approximation for inferring selection. Mol. Biol. Evol. 30, 1196–1205. doi:10.1093/molbev/mst030
Murrell, B., Weaver, S., Smith, M. D., Wertheim, J. O., Murrell, S., Aylward, A., et al. (2015). Gene-wide identification of episodic selection. Mol. Biol. Evol. 32, 1365–1371. doi:10.1093/molbev/msv035
Murrell, B., Wertheim, J. O., Moola, S., Weighill, T., Scheffler, K., and Kosakovsky Pond, S. L. (2012). Detecting individual sites subject to episodic diversifying selection. PLoS Genet. 8, e1002764. doi:10.1371/journal.pgen.1002764
Nguyen, L. T., Schmidt, H. A., Von Haeseler, A., and Minh, B. Q. (2015). IQ-TREE: A fast and effective stochastic algorithm for estimating maximum-likelihood phylogenies. Mol. Biol. Evol. 32, 268–274. doi:10.1093/molbev/msu300
Nielsen, H. (2017). “Predicting secretory proteins with SignalP,” in Protein function prediction: Methods and protocols. Editor D. Kihara (New York, NY: Springer New York), 59–73. doi:10.1007/978-1-4939-7015-5_6
Ortiz-Ramirez, C., Hernandez-Coronado, M., Thamm, A., Catarino, B., Wang, M., Dolan, L., et al. (2016). A transcriptome atlas of Physcomitrella patens provides insights into the evolution and development of land plants. Mol. Plant 9, 205–220. doi:10.1016/j.molp.2015.12.002
Park, S. C., Kwon, H. B., and Shih, M. C. (1996). Cis-acting elements essential for light regulation of the nuclear gene encoding the A subunit of chloroplast glyceraldehyde 3-phosphate dehydrogenase in Arabidopsis thaliana. Plant Physiol. 112, 1563–1571. doi:10.1104/pp.112.4.1563
Park, K.-C., Kwon, S.-J., and Kim, N.-S. (2010). Intron loss mediated structural dynamics and functional differentiation of the polygalacturonase gene family in land plants. Genes Genomics 32, 570–577. doi:10.1007/s13258-010-0076-8
Pederson, E. R. A., Warshan, D., and Rasmussen, U. (2019). Genome sequencing of Pleurozium schreberi: The assembled and annotated draft genome of a pleurocarpous feather moss. G3 9, 2791–2797. doi:10.1534/g3.119.400279
Pichersky, E., and Gang, D. R. (2000). Genetics and biochemistry of secondary metabolites in plants: An evolutionary perspective. Trends Plant Sci. 5, 439–445. doi:10.1016/S1360-1385(00)01741-6
Pinosa, F., Buhot, N., Kwaaitaal, M., Fahlberg, P., Thordal-Christensen, H., Ellerström, M., et al. (2013). Arabidopsis phospholipase Dδ is involved in basal defense and nonhost resistance to powdery mildew fungi. Plant Physiol. 163, 896–906. doi:10.1104/pp.113.223503
Qin, C., and Wang, X. (2002). The Arabidopsis phospholipase D family. Characterization of a calcium-independent and phosphatidylcholine-selective PLD zeta 1 with distinct regulatory domains. Plant Physiol. 128, 1057–1068. doi:10.1104/pp.010928
Qu, L., Chu, Y.-J., Lin, W.-H., and Xue, H.-W. (2021). A secretory phospholipase D hydrolyzes phosphatidylcholine to suppress rice heading time. PLoS Genet. 17, e1009905. doi:10.1371/journal.pgen.1009905
Ranwez, V., Douzery, E. J. P., Cambon, C., Chantret, N., and Delsuc, F. (2018). MACSE v2: Toolkit for the alignment of coding sequences accounting for frameshifts and stop codons. Mol. Biol. Evol. 35, 2582–2584. doi:10.1093/molbev/msy159
Ronquist, F., Teslenko, M., Van Der Mark, P., Ayres, D. L., Darling, A., Hohna, S., et al. (2012). MrBayes 3.2: Efficient bayesian phylogenetic inference and model choice across a large model space. Syst. Biol. 61, 539–542. doi:10.1093/sysbio/sys029
Roshan, N. M., Ashouri, M., and Sadeghi, S. M. (2021). Identification, evolution, expression analysis of phospholipase D (PLD) gene family in tea (Camellia sinensis). Physiol. Mol. Biol. Plants. 27, 1219–1232. doi:10.1007/s12298-021-01007-0
Ryu, S. B., Zheng, L., and Wang, X. (1996). Changes in phospholipase D experession in soybeans during seed development and germination. J. Am. Oil Chem. Soc. 73, 1171–1176. doi:10.1007/BF02523380
Selvy, P. E., Lavieri, R. R., Lindsley, C. W., and Brown, H. A. (2011). Phospholipase D: Enzymology, functionality, and chemical modulation. Chem. Rev. 111, 6064–6119. doi:10.1021/cr200296t
Singh, A., Pandey, A., Baranwal, V., Kapoor, S., and Pandey, G. K. (2012). Comprehensive expression analysis of rice phospholipase D gene family during abiotic stresses and development. Plant Signal. Behav. 7, 847–855. doi:10.4161/psb.20385
Smith, M. D., Wertheim, J. O., Weaver, S., Murrell, B., Scheffler, K., and Kosakovsky Pond, S. L. (2015). Less is more: An adaptive branch-site random effects model for efficient detection of episodic diversifying selection. Mol. Biol. Evol. 32, 1342–1353. doi:10.1093/molbev/msv022
Tang, K., Dong, C., and Liu, J. (2016). Genome-wide analysis and expression profiling of the phospholipase D gene family in Gossypium arboreum. Sci. China. Life Sci. 59, 130–141. doi:10.1007/s11427-015-4916-2
Ufer, G., Gertzmann, A., Gasulla, F., Röhrig, H., and Bartels, D. (2017). Identification and characterization of the phosphatidic acid binding A. thaliana phosphoprotein PLDrp1 which is regulated by PLDα1 in a stress dependent manner. Plant J. 92, 276–290. doi:10.1111/tpj.13651
Wang, H., Devos, K. M., and Bennetzen, J. L. (2014a). Recurrent loss of specific introns during angiosperm evolution. PLoS Genet. 10, e1004843. doi:10.1371/journal.pgen.1004843
Wang, J., Ding, B., Guo, Y., Li, M., Chen, S., Huang, G., et al. (2014b). Overexpression of a wheat phospholipase D gene, TaPLDα, enhances tolerance to drought and osmotic stress in Arabidopsis thaliana. Planta 240, 103–115. doi:10.1007/s00425-014-2066-6
Wang, X. (2000). Multiple forms of phospholipase D in plants: The gene family, catalytic and regulatory properties, and cellular functions. Prog. Lipid Res. 39, 109–149. doi:10.1016/s0163-7827(00)00002-3
Wang, X. (2005). Regulatory functions of phospholipase D and phosphatidic acid in plant growth, development, and stress responses. Plant Physiol. 139, 566–573. doi:10.1104/pp.105.068809
Waterhouse, A., Bertoni, M., Bienert, S., Studer, G., Tauriello, G., Gumienny, R., et al. (2018). SWISS-MODEL: Homology modelling of protein structures and complexes. Nucleic Acids Res. 46, W296–W303. doi:10.1093/nar/gky427
Wertheim, J. O., Murrell, B., Smith, M. D., Kosakovsky Pond, S. L., and Scheffler, K. (2015). Relax: Detecting relaxed selection in a phylogenetic framework. Mol. Biol. Evol. 32, 820–832. doi:10.1093/molbev/msu400
Yang, Z. (2007). Paml 4: Phylogenetic analysis by maximum likelihood. Mol. Biol. Evol. 24, 1586–1591. doi:10.1093/molbev/msm088
Yu, J., Li, L., Wang, S., Dong, S., Chen, Z., Patel, N., et al. (2020). Draft genome of the aquatic moss Fontinalis antipyretica (Fontinalaceae, Bryophyta). Gigabyte, 1–9. doi:10.46471/gigabyte.8
Yue, J., Hu, X., Sun, H., Yang, Y., and Huang, J. (2012). Widespread impact of horizontal gene transfer on plant colonization of land. Nat. Commun. 3, 1152. doi:10.1038/ncomms2148
Zhang, W., Wan, X., Hong, Y., Li, W., and Wang, X. (2010). “Plant phospholipase D,” in Lipid signaling in plants. Editor T. Munnik (Berlin: Springer), 39–62. doi:10.1007/978-3-642-03873-0_3
Keywords: bryophytes, gene structure, lineage-specific gene duplication, molecular evolution, three-dimensional structure
Citation: Zhao J, Pu X, Li W and Li M (2022) Characterization and evolutionary diversification of the phospholipase D gene family in mosses. Front. Genet. 13:1015393. doi: 10.3389/fgene.2022.1015393
Received: 09 August 2022; Accepted: 30 September 2022;
Published: 13 October 2022.
Edited by:
Ana Luisa Garcia-Oliveira, The International Maize and Wheat Improvement Center (CIMMYT), KenyaReviewed by:
Xi Zhang, Dalhousie University, CanadaEvan Forsythe, Colorado State University, United States
Hakim Manghwar, Lushan Botanical Garden (CAS), China
Copyright © 2022 Zhao, Pu, Li and Li. This is an open-access article distributed under the terms of the Creative Commons Attribution License (CC BY). The use, distribution or reproduction in other forums is permitted, provided the original author(s) and the copyright owner(s) are credited and that the original publication in this journal is cited, in accordance with accepted academic practice. No use, distribution or reproduction is permitted which does not comply with these terms.
*Correspondence: Meng Li, bWVuZ2xpLmtpYkBnbWFpbC5jb20=