Abstract
Wheat is the most important source of food, feed, and nutrition for humans and livestock around the world. The expanding population has increasing demands for various wheat products with different quality attributes requiring the development of wheat cultivars that fulfills specific demands of end-users including millers and bakers in the international market. Therefore, wheat breeding programs continually strive to meet these quality standards by screening their improved breeding lines every year. However, the direct measurement of various end-use quality traits such as milling and baking qualities requires a large quantity of grain, traits-specific expensive instruments, time, and an expert workforce which limits the screening process. With the advancement of sequencing technologies, the study of the entire plant genome is possible, and genetic mapping techniques such as quantitative trait locus mapping and genome-wide association studies have enabled researchers to identify loci/genes associated with various end-use quality traits in wheat. Modern breeding techniques such as marker-assisted selection and genomic selection allow the utilization of these genomic resources for the prediction of quality attributes with high accuracy and efficiency which speeds up crop improvement and cultivar development endeavors. In addition, the candidate gene approach through functional as well as comparative genomics has facilitated the translation of the genomic information from several crop species including wild relatives to wheat. This review discusses the various end-use quality traits of wheat, their genetic control mechanisms, the use of genetics and genomics approaches for their improvement, and future challenges and opportunities for wheat breeding.
1 Introduction
Wheat is a major cereal crop due to its production and utilization throughout the world. Wheat has been the major source of energy (carbohydrate), protein, and dietary fiber for humankind (Ma et al., 2013). The wheat grain consists of 8%–20% protein and the carbohydrates make up 85% (w/w) of grain, most of which is starch (Anjum et al., 2007; Shewry and Hey, 2015; Nigro et al., 2019). Thus, the nutrition and food security of the world relies on the quantity and quality of wheat being produced worldwide. However, the demand for wheat consumption still surpasses its productivity and there is an urgent need to increase food production by nearly 60% to feed the ever-increasing human population that is predicted to reach 9 billion by 2050 (Zhang et al., 2014; Varshney et al., 2015). Nearly 821 million people, which accounts for one in nine people in the world, suffered from hunger in 2018 (WHO, 2018) further emphasizing the importance of wheat in alleviating hunger. Increased food production is also challenged by decreasing cropland area, finite resources, and the impacts of climate change on overall crop performance.
Wheat breeding programs throughout the world face a common challenge to maintain or improve agronomic performance while simultaneously improving quality traits to fulfill the needs of the diverse international market and end-users including growers, millers, bakers, and consumers (Gale, 2005; Huang et al., 2006; Echeverry-Solarte et al., 2015). To increase the grain yield, researchers have focused on various yield components (grain weight, grain length, spike length, kernel number/spike, spike number/unit area etc.), its correlated trait (plant height, chlorophyll content etc.) and resistance to biotic and abiotic stresses including heat tolerance, and resistance to rusts and Fusarium head blight (Zhang et al., 2009; Hanif, 2016; Sun et al., 2017; Kuzay, 2019; Pinto et al., 2019; Sapkota et al., 2019; Yang et al., 2019; Kumar et al., 2007; Ghimire et al., 2020; Liu et al., 2020; Pradhan et al., 2020; Zhang et al., 2020; Ghimire et al., 2022). Consequently, significant progress has been achieved in the past 50 years as wheat yield worldwide increased from 1.4 MT/ha in 1970 to 3.5 MT/ha in 2019 (FAO, 2021).
Overall improvement in the end-use quality of wheat is an inherently complex breeding objective since it is determined by the combination of many component quality traits that are underpinned by diverse metabolic pathways (Mann et al., 2009). Many of these are also correlated with each other which further adds the complexity (Prasad et al., 2003; Mann et al., 2009; Li J et al., 2012). Besides this, the selection of optimum quality trait(s) targeting one user group often comes as a tradeoff for others (Echeverry-Solarte et al., 2015). For example, in North America and Western Europe, bread is made from wheat varieties that produce strongly elastic dough with some extensibility. However, these varieties may not be suitable for making other wheat products such as cookies (biscuits) which are made from highly extensible dough (Payne, 1983). Similarly, chapatti and noodles consumed in South Asia are made from wheat varieties with intermediate properties between the two extremes and pizza and bagels are made from wheat with high gluten strength (Lindgren and Simsek, 2016). Therefore, wheat breeders have to make targets of developing wheat varieties with quality parameters that meet particular demands from millers and consumers (Prasad et al., 2003; Mann et al., 2009).
Through the 19th century, wheat quality essentially meant bread quality to people (Kiszonas and Morris, 2017). In the past few decades, people are more conscious of their dietary habits and have developed a preference for different wheat products with specific quality attributes (Peña, 2007). The development of such a wide range of products was possible due to the studies on the functional and molecular genetic basis of wheat quality particularly wheat protein and its subunits during the 20th century as summarized in several reviews (Payne et al., 1982; Payne, 1987; Weegels et al., 1996; Shewry et al., 1997). The wide range of wheat products creates a broad spectrum of performance specifications that are determined by different end-use quality traits, their genetic and environmental factors and their complex interactions. Improvement in end-use quality of wheat depends will depend on our understanding of all these components, therefore, further studies on the end-use quality of wheat are critical.
Since the turn of the 21st century, research has been carried out in diverse fields including QTL mapping, association mapping and marker-assisted selection (Patil et al., 2009; Reif et al., 2011). There is also diversity in the traits being studied such as starch, grain hardness, flour color, milling and baking quality that has helped to discover many attributes that define the quality of wheat (Zanetti et al., 2001; Sourdille et al., 2003; Kuchel et al., 2006; McCartney et al., 2006). Based on the results of these studies, a few reviews were published that summarized the QTLs/genes and their diagnostic markers to be used for marker-assisted breeding of wheat end-use quality (Gale, 2005; Liu et al., 2012). More recently, studies on genomic selection and translational genomics for end-use quality traits are being carried out which still warrants exhaustive efforts across wheat breeding programs to achieve satisfactory results as is the case for grain yield or disease resistance (Kristensen et al., 2019; Nigro et al., 2019; Aoun et al., 2021). There are limited reviews that capture these modern genetic and genomic studies on diverse end-use quality traits. This review summarizes the key genetic and genomic findings made using different genomic tools on various important end-use quality traits and also points out the current challenges and future opportunities for such studies in wheat.
2 Wheat classes and their end-use products
Wheat grown throughout the US are classified into five different classes based on the grain color (red and white wheat), texture (hard and soft wheat), and growth habit (winter and spring wheat) (Clark and Bayles, 1935; https://www.uswheat.org/) thus, categorizing them as hard red winter wheat (HRWW), hard red spring wheat (HRSW), soft red winter wheat (SRWW), soft white wheat (SWW), and hard white wheat (HWW). These classes of wheat also differ based on the products that can be made from them (Clark and Bayles, 1935). For instance, HRWW is suitable for making flat bread, hard rolls, hearth bread, croissants, and all-purpose flour because of its excellent milling and baking characteristics (Chang and Chambers Iv, 1992; https://www.uswheat.org/). The HRSW with high protein content is also referred to as “aristocrat of wheat” for designing wheat products like rolls, bagels, croissants, hearth bread, and pizza crust. SRWW with low protein content is used for making cookies, cakes, crackers, pretzels, and pastries (Faridi et al., 1994). Similarly, SWW also has low protein content and is used for making the best quality pastry, cakes, and other confectionary products. HWW is used for making Asian noodles, pan, and flatbreads (Chang and Chambers Iv, 1992). Durum wheat is the hardest of all kinds of wheat with high protein content and is used for making pasta and couscous (Dick and Youngs, 1988).
3 Major end-use quality traits
There are multiple complex traits to consider for defining the quality of wheat importance to wheat producers, end-users, and breeders (McCartney et al., 2006). These include traits related to grain characteristics (protein content, color, weight, grain hardness/texture), milling properties (flour yield, protein content, moisture content, ash content), flour and dough properties (starch content, falling number, gluten characteristics, dough rheology) and baking qualities (loaf height, volume and texture, elongation, mixing time, cookie diameter, baking score) (Mohler et al., 2014; Guzmán and Alvarez, 2016; Hayes et al., 2017; Naraghi et al., 2019). Above all, grain protein content (GPC) has been a focus for both plant breeders and end-users since it directly affects nutritional value, and dough rheological and baking properties (Joppa et al., 1997; Alamri et al., 2009; Brevis et al., 2010). GPC is a critical marketing characteristic and it influences the quality performance of wheat end products in general, including pasta and bread (Mesfin et al., 1999; Distelfeld et al., 2006; Brevis et al., 2010; Naraghi et al., 2019) and it is used as one of the parameters for wheat classification (Tu and Li, 2020). The price of wheat is also determined based on the GPC where wheat with higher GPC is valued more than lower GPC (Farquharson, 2006). Wheat GPC should usually be above 12.5% to be used in bread making (Turner et al., 2004).
Wheat endosperm harbors the majority of the grain content (Osborne, 1907). Gluten protein is a rubbery mass left behind when the starch granules and water-soluble constituents of wheat dough are removed (Wieser, 2007). The quality and quantity of gluten protein is an important trait to be considered for wheat breeding since it determines the baking quality of wheat dough by conferring its viscosity, cohesivity, elasticity, and water absorption capacity (Wieser, 2007). As the protein quality increases, the dough strength, firmness, and stability and cooked weight also increase (Payne, 1987; Dick and Youngs, 1988). Wheat gluten has high glutamine and proline amino acid content (Wieser, 2007). Based on the molecular size in dissociating solvents, wheat endosperm gluten can be categorized into two storage proteins, gliadin and glutenin (Huebner, 1970). The gliadins are small with no disulfide-bonded subunit structure and are soluble in aqueous alcohol, whereas, the glutenins are large, heterogeneous molecules connected by disulfide bonds that are insoluble in aqueous alcohol (Osborne, 1907; Wall, 1979; D’Ovidio and Masci 2004; Kumar et al., 2013). Based on gel electrophoresis, the glutenin subunits can be further divided into predominant low-molecular-weight glutenin subunits (LMW-GS) and high-molecular-weight glutenin subunits (HMW-GS), whereas, gliadin can be separated into four groups (α, β, γ, and ω) (Wall, 1979; D’Ovidio and Masci, 2004). Hydrated glutenin is cohesive and elastic which provides strength and elasticity to dough, whereas, hydrated gliadin is less elastic and cohesive than glutenin and provides dough viscosity and extensibility (Payne et al., 1984; Wieser, 2007; Kumar et al., 2013). Wieser (2007) defines gliadins as a “plasticizer or solvent for glutenins.” Gluten strength can be measured by the Sodium dodecyl sulfate (SDS)-microsedimentation test or sedimentation volume (Kumar et al., 2013).
Grain hardness or texture is a fundamental basis for differentiating wheat market class and trade worldwide (Guzmán and Alvarez 2016). The durum wheat grains are classified as very hard and used for making pasta and couscous whereas the common wheat grains are classified as hard and soft and used for making bread, cakes, noodles, and cookies (Giroux and Morris 1997; Bushuk, 1998). Grain hardness also has a profound effect on the milling, baking, and end-use qualities of wheat (Giroux and Morris 1997). The most common methods for grain texture measurement are Particle Size Index (PSI), Near-Infrared Reflectance (NIR), and the Single Kernel Characterization System (SKCS) (Morris, 2002). The hardness or texture of wheat grains is molecularly determined by two puroindoline proteins, Pina and Pinb, where the grain texture is considered soft when both proteins are functional. However, when one is absent or mutated, the texture is hard, and when both proteins are absent as in the case of durum wheat, the texture is very hard (Morris, 2002).
Starch content and its pasting property also significantly influence wheat end-use products. Starch comprises about 70% of the endosperm dry weight, and it affects grain weight and quality as well as the capacity of plant sink tissues to accept and convert photoassimilates (Dale and Housley, 1986; Kumar et al., 2018; Zi et al., 2018). The starch pasting property has been found to affect the texture and quality of end-use products (Blazek and Copeland 2008). The reserved starch in the plant is comprised mainly of two macromolecules, amylose (22%–35%) and amylopectin (68%–75%) (Nakamura et al., 1995). Amylose in wheat grain is synthesized by granule-bound starch synthase (GBSSI), or waxy protein (Guzmán et al., 2012a). Wheat with reduced amylose is referred to as “partial waxy,” and wheat with no amylose is referred to as “waxy” (Graybosch, 1998). Absence of amylose, i.e., 100% amylopectin, in waxy wheat grains is supposed to help reduce the staling of flour products, especially bread, and keep baked goods fresh for longer periods (Zi et al., 2018). However, waxy wheat lines have reduced grain yield and increased amylose content has also been associated with nutritional and physiological effects (Nakamura et al., 1995; Blazek and Copeland, 2008; Zi et al., 2018). Partial waxy wheat is considered useful for producing high quality thick white noodles such as udon noodle used in Japanese cuisine (Zhang et al., 2022). Non-waxy and waxy starches can be differentiated by staining with iodine, where non-waxy starch stains blue-black and waxy starch stains red-brown (Nakamura et al., 1995). The relative amounts of amylose and amylopectin determine the physical and chemical properties of starch, such as pasting, gelation, and gelatinization, which determine the quality of end-product (Fredriksson et al., 1998; Guzmán and Alvarez 2016). There are various methods for measuring starch, amylose, and amylopectin, including the dual wavelength iodine binding method, differential scanning calorimetry (DSC), and high-performance size-exclusion chromatography (HPSEC) (Zhu et al., 2008).
The end-use quality of wheat is also determined by dough rheological properties and falling numbers. The rheological properties of wheat are estimated by water absorption, dough development time, dough stability, maximum dough resistance, dough extensibility, and flour paste viscosity (Guo J. et al., 2020). Dough rheology can be measured by using farinograph, extensograph, and alveograph instruments (AbuHammad et al., 2012). These dough rheological properties along with other traits such as flour protein content (FPC), particle size, loaf volume, and crumb score can be used for estimating the baking quality of wheat (Kuchel et al., 2006). During germination, starch in the wheat grain needs to be converted to simple sugars to feed the embryo. Alpha-amylase is one of the primary enzymes responsible for the starch degradation causing sprouting of the grain (Newberry et al., 2018). Such alpha-amylase activity is only desirable if the grain has been planted (Thomason et al., 2019). However, some wheat genotypes are characterized by an excessive level of alpha-amylase from the grain development stage to harvest causing pre-harvest sprouting (PHS). PHS results in lower yield and affects the end-use quality of wheat such as dough softening, sticky bread crumb, and problems while slicing bread (Mohler et al., 2014; Newberry et al., 2018). The falling number determines the effect of alpha-amylase activity on damaging starch by examining the starch pasting property (Mohler et al., 2014). Increased level of the alpha-amylase reduces the value of falling number (Thomason et al., 2019).
4 Breeding methods for end-use quality traits of wheat
4.1 Direct phenotypic selection
To select individual plants with superior quality traits, wheat breeders used to grow multiple individuals/lines in different environments, harvest grain, process it, and evaluate it for different milling and baking quality parameters. All these wheat qualities had to be evaluated precisely using appropriate instruments under lab conditions which makes this procedure challenging because it is expensive, time-consuming, labor-intensive, and typically requires large seed samples (Blanco et al., 1996; Prasad et al., 2003; Naraghi et al., 2019; Yang et al., 2020). Analyses requires time, which often leads to increase in 1 year for the breeding program or passing wheat lines with undesirable quality alleles into the next growing season (Sandhu et al., 2021). Moreover, if these evaluations are carried out later in the breeding program, the developed wheat lines could end up with poor end-use quality and be discarded leading to waste of resources as the primary focus was centered on improving other traits such as grain yield and disease resistance (Naraghi et al., 2019). Therefore the direct selection method for end-use qualities of wheat has been more complicated for wheat breeders (Yang et al., 2020). Traits like GPC and FPC are also influenced by the genotype by environment (G×E) interaction leading to low heritability (Blanco et al., 1996; Groos et al., 2003; Prasad et al., 2003). As a result, accurate assessment of these traits in the breeding programs is quite challenging which makes the selection process even more complicated.
4.2 Modern approaches: Genomics-assisted breeding (GAB) and translational genomics
Genome-based technologies are an important means of breeding for improved wheat quality (Kiszonas and Morris, 2017). The advancement in sequencing technologies and their utilization for genomic research brought increased precision and efficiency to crop breeding (Varshney et al., 2005; Varshney et al., 2015). Various kinds of molecular markers such as restriction fragment length polymorphism (RFLP), simple sequence repeats (SSR), and single nucleotide polymorphism (SNP) are being used for genetic mapping to identify quantitative trait loci (QTL) and functional markers related to the genes of interest (Figure 1; Table 1) (Groos et al., 2003; Prasad et al., 2003; Rimbert et al., 2018). These markers can be exploited for marker-assisted selection (MAS) and genomic selection (GS) which allow screening for superior end-use quality traits earlier in the breeding program (Figure 1; Tables 2, 3) (Naraghi et al., 2019). These approaches are convenient and faster than the traditional selection method. This allowed the transition from solely phenotype-based traditional selection to a genotype-linked phenotype-assisted selection of superior lines for different plant species (D’hoop et al., 2014; dos Santos et al., 2016; Proietti et al., 2018; Bhattarai and Subudhi, 2019). However, given the complex inheritence nature of these quantitative traits and the significant effects of the environment and the G×E interaction for these traits, phenotypic selection is still required to confirm the efficacity of modern methods including MAS and GS.
FIGURE 1
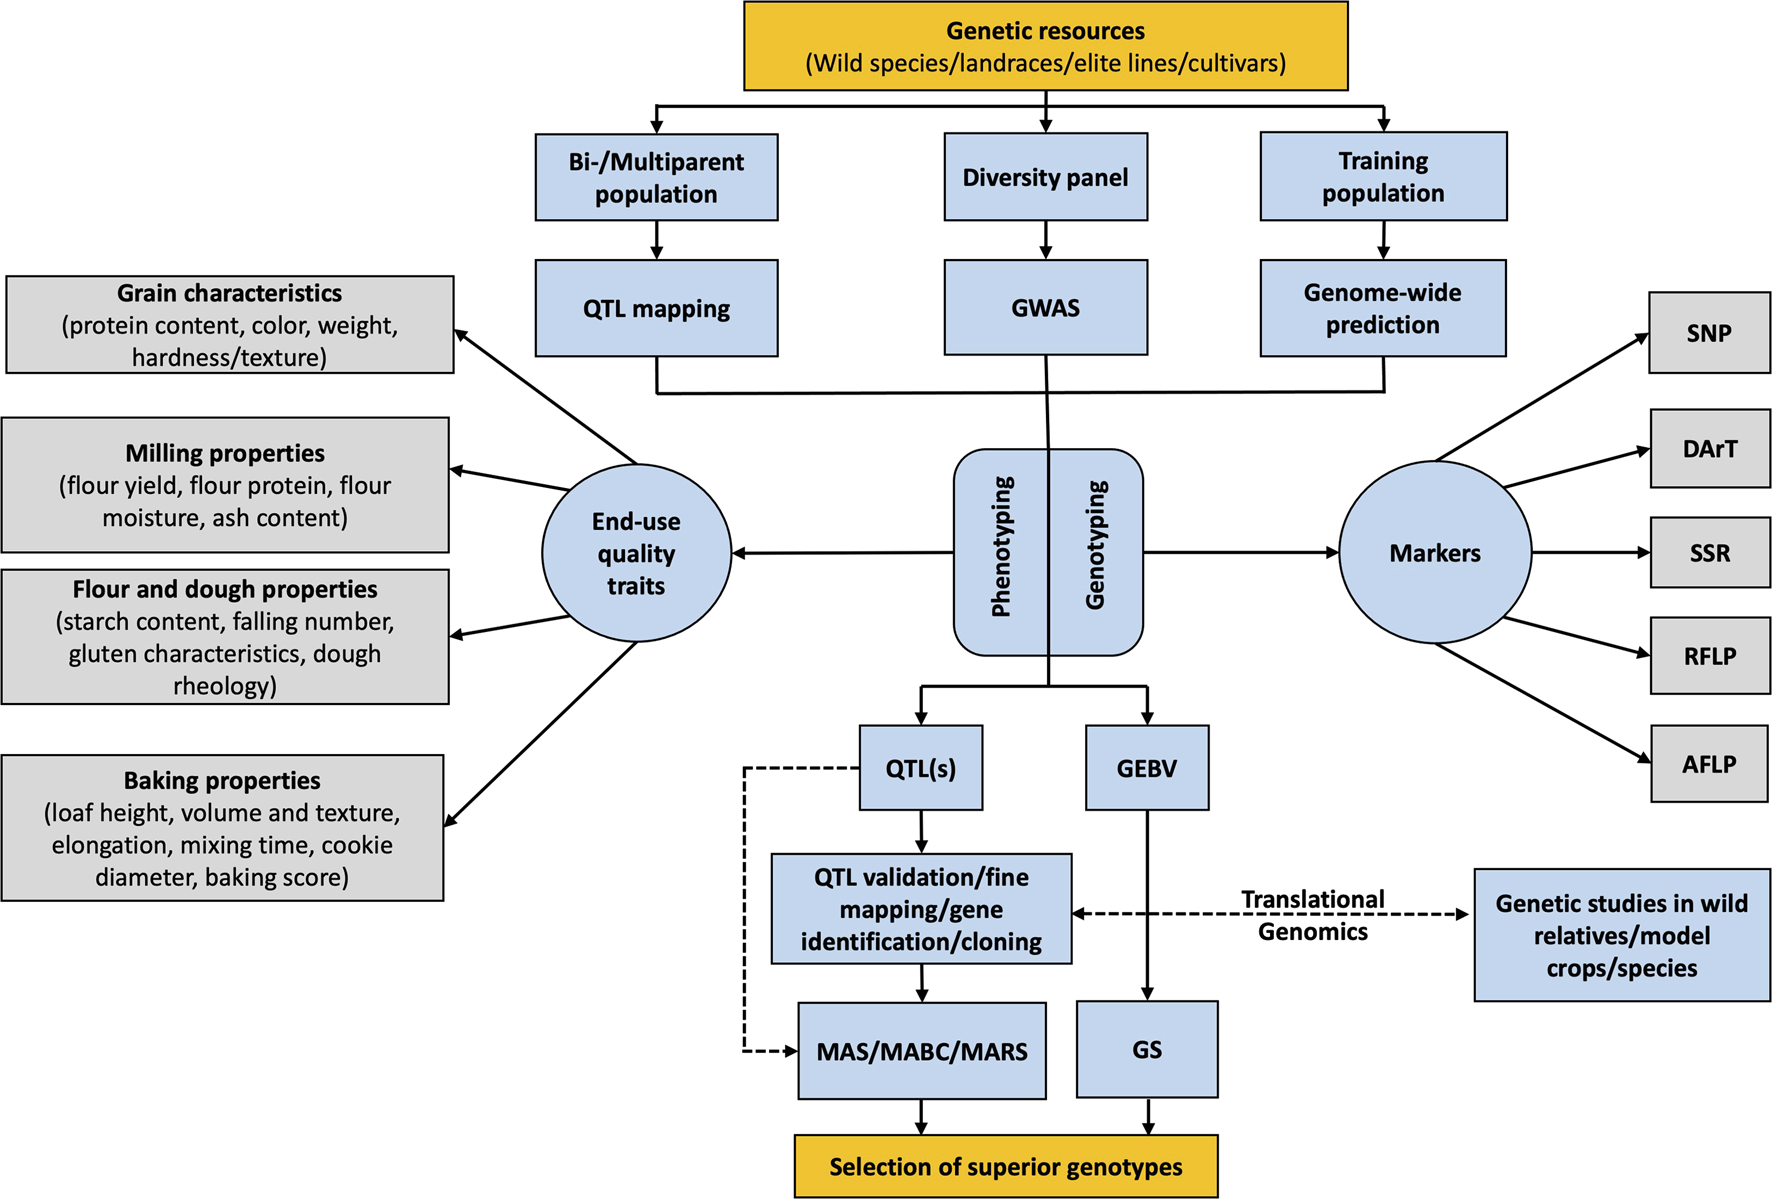
Schematic flow diagram showing the use of genomics-assisted breeding and translational genomics for improvement of end-use quality traits in wheat breeding program.
TABLE 1
| Model species | Population typea | Mapping population | End-use quality traitsb | Marker typec | Number of QTLs identified | Genome location | Phenotypic variance explained | References |
|---|---|---|---|---|---|---|---|---|
| Durum wheat | RIL | Messapia (cultivar of T. turgidum L. subsp. Durum) × MG4343 (wild accession of T. turgidum L var dicoccoides) | GPC | RFLP | 6 | 4BS, 5AL, 6AS, 6BS, and 7BS | 6.0%–23.5% individually | Blanco et al. (1996) |
| Durum wheat | RICL | LDN (DIC-6B) × LDN durum | GPC | RLFP | 1 | 6BS | 66% | Joppa et al. (1997) |
| Durum wheat | RIL | Messapia (cultivar of T. turgidum L. subsp. Durum) × MG4343 (wild accession of T. turgidum L var dicoccoides) | SV | RFLP | 7 | 1AL, 1B, 3AS, 3BL, 5AL, 6AL, 7BS | 36%–64% collectively | Blanco et al. (1998) |
| Common wheat | RIL | Glupro × Keene, Glupro × Bergen, ND683 × Bergen | GPC | RFLP | 1 | 6BS, 6BL | 12.4%–34.6% across three populations | Mesfin et al. (1999) |
| Common wheat and spelt | RIL | T. aestivum L variety “Forno” × T. spelta L variety ‘Oberkulmer | FPC, SV, dough properties, GH, TKW | RFLP | FPC: 9; SV: 9; dough properties: 10; GH: 10; TKW:8 | FPC: 3B, 4A, 5B, 6B, 7A, 7B, 7D; SV: 1B, 1D, 2A, 3A, 5A, 5B, 5D; dough properties: 1A, 1B, 2A, 2B, 2D, 3A, 3B, 3DL, 4A, 4D, 5A, 5D,7A, 7B, 7D; GH: 2A, 3B, 4A, 4D, 5A, 6B, 7A,7B, 7D; TKW: 1B, 2B, 3B, 5A, 5B, 7B | Protein: 51%; SV: 47%; GH: 54%; TKW: 54%; and dough properties: 39% collectively | Zanetti et al. (2001) |
| Common wheat | RIL | Renan (variety) × Recital (variety) | GPC, TKW | SSR, RFLP, AFLP | GPC: 10; TKW: 9 | GPC:1A, 2A, 3A, 3B,4A, 4D, 5B, 6A, 7A, 7D; TKW: 1D, 2B, 2D, 3A, 5B, 6A, 6D, 7A, 7D | GPC: 4.2%–10.4%; TKW: 4.7%–19.7% individually | Groos et al. (2003) |
| Common wheat | DH | Courtot (cultivar) × Chinese spring (cultivar) | Protein content GH, Dough strength | SSR, AFLP | Protein content: 2; GH: 3; dough strength: 3 | Protein content: 1BL, 6AS; GH: 1AL, 5DS, 6AL; dough strength: 1AL, 3BL, 5DS | Protein content: 6.5%–17.1%; GH: 3.1%–66.9%; dough strength: 9.4%–19.5% individually | Sourdille et al. (2003) |
| Common wheat | RIL, NIL | RIL: WL711 × PH132 NIL: WL711 × PH132, WL711 × PH133, HD2329 × PH132 | GPC | SSR | 13 | 2A, 2B, 2D, 3D, 4A, 6B, 7A, 7D | 2.95%–32.44% individually | Prasad et al. (2003) |
| Common wheat | DH | Trident (cultivar) × Molineux (cultivar) | FPC, Flour color, Flour brightness, dough properties, baking quality | SSR, STS | FPC: 5; flour brightness: 2; flour color: 3; dough properties: 18; baking quality: 4 | FPC: 1B, 6A, 6D, 7A, 7D; flour brightness: 1A, 7B; flour color: 1A, 7B; dough properties: 1A, 1B, 2A, 2B, 2D, 3D, 7A, 7D; baking quality: 2A, 3A | FPC: 6%–13%; flour brightness: 10%–22%; flour color: 6%–77%, dough properties:5%–20%, baking quality:5%–13% individually | Kuchel et al. (2006) |
| Common wheat | DH | AC karma (variety) × 87E03-S2B1 (breeding line) | GPC, FPC, MG, SV, TKW | SSR | GPC: 2; FPC: 3; MG: 18; SV: 3; TKW: 6 | GPC: 4D, 7B; FPC: 2D,4D,7B; MG: 1B,1D,3B,4D,5D; SV: 1B,2D,5D; TKW: 2B, 2D, 3B, 4B, 4D, 6A | GPC: 12.6%–32.7%; FPC: 6.6%–28.6%; MG: 6%–55.9%; SV: 8.8%–14.9%; TKW: 3.7%–26.3% individually | Huang et al. (2006) |
| Common wheat | DH | RL4452 × AC Domain | 47 traits including Milling (GPC, FPC, PSI, FY), MG, FG, baking, starch properties, noodle color, and others | SSR | Milling: 12; MG: 24; FG: 9; baking: 14; starch properties: 19; noodle color: 11; others: 10 | 1A, 1B, 1D,2A, 2B, 3A, 3B, 3D, 4A, 4B, 4D, 5B, 5D, 6A, 6B, 7A, 7B, 7D for all traits combined | GPC: 6.2–29.8; FPC: 6.1%–28.7%; FY: 7.9%–11.9%; PSI:28.2%; MG: 4.4%–42%; FG: 4.6%–35.4%; baking: 7.9%–24.8%; starch properties: 4.1%–54.4%; noodle color: 7.7%–36% individually | McCartney et al. (2006) |
| Durum wheat | RIL | PDW 233 × Bhalegaon 4 (Landrace) | SV, GPC, MG | SSR, ISSR, SCAR, TRAP | 26 main effect QTLs in total from 3 environments | SV: 1B; GPC: 7B; MG: 1A, 1B, 2B, 4B, 7A, 7B | SV: 6.7%–40.66%; GPC: 9.64%; MG: 6.75%–21.32% individually | Patil et al. (2009) |
| Common wheat | DH | Kurki (cultivar) × Janz (cultivar) | GPC, sponge and dough baking performance, GH | SSR | - | GPC: 1B, 3A, 5A, 5B, 7A; sponge and dough making: 1B,1D,3A, 4D, 5B, 5D, 7A, 7B; GH: 1A, 4D, 5D | - | Mann et al. (2009) |
| Durum wheat | DH | Rugby (cultivar) × Maier (cultivar) | Gluten strength | DArT, STS, EST-SSR | 3 | major QTL in 1BS | 90% by single major QTL | Kumar et al. (2013) |
| Common wheat | RIL | WCB414 (elite line) × WCB617(exotic line) | TKW, KVW, GPC, FE, MG | DArT | TKW: 11; KVW: 10; GPC: 11; FE: 6, MG: 31 | TKW: 2A, 2B, 2D, 3A, 3B, 4A, 5A, 6B; KVW: 1A, 1B, 2A, 4B, 5B, 6A, 6B, 7B; FE: 1A, 1B, 2B, 3D, 4A, 6A; GPC: 1A, 1B, 2B, 2D, 3D, 4B, 5B, 6B, 7B; MG: 2B, 3A, 6A, 6B, 7A, 7B, 7D | TKW: 6.2%–17.1%; KVW: 6.7%–22.5%; FE: 4.9–19; GPC: 4.7–16.9; MG: 5.3–19.9 individually | Echeverry-Solarte et al. (2015) |
| Common wheat | DH | Yumechikara (HRWW variety) × Kitahonami (SRWW variety) | GPC, FPC | SSR | 1 | 2B | GPC: 32%; FPC: 16.5% | Terasawa et al. (2016) |
| Common wheat | RIL | Shannong01-35 (variety) × Gaocheng9411 (variety) | Pasting property | SNP, DArT, SSR | 43 QTLs from 3 environments | 1A, 1B, 2B, 2D, 3A, 4A, 4B, 5B, 6A, 6B, 7A | .11%–37.68% individually | Wang et al. (2017) |
| Common wheat | RIL | Glenn × Traverse (both hard red spring wheat cultivars) | GPC, FE and MG, Baking properties | SNP | GPC: additive QTL-11, digenic epistatic QTL-18; FE and MG: additive-32, digenic epistatic-51; baking properties: additive QTL-31, digenic epistatic-15 | GPC (additive QTL): 1A, 1B, 2A, 2B, 3A, 3B, 4B, 5B, 7A; FE and MG (additive QTL): 1D, 2B, 3D, 5A, 6A, 6D; baking properties (additive QTL): all chromosomes except 1A, 2B, 3D, 6A | GPC: 6.5%–20%; FE and MG: 1%–24%, and baking properties: 2%–28% individually for additive QTLs | Naraghi et al. (2019) |
| Durum wheat | Diversity panel | 7 T. turgidum subspecies: durum, durum var ethiopicum, turanicum, polonicum, turgidum, carthlicum, dicoccum, and dicoccoides | GPC | SNP | 11 stable QTLs in at least 3 environments out of 7 tested environments | 2BS, 3AL, 3BL,4AS, 4BL, 5AS, 5BL, 6BL, 7AS, 7BL | 5.1%–8.7% individually across all environments | Nigro et al. (2019) |
| Common wheat | RIL | ND 705 (elite line) × PI 414566 (exotic line) | GPC, KH, FE | SNP | GPC: 14; KH: 7; FE: 11 | GPC: 1A, 1B, 2A, 4B, 4D, 5A, 5B, 6D, 7A, 7B, 7D; KH: 1A, 1B, 4B, 5A, 7A; FE: 1A, 2A, 3A, 3B, 4D, 5A, 5B, 5D, 7D | GPC: 5.6%–24.9%; KH: 7.4%–21.3%; FE: 6.3%–12.6% individually | Kumar A et al. (2019) |
| Common wheat | Diversity panel | SRWW | FY, FPC, GH, FPC, SRC | SN | FY: 3; FPC: 5; SE: 2; SRC: 8 | FY: 1B, 2A, 2B; FPC: 5A, 6A, 7A; GH: 4A, 4B; SRC: 1A, 1B, 3A, 4B, 5B, 7D | 3.4%–6.0% individually | Gaire et al. (2019) |
| Common wheat | Diversity panel | Winter wheat | Grain quality traits (GPC, test weight, WGC, SV, FY, TSC), dough rheological properties (DDT, DS and DWA) | SNP | Grain quality traits: 246 QTNs; Dough rheological properties: 86 | 40 stable QTNs found in 1A, AD, 1D, 2A, 2B, 2D, 3A, 3B, 3D, 4B, 4D, 5A, 5D, 6A, 6B, 6D, 7A, 7B, 7D | 40 stable QTNs explained 4.38%–18.6% individually | Yang et al. (2020) |
| Common wheat | DH | Two DH populations, Yecora Rojo × Ksu106 and Klasic × Ksu105 | FG, MG traits | SNP | Total 176 additive QTLs for FG and MG traits in two populations combined | QTLs found in almost all 21 chromosomes in both populations | 103 QTLs with PV ≥ 10% individually in all traits combining two populations | Barakat et al. (2020a) |
| Common wheat | DH | Two DH populations, Yecora Rojo × Ksu106 (YK) and Klasic × Ksu105(KK) | 8 traits including FPC, gluten index, FN, AC, test weight, FM | SNP | Total 127 additive QTLs for all traits in two populations combined | QTLs found in almost all 21 chromosomes in both populations | 72 QTLs with PV ≥ 10% individually in all traits combining two populations | Barakat et al. (2020b) |
| Common wheat | RIL | Tainong 18 (cultivar)× Linmai 6 (elite line) | GPC, SV, FG, FN, Starch pasting properties | SNP, DArT, SSR, EST-SSR | GPC: 10; SV: 11; FG: 17, FN: 4; starch pasting: 64 | Protein: 1B,3B, 4A, 4B, 4D, 6A; SV: 1A, 1D, 4B, 5B, 5D, 6A, 6D | Protein: 7%–15.5%; SV: 5.3%–18.73%; FG: 5.6%–35%; FN: 8.4–10.7: starch pasting: 6.3%–17.9% individually | Guo et al. (2020a) |
| Common wheat | Diversity panel | SWW breeding lines and DH | 14 traits categorized as grain characteristics, milling traits, flour characteristics and baking quality | SNP | Total 178 MTA including 12 large effect MTA | Large effect QTLs for Grain characteristics: 1B, 2B, 4B, 5A, and 6B; Milling traits: 1B, 1D, 5A, and 6B; Flour characteristics: 1B, 1D and 4A | - | Aoun et al. (2021) |
Summary of representative QTL identification studies for end-use quality traits in wheat. Phenotypic variance is indicated collectively for all the QTLs or individually for each QTL.
RIL, recombinant inbred line; RICL, recombinant inbred chromosome line; NIL, near-isogenic lines; DH, doubled haploid.
GPC, grain protein content; FPC, flour protein content; SV, sedimentation volume; MG, mixograph; FG, farinograph; FN, falling number; GH, grain hardness; PSI, particle size index; FY, flour yield; FE, flour extraction; AC, ash content; FM, flour moisture; TKW, thousand kernel weight; KVW, kernel volume weight; SRC, solvent retention capacity; WGC, wet gluten content; TSC, total starch content; DDT, dough development time; DS, dough stability; DWA, dough water absorption.
RFLP, restriction fragment length polymorphism; SSR, simple sequence repeat; AFLP, amplified fragment length polymorphism; STS, sequence-tagged site; ISSR, inter simple sequence repeat; SCAR, sequence characterized amplified region; TRAP, target region amplified polymorphism; DArT, diversity array technology; SNP, single nucleotide polymorphism; EST-SSR, expressed sequence tag-derived simple sequence repeat.
TABLE 2
An overview of markers used for marker-assisted selection (MAS) of end-use quality traits in wheat.
GPC, grain protein content; HMW-GS, high molecular weight-glutenin subunit; LMW-GS, low molecular weight-glutenin subunit.
STS, sequence-tagged site; CAPS, cleaved amplified polymorphic sequences; AS-PCR, allele specific-polymerase chain reaction; RFLP, restriction fragment length polymorphism; SSR, simple sequence repeat; KASP, kompetitive allele specific PCR.
TABLE 3
| End-use quality traitsa | Germplasmb | Markerc | Model(s) usedd | Accuracy | References |
|---|---|---|---|---|---|
| FY, softness, gluten strength, water absorption, FPC, starch properties | Two DH biparental population of SWW of 209 and 174 individuals | DArT, AFLP, RFLP, SSR, STS | Multiple linear regression, Ridge regression, Bayes-C∏ | .42–.66 | Heffner et al. (2011) |
| GPC, FPC, test weight, TKW, grain hardness, FY, dough rheology, loaf volume, gluten strength | 5,520 advanced lines of common wheat | SNP | PLSR, elastic net, Random Forest | .32–.62 | Battenfield et al. (2016) |
| 19 traits total including grain characteristics, milling traits, dough rheology, noodle traits, baking traits | 2076 common wheat accessions | SNP | NA | >.5 for many traits | Hayes et al. (2017) |
| Protein content, dough rheology, baking quality | 840 winter wheat lines including inbreds and DHs | DArT | RR-BLUP, W-BLUP | .38–.63 | Michel et al. (2018) |
| Protein content | Two durum wheat panels of 189 and 159 genotypes consisting of varieties and breeding lines | DArT, SNP | RR-BLUP | .40–.46 | Rapp et al. (2018) |
| GPC, alveograph measurements | Durum wheat panel consisting of 170 varieties and advanced breeding lines, and 154 DHs | SNP | Single trait models: RR-BLUP, G-BLUP, Bayes A, Bayes B, Bayesian LASSO, RKHS, Multi-trait models: MT-Bayes A, MT-Matrix, MT-SI | .5–.8 for single trait models | Haile et al. (2018) |
| FY, alveograph measurements | 635 winter wheat breeding lines | SNP | G-BLUP, Bayesian Power Lasso | .50–.79 | Kristensen et al. (2019) |
| 14 traits including grain characteristics, milling traits, flour parameters, and baking traits | SWW panel of 666 lines consisting of inbreds, advanced breeding lines, and DHs | SNP | RR-BLUP, Bayes A, Bayes B, Bayes Lasso, Bayes C, Random Forest, SVM, MLP, CNN | average .58–.63 for all traits and models | Sandhu et al. (2021) |
| GPC, FPC, FY, dough rheology, bake absorption, bake mixing time, loaf volume, baking score | 462 advanced breeding lines of winter wheat | SNP | G-BLUP | .25–.55 | Zhang-Biehn et al. (2021) |
| 14 traits including grain characteristics, milling traits, flour parameters, and baking traits | SWW panel of 672 lines consisting of breeding lines, cultivars, and DHs | SNP | G-BLUP | ∼.35–.65 | Aoun et al. (2021) |
Summary of few representative genome-based prediction studies for end-use quality traits in wheat.
GPC, grain protein content; FPC, flour protein content; FY, flour yield; FPC, flour protein content; TKW, thousand kernel weight.
DHs, double haploids; SWW, soft white wheat.
SNP, single nucleotide polymorphism; STS, sequence-tagged site; DArT, diversity array technology; RFLP, restriction fragment length polymorphism; AFLP, amplified fragment length polymorphism.
PLSR, partial least squares regression; SVM, support vector machine; MLP, multilayer perceptron; CNN, convolutional neural network; G-BLUP, genomic best linear unbiased prediction model; W-BLUP, weighted genomic best linear unbiased prediction; RR-BLUP, ridge regression best linear unbiased prediction.
The availability of plant genome sequence helps in the identification of candidate genes that are linked to available markers. However, initial sequencing was expensive and conducted by fewer labs which resulted in sequenced genomes of only a few model plant species including Arabidopsis (The Arabidopsis Genome Initiative, 2000), rice (International Rice Genome Sequencing Project and Sasaki, 2005), and maize (Schnable et al., 2009). Therefore, a lot of earlier genomic studies were conducted in these model plants and their findings were eventually transferred to other crop species which is now referred as the translational genomics apporach (Varshney et al., 2015). Rice was the first plant species to be used as a model cereal crop due to its small genome size and the availability of a well-mapped and characterized genome compared to other cereals like maize and wheat (Eckardt, 2000). With the revolutionization in next-generation sequencing (NGS) technologies such as Illumina and Nanopore sequencing, genome sequencing is much more accessible and affordable than ever before. Currrently, it is possible to genotype 10,000 lines at the same cost associated to phenotyping 1,000 wheat lines for end-use quality traits (Battenfield et al., 2016). Various molecular breeding tools including, but not limited to, biparental linkage mapping, genome-wide association studies (GWAS), MAS, and GS have been developed and are being extensively utilized for identifying functional loci/genes and for predicting the genomic/breeding value of individuals (Figure 1). This genomic information is then utilized for crop improvement and is referred to as genomics-assisted breeding (GAB). The molecular breeding tools used in GAB for wheat quality are discussed later in this chapter.
GAB facilitates the generation of an integrated database of genetic and genomic resources of many crops that can be used for translational genomics (Varshney et al., 2015). Translational genomics utilizes the scope of comparative, functional, and evolutionary genomics for finding relevant information from model species (Kang et al., 2016). Candidate gene approach (CGA) is one of the important tools of translational genomics. CGA assumes that genes within the model and target species could govern similar functions or influence the same trait (Salentijn et al., 2007). These genes could be either functional candidate genes with an identified or predicted function or positional candidate genes that are co-localized with a trait locus (Pflieger et al., 2001). As an example, the flowering time trait of many angiosperm species is functionally related to Flowering Locus T (FT) gene homologs (Pin and Nilsson, 2012; Subedi et al., 2021) and can be utilized for the study of the trait in any other flowering species. Positional candidate genes used for CGA can be genes identified through QTL mapping, marker-trait association, or syntenic regions between different genomes (Salentijn et al., 2007). Once the candidate gene has been identified, it can be translated to the target crop and validated through reverse genetic approaches (Figure 1).
There are several ways for validating orthologous genes in the target crop including the Targeting induced Local Lesion in genomes (TILLING) (Chen et al., 2012) and Clustered Regularly Interspaced Short Palindromic Repeats (CRISPR) (Liang et al., 2017). TILLING by sequencing (TbyS) was successfully carried out for translation of genes in Mung bean from medicago, cowpea, and soybean (Tsai et al., 2011). CRISPR gene editing techniques have become extremely popular and are widely used in various crop species. There are many reviews available on the use of CRISPR gene editing technique for crop improvement (e.g., Bortesi and Fischer, 2015; Song et al., 2016; Arora and Narula, 2017). One of the concerns related to CRISPR technology is the presence of transgene after editing and the possibility of off-target mutations which can face regulatory restrictions (Liang et al., 2017). However, methods have been developed and deployed in wheat to create mutants with no detectable transgenes (Liang et al., 2017). This eliminates the need for laborious and time-consuming backcrossing steps to segregate away the CRISPR/Cas9 cassette. Therefore, researchers can select the validation methods according to their interest and resource availability. To complement the validation step of translational genomics, fine-mapping can be done in a population segregating for the trait and associating polymorphism within the candidate gene to the phenotypic variation (Salentijn et al., 2007). Since plant genome sequencing has become fairly routine, the goal now is to sequence every crop species and apply GAB techniques for crop improvement. In this context, there are a plethora of genomic resources from many different crops that can be utilized for translational genomics.
5 Genetic and genomic studies on wheat end-use quality traits: An overview
Genetic studies of quality traits are complex due to the polygenic nature of the traits and high G×E interaction (Zanetti et al., 2001; Prasad et al., 2003; Huang et al., 2006). In addition, due to the polyploidy nature of common wheat, recessive mutation phenotypic effects are masked by the effective homoeoloci of other genomes creating an extra challenge in intrachromosomal mapping (Kuspira and Unrau, 1957; Chao et al., 1989). As a result, researchers have focused on increasing marker density to correctly identify loci associated with a certain phenotype. The use of molecular markers for the assessment of quality traits has been of interest since the late 1990s (Galande et al., 2001). Researchers are also selecting genotyping methods that allow better genome coverage and can identify a higher number of genetic variations.
Initial research for end-use quality traits was often carried out using RFLP markers that are unlimited in number, generally codominant, and able to recognize individual loci, thus being effective for the hexaploid genome of common wheat (Chao et al., 1989; Blanco et al., 1996; Joppa et al., 1997). However, RFLP markers were found to show a low level of polymorphism in wheat, especially when studying progenies of closely related genotypes (Devos et al., 1992). Later, microsatellites also called SSR, became more popular since they show a higher level of polymorphism than RFLP markers (Huang et al., 2006). SSR markers were used for linkage mapping and QTL identification for end-use quality traits (Table 1) (Prasad et al., 2003; Sourdille et al., 2003; Kuchel et al., 2006). A combination of RFLP, SSR, and Amplified Fragment Length Polymorphism (AFLP) was also used to increase the marker density in maps (Table 1) (Sourdille et al., 2003; Mohler et al., 2014). With the advancement in sequencing technologies, the use of SNP has been prioritized since they are abundant and uniformly distributed in a genome providing high genomic resolution (Gupta et al., 2008; Kang et al., 2016; Wang et al., 2017; Naraghi et al., 2019; Guo Y. et al., 2020). The availability of high throughput sequencing platform for SNPs makes it a preferred genotyping method in general. Genotyping-by-sequencing (GBS) has been a popular genotyping method that allows capturing SNPs through a reduced representation of the genome (Poland et al., 2012). A few of the representative QTL mapping studies utilizing various genotyping methods for end-use quality traits in wheat are summarized in Table 1.
QTLs are identified either by QTL mapping in a biparental mapping population or by association mapping (Beló et al., 2008). The majority of prior research work in wheat quality traits was concentrated on QTL mapping using different mapping populations like F2 generation, recombinant inbred lines (RILs), doubled-haploids (DHs), and near-isogenic lines (NILs) (Table 1). Recently, GWAS has also been a popular tool for the genetic study of complex polygenic traits in species such as wheat, rice, maize, and barley because of many advantages over QTL mapping (Yang et al., 2020). Since GWAS is carried out in a diversity panel, it has higher allelic diversity and higher resolution as a result of genetic recombination events (Korte and Farlow, 2013). GWAS also allows the detection of quantitative trait nucleotides (QTNs) with small effects associated with complex traits (Yang et al., 2020). However, GWAS has less power and requires a larger population to detect an association compared to QTL mapping. On the positive side, GWAS can be used for the selection of parents for subsequent QTL analysis thus complementing each other (Korte and Farlow, 2013). A few representative GWAS studies for end-use quality traits are summarized in Table 1. With the assembly being available, research can be concentrated on the identification of candidate genes using QTL mapping and association studies (Li and Yang, 2017).
The generation of wheat genome assembly has been a great milestone for improving wheat end-use quality traits. A reference genome has allowed us to physically map the genes/loci related to end-use quality traits in wheat (Guo J. et al., 2020). The QTLs identified from the mapping studies are first located in the physical map of the chromosome and the candidate genes located in the QTL are noted using the gene annotation available from the assembly (Li Y et al., 2012). This has allowed the identification of novel QTLs/genes related to end-use quality traits in wheat (Li Y et al., 2012). Based on the gene function annotation and existing knowledge of quality development metabolic pathways, the function of these candidate genes are classified (Yang et al., 2020). Fine mapping has also been done to narrow down the list of candidate genes or to even identify the causal gene for traits such as GPC, grain weight and size in wheat (Olmos et al., 2003; Distelfeld et al., 2006; Uauy et al., 2006; Röder et al., 2008; Zhang et al., 2018). Markers related to the gene can then be used for marker-assisted selection of individuals having the desired genotype of interest. Wheat genome assembly has also allowed study of the homologs of the genes that could be present in all three subgenomes of wheat i.e., A, B and D genome. Moreover, it also allows assessments of intraspecies genomic variation and the availability of multiple assemblies from different lines can be further used for comparative mapping (Walkowiak et al., 2020).
All these genetic and genomic studies in wheat have generated valuable resources for wheat including reference genomes, whole-genome sequencing data, shotgun sequencing data, genome-wide genetic marker data, gene expression atlas, and diagnostic markers which are available across various platforms. Genome reference sequence browsers are available for different cultivars/species of wheat including the Chinese spring wheat (Appels et al., 2018), HRWW varieties such as Jagger and Mace, spelt, durum wheat, and wild relatives of wheat such as wild emmer and Ae. tauschii (https://wheat.pw.usda.gov/GG3/genome_browser#). PlanGDB (http://www.plantgdb.org/), Gramene (http://www.gramene.org/), and Phytozome (https://phytozome.jgi.doe.gov/pz/portal.html#) are additional sources for genomic information on many crops including wheat. In 2019, an international collaboration project “10 + genome project” released a wheat pan-genome containing a reference sequence of 10 global panels of wheat varieties (http://www.10wheatgenomes.com). As of November 2022, sequencing data from more than 61,500 bio-samples related to common wheat have been deposited in NCBI and are publicly available (https://www.ncbi.nlm.nih.gov/sra). These resources are being used for advancing studies of end-use quality traits in wheat and will continue to be useful in the future.
6 QTL/genes related to end-use quality traits in wheat
The genetic, genomic, and physiological information for various end-quality traits in wheat continues to grow. This includes the identification of major QTLs/genes controlling various traits of interest. These results will be instrumental for the continued success of GAB in wheat. The following are some of the major findings for end-use quality traits in wheat.
6.1 Grain protein content (GPC)
Joppa et al. (1997) identified a significant QTL related to GPC on chromosome 6BS contributing up to 66% phenotypic variance (PV) from a population of RIL of T. turgidium L. var dicoccoides (Table 1). This QTL was later mapped as a single Mendelian locus, Gpc-6B1, flanked by Xcdo365 and xUCW67 markers at 1.5 cM and 1.2 cM, respectively (Olmos et al., 2003). Distelfeld et al. (2006) carried out microcolinearity between the rice reference genome and wheat expressed sequence tags (ESTs) which narrowed down the position of the Gpc-B1 gene to .3 cM flanked by PCR markers Xucw79 and Xucw71. The same authors also identified a more tightly linked (.1 cM) high throughput codominant marker Xuhw89 that was suggested for the initial screening of the Gpc-B1 gene. So far, many QTLs have been identified for GPC, however improvement in GPC of wheat has been limited to the introgression of this major gene, Gpc-B1 (Sengar and Singh, 2018). Another important finding for GPC was done by Terasawa et al. (2016) who studied DH lines of HRWW and identified a single major QTL, QGpc.2B-yume, on chromosome 2BS that explained 32% of PV for GPC and 16.5% of PV for FPC. The authors also recommended the use of flanking SSR marker Xgpw4382 for MAS of the identified QTL. Similarly, Kumar A et al. (2019) studied GPC in RIL of common wheat where they identified two major and stable QTLs, QGPC. ndsu.7A.2 and QGPC. ndsu.7B, in chromosome 7AL and 7B that explained 14.6% and 24.9% of PV, respectively. Additional studies on GPC have been summarized in Table 1.
6.2 Glutenin and gliadin
In hexaploid wheat, HMW-GS is encoded by three loci, Glu-A1, Glu-B1, and Glu-D1, found on the distal half of the long arm of chromosomes 1A, 1B, and 1D, respectively, whereas the LMW-GS loci, Glu-A2, Glu-B3, Glu-D3 are found on short arms of those same group 1 chromosomes (Payne, 1987; Singh and Shepherd 1988). HMW-GS are extensively studied in wheat as they play a major role in dough elasticity (Payne, 1987). Wheat varieties can contain tightly linked genes with multiple alleles within these loci that code for “x” and “y” type glutenin subunits (Payne et al., 1981; Payne, 1987; Ravel et al., 2006; Mann et al., 2009). Ravel et al. (2020) identified 8, 22 and 9 different alleles at Glu-A1, Glu-B1 and Glu-D1 locus, respectively using the sodium dodecyl sulfate–polyacrylamide gel-electrophoresis (SDS–PAGE) method. The subunit “Dx5+Dy10” coded by Glu-D1d, “Ax2” coded by Glu-A1b, and “Bx7+Bx8” coded by Glu-B1b have been found to have a positive effect on dough properties resulting in good bread making quality (Payne and Lawrence 1983; Shewry 2003; Pirozi et al., 2008; Ravel et al., 2020). Ravel et al. (2006) carried out an association study in bread wheat and identified Glu-B1-1 as the candidate gene for determining the quantity of HMW glutenin. Payne et al. (1984) identified the association of gluten strength and LMW glutenin subunits (LMW-GS), and the gliadins were found to be tightly linked to the LMW-GS. The α and β gliadin genes are found on the short arms of chromosomes 6A, 6B, and 6D, whereas the γ and ω gliadins occur in the same locations as the LMW glutenin subunits (Payne et al., 1984; Payne, 1987).
6.3 Starch
There are three homoeologous waxy genes in common wheat, Wx-A1, Wx-B1, and Wx-D1, located on chromosomes 7AS, 4AL, and 7DS, respectively (Chao et al., 1989), that produce three distinct Wx proteins (Nakamura et al., 1993). Chao et al. (1989) indicated that the Waxy gene originally present on chromosome 7B was translocated to chromosome 4AL. Based on the presence/absence of Wx proteins, wheat plants were categorized into eight groups: Type 1 for wild type (having all Wx-A1, Wx-B1, and Wx-D1 proteins), Type 8 for waxy wheat (no Wx protein), and Type 2–7 for partial waxy lines (with missing one or two Wx proteins) (Nakamura et al., 2002). Nakamura et al. (1993) developed the first waxy tetraploid (amylose free) by crossing partially waxy plants, Type7 common wheat and Type IV durum. Such waxy wheat has been used to products such as Asian wet noodles (Graybosch, 1998). Guzmán and Alvarez (2016) reported that there are 19 different waxy protein variants, and so far, molecular studies have identified 19, 15, and 7 allelic variants for Wx-A1, Wx-B1, and Wx-D1 gene, respectively. The Wx-A1a, Wx-B1a and Wx-D1a are the wild type alleles for these genes (Yamamori et al., 1994; Nakamura et al., 1995). Apart from normal functional alleles, alleles with loss of function (i.e., null allele) have also been identified for all three genes with null alleles for Wx-A1 and Wx-B1 gene being more common than Wx-D1 gene (Guzmán et al., 2012b). The use of null alleles allows researchers to create partial waxy and waxy starch (Zhang et al., 2022), that has a beneficial effect on quality of products as discussed above. Therefore, identification and discovery of the alleles has been of major focus for grain starch. The Wx genes consist of 12 exons and 11 introns similar to that in barley and molecular markers have been successfully used to identify null mutants for these genes (Guzmán and Alvarez, 2016).
6.4 Grain hardness
Early studies (Symes, 1965) speculated that the grain hardness that distinguishes between hard and soft wheat is caused by a single major gene. This Hardness (Ha) locus is present in the short arm of chromosome 5D and contains Pina-D1, Pinb-D1, and Gsp-1 genes which encode for puroindolines a (Pina), puroindolines b (Pinb), and Grain Softness protein-1, respectively (Morris, 2002; Bhave and Morris, 2008; Guzmán and Alvarez, 2016). So far, nine Pina alleles and 17 Pinb alleles have been identified, out of which Pina-D1b, Pinb-D1b, Pinb-D1c, and Pinb-D1d are the major alleles identified in hard wheat cultivars (Bhave and Morris, 2008; Huang and Brûlé-Babel, 2011).
The durum wheat (genome AABB) has no D genome (Morris et al., 2011) therefore, the Ha locus is completely absent and it expresses extremely hard texture, harder than “hard” common wheat (Morris et al., 2011). A novel soft grain texture referred as “super soft” has also been identified among common as well as durum wheat and is found to be associated with higher break flour yield (Morris et al., 2011; Wang et al., 2012; Ibba et al., 2019; Kumar N et al., 2019). Kumar N et al. (2019) identified four major QTLs on chromosome 1BS, 4BS, 5AL and 7AS explaining 15%–19% of phenotypic variance for soft kernel texture in spring wheat. Wang et al. (2012) and Ibba et al. (2019) also identified QTLs associated to grain texture on chromosome 1BS, 4BS, 5BS, 2DS, 4DS and 5DL. These results provide evidence that the grain hardness is also controlled by genomic regions other than the Ha locus. The identification of super soft grain texture is also very useful as it could possibly provide bakers a new type of flour (Kumar A et al., 2019). These findings will further help to improve the understanding of kernel texture in common and durum wheats.
6.5 Sedimentation volume (SV)
Several studies have identified many loci associated with SV on chromosomes 3A, 3B, 4A, 4B, 5A, 5B, 6A, 7A, and 7B (Blanco et al., 1998; Elouafi et al., 2000; Patil et al., 2009). Patil et al. (2009) identified three main effect QTLs for SV in proximity to Glu-B1, Glu-B2, and Glu-B3 glutenin coding loci. In the same study, the QTL QSv.macs-1B.1, flanked by marker interval Xgwm550 and Glu-B3, explained 9.18%–40.6% of PV across five environments. The same authors also found that 22 main effect QTLs for various quality traits such as SV, GPC, and mixograph parameters formed five different clusters on chromosomes 1B, 4B, 7A, and 7B.
To summarize, genetic mapping studies for end-use quality traits in wheat have provided valuable information regarding putative causal/candidate genes or loci related to these traits. Besides this, many studies have also reported an important physiological correlation between various quality traits in wheat including the negative correlations between GPC and grain yield (Cox et al., 1985; Simmonds, 1995). Yang et al. (2020) discovered that the GPC, wet gluten content, and starch content in wheat to be highly positively correlated. The authors also suggested the use of such pleiotropic QTL for the selection of improved quality traits. A significant positive correlation has also been found between dough rheological properties such as dough development time and dough stability time (Li J et al., 2012; Yang et al., 2020). However, a negative correlation was reported between GPC and dough stability time and grain hardiness, wet gluten content and dough stability time and wet gluten content and dough development time (Li J et al., 2012). This information will be useful for improvement of end-use quality traits in wheat.
7 Marker-assisted breeding (MAB) and translational genomics for end-use quality traits
The use of molecular markers has significantly impacted the area of plant breeding and genetics. The linkage between major genes and quantitative trait effects was first reported by Sax (1923) and later Thoday (1961) reported the use of gene markers to locate the QTL. Molecular markers improve the efficiency of breeding programs by allowing early generation screening of individuals for targeted trait(s) which saves/reduces resources, energy, and time (Gale, 2005; Xu and Crouch, 2008). Molecular markers have been utilized for the selection of individuals in a breeding program through MAS and GS. Since quality traits are evaluated on harvested grains, i.e., at the end of the crop season, they are ideal targets for MAS and GS (Hayes et al., 2017).
7.1 Marker-assisted selection (MAS)
MAS is an important tool in plant breeding. Molecular markers can either be linked to the gene/locus or are diagnostic for a trait of interest (Gale, 2005; Xu and Crouch 2008). QTL mapping and GWAS studies in wheat have been able to identify markers that are tightly linked to the genes/locus influencing the trait and are therefore co-inherited with the trait. On the other hand, diagnostic/functional markers are those that are developed from actual gene sequence influencing the trait and they do not need independent validation for each parental line in a breeding program (Gale, 2005; Lau et al., 2015). MAS is used in many conditions including: 1) breeding for traits where conventional phenotypic selection is difficult, costly or time-consuming; 2) breeding for traits with high environmental influence or for traits whose selection depends on a specific environment and/or developmental stage; 3) speed breeding backcrossing or maintenance of recessive alleles during backcrossing also referred as marker-assisted backcrossing (MABC); and 4) pyramiding multiple favorable alleles within a single population also referred as marker-assisted recurrent selection (MARS) (Xu and Crouch, 2008).
The use of MAS method for end-use quality traits is a much more convenient, efficient, and faster alternative than the conventional method of phenotypic measurement and selection of individuals. In the past two decades, several studies have identified markers related to quality traits that were recommended for use in MAS. For wheat, there are more than 97 functional markers that are being used in breeding programs for various traits of interest including end-use quality traits (Nadeem et al., 2018). Table 2 provides an overview of markers being used for MAS of five end-use quality traits in wheat.
The PCR markers, Xucw71 and Xuhw89 (codominant), developed by Distelfeld et al. (2006) have been used for selecting genotypes having the Gpc-B1 gene related to high GPC content (https://maswheat.ucdavis.edu/protocols/HGPC) (Table 2). Bokore et al. (2019) also validated the use of Xucw71 and Xuhw89 markers for MAS of genotypes with or without the Gpc-B1 gene from four common hexaploid wheat populations. The authors reported an increment in the GPC content of lines with the Gpc-B1 positive allele. Similarly, Ravel et al. (2006) claimed that the Glu-B1 linked markers can be used by breeders for the indirect selection of high protein genotypes.
MAS has also been used for traits other than GPC in wheat. Huang and Brûlé-Babel (2011) developed simple and co-dominant PCR markers to select grain hardness targeting the Pina and Pinb alleles (Table 2). Patil et al. (2009) recommended the use of markers Xgwm550 and Glu-B3 flanking the QTL QSv.macs-1B.1 for MAB of SV. Likewise, Ibba et al. (2018) developed haplotype specific molecular markers for identification of specific haplotypes of Glu-A3, Glu-B3 and Glu-D3 locus associated with gluten strength.
The negative relationship between grain yield and GPC, and the significant interactions between these traits and the environment make it challenging for GPC improvement through conventional breeding (Cox et al., 1985; Simmonds, 1995; Rapp et al., 2018) and MAS has been suggested for improvement in both traits. The negative relationship between these traits could be due to plants requiring more energy to produce the same amount of protein than carbohydrate (De Vries et al., 1974; Blanco et al., 1996). One of the strategy for ameliorating such negative effect is to do the MAS of GPC simultaneously with the phenotypic selection for other yield and quality traits (Tabbita et al., 2017). As an example, Kumar et al. (2011) carried out MAS of Gpc-B1 and reported that MAS-derived progenies did not show proportional decline of grain yield. Therefore, the authors were able to select for lines with high GPC and no penalty for grain yield. The other alternative would be to identify genes with no negative effect on the grain yield and use it in breeding program. Terasawa et al. (2016) identified a major QTL, QGpc.2B-yume, on chromosome 2B which had no significant negative effect on grain yield and other yield components traits. The effect of QGpc.2B-yume should be tested in other populations and environments as well. These findings are promising for the development of wheat varieties with improved yield and end-use quality.
Vishwakarma et al. (2014) carried out MABC for introgression of Gpc-B1 from a high GPC variety, Glu269, to an elite variety HUW468. Elite lines were developed within a relatively short period of two and half years (five crop cycles), and improved lines were selected with significantly higher GPC and consisted of 88.4%–92.3% of the recurrent parent plant genome. The authors utilized the SSR marker Xucw108 developed by Uauy et al. (2006) for foreground selection, and 86 other polymorphic SSR markers were used for background selection on recovery of the recurrent parent plant genome. Similarly; Rai et al. (2019) carried out MABC for the introgression of the grain softness gene, PinaD1a, into a hard-grained variety to develop soft grain wheat lines. In this study, the authors carried out a foreground selection for the PinaD1a allele using PinA marker (Gautier et al., 1994), background selection using 173 SSR markers covering all 21 chromosomes, and a negative selection for Pina-D1b allele using Pina-N1 marker (Chen et al., 2013). MARS has also been used in wheat breeding for grain yield and end-use quality traits. Maich et al. (2020) reported results from 12 cycles (24 years) of recurrent selection for grain yield among 83 F1 hybrids obtained by crossing 16 commercial varieties. The authors obtained a yield increment of 1.3% per year and at the end of 12 cycles and the improvement in yield did not affect the baking quality of wheat.
Although MAS seems a promising step forward in the field of MAB, it does have some limitations. MAS is based on the prediction accuracy of previously identified significant markers linked to major traits and these markers are few in number (Heffner et al., 2011). This limits the use of MAS for complex quantitative traits as accurate prediction of these traits will require markers for all of the associated genes (Heffner et al., 2011). These genes/QTLs also interact with each other at different expression levels thus changing the phenotype of an individual. MAS cannot account for these interaction effects because most of the markers are initially developed from a mapping population segregating for a single or few QTL which usually leads to overestimation of the QTL effect. Therefore, MAS is mostly constrained to simply inherited or monogenic traits (Michel et al., 2018). In addition, MAS also does not factor the environmental influence on the trait leading to lower phenotype prediction accuracy (Xu and Crouch, 2008; Heffner et al., 2009). Breeding programs now have integrated GS in their MAB as it considers all of these limitations of MAS, and these two tools complement each other.
7.2 Genomic selection (GS)
In GS, individuals are selected based on whole-genome marker profiling data that provides an overall performance evaluation of the plant (Varshney et al., 2015). The use of a whole-genome marker increases the chance that all QTLs are in linkage disequilibrium with at least one marker (Varshney et al., 2015). Due to this reason, unlike MAS, the GS does not require prior knowledge about large effect QTLs (Guo Y. et al., 2020). Also, for quantitative traits, GS usually has higher prediction accuracy than conventional MAS. In GS, phenotypic and genotypic marker data from the training population are fitted into the statistical models to get an estimation of all marker effects which are then used on unobserved genotypes of a testing population to calculate the genomic estimated breeding value (GEBV) (Heffner et al., 2009). Individuals are then selected based on the GEBV. The training population must be representative of the testing population to maximize the GEBV accuracy (Heffner et al., 2009). These training populations are advanced breeding materials that have been well characterized phenotypically and the GEBV of the testing population genotypes is predicted based on their genetic relation with the training population (Guzman et al., 2016; Michel et al., 2017; Michel et al., 2018). To assure proper selection, well-known check varieties, such as varieties with both good and poor bread-making quality, are included in the GS process that will help in validation of the selection as well as provide a reference for quality profiles (Guzman et al., 2016). However, extensive and good phenotypic data of the training population is required at the forefront in the wheat breeding program to generate accurate GEBV before GS can be used to select quantitative traits.
GS allows a 2–3 years earlier selection of many end-use quality traits in wheat than traditional selections and it is done on a much broader population allowing the selection of lines with good end-use quality and higher yield (Michel et al., 2018). Table 3 summarizes some of the GS studies carried out over the last decade for end-use quality traits in wheat. CIMMYT has been conducting GS for end-use quality traits in wheat since 2012 (Battenfield et al., 2016). In the CIMMYT breeding program, ∼10,000 first-year yield trials lines are genotyped and GEBV values are estimated for grain yield and end-use quality traits (Guzman et al., 2016). Heffner et al. (2011) compared MAS, GS, and phenotypic prediction accuracy of genetic value for nine different grain quality traits in biparental populations of soft winter wheat and found that the GS to phenotypic selection accuracy was as high as .66 and the GS prediction accuracy was superior to conventional MAS (Table 3). Similarly, Hayes et al. (2017) conducted a study on genomic prediction of 19 end-use quality traits and observed prediction accuracy greater than .5 for many of the traits (Table 3). Besides this, Michel et al. (2018) also carried out GS of baking quality in wheat and reported that an acceptable prediction accuracy of .38–.63 can be obtained in all dough rheological traits.
GS is still emerging, and advanced computation models are being developed to increase the accuracy in the prediction of GEBV value. Several GS models have been developed which also account for G×E interaction thus increasing prediction accuracy across environments (Heslot et al., 2014; Jarquín et al., 2014). Known candidate genes can be used to correlate the genotype-level and gene-level G×E interactions which can be used to predict the influence of G×E interaction (Li et al., 2018). Models are being developed for various G×E conditions including: 1) predicting tested genotypes in untested environments; 2) predicting untested genotypes in tested environments, and 3) predicting untested genotypes in untested environments (Li et al., 2018). Multi-trait GS models have also been developed that can account for the genetic correlation among the traits and improve the prediction accuracy of the primary trait when data for secondary correlated traits are available (Gill et al., 2021). Sandhu et al. (2022) carried out genomic prediction for seven end-use quality traits in winter wheat and found that the multi-trait models performed 5.5% and 7.9% superior to uni-trait GS models for within-environment and across location predictions, respectively, and multi-trait-multi-environment models performed 10.5% superior to the uni-trait models. Similar results have been found in other GS studies in wheat as well (Hayes et al., 2017; Guo J. et al., 2020; Gill et al., 2021). These results will certainly increase breeder’s confidence in integrating GS into their breeding program.
The UGA and SUNGRAINS (Southern Universities Grains, http://www.sungrains.lsu.edu/data.shtml), a cooperative research program between seven universities has been utilizing GAB for the development of superior germplasm of SRWW for the southeast United States. In collaboration with the USDA-ARS genotyping center (lead by Dr. Gina Brown-Guedira, https://wheat.pw.usda.gov/GenotypingLabs/?q=about), UGA and the SUNGRAINS breeding programs are using GS for important economic traits since 2015. MAS is also an important part of the program. Diagnostic markers are used for the selection of desirable genotypes for traits such as grain texture/softness using Pinb-D1a and Pinb-D1a markers, GPC using Gpc-B1 marker, and HMW-GS using Glu-A1 (Ax2, Ax1, and Axnull subunits), Glu-B1 (Bx7OE), and Glu-D1 (Dx5+Dx10, Dx2+Dx12) markers etc.
7.3 Candidate gene approach (CGA)
CGA is one of the translational genomics tools that has been practiced in wheat for different traits including thousand kernel weight (TKW), kernel size, GPC, yield, plant height, and disease resistance (Faris et al., 1999; Zhang et al., 2014; Nigro et al., 2019; Sehgal et al., 2019; Zhang et al., 2020). Zhang et al. (2014) carried out a translational genomics study of grain size regulation gene in wheat where they utilized the rice candidate gene, OsGS3. This gene is well characterized, negative regulator of grain size and explained 80%–90% of phenotypic variation for grain weight and grain length in rice. The orthologous TaGS gene in wheat, TaGS-D1 on chromosome 7DS was identified based on sequence identity and predicted protein similarity (Zhang et al., 2014). The authors were also able to identify QTL associated with TaGS-D1 using SSR markers for chromosome 7D. Similarly, a recent study by Nigro et al. (2019) utilized 14 candidate genes for GPC and/or yield for gene-based association mapping by identification of SNP for candidate genes across a diversity panel. The authors found that genes, AlaAT4A, ASN1-5A, NR-6A, and GS2-2B were significantly associated with GPC across seven environments. They further identified 11 stable QTL for GPC using GWAS and suggested that the utilization of the CGA and GWAS in parallel can increase the power and precision of QTL detection by reducing Type I and Type II error rates. Garg et al. (2009) identified a novel pair of HMW glutenin subunits, Glu-Ss1 from a study on Ae. searsii, an S genome wild ancestor of wheat. They indicated that these would be good candidate subunits that can improve the bread-making quality of wheat.
8 Challenges and future opportunities for improving wheat end-use qualities
Phenotyping for end-use quality traits is challenging and requires a great deal of resources and time, owing to the fact that the quality assessment for direct screening of elite breeding lines is only feasible later in the advanced generations when other important traits including grain yield, disease and pest resistance have been selected for. Therefore, it is imperative to optimize phenotyping and selection of end-use quality traits. An effective strategy is to study the G×E interaction for end-use quality traits. Traits highly influenced by environment, such as GPC and FPC, should be tested in multiple environments to allow breeders to get a better estimation of the value of a particular genotype (Aoun et al., 2021). Traits not as affected by environment can be tested in fewer environments which saves resources to test additional lines in the breeding program (Aoun et al., 2021). In addition, the G×E interaction provides information on genotype stability across environment and identifies the target environment for maximizing genetic gain (Dias et al., 2018). Moreover, future advancements in phenotypic analysis equipment and rapid assay techniques, including automated phenotyping and phenomics, could further reduce time to analyze multiple samples and reduce resources.
Not all research facilities and breeding programs have cutting-edge laboratories, equipment, and expertise to operate and assess all quality attributes. In fact, only a few U.S. states and federal agencies (e.g., USDA-ARS) have wheat end-use quality assessment labs available. With regards to such traditional assessment methods, early generation MAS of desirable genotype(s) for the end-use quality traits is much more convenient and efficient. However, available markers are limited to only some of the genes identified so far and are already being used for selecting associated genes in the breeding lines. Therefore, there is a continual need for introgression of other major genes associated with these traits. One of the significant bottlenecks to QTL mapping and identification is the lack of validation studies. Hence, the plethora of QTLs identified to date for several end-use quality traits have few practical implications. Kiszonas and Morris, (2017) stated: “wheat breeding community have collected numerous markers and QTLs, but very few of them are being used for the improvement of wheat …. collecting countless QTLs is rather meaningless unless we take the next step and develop and use markers to improve the quality and consistency of wheat.” Therefore, the wheat breeding community should focus fine mapping on identified, important major QTLs, functionally validate and clone the candidate gene(s), and develop markers associated with the genes for MAS of end-use quality traits. However, it is also important to consider that most QTLs identified so far are not major and/or they explain small portion of PV and are population and/or environment specific. Minor QTLs can be useful for their additive effect, but it is obvious that the major QTLs such as GPC-B1 are the ones that add the most value in a breeding program. Therefore, the quest for the major/novel QTL(s)/gene(s) should continue in balance with validation studies. Moreover, the identified major genes can also be integrated as a fixed effect in the genomic prediction models for further improving the accuracy of GS (Bernardo, 2014).
Conventional genetic map-based QTL/gene discovery of traits requires screening of numerous breeding lines to identify the individuals segregating for the traits of interest. However, individuals segregating for traits of interest may not be present in the germplasm managed by the breeding program or the identified loci for segregating population could only explain a small amount of phenotypic variance. Besides this, the development of crosses could also be troublesome in the plants due to flower morphology or unsynchronized flowering between the lines. Therefore, researchers instead can look for studies done on the same traits across crops or even across related plant species to find genomic information that can be translated to the target crop, wheat. For example, wild emmer, T. turgidum L ssp dicoccoides, contains higher GPC than most hexaploid/tetraploid wheat cultivars (Avivi, 1978; Nevo et al., 2002) and could potentially be used to identify positive alleles of genes governing the GPC (Distelfeld et al., 2006). Therefore, studies done on GPC in wild emmer can provide useful genomic information to improve the GPC of durum and hexaploid wheat using the methods discussed above. In addition, other crop species within the Gramineae family such as rice, maize, barley, and oat have a greater chance of synteny or gene co-linearity with wheat and can influence similar phenotypes. Therefore, genetic findings on end-use quality traits in these crops should be further explored for translation to wheat.
Translational genomics through comparative genomics and functional genomics allows for a more integrated improvement of crop species. Non-etheless, translational genomics can be challenging due to the limitations of the molecular breeding approaches and tools used by the breeding programs. The use of MAS could be hindered if there are limited significant markers for the traits of interest. The GS can be limited based on the models used for the prediction of breeding values and the density of the markers. The CGA approach is solely based on the identification of functionally characterized genes or positional candidate genes which can be limited in number. However, these challenges can be overcome as additional research and findings are being put forth requiring continued and improved access to data. Therefore, it is necessary for the development of a single database that allows access to all these resources as proposed by (Kang et al., 2016). Infrastructure and management system of these data and the competence to handle large/sophisticated data are critical (Varshney et al., 2015). Additionally, the future of translational genomics also depends on how accessible these NGS technologies are to breeding/research programs. Genomic information and breakthroughs are the foundations for translational genomics for crop improvement in the future. This would also be beneficial to neglected and underutilized, yet nutritionally important crops that are being left behind from genetic improvement such as quinoa, finger millet etc. (Subedi, 2020; Gautam et al., 2021).
Consideration should also be given for the establishment of expanded private-public research collaborations which have been in limited number and scale in wheat breeding. These two institutions worked independently with a common goal of developing improved varieties of wheat. As a result, these two institutions were in competing space with each other. Therefore, there is a need for establishment of a collaboration where both benefit without compromising the institutional integrity and success. Such collaboration could be made by sharing resources such as epidemiological information, technologies such as sequencing platforms, labs, equipment such as planters and harvesters or research fields for testing varieties in diverse environmental conditions. One such example is the International Wheat Yield Partnership (IWYP) (https://iwyp.org/) where both private and public institutions are working together to achieve a common goal of increasing the genetic yield potential of wheat by 50% by 2035 (https://iwyp.org/global-challenge/). The partnership combines the discovery, and research expertise of the public institutes with the private industries excellence in taking validated discoveries into breeding programs, developing putative varieties, large-scale testing, multiplying seeds of the varieties and delivery of improved varieties to farmers across the globe. There is a need of such bilateral relationship between universities and industries and the joint findings can be further disseminated in collaboration with the extension service within each of the institutions.
To conclude, research towards improved end-use quality of wheat utilizing recently developed modern tools/methodologies and technologies such as MAS, GS, and CGA clearly indicate that the adoption of GAB is increasing and will likely continue to expand in the future. This approach facilitates the plant breeding objectives of identifying and selecting individuals with desirable and economic end-use quality traits in a more effective and efficient way. It speeds up the process of crop improvement and the development of adapted cultivars. Utilization of GAB approaches, combined with targeted phenotypic assessments to validate plant selections, provides wheat breeders with ever-powerful tools to maximize wheat improvement. It is also vital to innovate ways that allow both private and public sectors to work hand-in-hand to address future challenges, including increasing productivity and end-use quality of major crops. Overall, understanding and modifying the crop genomic architecture will advance wheat germplasm with promising end-use quality traits in addition to increased grain yield that can ensure food and nutritional security for the escalating global population.
Statements
Author contributions
MS and MM conceptualized the review. MS designed the overall outline and prepared the first draft. BG, JWB, JB, and MM provided guidance, critical suggestions, and feedback throughout the manuscript preparation. All authors contributed to the review and approved the submitted version.
Conflict of interest
The authors declare that the research was conducted in the absence of any commercial or financial relationships that could be construed as a potential conflict of interest.
Publisher’s note
All claims expressed in this article are solely those of the authors and do not necessarily represent those of their affiliated organizations, or those of the publisher, the editors and the reviewers. Any product that may be evaluated in this article, or claim that may be made by its manufacturer, is not guaranteed or endorsed by the publisher.
References
1
AbuHammadW. A.EliasE. M.MantheyF. A.AlamriM. S.MergoumM. (2012). A comparison of methods for assessing dough and gluten strength of durum wheat and their relationship to pasta cooking quality. quality. Int. J. Food Sci. Technol.47(12), 2561–2573. 10.1111/j.1365-2621.2012.03135.x
2
AlamriM.MantheyF.MergoumM.EliasE.KhanK. (2009). Assessing spring wheat quality using the glutograph instrument. Cereal Foods World54, 124–131. 10.1094/cfw-54-3-0124
3
AnjumF. M.KhanM. R.DinA.SaeedM.PashaI.ArshadM. U. (2007). Wheat gluten: High molecular weight glutenin subunits—structure, genetics, and relation to dough elasticity. J. food Sci.72 (3), R56–R63. 10.1111/j.1750-3841.2007.00292.x
4
AounM.CarterA.ThompsonY. A.WardB.MorrisC. F.EliasE. M. (2021). Novel stripe rust all-stage resistance loci identified in a worldwide collection of durum wheat using genome-wide association mapping. Plant Genome14 (3), e20136. 10.1002/tpg2.20128
5
AppelbeeM.-J.MekuriaG. T.NagasandraV.BonneauJ. P.EaglesH. A.EastwoodR. F.et al (2009). Novel allelic variants encoded at the Glu-D3 locus in bread wheat. J. Cereal Sci.49 (2), 254–261. 10.1016/j.jcs.2008.10.011
6
AppelsR.EversoleK.SteinN.FeuilletC.KellerB.RogersJ.et al (2018). Shifting the limits in wheat research and breeding using a fully annotated reference genome. Science361 (6403), eaar7191. 10.1126/science.aar7191
7
AroraL.NarulaA. (2017). Gene editing and crop improvement using CRISPR-cas9 system. Front. Plant Sci.8, 1932. 10.3389/fpls.2017.01932
8
AviviL. (1978). “High grain protein content in wild tetraploid wheat Triticum dicoccoides Korn,” in Proceeding of the 5th International Wheat genetics Symposium (IEEE), 372–380.
9
BarakatM.Al-DossA.MoustafaK.MotaweiM.AlamriM.MergoumM.et al (2020a). QTL analysis of farinograph and mixograph related traits in spring wheat under heat stress conditions. Mol. Biol. Rep.47 (7), 5477–5486. 10.1007/s11033-020-05638-6
10
BarakatM. N.Al-DossA. A.MoustafaK. A.MotaweiM. I.AlamriM. S.MergoumM.et al (2020b). Molecular detection of QTLs for flour quality traits in two doubled haploid populations in spring wheat under heat stress. Cereal Res. Commun.48 (4), 525–532. 10.1007/s42976-020-00084-3
11
BattenfieldS. D.GuzmánC.GaynorR. C.SinghR. P.PeñaR. J.DreisigackerS.et al (2016). Genomic selection for processing and end‐use quality traits in the CIMMYT spring bread wheat breeding program. Plant Genome9 (2). 10.3835/plantgenome2016.01.0005
12
BelóA.ZhengP.LuckS.ShenB.MeyerD. J.LiB.et al (2008). Whole genome scan detects an allelic variant of fad2 associated with increased oleic acid levels in maize. Mol. Genet. Genomics279, 1–10. 10.1007/s00438-007-0289-y
13
BernardoR. (2014). Genomewide selection when major genes are known. Crop Sci.54 (1), 68–75. 10.2135/cropsci2013.05.0315
14
BhattaraiU.SubudhiP. K. (2019). Genetic diversity, population structure, and marker-trait association for drought tolerance in US rice germplasm. Plants8 (12), 530. 10.3390/plants8120530
15
BhaveM.MorrisC. F. (2008). Molecular genetics of puroindolines and related genes: Allelic diversity in wheat and other grasses. Plant Mol. Biol.66 (3), 205–219. 10.1007/s11103-007-9263-7
16
BlancoA.GiovanniC. D.LaddomadaB.SciancaleporeA.SimeoneR.DevosK. M.et al (1996). Quantitative trait loci influencing grain protein content in tetraploid wheats. Plant Breed.115 (5), 310–316. 10.1111/j.1439-0523.1996.tb00925.x
17
BlancoA.BellomoM. P.LottiC.ManiglioT.PasqualoneA.SimeoneR.et al (1998). Genetic mapping of sedimentation volume across environments using recombinant inbred lines of durum wheat. Plant Breed.117 (5), 413–417. 10.1111/j.1439-0523.1998.tb01965.x
18
BlazekJ.CopelandL. (2008). Pasting and swelling properties of wheat flour and starch in relation to amylose content. Carbohydr. Polym.71 (3), 380–387. 10.1016/j.carbpol.2007.06.010
19
BokoreF. E.KnoxR. E.DePauwR. M.CuthbertR. D.ValerioI. P.ClarkeF. R.et al (2019). Validation of the effects of the Gpc-B1 high grain protein concentration locus from Lillian hard red spring wheat (Triticum aestivum L.) using locus specific markers. Euphytica215 (1), 2. 10.1007/s10681-018-2322-0
20
BortesiL.FischerR. (2015). The CRISPR/Cas9 system for plant genome editing and beyond. Biotechnol. Adv.33 (1), 41–52. 10.1016/j.biotechadv.2014.12.006
21
BrevisJ. C.MorrisC. F.MantheyF.DubcovskyJ. (2010). Effect of the grain protein content locus Gpc-B1 on bread and pasta quality. J. Cereal Sci.51 (3), 357–365. 10.1016/j.jcs.2010.02.004
22
BrineyA.WilsonR.PotterR. H.BarclayI.CrosbieG.JonesM. G. K.et al (1998). A PCR-based marker for selection of starch and potential noodle quality in wheat. Mol. Breed.4, 427–433. 10.1023/a:1009664917998
23
BushukW. (1998). Wheat breeding for end-product use. Euphytica100, 137–145. 10.1023/a:1018368316547
24
ButowB. J.GaleK. R.IkeaJ.JuhaszA.BedoZ.TamasL.et al (2004). Dissemination of the highly expressed Bx7 glutenin subunit (Glu-B1al allele) in wheat as revealed by novel PCR markers and RP-HPLC. Theor. Appl. Genet.109 (7), 1525–1535. 10.1007/s00122-004-1776-8
25
ChangC.-Y.Chambers IvE. (1992). Flavor characterization of breads made from hard red winter wheat and hard white winter wheat’. American association of cereal chemists, 4.
26
ChaoS.SharpP. J.WorlandA. J.WarhamE. J.KoebnerR. M. D.GaleM. D. (1989). RFLP-based genetic maps of wheat homoeologous group 7 chromosomes. Theor. Appl. Genet.78 (4), 495–504. 10.1007/BF00290833
27
ChenL.HuangL.MinD.PhillipsA.WangS.MadgwickP. J.et al (2012). “Development and characterization of a new TILLING population of common bread wheat (Triticum aestivum L.),” in PLoS ONE. Editor GrebeM. (Sweden: Umeå Plant Science Centre), 7, e41570. 10.1371/journal.pone.0041570
28
ChenF.LiH.CuiD. (2013). Discovery, distribution and diversity of Puroindoline-D1 genes in bread wheat from five countries (Triticum aestivum L.). BMC Plant Biol.13 (1), 125. 10.1186/1471-2229-13-125
29
ClarkJ. A.BaylesB. B. (1935). Classification of wheat varieties grown in the United States. Washington, DC: United states department of agriculture, 214.
30
CoxM. C.QualsetC. O.RainsD. W. (1985). Genetic variation for nitrogen assimilation and translocation in wheat. I. Dry matter and nitrogen accumulation 1. Crop Sci.25 (3), 430–435. 10.2135/cropsci1985.0011183X002500030002x
31
DaleE. M.HousleyT. L. (1986). Sucrose synthase activity in developing wheat endosperms differing in maximum weight. Plant Physiol.82 (1), 7–10. 10.1104/pp.82.1.7
32
de BustosA.RubioP.SolerC.GarcíaP.JouveN. (2001). “Marker assisted selection to improve HMW-glutenins in wheat,” in Wheat in a global environment. Developments in plant breeding. Editors BedöZ.LángL. (Dordrecht: Springer Netherlands), 171–176. 10.1007/978-94-017-3674-9_19
33
De VriesF. W. T. P.BrunstingA. H. M.Van LaarH. H. (1974). Products, requirements and efficiency of biosynthesis a quantitative approach. J. Theor. Biol.45 (2), 339–377. 10.1016/0022-5193(74)90119-2
34
DevosK. M.AtkinsonM. D.ChinoyC. N.LiuC. J.GaleM. D. (1992). RFLP-based genetic map of the homoeologous group 3 chromosomes of wheat and rye. Theor. Appl. Genet.83 (8), 931–939. 10.1007/BF00232953
35
D’hoopB. B.KeizerP. L. C.PauloM. J.VisserR. G. F.van EeuwijkF. A.van EckH. J. (2014). Identification of agronomically important QTL in tetraploid potato cultivars using a marker–trait association analysis. Theor. Appl. Genet.127 (3), 731–748. 10.1007/s00122-013-2254-y
36
DiasK. O. D. G.GezanS. A.GuimarãesC. T.ParentoniS. N.GuimarãesP. E. de O.CarneiroN. P.et al (2018). Estimating genotype × environment interaction for and genetic correlations among drought tolerance traits in maize via factor analytic multiplicative mixed models. Crop Sci.58 (1), 72–83. 10.2135/cropsci2016.07.0566
37
DickJ. W.YoungsV. L. (1988). Evaluation of durum wheat, semolina, and pasta in the United States. Available at: https://agris.fao.org/agris-search/search.do?recordID=US19890103346.
38
DistelfeldA.UauyC.FahimaT.DubcovskyJ. (2006). Physical map of the wheat high-grain protein content gene Gpc-B1 and development of a high-throughput molecular marker. New Phytol.169 (4), 753–763. 10.1111/j.1469-8137.2005.01627.x
39
DivashukM. G.KlimushinaM. V.KarlovG. I. (2011). Molecular genetic characteristics of the Wx-B1e allele from common wheat and applicability of the DNA markers for its identification. Russ. J. Genet.47 (12), 1428–1432. 10.1134/S1022795411120039
40
dos SantosJ. P. R.PiresL. P. M.de Castro VasconcellosR. C.PereiraG. S.Von PinhoR. G.BalestreM. (2016). Genomic selection to resistance to Stenocarpella maydis in maize lines using DArTseq markers. BMC Genet.17 (1), 86. 10.1186/s12863-016-0392-3
41
D’OvidioR.AndersonO. D. (1994). PCR analysis to distinguish between alleles of a member of a multigene family correlated with wheat bread-making quality. Theor. Appl. Genet.88 (6–7), 759–763. 10.1007/BF01253982
42
D’OvidioR.MasciS. (2004). The low-molecular-weight glutenin subunits of wheat gluten. J. Cereal Sci.39 (3), 321–339. 10.1016/j.jcs.2003.12.002
43
DreisigackerS.XiaoY.SehgalD.GuzmanC.HeZ.XiaX.et al (2020). SNP markers for low molecular glutenin subunits (LMW-GSs) at the Glu-A3 and Glu-B3 loci in bread wheat. PLoS ONE15, e0233056. 10.1371/journal.pone.0233056
44
Echeverry-SolarteM.KumarA.KianianS.SimsekS.AlamriM. S.MantovaniE. E.et al (2015). New QTL alleles for quality-related traits in spring wheat revealed by RIL population derived from supernumerary × non-supernumerary spikelet genotypes. Theor. Appl. Genet.128 (5), 893–912. 10.1007/s00122-015-2478-0
45
EckardtN. A. (2000). Sequencing the rice genome. Plant Cell.12 (11), 2011–2017. 10.1105/tpc.12.11.2011
46
ElouafiI.NachitM. M.ElsalehA.AsbatiA.MatherD. E. (2000). QTL-mapping of genomic regions controlling gluten strength in durum (Triticum turgidum L. var. durum). Zaragoza, Spain: CIHEAM, 6.
47
FAO (2021). FAOSTAT statistical database. Available at: https://search.library.wisc.edu/catalog/999890171702121.
48
FaridiH.GainesC.FinneyP. (1994). “Soft wheat quality in production of cookies and crackers,” in Wheat: Production, properties and quality. Editors BushukW.RasperV. F. (Boston, MA: Springer US), 154–168. 10.1007/978-1-4615-2672-8_11
49
FarisJ. D.LiW. L.LiuD. J.ChenP. D.GillB. S. (1999). Candidate gene analysis of quantitative disease resistance in wheat. Theor. Appl. Genet.98 (2), 219–225. 10.1007/s001220051061
50
FarquharsonR. J. (2006). Production response and input demand in decision making: Nitrogen fertilizer and wheat growers. Aust. Agribus. Rev.15, 5. 10.22004/ag.econ.126105
51
FredrikssonH.SilverioJ.AnderssonR.EliassonA.-C.ÅmanP. (1998). The influence of amylose and amylopectin characteristics on gelatinization and retrogradation properties of different starches. Carbohydr. Polym.35 (3), 119–134. 10.1016/S0144-8617(97)00247-6
52
GalandeA. A.TiwariR.AmmirajuJ. S. S.SantraD. K.LaguM. D.RaoV. S.et al (2001). Genetic analysis of kernel hardness in bread wheat using PCR-based markers. Theor. Appl. Genet.103, 601–606. 10.1007/pl00002915
53
GaleK. R. (2005). Diagnostic DNA markers for quality traits in wheat. J. Cereal Sci.41 (2), 181–192. 10.1016/j.jcs.2004.09.002
54
GargM.TanakaH.IshikawaN.TakataK.YanakaM.TsujimotoH. (2009). A novel pair of HMW glutenin subunits from Aegilops searsii improves quality of hexaploid wheat. Cereal Chem. J.86 (1), 26–32. 10.1094/CCHEM-86-1-0026
55
GautamT.DhillonG. S.SaripalliG.RakhiSinghV. P.PrasadP.KaurS.et al (2020). Marker-assisted pyramiding of genes/QTL for grain quality and rust resistance in wheat (Triticum aestivum L.). Mol. Breed.40 (5), 49. 10.1007/s11032-020-01125-9
56
GautamN.GargS.YadavS. (2021). Underutilized finger millet crop for starch extraction, characterization, and utilization in the development of flexible thin film. J. Food Sci. Technol.58 (11), 4411–4419. 10.1007/s13197-020-04926-0
57
GautierM.-F.AlemanM.-E.GuiraoA.MarionD.JoudrierP. (1994). Triticum aestivum puroindolines, two basic cystine-rich seed proteins: cDNA sequence analysis and developmental gene expression. Plant Mol. Biol.25 (1), 43–57. 10.1007/BF00024197
58
GaireR.HuangM.SnellerC.GriffeyC.Brown-GuediraG. (2019). Association Analysis of Baking and Milling Quality Traits in an Elite Soft Red Winter Wheat Population. Crop Sci.59 (3), 1085–1094. 10.2135/cropsci2018.12.0751
59
GhimireB.SapkotaS.BahriB. A.Martinez-EspinozaA. D.BuckJ. W.MergoumM. (2020). Fusarium head blight and rust diseases in soft red winter wheat in the southeast United States: State of the art, challenges and future perspective for breeding. Front. Plant Sci.11, 1080. 10.3389/fpls.2020.01080
60
GhimireB.MergoumM.Martinez‐EspinozaA. D.SapkotaS.PradhanS.BabarM. A.et al (2022). Genetics of Fusarium head blight resistance in soft red winter wheat using a genome‐wide association study. Plant Genome15, e20222. 10.1002/tpg2.20222
61
GillH. S.HalderJ.ZhangJ.BrarN. K.RaiT. S.HallC.et al (2021). Multi-trait multi-environment genomic prediction of agronomic traits in advanced breeding lines of winter wheat. Front. Plant Sci.12, 709545. 10.3389/fpls.2021.709545
62
GirouxM. J.MorrisC. F. (1997). A glycine to serine change in puroindoline b is associated with wheat grain hardness and low levels of starch-surface friabilin. Theor. Appl. Genet.95 (5–6), 857–864. 10.1007/s001220050636
63
GrayboschR. A. (1998). Waxy wheats: Origin, properties, and prospects 11Joint contribution of the United States Department of Agriculture, Agricultural Research Service and the Department of Agronomy, University of Nebraska-Lincoln as Journal Series Paper No 12125. Mention of firm names or trade products does not imply that they are endorsed or recommended by the USDA or the University of Nebraska over other firms or products not mentioned. Trends food Sci. Technol.9, 135–142. 10.1016/s0924-2244(98)00034-x
64
GroosC.RobertN.BervasE.CharmetG. (2003). Genetic analysis of grain protein-content, grain yield and thousand-kernel weight in bread wheat. Theor. Appl. Genet.106 (6), 1032–1040. 10.1007/s00122-002-1111-1
65
GuptaP. K.RustgiS.MirR. R. (2008). Array-based high-throughput DNA markers for crop improvement. Heredity101 (1), 5–18. 10.1038/hdy.2008.35
66
GuoJ.KhanJ.PradhanS.ShahiD.KhanN.AvciM.et al (2020a). Multi-trait genomic prediction of yield-related traits in US soft wheat under variable water regimes. Genes11 (11), 1270. 10.3390/genes11111270
67
GuoY.ZhangG.GuoB.QuC.ZhangM.KongF.et al (2020b). “QTL mapping for quality traits using a high-density genetic map of wheat,” in Plos one. Editor KumarA., 15, e0230601. 10.1371/journal.pone.0230601
68
GuptaP. K.BalyanH. S.ChhunejaP.JaiswalJ. P.TamhankarS.MishraV. K.et al (2022). Pyramiding of genes for grain protein content, grain quality, and rust resistance in eleven Indian bread wheat cultivars: A multi-institutional effort. Mol. Breed.42 (4), 21. 10.1007/s11032-022-01277-w
69
GuzmánC.AlvarezJ. B. (2016). Wheat waxy proteins: Polymorphism, molecular characterization and effects on starch properties. Theor. Appl. Genet.129 (1), 1–16. 10.1007/s00122-015-2595-9
70
GuzmánC.CaballeroL.MartínL. M.AlvarezJ. B. (2012a). Waxy genes from spelt wheat: New alleles for modern wheat breeding and new phylogenetic inferences about the origin of this species. Ann. Bot.110 (6), 1161–1171. 10.1093/aob/mcs201
71
GuzmánC.CaballeroL.YamamoriM.AlvarezJ. B. (2012b). Molecular characterization of a new waxy allele with partial expression in spelt wheat. Planta235 (6), 1331–1339. 10.1007/s00425-011-1577-7
72
GuzmanC.PeñaR. J.SinghR.AutriqueE.DreisigackerS.CrossaJ.et al (2016). Wheat quality improvement at CIMMYT and the use of genomic selection on it. Appl. Transl. Genomics11, 3–8. 10.1016/j.atg.2016.10.004
73
HaileJ. K.N’DiayeA.ClarkeF.ClarkeJ.KnoxR.RutkoskiJ.et al (2018). Genomic selection for grain yield and quality traits in durum wheat. Mol. Breed.38 (6), 75. 10.1007/s11032-018-0818-x
74
HanifM.GaoF.LiuJ.WenW.ZhangY.RasheedA.et al (2016). TaTGW6-A1, an ortholog of rice TGW6, is associated with grain weight and yield in bread wheat. Mol. Breed.36, 1. 10.1007/s11032-015-0425-z
75
HayesB. J.PanozzoJ.WalkerC. K.ChoyA. L.KantS.WongD.et al (2017). Accelerating wheat breeding for end-use quality with multi-trait genomic predictions incorporating near infrared and nuclear magnetic resonance-derived phenotypes. Theor. Appl. Genet.130 (12), 2505–2519. 10.1007/s00122-017-2972-7
76
HeffnerE. L.JanninkJ.-L.IwataH.SouzaE.SorrellsM. E. (2011). Genomic selection accuracy for grain quality traits in biparental wheat populations. Crop Sci.51 (6), 2597–2606. 10.2135/cropsci2011.05.0253
77
HeffnerE. L.SorrellsM. E.JanninkJ.-L. (2009). Genomic selection for crop improvement. Crop Sci.49 (1), 1–12. 10.2135/cropsci2008.08.0512
78
HeslotN.AkdemirD.SorrellsM. E.JanninkJ.-L. (2014). Integrating environmental covariates and crop modeling into the genomic selection framework to predict genotype by environment interactions. Theor. Appl. Genet.127 (2), 463–480. 10.1007/s00122-013-2231-5
79
HuangX.-Q.Brûlé-BabelA. (2011). Development of simple and co-dominant PCR markers to genotype puroindoline a and b alleles for grain hardness in bread wheat (Triticum aestivum L.). J. Cereal Sci.53 (3), 277–284. 10.1016/j.jcs.2011.01.008
80
HuangX. Q.CloutierS.LycarL.RadovanovicN.HumphreysD. G.NollJ. S.et al (2006). Molecular detection of QTLs for agronomic and quality traits in a doubled haploid population derived from two Canadian wheats (Triticum aestivum L.). Theor. Appl. Genet.113 (4), 753–766. 10.1007/s00122-006-0346-7
81
HuebnerF. R. (1970). Comparative studies on glutenins from different classes of wheat. J. Agric. Food Chem.18 (2), 256–259. 10.1021/jf60168a006
82
IbbaM. I.KiszonasA. M.MorrisC. F. (2018). Development of haplotype-specific molecular markers for the low-molecular-weight glutenin subunits. Mol. Breed.38 (5), 68–12. 10.1007/s11032-018-0827-9
83
IbbaM. I.KiszonasA. M.SeeD. R.SkinnerD. Z.MorrisC. F. (2019). Mapping kernel texture in a soft durum (Triticum turgidum subsp. durum) wheat population. J. Cereal Sci.85, 20–26. 10.1016/j.jcs.2018.10.006
84
JarquínD.CrossaJ.LacazeX.Du CheyronP.DaucourtJ.LorgeouJ.et al (2014). A reaction norm model for genomic selection using high-dimensional genomic and environmental data. Theor. Appl. Genet.127 (3), 595–607. 10.1007/s00122-013-2243-1
85
JoppaL. R.DuC.HartG. E.HarelandG. A. (1997). Mapping gene(s) for grain protein in tetraploid wheat (Triticum turgidum L.) using a population of recombinant inbred chromosome lines. Crop Sci.37 (5), 1586–1589. 10.2135/cropsci1997.0011183X003700050030x
86
KangY. J.LeeT.LeeJ.ShimS.JeongH.SatyawanD.et al (2016). Translational genomics for plant breeding with the genome sequence explosion. Plant Biotechnol. J.14 (4), 1057–1069. 10.1111/pbi.12449
87
KiszonasA. M.MorrisC. F. (2017). Wheat breeding for quality: A historical review. Cereal Chem. J.9517–34. CCHEM-05-17-0103-FI. 10.1094/CCHEM-05-17-0103-FI
88
KorteA.FarlowA. (2013). The advantages and limitations of trait analysis with GWAS: A review. Plant Methods9 (1), 29. 10.1186/1746-4811-9-29
89
KristensenP. S.JensenJ.AndersenJ. R.GuzmánC.OrabiJ.JahoorA. (2019). Genomic prediction and genome-wide association studies of flour yield and alveograph quality traits using advanced winter wheat breeding material. Genes10 (9), 669. 10.3390/genes10090669
90
KuchelH.LangridgeP.MosionekL.WilliamsK.JefferiesS. P. (2006). The genetic control of milling yield, dough rheology and baking quality of wheat. Theor. Appl. Genet.112 (8), 1487–1495. 10.1007/s00122-006-0252-z
91
KumarA.EliasE. M.GhavamiF.XuX.JainS.MantheyF. A.et al (2013). A major QTL for gluten strength in durum wheat (Triticum turgidum L. var. durum). J. Cereal Sci.57 (1), 21–29. 10.1016/j.jcs.2012.09.006
92
KumarA.MantovaniE. E.SimsekS.JainS.EliasE. M.MergoumM. (2019). “Genome wide genetic dissection of wheat quality and yield related traits and their relationship with grain shape and size traits in an elite × non-adapted bread wheat cross,” in Plos one. Editor ZhangA., 14, e0221826. 10.1371/journal.pone.0221826
93
KumarN.Orenday-OrtizJ. M.KiszonasA. M.BoehmJ. D.MorrisC. F. (2019). Genetic analysis of a unique ‘super soft’ kernel texture phenotype in soft white spring wheat. J. Cereal Sci.85, 162–167. 10.1016/j.jcs.2018.12.003
94
KumarN.KulwalP. L.BalyanH. S.GuptaP. K. (2007). QTL mapping for yield and yield contributing traits in two mapping populations of bread wheat. Mol. Breed19 (2), 163–177. 10.1007/s11032-006-9056-8
95
KumarJ.JaiswalV.KumarA.KumarN.MirR. R. (2011). Introgression of a major gene for high grain protein content in some Indian bread wheat cultivars. Field Crops Res.123 (3), 226–233. 10.1016/j.fcr.2011.05.013
96
KumarR.MukherjeeS.AyeleB. T. (2018). Molecular aspects of sucrose transport and its metabolism to starch during seed development in wheat: A comprehensive review. Biotechnol. Adv.36(4), 954–967. 10.1016/j.biotechadv.2018.02.015
97
KuspiraJ.UnrauJ. (1957). Genetic analysis of certain characters in common wheat using chromsome substitution lines. Can. J. Plant Sci.37, 300–326. 10.4141/cjps57-037
98
KuzayS. (2019). Identification of a candidate gene for a QTL for spikelet number per spike on wheat chromosome arm 7AL by high-resolution genetic mapping. Theor. Appl. Genet.132, 17. 10.1007/s00122-019-03382-5
99
LauW. C. P.RafiiM. Y.IsmailM. R.PutehA.LatifM. A.RamliA. (2015). Review of functional markers for improving cooking, eating, and the nutritional qualities of rice. Front. Plant Sci.6, 832. 10.3389/fpls.2015.00832
100
LeiZ. S.GaleK. R.HeZ. H.GianibelliC.LarroqueO.XiaX. C.et al (2006). Y-type gene specific markers for enhanced discrimination of high-molecular weight glutenin alleles at the Glu-B1 locus in hexaploid wheat. J. Cereal Sci.43 (1), 94–101. 10.1016/j.jcs.2005.08.003
101
LiJ.CuiF.DingA.ZhaoC.WangX.WangL.et al (2012). QTL detection of seven quality traits in wheat using two related recombinant inbred line populations. Euphytica183 (2), 207–226. 10.1007/s10681-011-0448-4
102
LiY.ZhouR.WangJ.LiaoX.BranlardG.JiaJ. (2012). Novel and favorable QTL allele clusters for end-use quality revealed by introgression lines derived from synthetic wheat. Mol. Breed.29 (3), 627–643. 10.1007/s11032-011-9578-6
103
LiX.GuoT.MuQ.LiX.YuJ. (2018). Genomic and environmental determinants and their interplay underlying phenotypic plasticity. Proc. Natl. Acad. Sci.115 (26), 6679–6684. 10.1073/pnas.1718326115
104
LiW.YangB. (2017). Translational genomics of grain size regulation in wheat. Theor. Appl. Genet.130 (9), 1765–1771. 10.1007/s00122-017-2953-x
105
LiangZ.ChenK.LiT.ZhangY.WangY.ZhaoQ.et al (2017). Efficient DNA-free genome editing of bread wheat using CRISPR/Cas9 ribonucleoprotein complexes. Nat. Commun.8 (1), 14261. 10.1038/ncomms14261
106
LillemoM.MorrisC. F. (2000). A leucine to proline mutation in puroindoline b is frequently present in hard wheats from Northern Europe. Theor. Appl. Genet.100 (7), 1100–1107. 10.1007/s001220051392
107
LindgrenA.SimsekS. (2016). Evaluation of hard red spring wheat mill stream fractions using solvent retention capacity test: Solvent retention capacity of mill fractions. J. Food Process. Preserv.40 (2), 131–139. 10.1111/jfpp.12590
108
LiuY.HeZ.AppelsR.XiaX. (2012). Functional markers in wheat: Current status and future prospects. Theor. Appl. Genet.125 (1), 1–10. 10.1007/s00122-012-1829-3
109
LiuH.ZhangX.XuY.MaF.ZhangJ.CaoY.et al (2020). Identification and validation of quantitative trait loci for kernel traits in common wheat (Triticum aestivum L.). BMC Plant Biol.20 (1), 529. 10.1186/s12870-020-02661-4
110
MaW.ZhangW.GaleK. R. (2003). Multiplex-PCR typing of high molecular weight glutenin alleles in wheat. Euphytica134, 51–60. 10.1023/a:1026191918704
111
MaC.YangY.LiX.GeP.GuoG.SubburajS.et al (2013). Molecular cloning and characterization of six novel HMW-GS genes from Aegilops speltoides and Aegilops kotschyi. McIntosh Ed. Plant Breed.132 (3), 284–289. 10.1111/pbr.12046
112
MaichR. H.ManeraG. A.LonderoW. H.VanzettiL. S.HelgueraM.Di RienzoJ. A. (2020). Changes in yield determinants and quality traits in wheat after 12 cycles of recurrent selection. Cereal Res. Commun.48 (4), 533–538. 10.1007/s42976-020-00053-w
113
MannG.DiffeyS.CullisB.AzanzaF.MartinD.KellyA.et al (2009). Genetic control of wheat quality: Interactions between chromosomal regions determining protein content and composition, dough rheology, and sponge and dough baking properties. Theor. Appl. Genet.118 (8), 1519–1537. 10.1007/s00122-009-1000-y
114
McCartneyC. A.SomersD. J.LukowO.AmesN.NollJ.CloutierS.et al (2006). QTL analysis of quality traits in the spring wheat cross RL4452 x 'AC Domain'. Plant Breed.125 (6), 565–575. 10.1111/j.1439-0523.2006.01256.x
115
McLauchlanA.OgbonnayaF. C.HollingsworthB.CarterM.GaleK. R.HenryR. J.et al (2001). Development of robust PCR-based DNA markers for each homoeo-allele of granule-bound starch synthase and their application in wheat breeding programs. Aust. J. Agric. Res.52 (12), 1409. 10.1071/AR01036
116
MesfinA.FrohbergR. C.AndersonJ. A. (1999). RFLP markers associated with high grain protein from Triticum turgidum L. Var. dicoccoides introgressed into hard red spring wheat. Crop Sci.39 (2), 508–513. 10.2135/cropsci1999.0011183X003900020035x
117
MichelS.AmetzC.GungorH.AkgölB.EpureD.GrausgruberH.et al (2017). Genomic assisted selection for enhancing line breeding: Merging genomic and phenotypic selection in winter wheat breeding programs with preliminary yield trials. Theor. Appl. Genet.130 (2), 363–376. 10.1007/s00122-016-2818-8
118
MichelS.KummerC.GalleeM.HellingerJ.AmetzC.AkgölB.et al (2018). Improving the baking quality of bread wheat by genomic selection in early generations. Theor. Appl. Genet.131 (2), 477–493. 10.1007/s00122-017-2998-x
119
MohlerV.AlbrechtT.MrvaK.SchweizerG.HartlL. (2014). “Genetic analysis of falling number in three bi-parental common winter wheat populations,” in Plant breeding. Editor PillenK., 133, 448–453. 10.1111/pbr.12177
120
MonariA. M.SimeoneM. C.UrbanoM.MargiottaB.LafiandraD. (2005). Molecular characterization of new waxy mutants identified in bread and durum wheat. Theor. Appl. Genet.110 (8), 1481–1489. 10.1007/s00122-005-1983-y
121
MorrisC. F. (2002). Puroindolines: The molecular genetic basis of wheat grain hardness. Plant Mol. Biol.48, 633–647. 10.1023/a:1014837431178
122
MorrisC. F.SimeoneM. C.KingG. E.LafiandraD. (2011). Transfer of soft kernel texture from Triticum aestivum to durum wheat, Triticum turgidum ssp. durum. Crop Sci.51 (1), 114–122. 10.2135/cropsci2010.05.0306
123
NadeemM. A.NawazM. A.ShahidM. Q.DoğanY.ComertpayG.YıldızM.et al (2018). DNA molecular markers in plant breeding: Current status and recent advancements in genomic selection and genome editing. Biotechnol. Biotechnol. Equip.32 (2), 261–285. 10.1080/13102818.2017.1400401
124
NakamuraT.YamamoriM.HiranoH.HidakaS. (1993). Identification of three Wx proteins in wheat (Triticum aestivum L.). Biochem. Genet.31 (1–2), 75–86. 10.1007/BF02399821
125
NakamuraT.YamamoriM.HiranoH.HidakaS.NagamineT. (1995). Production of waxy (amylose-free) wheats. Mol. General Genet. MGG248 (3), 253–259. 10.1007/BF02191591
126
NakamuraT.VrintenP.SaitoM.KondaM. (2002). Rapid classification of partial waxy wheats using PCR-based markers. Genome45, 1150–1156. 10.1139/g02-090
127
NaraghiS. M.SimsekS.KumarA.Al RabbiS. M. H.AlamriM. S.EliasE. M.et al (2019). Deciphering the genetics of major end-use quality traits in wheat. G3 Genes|Genomes|Genetics9 (5), 1405–1427. 10.1534/g3.119.400050
128
NevoE.KorolA. B.BeilesA.TzionF. (2002). Evolution of wild emmer and wheat improvement: Population genetics, genetic resources, and genome organization of wheat’s progenitor, Triticum dicoccoides. Berlin Heidelberg: Springer-Verlag.
129
NewberryM.ZwartA. B.WhanA.MieogJ. C.SunM.LeyneE.et al (2018). Does late maturity alpha-amylase impact wheat baking quality?Front. Plant Sci.9, 1356. 10.3389/fpls.2018.01356
130
NigroD.GadaletaA.ManginiG.ColasuonnoP.MarcotuliI.GiancasproA.et al (2019). Candidate genes and genome-wide association study of grain protein content and protein deviation in durum wheat. Planta249 (4), 1157–1175. 10.1007/s00425-018-03075-1
131
OlmosS.DistelfeldA.ChicaizaO.SchlatterA. R.FahimaT.EcheniqueV.et al (2003). Precise mapping of a locus affecting grain protein content in durum wheat. Theor. Appl. Genet.107 (7), 1243–1251. 10.1007/s00122-003-1377-y
132
OsborneT. B. (1907). Proteins of wheat kernel. Washigton: Carneie Institution of Washington. 10.5962/bhl.title.26152
133
PatilR. M.OakM. D.TamhankarS. A.RaoV. S. (2009). Molecular mapping of QTLs for gluten strength as measured by sedimentation volume and mixograph in durum wheat (Triticum turgidum L. ssp durum). J. Cereal Sci.49 (3), 378–386. 10.1016/j.jcs.2009.01.001
134
PayneP. I. (1983). “Breeding for protein quantity and protein quality in seed crops,” in Seed proteins. Annual proceedings of the phytochemical society of Europe, held at versailles, september 1981., 223–253.
135
PayneP. I. (1987). Genetics of wheat storage proteins and the effect of allelic variation on bread-making quality. Plant Physiol.38, 13. 10.1146/annurev.pp.38.060187.001041
136
PayneP. I.HoltL. M.LawC. N. (1981). Structural and genetical studies on the high-molecular-weight subunits of wheat glutenin: Part 1: Allelic variation in subunits amongst varieties of wheat (Triticum aestivum). TAG. Theor. Appl. Genet. Theor. und angewandte Genet.60 (4), 229–236. 10.1007/BF02342544
137
PayneP. I.JacksonE. A.HoltL. M. (1984). The association between γ-gliadin 45 and gluten strength in durum wheat varieties: A direct causal effect or the result of genetic linkage?J. Cereal Sci.2 (2), 73–81. 10.1016/S0733-5210(84)80020-X
138
PayneP. I.HoltL. M.LawrenceG. J.LawC. N. (1982). The genetics of gliadin and glutenin, the major storage proteins of the wheat endosperm. Qual. Plant Foods Hum. Nutr.31 (3), 229–241. 10.1007/BF01108632
139
PayneP.LawrenceG. (1983). Catalogue of alleles for the complex gene loci, Glu-A1, Glu-B1, and Glu-D1 which code for high-molecular-weight subunits of glutenin in hexaploid wheat. Cereal Res. Commun.11, 8.
140
PeñaR. J. (2007). “Current and future trends of wheat quality needs,” in Wheat production in stressed environments. Developments in plant breeding. Editors BuckH. T.NisiJ. E.SalomónN. (Dordrecht: Springer Netherlands), 411–424.
141
PfliegerS.LefebvreV.CausseM. (2001). The candidate gene approach in plant genetics: A review. Mol. Breed.7, 275–291. 10.1023/a:1011605013259
142
PintoJ. G. C. P.MunaroL. B.JaenischB. R.NagaokaA. K.LollatoR. P. (2019). Wheat variety response to seed cleaning and treatment after Fusarium head blight infection. Agrosystems, Geosciences Environ.2 (1), 1–8. 10.2134/age2019.05.0034
143
PinP. A.NilssonO. (1953). The multifaceted roles of FLOWERING LOCUS T in plant development: FT, a multifunctional protein. Plant Cell Environ.35 (10), 1742–1755. 10.1111/j.1365-3040.2012.02558.x
144
PiroziM. R.MargiottaB.LafiandraD.MacRitchieF. (2008). Composition of polymeric proteins and bread-making quality of wheat lines with allelic HMW-GS differing in number of cysteines. J. Cereal Sci.48 (1), 117–122. 10.1016/j.jcs.2007.08.011
145
PolandJ. A.BrownP. J.SorrellsM. E.JanninkJ.-L. (2012). “Development of high-density genetic maps for barley and wheat using a novel two-enzyme genotyping-by-sequencing approach,” in PLoS ONE. Editor YinT., 7, e32253. 10.1371/journal.pone.0032253
146
PradhanS.BabarM. A.BaiG.KhanJ.ShahiD.AvciM.et al (2020). Genetic dissection of heat-responsive physiological traits to improve adaptation and increase yield potential in soft winter wheat. BMC Genomics21 (1), 315. 10.1186/s12864-020-6717-7
147
PrasadM.KumarN.KulwalP.RöderM.BalyanH.DhaliwalH.et al (2003). QTL analysis for grain protein content using SSR markers and validation studies using NILs in bread wheat. Theor. Appl. Genet.106 (4), 659–667. 10.1007/s00122-002-1114-y
148
ProiettiS.CaarlsL.CoolenS.Van PeltJ. A.Van WeesS. C. M.PieterseC. M. J. (2018). Genome-wide association study reveals novel players in defense hormone crosstalk in Arabidopsis: Genome-wide association mapping of hormone cross-talk genes. Plant Cell. Environ.41 (10), 2342–2356. 10.1111/pce.13357
149
QamarZ. U.BansalU. K.DongC. M.AlfredR. L.BhaveM.BarianaH. S. (2014). Detection of puroindoline (Pina-D1 and Pinb-D1) allelic variation in wheat landraces. J. Cereal Sci.60 (3), 610–616. 10.1016/j.jcs.2014.07.007
150
RaiA.Mahendru-SinghA.RaghunandanK.KumarT. P. J.SharmaP.AhlawatA. K.et al (2019). Marker-assisted transfer of PinaD1a gene to develop soft grain wheat cultivars. 3 Biotech.9 (5), 183. 10.1007/s13205-019-1717-5
151
RappM.LeinV.LacoudreF.LaffertyJ.MüllerE.VidaG.et al (2018). Simultaneous improvement of grain yield and protein content in durum wheat by different phenotypic indices and genomic selection. Theor. Appl. Genet.131 (6), 1315–1329. 10.1007/s00122-018-3080-z
152
RavelC.PraudS.MurigneuxA.LinossierL.DardevetM.BalfourierF.et al (2006). Identification of Glu-B1-1 as a candidate gene for the quantity of high-molecular-weight glutenin in bread wheat (Triticum aestivum L.) by means of an association study. Theor. Appl. Genet.112 (4), 738–743. 10.1007/s00122-005-0178-x
153
RavelC.FayeA.Ben-SadounS.RanouxM.DardevetM.DupuitsC.et al (2020). SNP markers for early identification of high molecular weight glutenin subunits (HMW-GSs) in bread wheat. Theor. Appl. Genet.133 (3), 751–770. 10.1007/s00122-019-03505-y
154
ReifJ. C.GowdaM.MaurerH. P.LonginC. F. H.KorzunV.EbmeyerE.et al (2011). Association mapping for quality traits in soft winter wheat. Theor. Appl. Genet.122 (5), 961–970. 10.1007/s00122-010-1502-7
155
RöderM. S.HuangX. -Q.BörnerA. (2008). Fine mapping of the region on wheat chromosome 7D controlling grain weight. Funct. Integr. Genomics8 (1), 79–86. 10.1007/s10142-007-0053-8
156
RimbertH.DarrierB.NavarroJ.KittJ.ChouletF.LeveugleM.et al (2018). “High throughput SNP discovery and genotyping in hexaploid wheat,” in Plos one. Editor ZhangA., 13, e0186329. 10.1371/journal.pone.0186329
157
SaitoM.KondaM.VrintenP.NakamuraK.NakamuraT. (2004). Molecular comparison of waxy null alleles in common wheat and identification of a unique null allele. Theor. Appl. Genet.108 (7), 1205–1211. 10.1007/s00122-003-1549-9
158
SaitoM.VrintenP.IshikawaG.GrayboschR.NakamuraT. (2009). A novel codominant marker for selection of the null Wx-B1 allele in wheat breeding programs. Mol. Breed.23 (2), 209–217. 10.1007/s11032-008-9226-y
159
SalentijnE. M. J.PereiraA.AngenentG. C.van der LindenC. G.KrensF.SmuldersM. J. M.et al (2007). Plant translational genomics: From model species to crops. Mol. Breed.20 (1), 1–13. 10.1007/s11032-006-9069-3
160
SandhuK.AounM.MorrisC.CarterA. (2021). Genomic selection for end-use quality and processing traits in soft white winter wheat breeding program with machine and deep learning models. Biology10 (7), 689. 10.3390/biology10070689
161
SandhuK. S.PatilS. S.AounM.CarterA. H. (2022). Multi-trait multi-environment genomic prediction for end-use quality traits in winter wheat. Front. Genet.13, 831020. 10.3389/fgene.2022.831020
162
SapkotaS.HaoY.JohnsonJ.LopezB.BlandD.ChenZ.et al (2019). Genetic mapping of a major gene for leaf rust resistance in soft red winter wheat cultivar AGS 2000. Mol. Breed.39 (1), 8. 10.1007/s11032-018-0909-8
163
International Rice Genome Sequencing Project and Sasaki,2005International Rice Genome Sequencing Project, and SasakiT. (2005). The map-based sequence of the rice genome. Nature436 (7052), 793–800. 10.1038/nature03895
164
SaxK. (1923). The association of size differences with seed-coat pattern and pigmentation in phaseolus vulgaris. Genetics8 (6), 552–560. 10.1093/genetics/8.6.552
165
SchnableP. S.WareD.FultonR. S.SteinJ. C.WeiF.PasternakS.et al (2009). The B73 maize genome: Complexity, diversity, and dynamics. Science326 (5956), 1112–1115. 10.1126/science.1178534
166
SehgalD.MondalS.GuzmanC.Garcia BarriosG.FrancoC.SinghR.et al (2019). Validation of candidate gene-based markers and identification of novel loci for thousand-grain weight in spring bread wheat. Front. Plant Sci.10, 1189. 10.3389/fpls.2019.01189
167
SengarR. S.SinghA. (Editors) (2018). Eco-friendly agro-biological techniques for enhancing crop productivity (Singapore: Springer Singapore).
168
ShanX.ClayshulteS. R.HaleyS. D.ByrneP. F. (2007). Variation for glutenin and waxy alleles in the US hard winter wheat germplasm. J. Cereal Sci.45 (2), 199–208. 10.1016/j.jcs.2006.09.007
169
ShewryPeter.R.HeyS. J. (2015). The contribution of wheat to human diet and health. Food Energy Secur.4 (3), 178–202. 10.1002/fes3.64
170
ShewryP. R. (2003). “Improving wheat quality: The role of biotechnology,” in Bread making: Improving quality (Cambridge: Woodhead Publishing), 168–186.
171
ShewryP. R.TathamA. S.LazzeriP. (1997). Biotechnology of Wheat Quality. J. Sci. Food Agric.73 (4), 397–406. 10.1002/(SICI)1097-0010(199704)73:4<397::AID-JSFA758>3.0.CO;2-Q
172
SimmondsN. W. (1995). The relation between yield and protein in cereal grain. J. Sci. Food Agric.67 (3), 309–315. 10.1002/jsfa.2740670306
173
SinghN. K.ShepherdK. W. (1988). Linkage mapping of genes controlling endosperm storage proteins in wheat. Theor. Appl. Genet.75, 14. 10.1007/BF00289132
174
SmithR. L.SchwederM. E.BarnettR. D. (1994). Identification of glutenin alleles in wheat and triticale using PCR‐generated DNA markers. Crop Sci.34 (5), 1373–1378. 10.2135/cropsci1994.0011183X003400050042x
175
SongG.JiaM.ChenK.KongX.KhattakB.XieC.et al (2016). CRISPR/Cas9: A powerful tool for crop genome editing. Crop J.4 (2), 75–82. 10.1016/j.cj.2015.12.002
176
SourdilleP.CadalenT.Guyomarc’hH.SnapeJ.PerretantM.CharmetG.et al (2003). An update of the Courtot x Chinese Spring intervarietal molecular marker linkage map for the QTL detection of agronomic traits in wheat. Theor. Appl. Genet.106 (3), 530–538. 10.1007/s00122-002-1044-8
177
SubediM. (2020). Developing Chenopodium ficifolium as a diploid model system relevant to genetic characterization and improvement of allotetraploid C. quinoa. Master’s thesis. New Hampshire: University of New Hampshire.
178
SubediM.NeffE.DavisT. M. (2021). Developing Chenopodium ficifolium as a potential B genome diploid model system for genetic characterization and improvement of allotetraploid quinoa (Chenopodium quinoa). BMC Plant Biol.21 (1), 490. 10.1186/s12870-021-03270-5
179
SunC.ZhangF.YanX.ZhangX.DongZ.CuiD.et al (2017). Genome-wide association study for 13 agronomic traits reveals distribution of superior alleles in bread wheat from the Yellow and Huai Valley of China. Plant Biotechnol. J.15 (8), 953–969. 10.1111/pbi.12690
180
SymesJ. K. (1965). The inheritance of grain hardness in wheat as measured by the particle size index. Aust. J. Agric. Res.16 (2), 113. 10.1071/ar9650113
181
TabbitaF.PearceS.BarneixA. J (2017). Breeding for increased grain protein and micronutrient content in wheat: Ten years of the GPC-B1 gene. J. Cereal Sci.73, 183–191. 10.1016/j.jcs.2017.01.003
182
TerasawaY.ItoM.TabikiT.NagasawaK.HattaK.NishioZ. (2016). Mapping of a major QTL associated with protein content on chromosome 2B in hard red winter wheat (Triticum aestivum L.). Breed. Sci.66 (4), 471–480. 10.1270/jsbbs.16026
183
The Arabidopsis Genome Initiative (2000). Analysis of the genome sequence of the flowering plant Arabidopsis thaliana. Nature408 (6814), 796–815. 10.1038/35048692
184
ThodayJ. M. (1961). Location of polygenes. Nature191 (4786), 368–370. 10.1038/191368a0
185
ThomasonW.GriffeyC. A.ParrishD. J.BarbeauW. E. (2019). Understanding pre-harvest sprouting of wheat. Blacksburg, Virginia: Virginia cooperative extension.
186
TranquilliG.LijavetzkyD.MuzziG.DubcovskyJ. (1999). Genetic and physical characterization of grain texture-related loci in diploid wheat. Mol. General Genet. MGG262 (4–5), 846–850. 10.1007/s004380051149
187
TsaiH.HowellT.NitcherR.MissirianV.WatsonB. (2011). Discovery of Rare Mutations in Populations: TILLING by Sequencing. Plant Physiol.156 (3), 1257–1268. 10.1104/pp.110.169748
188
TuM.LiY. (2020). Toward the genetic basis and multiple QTLs of kernel hardness in wheat. Plants9 (12), 1631. 10.3390/plants9121631
189
TurnerA. S.BradburneR. P.FishL.SnapeJ. W. (2004). New quantitative trait loci influencing grain texture and protein content in bread wheat. J. Cereal Sci.40 (1), 51–60. 10.1016/j.jcs.2004.03.001
190
UauyC.DistelfeldA.FahimaT.BlechlA.DubcovskyJ. (2006). A NAC gene regulating senescence improves grain protein, zinc, and iron content in wheat. Science314 (5803), 1298–1301. 10.1126/science.1133649
191
VanzettiL. S.PflügerL.BainottiC. T.JensenC.HelgueraM. (2010). Identification of a null allele at the wx-A1 locus in durum wheat (Triticum turgidum L. ssp. durum desf.): A novel wx-A1 null allele in durum wheat. Plant Breed.129 (6), 718–720. 10.1111/j.1439-0523.2009.01741.x
192
VarshneyR.GranerA.SorrellsM. (2005). Genomics-assisted breeding for crop improvement. Trends Plant Sci.10 (12), 621–630. 10.1016/j.tplants.2005.10.004
193
VarshneyR. K.KudapaH.PazhamalaL.ChitikineniA.ThudiM.BohraA.et al (2015). Translational genomics in agriculture: Some examples in grain legumes. Crit. Rev. Plant Sci.34 (1–3), 169–194. 10.1080/07352689.2014.897909
194
VishwakarmaM. K.MishraV. K.GuptaP. K.YadavP. S.KumarH.JoshiA. K. (2014). Introgression of the high grain protein gene Gpc-B1 in an elite wheat variety of Indo-Gangetic Plains through marker assisted backcross breeding. Curr. Plant Biol.1, 60–67. 10.1016/j.cpb.2014.09.003
195
VrintenP.NakamuraT.YamamoriM. (1999). Molecular characterization of waxy mutations in wheat. Mol. General Genet. MGG261 (3), 463–471. 10.1007/s004380050989
196
WalkowiakS.GaoL.MonatC.HabererG.KassaM. T.BrintonJ.et al (2020). Multiple wheat genomes reveal global variation in modern breeding. Nature588 (7837), 277–283. 10.1038/s41586-020-2961-x
197
WallJ. S. (1979). The role of wheat proteins in determining baking quality. Recent Adv. Biochem. Cereals275–311. Available at: https://ci.nii.ac.jp/naid/10020269251/.
198
WangL. H.ZhaoX. L.HeZ. H.MaW.AppelsR.PeñaR. J.et al (2009). Characterization of low-molecular-weight glutenin subunit Glu-B3 genes and development of STS markers in common wheat (Triticum aestivum L.). Theor. Appl. Genet.118 (3), 525–539. 10.1007/s00122-008-0918-9
199
WangL.LiG.PeñaR. J.XiaX.HeZ. (2010). Development of STS markers and establishment of multiplex PCR for Glu-A3 alleles in common wheat (Triticum aestivum L.). J. Cereal Sci.51 (3), 305–312. 10.1016/j.jcs.2010.01.005
200
WangG.LeonardJ. M.RossA. S.PetersonC. J.ZemetraR. S.Garland CampbellK.et al (2012). Identification of genetic factors controlling kernel hardness and related traits in a recombinant inbred population derived from a soft × ‘extra-soft’ wheat (Triticum aestivum L.) cross. Theor. Appl. Genet.124 (1), 207–221. 10.1007/s00122-011-1699-0
201
WangF.LiuT.LiQ.AnY.XieC.SunX.et al (2017). QTL mapping of the pasting properties of wheat flour treated by papain digestion: QTL mapping of the pasting properties. Starch - Stärke69 (3–4), 1600077. 10.1002/star.201600077
202
WeegelsP. L.HamerR. M.SchofieldJ. D. (1996). Functional Properties of Wheat Glutenin. J. Cereal Sci.23 (1), 1–17. 10.1006/jcrs.1996.0001
203
WHO (2018). Accelerating the end of hunger and malnutrition global event. Bangkok, Thailand: WHO. Available at: https://www.who.int/news-room/events/detail/2018/11/29/default-calendar/accelerating-the-end-of-hunger-and-malnutrition-global-event.
204
WieserH. (2007). Chemistry of gluten proteins. Food Microbiol.24 (2), 115–119. 10.1016/j.fm.2006.07.004
205
XuY.CrouchJ. H. (2008). Marker-assisted selection in plant breeding: From publications to practice. Crop Sci.48 (2), 391–407. 10.2135/cropsci2007.04.0191
206
YamamoriM.GuzmánC. (2013). SNPs and an insertion sequence in five Wx-A1 alleles as factors for variant Wx-A1 protein in wheat. Euphytica192 (3), 325–338. 10.1007/s10681-012-0850-6
207
YamamoriM.NakamuraT.EndoT. R.NagamineT. (1994). Waxy protein deficiency and chromosomal location of coding genes in common wheat. Theor. Appl. Genet.89 (2), 179–184. 10.1007/BF00225138
208
YangJ.ZhouY.WuQ.ChenY.ZhangP.ZhangY.et al (2019). Molecular characterization of a novel TaGL3-5A allele and its association with grain length in wheat (Triticum aestivum L.). Theor. Appl. Genet.132 (6), 1799–1814. 10.1007/s00122-019-03316-1
209
YangY.ChaiY.ZhangX.LuS.ZhaoZ.WeiD.et al (2020). Multi-locus GWAS of quality traits in bread wheat: Mining more candidate genes and possible regulatory Network. Front. Plant Sci.11, 1091. 10.3389/fpls.2020.01091
210
ZanettiS.WinzelerM.FeuilletC.KellerB.MessmerM. (2001). Genetic analysis of bread-making quality in wheat and spelt. Plant Breed.120 (1), 13–19. 10.1046/j.1439-0523.2001.00552.x
211
ZhangK.ZhangY.ChenG.TianJ. (2009). Genetic analysis of grain yield and leaf chlorophyll content in common wheat. Cereal Res. Commun.37 (4), 499–511. 10.1556/CRC.37.2009.4.3
212
ZhangY.LiuJ.XiaX.HeZ. (2014). TaGS-D1, an ortholog of rice OsGS3, is associated with grain weight and grain length in common wheat. Mol. Breed.34, 1097–1107. 10.1007/s11032-014-0102-7
213
ZhangL.LiuP.WuJ.QiaoL.ZhaoG.JiaJ.et al (2020). Identification of a novel ERF gene, TaERF8, associated with plant height and yield in wheat. BMC Plant Biol.20 (1), 263. 10.1186/s12870-020-02473-6
214
ZhangX.KarimH.FengX.LanJ.TangH.GuzmánC.et al (2022). A single base change at exon of Wx-A1 caused gene inactivation and starch properties modified in a wheat EMS mutant line. J. Sci. Food Agric.102 (5), 2012–2022. 10.1002/jsfa.11540
215
Zhang‐BiehnS.FritzA. K.ZhangG.EversB.ReganR.PolandJ. (2021). Accelerating wheat breeding for end‐use quality through association mapping and multivariate genomic prediction. Plant Genome14 (3), e20164. 10.1002/tpg2.20164
216
ZhangX.LiuG.ZhangL.XiaC.ZhaoT. (2018). Fine Mapping of a Novel Heading Date Gene, TaHdm605, in Hexaploid Wheat. Front. Plant Sci.9 , 1059. 10.3389/fpls.2018.01059
217
ZhaoX. L.XiaX. C.HeZ. H.LeiZ. S.AppelsR.YangY.et al (2007). Novel DNA variations to characterize low molecular weight glutenin Glu-D3 genes and develop STS markers in common wheat. Theor. Appl. Genet.114 (3), 451–460. 10.1007/s00122-006-0445-5
218
ZhuT.JacksonD. S.WehlingR. L.GeeraB. (2008). Comparison of amylose determination methods and the development of a dual wavelength iodine binding technique. Cereal Chem.85 (1), 51–58. 10.1094/CCHEM-85-1-0051
219
ZiY.DingJ.SongJ.HumphreysG.PengY.LiC.et al (2018). Grain yield, starch content and activities of key enzymes of waxy and non-waxy wheat (Triticum aestivum L.). Sci. Rep.8 (1), 4548. 10.1038/s41598-018-22587-0
Summary
Keywords
end-use quality, genomics-assisted breeding, quantitative trait locus mapping, marker-assisted selection, genomic selection, candidate gene approach, translational genomics, genome-wide association study
Citation
Subedi M, Ghimire B, Bagwell JW, Buck JW and Mergoum M (2023) Wheat end-use quality: State of art, genetics, genomics-assisted improvement, future challenges, and opportunities. Front. Genet. 13:1032601. doi: 10.3389/fgene.2022.1032601
Received
31 August 2022
Accepted
20 December 2022
Published
05 January 2023
Volume
13 - 2022
Edited by
Manish Kumar Pandey, International Crops Research Institute for the Semi-Arid Tropics (ICRISAT), India
Reviewed by
Waseem Hussain, International Rice Research Institute (IRRI), Philippines
Meriem Aoun, Oklahoma State University, United States
Updates
Copyright
© 2023 Subedi, Ghimire, Bagwell, Buck and Mergoum.
This is an open-access article distributed under the terms of the Creative Commons Attribution License (CC BY). The use, distribution or reproduction in other forums is permitted, provided the original author(s) and the copyright owner(s) are credited and that the original publication in this journal is cited, in accordance with accepted academic practice. No use, distribution or reproduction is permitted which does not comply with these terms.
*Correspondence: Mohamed Mergoum, mmergoum@uga.edu
ORCID: Madhav Subedi, orcid.org/0000-0001-8032-7641; Bikash Ghimire, orcid.org/0000-0002-4949-545X; James W. Buck, orcid.org/0000-0002-8093-2187; John White Bagwell, orcid.org/0000-0002-5108-1803
This article was submitted to Plant Genomics, a section of the journal Frontiers in Genetics
Disclaimer
All claims expressed in this article are solely those of the authors and do not necessarily represent those of their affiliated organizations, or those of the publisher, the editors and the reviewers. Any product that may be evaluated in this article or claim that may be made by its manufacturer is not guaranteed or endorsed by the publisher.