 Junjia Guo
 Feiyan QiLi Qin
 Maoning ZhangZiqi SunHongyan Li
 Mengjie CuiMengyuan ZhangChenyu LiXiaona LiQi ZhaoDandan LuoMengdi TianHua LiuJing XuLijuan Miao
 Bingyan HuangWenzhao Dong
 Suoyi Han*Xinyou Zhang*
- Henan Academy of Crops Molecular Breeding/Postgraduate T&R Base of Zhengzhou University/The Shennong Laboratory/Key Laboratory of Oil Crops in Huang-Huai-Hai Plains, Ministry of Agriculture/Henan Provincial Key Laboratory for Oil Crop Improvement/National Centre for Plant Breeding, Xinxiang, Henan, China
As an important factor affecting the edible quality of peanut kernels, sucrose content is a complex quantitative trait regulated by multiple factors. In this study, an F2 segregating population and a recombinant inbred line (RIL) population, derived from a cross between the high sucrose content variety Jihuatian 1 and the low sucrose content line PI478819, were used as materials to map a quantitative trait locus (QTL) associated with sucrose content in peanut kernels. Four QTLs were initially located on chromosomes A03 and A06 based on BSA-seq technology, and multiple kompetitive allele-specific PCR markers were developed based on single-nucleotide polymorphisms (SNPs) in the intervals. The markers were genotyped in the RIL population and finely mapped to a stable QTL, qSUCA06, located on chromosome A06 within a 0.29-Mb physical genomic interval (112367085–112662675 bp), which accounted for 31.95%–41.05% of the phenotypic variance explained. SNP and insertion/deletion annotations were performed on genes in the candidate interval, and having screened out those genes with mutations in exons, candidate genes were verified by qRT-PCR. The results revealed that Arahy.Y2LWD9 may be the main gene regulating sucrose content. The QTL identified in this study will not only contribute to marker-assisted breeding for improvement of peanut sucrose content but also paves the way for identifying gene function.
Introduction
Peanuts (Arachis hypogaea L.), an important oil and cash crop, are rich in vegetable oil and protein, and widely cultivated worldwide (Liu et al., 2020a). In recent years, during which there have been increases in the production and consumption of edible peanuts, increasing attention has focused on the edible quality of peanut kernels, an important index of which is sweetness. Indeed, some studies have reported correlation values of as high as 0.88 between sweetness and peanut kernel taste quality (Pattee et al., 1998). The most direct factor affecting the sweetness of peanut is the content of soluble sugars in kernels. These sugars consist primarily of sucrose, fructose, and glucose, among which, sucrose accounts for the largest proportion, and makes the largest contribution to the sweetness of peanuts (McDaniel et al., 2012). Given that peanuts with kernel sucrose contents exceeding 6% are considered to have a better taste (P), determining the main genetic loci controlling sucrose content in kernels would make a valuable contribution to enhancing the sucrose content and edible quality of peanuts.
In plants, sucrose, the main product of leaf photosynthesis, is exported to different non-photosynthetic organs according to demands for the synthesis of carbon and storage materials required for growth (Davis and Dean, 2016). Sucrose transported to the developing seeds is synthesized to yield lipid (oil) or protein storage substances under the action of a series of enzymes such as invertase. Genetic studies have shown that there are multiple factors affecting the sucrose content in kernels, including the influences of environmental factors and plant genotype (Pattee et al., 1981), maturity (Sanders and Bett, 1995), and genotype–environment interactions (Pattee et al., 2000). Furthermore, it has been established that there is a significant difference in the kernel sucrose contents of plants derived from direct and reciprocal crosses, which tends to indicate that this trait is matrilineally determined (Isleib et al., 2004). Collectively, the aforementioned findings provide evidence to indicate that the sucrose content of peanut kernels is a complex quantitative character influenced by multiple factors.
Bulked-segregant analysis (BSA) can be applied to rapidly and efficiently mine causal genes without the necessity of constructing a genetic map. The technique, which uses amplified fragment length polymorphic (AFLP) and restriction fragment length polymorphic (RFLP) markers, was initially used in lettuce and tomato (Giovannoni et al., 1991; Michelmore et al., 1991). The principle of the BSA-seq method is based on the selection of individuals in a population with bipolar characteristics to construct mixed pools, the whole genomes of which are sequenced to identify causal genes associated with traits of interest (Liu et al., 2020b). With the emergence and development of high-throughput sequencing technology, given its high efficiency, the BSA-seq method has been widely used in the analysis of important agronomic characters of soybean (Xie et al., 2021), rice (Yang et al., 2021), sesame (Sheng et al., 2021), and other crops. In peanut, this method has been used for quantitative trait gene mining for traits such as fresh seed dormancy (Kumar et al., 2020), seed coat color (Chen et al., 2021), and late leaf spot resistance (Clevenger et al., 2018; Han et al., 2022).
In this study, using peanut genotypes Jihuatian one and PI478819 as parental plants, we used a combination of BSA-seq and kompetitive allele-specific PCR (KASP) markers to determine the quantitative trait locus (QTL) controlling the sucrose content of peanut kernels and to predict candidate genes. Our findings will provide a theoretical basis for further elucidation of the control of sucrose content in peanuts, and thereby contribute to breeding for enhanced edible quality.
Materials and methods
Plant materials and phenotypic evaluation
In the present study, we used the peanut genotypes Jihuatian 1 and PI478819. The high-sucrose variety Jihuatian 1 is a Spanish-type cultivar developed by the Hebei Academy of Agriculture and Forestry Sciences, China, whereas the low-sucrose line PI478819 is a Virginia-type variety introduced from the United States. These germplasms were used as the female and male parents, respectively, which were crossed to obtain an F1 population. KASP molecular marker technique was used to identify true and false hybrids of F1 seeds. The KASP markers with obvious differences between parents were designed, and the genomic DNA of parents and F1 seeds were extracted and detected by KASP molecular markers. The homozygous type with the same genotype as the parent was false hybrid, and the heterozygous genotype was expressed as true hybrid (Qin et al., 2020). A subsequent F2 segregating population consisting of 831 lines was obtained by selfing. In addition, a population of recombinant inbred lines (RILs) was obtained based on single-seed descent. F2 population and parental individuals were planted on the experimental farm of Henan Academy of Agricultural Sciences in Xinxiang (Henan province) in May 2017, and a total of 251 lines of the RIL population were planted in Xinxiang (Henan), Kaifeng (Henan), and Zhumadian (Henan) in May 2021. Seeds of both the F2 and RIL populations were planted individually in holes. For the RIL population, RILs were planted in a randomized complete block design with two replications. Each RIL comprising 10 plants in one replicate was planted in a single row with inter-plant spacing of 0.2 m and inter-row spacing of 0.5 m in each of the testing environments. Crop management was conducted following regular agricultural practices (Zhang et al., 2022).
Mature pods harvested from the experimental plants were naturally sun-dried, and the sucrose contents of peanut kernels were measured using a near infra-red (NIR) spectrometer (DA7200; Perten). For measurement, we selected three replicates of approximately 20 uniform kernels, which were evenly packed into a sample cup, and NIR spectral information was collected in the wavelength range 950–1,650 nm (Qin et al., 2016).
Mixed pool construction and whole-genome resequencing
Young leaves were collected from all F2 population lines and the parent plants, from which genomic DNAs were extracted using a plant genomic DNA extraction kit (DP305-03; TianGen), followed by determination of DNA quality. On the basis of the determined sucrose contents of F2 individuals, we selected 20 plants with extremely high sucrose content and 20 with low sucrose content, the respective DNAs of which were mixed in equal quantities to give two extreme phenotypic mixed pools. DNAs from these two mixed pools and both parents were then subjected to whole-genome resequencing using the Illumina HiSeq/DNBSEQ platform in conjunction with a double-terminal 150-bp sequencing strategy. The sequencing depth was 20×, and the reference genome used was the Tifrunner_V20190521 version of cultivated peanut (https://www.peanutbase.org/).
Data analysis and filtering
For the detection of SNP and insertion/deletion (InDel) variants, we used GATK software (McKenna et al., 2010), and SnpEff software (Cingolani et al., 2012) was used to perform variant annotation and predict variant impact. In order to obtain high-quality SNPs for association analysis, the SNPs were initially filtered by removing SNP loci with multiple genotypes, and then those loci with read support values of less than 4. Parent SNP information was then used filter out those sites with different phenotypes derived from the same parent. The SNPs that remained were deemed credible.
BSA-seq analysis
SNP-index is a marker association analysis method based on differences in genotype frequencies of mixed pools (Fekih et al., 2013). The main purpose of this method is to detect significant differences in the genotype frequencies of mixed pools using Δ (SNP-index) statistics (Fekih et al., 2013). The stronger the correlation between marker SNPs and traits, the closer Δ (SNP-index) is to 1. The Euclidean distance (ED) algorithm is a method where by sequencing data is used to detect significant differences between the markers of mixed pools and to evaluate the intervals associated with traits (Hill et al., 2013). In the context of the present study, with the exception of differences in sucrose content-related sites, other sites of the two mixed pools constructed using the BSA should be relatively consistent, and consequently, the ED values of non-target sites should be approximately 0. In contrast, the higher the ED value, the greater is the difference of the marker between the two mixed pools. In this study, we used G statistics for the purpose of gene detection. The G value of each SNP is calculated according to the allele sequencing depth, and is weighted according to the physical distance of the adjacent SNP (Magwene et al., 2011). In addition, given that G values are close to the lognormal distribution, the non-parametric estimation of the zero distribution of G values can be used to estimate the p-value of each SNP (Mansfeld and Grumet, 2018). When the values of P and the false discovery rate are both less than 0.01, it is considered that this interval may be the main effect area affecting the trait of interest (i.e., sucrose content in the present study).
Associations among the Δ (SNP-index), ED, G statistics, and p values of the SNP loci were analyzed using the website https://github.com/xiekunwhy/bsa. The four methods used are all based on a 2-Mb sliding window with a step size of 10 kb, which is applied to calculate the average and smooth the map. A 99% confidence level was selected as the threshold for screening, and the window above the confidence level was defined as the area associated with sucrose content. The intervals obtained using the four correlation analysis methods were compared, and the overlapping interval was regarded as the QTL interval associated sucrose content. The genes and polymorphic sites in the candidate interval were annotated using the website https://www.peanutbase.org/.
Development of KASP markers and verification of the initial positioning results
Young leaves were collected from RIL population plants, and genomic DNAs were extracted using a plant genomic DNA extraction kit (DP305-03, TianGen). On the basis of the differential SNP information obtained for the two parents Jihuatian 1 and PI478819 in the initial mapping interval of the QTL, we designed 23 pairs of KASP primers using Primer Premier 5.0. FAM or HEX fluorescent splice sequences were attached to the 5′ ends of the primers and synthesized by the LGC Genomics company. The PCR reaction mixtures used contained the following: 1 μl of template DNA at a concentration of 50–100 ng/μl and 1 μl of a mixture of 1× Master Mix and Primer Mix. We performed LGC water bath PCR amplification, using the following amplification program: pre-denaturation at 94°C for 15 min; 10 cycles of denaturation at 94 °C and extension at 55°C–61°C for 1 min; 26 cycles of denaturation at 94°C and extension at 55°C for 1 min; and preservation at 10 °C. After the reactions were completed, the genotypes of each site were determined using the SNPline genotyping platform (Majeed et al., 2018).
QTLs for the sucrose contents in plants cultivated in each environment and at different stages of growth were detected based on the replication mean using QTL IciMapping (Li et al., 2007; Meng et al., 2015), setting the mapping step size as 1 cM and the logarithm of odds (LOD) threshold as 3.0. The QTL region of LG06 was drawn using MapChart 2.3 (Voorrips, 2002). QTLs were designated as follows: q+ the abbreviated trait name + linkage group number, or named as q+ the abbreviated trait name + linkage group number + a number designating one of multiple QTLs in a single linkage group, following the International Rules of Genetic Nomenclature (Liu et al., 2008).
Candidate gene analysis
On the basis of BSA-seq analysis and fine mapping combined with gene annotation information, we performed a preliminary determination of candidate genes. Following a previously described procedure (Pattee et al., 1974), kernel tissue were collected from both parents at 20, 35, 50, and 60 days after flowering (stages S1–S4), with three biological replicates for each period. S1 is the early development stage, S2 and S3 are the developing stages, and S4 is the seed maturity stage. Total RNA was extracted from the collected tissues using a RNAprep Pure Plant Plus Kit (DP441, TIANGEN) and the concentration and purity of the extracted RNA were examined. High-quality RNA samples were selected based on the obtained purity values and concentration values were used to determine the amount of RNA template. The isolated RNA was subsequently reversed transcribed to cDNA using a FastKing RT Kit (With gDNase) (KR116, TIANGEN), and the cDNA thus obtained was diluted with sterile double-distilled water. qPCR reaction systems were prepared according to the requirements of a PowerUp SYBR Green Master Mix kit. A Quant Studio 5 real-time quantitative PCR instrument was used to run the reactions, and the 2−ΔΔCT method was used to determine gene expression levels (Livak and Schmittgen, 2001). For each sample, we assessed three biological replicates, for each of which, we also analyzed three technical replicates. The relative expression of candidate genes at the different developmental stages of Jihuatian 1 and PI4788 was determined based on normalization analysis of the gene expression data, using the ADH3 gene as an internal reference gene (Brand and Hovav, 2010). The cDNA sequences of candidate genes and ADH3 were downloaded from the Peanutbase website (https://www.peanutbase.org/), and corresponding primers were designed using Primer Premier 5.0.
Results
Phenotypic identification of F2 and RIL populations
NIR spectrometric analysis indicated that the sucrose contents of the female parent Jihuatian 1 and male parent PI478819 were 8.96% and 3.70%, respectively. For the sucrose content of the F2 population, we obtained maximum and minimum values of 11.03% and 2.52%, respectively, with a coefficient of variation of 0.28%, (Supplementary Table S1). The sucrose content per plant in the F2 population showed continuous variation and an approximate normal distribution, which is typical of a quantitative character (Figure 1A). The sucrose content of the RIL population was measured in three environments, with mean values of 5.89%, 5.64%, and 5.91% and coefficient of variation ranging from 0.29% to 032% being obtained (Table 1). In each of the three growth environments, we detected a continuous frequency distribution of sucrose content in the RIL population, indicating that the population may contain multiple major genes or QTLs associated with the control of sucrose content (Figures 1B–D). ANOVA revealed that sucrose content is influenced by genotype, the environment, and genotype–environment interactions (Table 2).
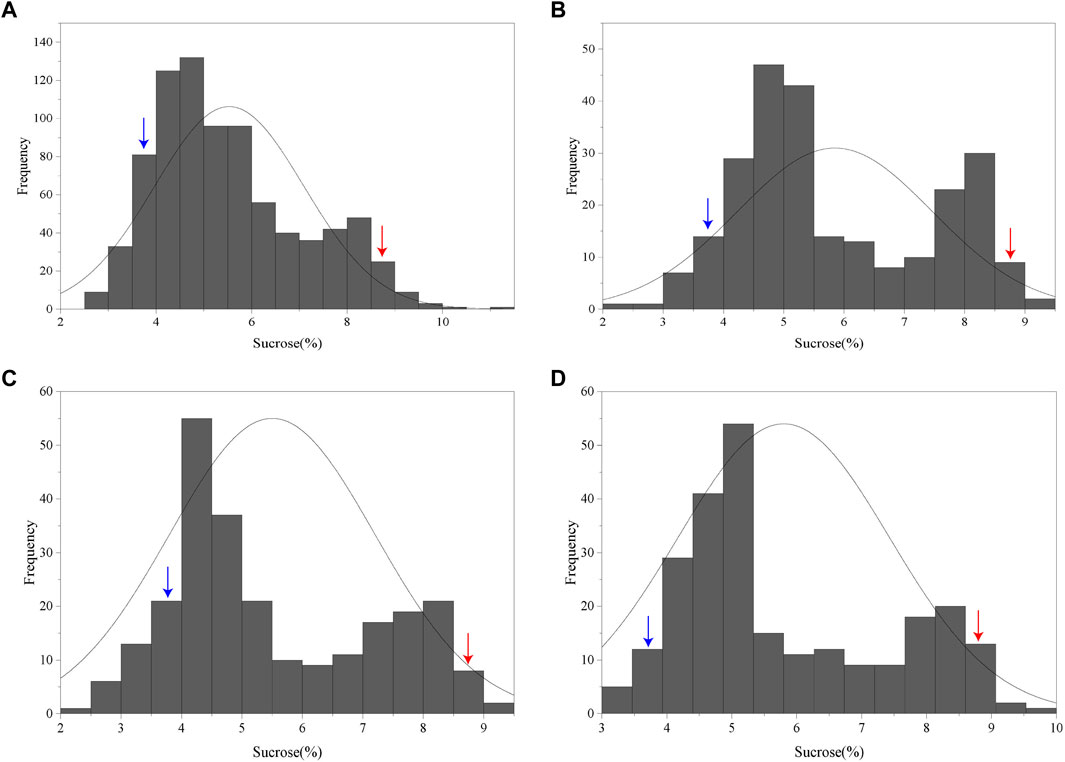
FIGURE 1. Frequency distribution of sucrose content in F2 and RIL populations of peanut (Arachis hypogaea). (A) Frequency distribution of sucrose contents in the F2 population. (B–D) Frequency distribution of sucrose content in the RIL population planted in Xinxiang, Kaifeng, and Zhumadian (Henan Province). The blue and red arrows indicate the sucrose contents of the male parent PI478819 and female parent Jihuatian 1, respectively.
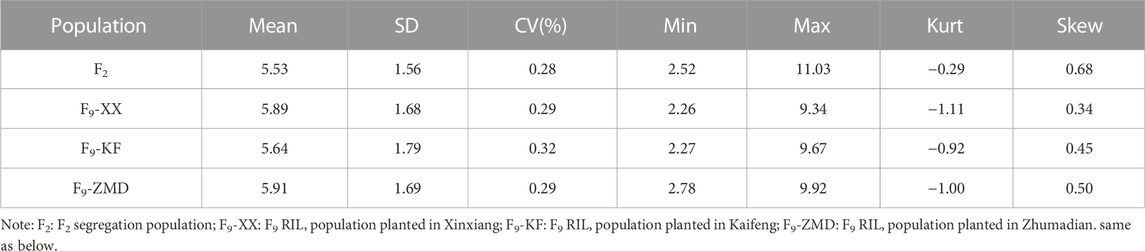
TABLE 1. Variation of sucrose content in different populations.
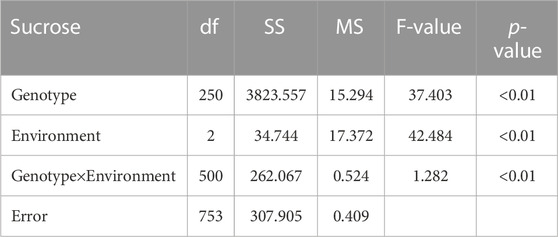
TABLE 2. Analysis of variance for sucrose content in RIL population.
Identification of candidate SNPs associated with sucrose content using BSA
Using the measured phenotype data, individuals with extreme phenotypes were used to form two mixed pools (Supplementary Table S1). The original data obtained from whole-genome re-sequencing of the two mixed pools and two parents were filtered to obtain a total of 336.63 Gbp clean reads, with a Q30 value ≥84.09%, GC content ranging from 36.66% to 38.26%, and the distribution of insert sizes showing a unimodal normal distribution. The average comparison efficiency between samples and the reference genome was 97.14%, the average sequencing depth was 32.92×, and we obtained 98.72% genome coverage (Table 3). The values of these parameters indicated the sufficiently good quality of sequencing and a high percentage matches with the peanut reference genome, thereby indicating that the obtained sequences could be used for subsequent variant detection and analysis.
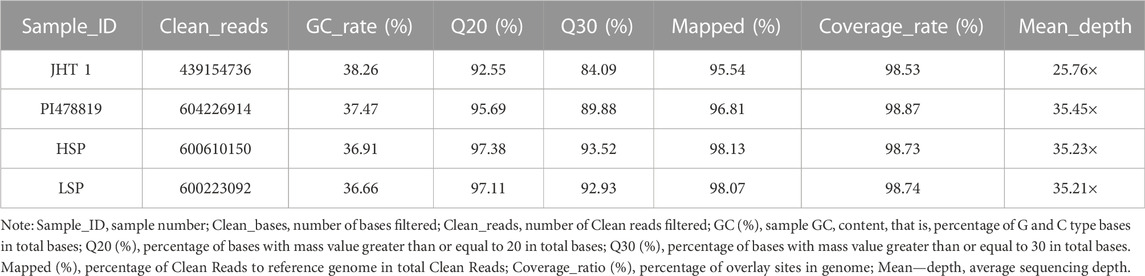
TABLE 3. Sequencing data evaluation and comparison with reference genome statistics.
Prior to bulked segregant analysis, we filtered out low-quality SNPs, and thereby finally obtained 318,057 high-quality credible SNPs. These high-quality SNPs were subjected to Δ (SNP-index) (Figure 2A), ED (Figure 2B), G-value (Figure 2C), and Fisher’s exact test (Figure 2D) association analyses, and plotted according to the chromosomal distribution of each parameter. Using a 99% confidence level as the screening threshold for associated chromosomal intervals, all four methods identified multiple candidate intervals on multiple chromosomes (Supplementary Table S2). The three overlapping intervals obtained using these four methods were identified as candidate intervals associated with peanut sucrose content (Table 4).
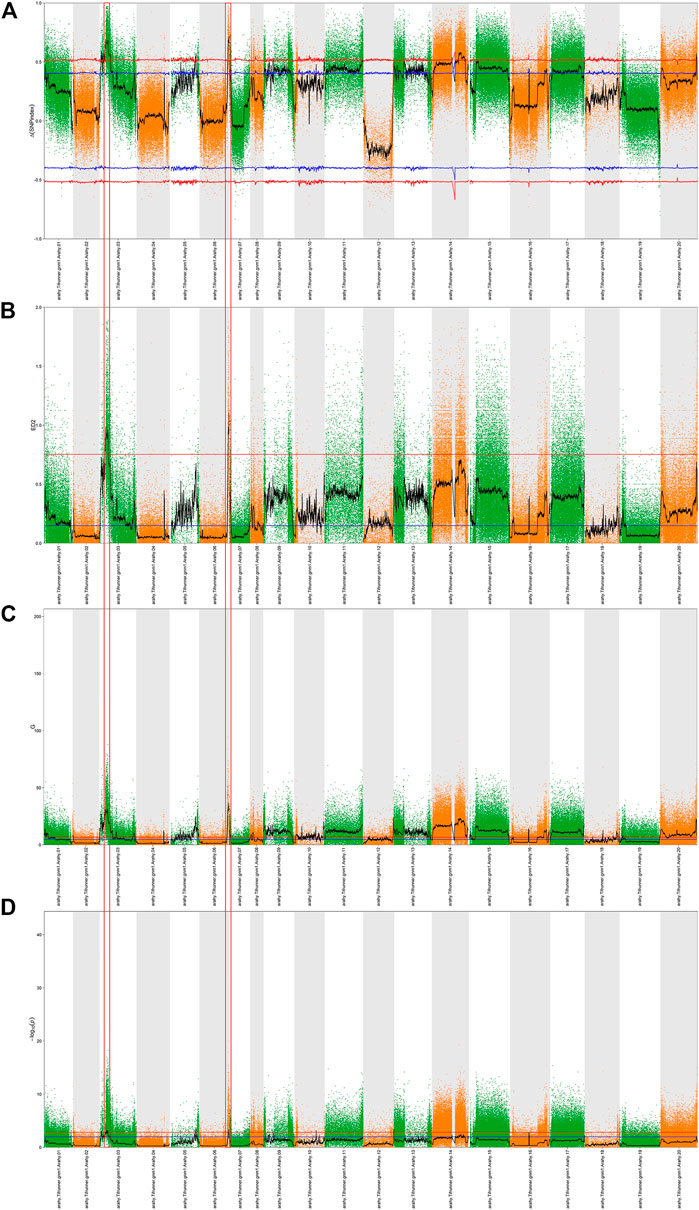
FIGURE 2. QTL analysis of sucrose based on BSA-seq. A Manhattan plot showing the distribution of Δ (SNP-index) (A), the square of the Euclidean distance (B), the distribution of G-values (C), and the distribution of -log 10 (p-values) based on Fisher’s exact tests (D) on chromosomes. The blue and red lines represent 95% and 99% confidence intervals, respectively. The black lines are average values of the four algorithms and were drawn based on sliding window analysis. The numbers on the horizontal coordinates represent the chromosome numbers. The part circled by the red box is the target region.
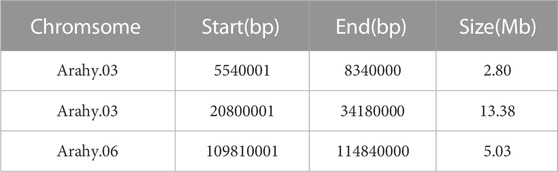
TABLE 4. Initial positioning QTL interval information.
Verification and narrowing of the positioning range
According to the different SNP information of Jihuatian 1 and PI478819 in three overlapping QTL intervals, the KASP primers were designed (Supplementary Table S3). The markers were genotyped in 251 RIL lines grown in three environments and subjected to genetic linkage analysis. The results revealed that the QTL detected in the initial mapping interval on chromosome A03 was not identified in the RIL population, indicating that this locus might be a false positive locus (Table 5). For all three assessed environments, we detected a candidate interval on chromosome A06 with phenotypic variance explained (PVE) and LOD values of 31.95%–41.05% and 28.70–44.84, respectively, which was considered to be a major QTL, which we designated qSUCA06 (Figure 3). The genetic distance of the qSUCA06 interval was 2.01 cM and the physical distance was 0.29 Mb (112367085–112662675 bp) (Table 5).
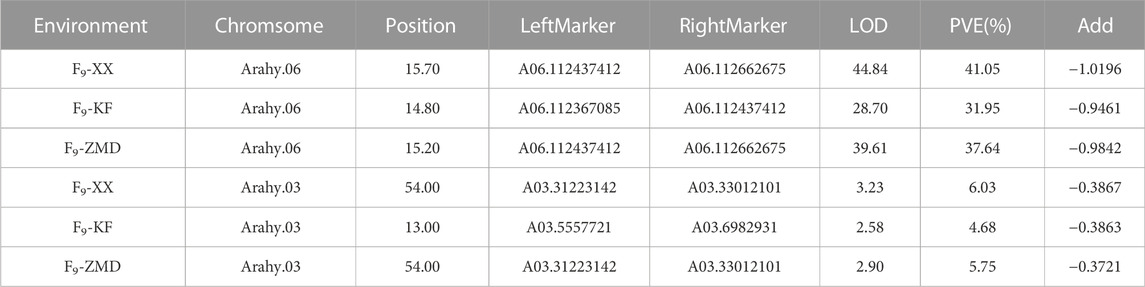
TABLE 5. QTL fine mapping of sucrose content in peanut kernels.
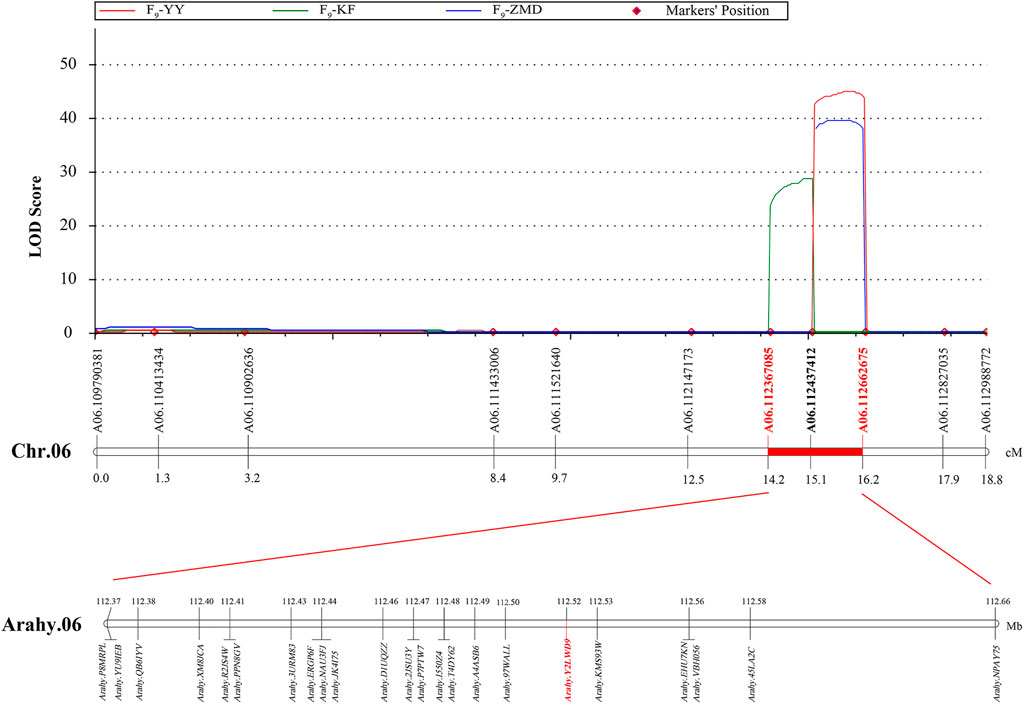
FIGURE 3. QTL fine mapping of sucrose content on peanut chromosome A06.
Candidate gene annotation and expression analysis
The total of 23 genes were identified in the qSUCA06 interval (Figure 3, Supplementary Table S4). And then we detected eight genes changed in exon regions by further amplification and identification in this interval. Among which, six and three genes characterized by SNP and InDel differences, respectively, between Jihuatian 1 and PI478819 (Supplementary Table S5). We have made in-depth functional annotation on several databases and identified two genes related to protein synthesis and metabolism, three genes related to signal transduction, two genes related to cell cycle, and one gene encoding transcription factor through the analysis of the biological process of gene expression products.
The candidate gene designated Arahy.Y2LWD9, which encodes acyl-CoA-binding domain 3 (ACBD), is a domain of acyl-CoA-binding proteins, a class of lipid transporter family proteins, which may be associated with sucrose. Given the detected correlation between Arahy.Y2LWD9 and sucrose accumulation, we analyzed the levels of Arahy.Y2LWD9 expression in the two parents. On the basis of the cDNA sequences of Arahy.Y2LWD9, we designed primers (Table 6) and performed qRT-PCR analyses of candidate genes, using ADH3 as the internal reference control (Brand and Hovav, 2010). The results showed that whereas there were no significant difference between two parents at the S1 stage of seed development with respect to the relative expression of Arahy.Y2LWD9, we detected significant differences in expression at stages S2, S3, and S4 (Figure 4). Overall, the expression of Arahy.Y2LWD9 in the two parents showed an upward trend, which was opposite to the observed accumulation of sucrose, thereby tending to indicate this gene may play a negative regulatory role in the accumulation of sucrose in peanut (Li et al., 2021).

TABLE 6. The information of primers for quantitation real-time PCR.
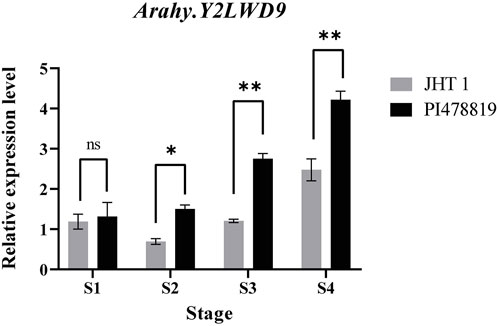
FIGURE 4. Expression analysis of a candidate gene in two parents at different growth stages (S1 to S4). Asterisks indicate a significant difference between the Jihuatian 1 (JHT 1) and PI478819 parents at each of the four growth stages, as determined using Student’s t-test (nsP > 0.05; *p < 0.05; **p < 0.01).
Discussion
Given their high nutritional value, peanuts are probably the most widely consumed type of nut. For consumers, it is desirable that peanut kernels are of high quality with a good taste, an important contributory factor of which is sucrose content, which imparts a sweet taste. In this study, using BSA-seq technology, we investigated the potential genetic mechanisms underlying the control of sucrose content of peanut. For the purposes of QTL mapping analysis, we used an F2 segregating population of 831 plants and an RIL population comprising 251 lines. Our ANOVA results revealed that the growth environment has a significant influence on the sucrose content of peanut kernels. To minimize the effect of environment on the mapping results, we cultivated the RIL population in three different locations, which also contributed to a more accurate and reliable identification of QTLs.
To date, there have been a few studies that have examined the QTLs or genes associated with sucrose content in peanut kernels. In one of these studies, the transcriptomes of two peanut cultivars with different sucrose contents were comparatively analyzed based on weighted gene correlation network analysis and qRT-PCR across multiple developmental stages, and six genes with high expression levels were finally identified in the derived RILs (Li et al., 2021). However, whereas none of the six genes reported were detected within the confidence intervals of the QTL, the QTL qSUCA06 identified in present study was found to have a negative additive effect with a PVE of 31.95%–41.05%, which accordingly tended to indicate the high probability that novel genes regulating sucrose content are located in this region.
The candidate gene Arahy.Y2LWD9 identified within the qSUCA06 QTL, which encodes acyl-CoA-binding domain 3. might be one of such gene modulating sucrose content. Previous studies have shown that ACBD is a domain of acyl-CoA-binding proteins, which play key roles in plant fat metabolism (Ye and Chye, 2016). In eukaryotic cells, these proteins are involved in the transport of acyl-CoA esters and the formation and maintenance of the cytosolic acyl-CoA pool, thereby contributing to the regulation of lipid metabolism (Guo et al., 2017). On the basis of principal component analysis, Yu et al. (2020) found that the sucrose content in peanut kernels was negatively correlated with fat content. In the present study, we detected significant differences between the two parents with respect to the expression of Arahy.Y2LWD9 during different stages of development, and that overall, there was an upward trend in expression with growth progression, which was opposite to the accumulation of sucrose. Acyl-CoA-binding proteins contain a class of highly conserved acyl coenzyme A that has been identified from rice (Meng et al., 2011), Arabidopsis thaliana (Xiao and Chye, 2009), Agave americana (Guerrero et al., 2006), and Brassica napus (Hills et al., 1994). Studies have shown that overexpression of OsACBP2 in rice can promote a significant increase in the contents of triglycerides and long-chain fatty acids in seeds (Guo et al., 2019). In view of the strong activity of Arabidopsis thaliana AtACBP6 pro::GUS in the cotyledons of developmental embryos and the accumulation of oleyl and linoleyl CoA esters in ACBP6 seedlings, it is speculated that AtACBP6, together with AtACBP4 and AtACBP5, may play a role in seed oil synthesis (Hsiao et al., 2014). Consequently, it is plausible that Arahy.Y2LWD9 indirectly regulates sucrose content by regulating lipid metabolism in peanut kernels; however, this specific function needs to be further verified based on either overexpression or loss-of-function analyses.
Conclusion
4In this study, we identified a major stable QTL, qSUCA06, for peanut sucrose content based on BSA-seq analysis and fine mapping. Within the QTL interval, we detected a candidate gene, Arahy.Y2LWD9, which was verified by qRT-PCR to be negatively corrected with peanut sucrose content. The findings of this study provide a theoretical basis for further analysis of the genetic regulation of sucrose content in peanut, and will contribute to breeding for both oil and sucrose contents, taking into consideration the requirements of industry and consumers.
Data availability statement
The datasets presented in this study can be found in online repositories. The names of the repository/repositories and accession number(s) can be found below: https://bigd.big.ac.cn/gsa/browse/CRA009024.
Author contributions
JG, XZ and SH conceived the study. JG, FQ, LQ, CL, XL, HL, DL, MT, HL, JX, LM, BH and WD collected plant materials and performed the experiments. MZ, ZS, MC, MZ and QZ participated in handling figures and tables. JG drafted the manuscript. JG, SH and XZ revised the manuscript. All authors read and approved the final manuscript.
Funding
This work was supported by National key R&D plan (2022YFD1200402), the China Agriculture Research System (CARS-13), the Major Technology Research and Development of Henan Province, China (201300111000, 221100110300) and the Henan Provincial Agriculture Research System, China (S2012-5).
Conflict of interest
The authors declare that the research was conducted in the absence of any commercial or financial relationships that could be construed as a potential conflict of interest.
Publisher’s note
All claims expressed in this article are solely those of the authors and do not necessarily represent those of their affiliated organizations, or those of the publisher, the editors and the reviewers. Any product that may be evaluated in this article, or claim that may be made by its manufacturer, is not guaranteed or endorsed by the publisher.
Supplementary material
The Supplementary Material for this article can be found online at: https://www.frontiersin.org/articles/10.3389/fgene.2022.1089389/full#supplementary-material
Abbreviations
AFLP, amplified fragment length polymorphism; ANOVA, analysis of variance; ACBP, acyl-CoA-binding protein; BSA, bulk segregation analysis; ED, Euclidean distance; GATK, The genome analysis toolkit; KASP, Kompetitive allele-specific PCR; LG, linkage group; LOD, log of odds (genetic linkage score); NIR, near infrared; PVE, phenotypic variation explained; QTL, quantitative trait locus; RIL, recombinant inbred line; qRT-PCR, quantitative real-time PCR; RFLP, restriction fragment length polymorphism.
References
Brand, Y., and Hovav, R. (2010). Identification of suitable internal control genes for quantitative real-Time PCR expression analyses in peanut (Arachis hypogaea). Peanut Sci. 37, 12–19. doi:10.3146/PS09-014.1
Chen, H., Chen, X., Xu, R., Liu, W., Liu, N., Huang, L., et al. (2021). Fine-mapping and gene candidate analysis for AhRt1, a major dominant locus responsible for testa color in cultivated peanut. Theor. Appl. Genet. 134, 3721–3730. doi:10.1007/s00122-021-03924-w
Cingolani, P., Platts, A., Wang, L. L., Coon, M., Nguyen, T., Wang, L., et al. (2012). A program for annotating and predicting the effects of single nucleotide polymorphisms, SnpEff: SNPs in the genome of Drosophila melanogaster strain w1118; iso-2; iso-3. Fly 6, 80–92. doi:10.4161/fly.19695
Clevenger, J., Chu, Y., Chavarro, C., Botton, S., Culbreath, A., Isleib, T. G., et al. (2018). Mapping late leaf spot resistance in peanut (Arachis hypogaea) using QTL-seq reveals markers for marker-Assisted selection. Front. Plant Sci. 9, 83. doi:10.3389/fpls.2018.00083
Davis, J. P., and Dean, L. L. (2016). Peanut composition, flavor and nutrition. Peanuts, 289–345. doi:10.1016/B978-1-63067-038-2.00011-3
Fekih, R., Takagi, H., Tamiru, M., Abe, A., Natsume, S., Yaegashi, H., et al. (2013). MutMap+: Genetic mapping and mutant identification without crossing in rice. PLoS One 8, e68529. doi:10.1371/journal.pone.0068529
Giovannoni, J. J., Wing, R. A., Ganal, M. W., and Tanksley, S. D. (1991). Isolation of molecular markers from specific chromosomal intervals using DNA pools from existing mapping populations. Nucleic Acids Res. 19, 6553–6558. doi:10.1093/nar/19.23.6553
Guerrero, C., Martín-Rufián, M., Reina, J. J., and Heredia, A. (2006). Isolation and characterization of a cDNA encoding a membrane bound acyl-CoA binding protein from Agave americana L. epidermis. Plant Physiol. biochem. 44, 85–90. doi:10.1016/j.plaphy.2006.01.002
Guo, Z. H., Chan, W. H. Y., Kong, G. K. W., Hao, Q., and Chye, M. L. (2017). The first plant acyl-CoA-binding protein structures: The close homologues OsACBP1 and OsACBP2 from rice. Acta Crystallogr. D. Struct. Biol. 73, 438–448. doi:10.1107/S2059798317004193
Guo, Z. H., Haslam, R. P., Michaelson, L. V., Yeung, E. C., Lung, S. C., Napier, J. A., et al. (2019). The overexpression of rice ACYL-CoA-BINDING PROTEIN2 increases grain size and bran oil content in transgenic rice. Plant J. 100, 1132–1147. doi:10.1111/tpj.14503
Han, S., Zhou, X., Shi, L., Zhang, H., Geng, Y., Fang, Y., et al. (2022). AhNPR3 regulates the expression of WRKY and PR genes, and mediates the immune response of the peanut (Arachis hypogaea L.). Plant J. 110, 735–747. doi:10.1111/tpj.15700
Hills, M. J., Dann, R., Lydiate, D., and Sharpe, A. (1994). Molecular cloning of a cDNA from Brassica napus L. for a homologue of acyl-CoA-binding protein. Plant Mol. Biol. 25, 917–920. doi:10.1007/BF00028886
Hill, J. T., Demarest, B. L., Bisgrove, B. W., Gorsi, B., Su, Y. C., and Yost, H. J. (2013). Mmappr: Mutation mapping analysis pipeline for pooled RNA-seq. Genome Res. 23, 687–697. doi:10.1101/gr.146936.112
Hsiao, A. S., Haslam, R. P., Michaelson, L. V., Liao, P., Chen, Q. F., Sooriyaarachchi, S., et al. (2014). Arabidopsis cytosolic acyl-CoA-binding proteins ACBP4, ACBP5 and ACBP6 have overlapping but distinct roles in seed development. Biosci. Rep. 34, e00165. doi:10.1042/BSR20140139
Isleib, T. G., Pattee, H. E., and Giesbrecht, F. G. (2004). Oil, sugar, and starch characteristics in peanut breeding lines selected for low and high oil content and their combining ability. J. Agric. Food Chem. 52, 3165–3168. doi:10.1021/jf035465y
Kumar, R., Janila, P., Vishwakarma, M. K., Khan, A. W., Manohar, S. S., Gangurde, S. S., et al. (2020). Whole-genome resequencing-based QTL-seq identified candidate genes and molecular markers for fresh seed dormancy in groundnut. Plant Biotechnol. J. 18, 992–1003. doi:10.1111/pbi.13266
Li, H. H., Ye, G. Y., and Wang, J. K. (2007). A modified algorithm for the improvement of composite interval mapping. Genetics 175, 361–374. doi:10.1534/genetics.106.066811
Li, W., Huang, L., Liu, N., Pandey, M. K., Chen, Y., Cheng, L., et al. (2021). Key regulators of sucrose metabolism identified through comprehensive comparative transcriptome analysis in peanuts. Int. J. Mol. Sci. 22, 7266. doi:10.3390/ijms22147266
Liu, S. B., Cai, S. B., t Graybosch, R., Chen, C. X., and Bai, G. H. (2008). Quantitative trait loci for resistance to pre-harvest sprouting in US hard white winter wheat Rio Blanco. Theor. Appl. Genet. 117, 691–699. doi:10.1007/s00122-008-0810-7
Liu, H., Sun, Z., Zhang, X., Qin, L., Dong, W., Wang, Z., et al. (2020a). QTL mapping of web blotch resistance in peanut by high-throughput genome-wide sequencing. BMC Plant Biol. 20, 249. doi:10.1186/s12870-020-02455-8
Liu, H., Zhou, F., Zhou, T., Yang, Y., and Zhao, Y. (2020b). Fine mapping of a novel male-sterile mutant showing wrinkled-leaf in sesame by BSA-Seq technology. Ind. Crops Prod. 156, 112862. doi:10.1016/j.indcrop.2020.112862
Livak, K. J., and Schmittgen, T. D. (2001). Analysis of relative gene expression data using real-time quantitative PCR and the 2(-Delta Delta C(T)) Method. Methods 25, 402–408. doi:10.1006/meth.2001.1262
Magwene, P. M., Willis, J. H., and Kelly, J. K. (2011). The statistics of bulk segregant analysis using next generation sequencing. PLoS Comput. Biol. 7, e1002255. doi:10.1371/journal.pcbi.1002255
Majeed, U., Darwish, E., Rehman, S. U., and Zhang, X. (2018). Kompetitive allele specific PCR (KASP): A singleplex genotyping platform and its application. J. Agric. Sci. (Tor). 11, 11. doi:10.5539/jas.v11n1p11
Mansfeld, B. N., and Grumet, R. (2018). QTLseqr: An R package for bulk segregant analysis with next-generation sequencing. Plant Genome 11, 180006. doi:10.3835/plantgenome2018.01.0006
McDaniel, K. A., White, B. L., Dean, L. L., Sanders, T. H., and Davis, J. P. (2012). Compositional and mechanical properties of peanuts roasted to equivalent colors using different time/temperature combinations. J. Food Sci. 77, C1293–C1299. doi:10.1111/j.1750-3841.2012.02979.x
McKenna, A., Hanna, M., Banks, E., Sivachenko, A., Cibulskis, K., Kernytsky, A., et al. (2010). The genome analysis toolkit: A MapReduce framework for analyzing next-generation DNA sequencing data. Genome Res. 20, 1297–1303. doi:10.1101/gr.107524.110
Meng, W., Su, Y. C. F., Saunders, R. M. K., and Chye, M. L. (2011). The rice acyl-CoA-binding protein gene family: Phylogeny, expression and functional analysis. New Phytol. 189, 1170–1184. doi:10.1111/j.1469-8137.2010.03546.x
Meng, L., Li, H. H., Zhang, L. Y., and Wang, J. K. (2015). QTL IciMapping: Integrated software for genetic linkage map construction and quantitative trait locus mapping in biparental populations. Crop J. 3, 269–283. doi:10.1016/j.cj.2015.01.001
Michelmore, R. W., Paran, I., and Kesseli, R. V. (1991). Identification of markers linked to disease-resistance genes by bulked segregant analysis: A rapid method to detect markers in specific genomic regions by using segregating populations. Proc. Natl. Acad. Sci. U. S. A. 88, 9828–9832. doi:10.1073/pnas.88.21.9828
Pattee, H. E., Johns, E. B., Singleton, J. A., and Sanders, T. H. (1974). Composition changes of peanut fruit parts during maturation1. Peanut Sci. 1, 57–62. doi:10.3146/i0095-3679-1-2-6
Pattee, H. E., Young, C. T., and Giesbrecht, F. G. (1981). Seed size and storage effects on carbohydrates of peanuts. J. Agric. Food Chem. 29, 800–802. doi:10.1021/jf00106a028
Pattee, H. E., Isleib, T. G., and Giesbrecht, F. G. (1998). Variation in intensity of sweet and bitter sensory attributes across peanut genotypes1. Peanut Sci. 25, 63–69. doi:10.3146/i0095-3679-25-2-2
Pattee, H. E., Isleib, T. G., Giesbrecht, F. G., and McFeeters, R. F. (2000). Investigations into genotypic variations of peanut carbohydrates. J. Agric. Food Chem. 48, 750–756. doi:10.1021/jf9910739
Qin, L., Liu, H., Du, P., Dong, W. Z., Huang, B. Y., Han, S. Y., et al. (2016). Determination of sucrose content in peanut seed kernel based on infrared spectroscopy. Chin. J. Oil Crop Sci. 38, 666–671. doi:10.7505/j.issn.1007-9084.2016.05.018
Qin, L., Liu, H., Zhang, X, Y., Du, P., Dai, X, D., Sun, Z, Q., et al. (2020). Genetic analysis of sugar content in peanut kernel via mixed major gene plus polygene inheritance model in multi-generation combined population. Chin. J. Oil Crop Sci. 43, 590–599. doi:10.19802/j.issn.1007-9084.2020185
Sanders, T. H., and Bett, K. L. (1995). Effect of harvest date on maturity, maturity distribution, and flavor of florunner peanuts. Peanut Sci. 22, 124–129. doi:10.3146/i0095-3679-22-2-10
Sheng, C., Song, S., Zhou, R., Li, D., Gao, Y., Cui, X., et al. (2021). QTL-Seq and transcriptome analysis disclose major QTL and candidate genes controlling leaf size in sesame (Sesamum indicum L.). Front. Plant Sci. 12, 580846. doi:10.3389/fpls.2021.580846
Voorrips, R. E. (2002). MapChart: Software for the graphical presentation of linkage maps and QTLs. J. Hered. 93, 77–78. doi:10.1093/jhered/93.1.77
Xiao, S., and Chye, M. L. (2009). An Arabidopsis family of six acyl-CoA-binding proteins has three cytosolic members. Plant Physiol. biochem. 47, 479–484. doi:10.1016/j.plaphy.2008.12.002
Xie, J., Wang, Q., Zhang, Z., Xiong, X., Yang, M., Qi, Z., et al. (2021). QTL-seq identified QTL and candidate genes for two-seed pod length and width in soybean (Glycine max). Plant Breed. 140, 453–463. doi:10.1111/pbr.12920
Yang, L., Wang, J., Han, Z., Lei, L., Liu, H. L., Zheng, H., et al. (2021). Combining QTL-seq and linkage mapping to fine map a candidate gene in qCTS6 for cold tolerance at the seedling stage in rice. BMC Plant Biol. 21, 278. doi:10.1186/s12870-021-03076-5
Ye, Z. W., and Chye, M. L. (2016). Plant cytosolic Acyl-CoA-Binding proteins. Lipids 51, 1–13. doi:10.1007/s11745-015-4103-z
Yu, H., Liu, H., Erasmus, S. W., Zhao, S., Wang, Q., and van Ruth, S. M. (2020). Rapid high-throughput determination of major components and amino acids in a single peanut kernel based on portable near-infrared spectroscopy combined with chemometrics. Ind. Crops Prod. 158, 112956. doi:10.1016/j.indcrop.2020.112956
Keywords: peanut, sucrose content, BSA-seq, QTL, KASP
Citation: Guo J, Qi F, Qin L, Zhang M, Sun Z, Li H, Cui M, Zhang M, Li C, Li X, Zhao Q, Luo D, Tian M, Liu H, Xu J, Miao L, Huang B, Dong W, Han S and Zhang X (2023) Mapping of a QTL associated with sucrose content in peanut kernels using BSA-seq. Front. Genet. 13:1089389. doi: 10.3389/fgene.2022.1089389
Received: 04 November 2022; Accepted: 28 November 2022;
Published: 04 January 2023.
Edited by:
Mahendar Thudi, Dr. Rajendra Prasad Central Agricultural University, IndiaReviewed by:
Lixian Qiao, Qingdao Agricultural University, ChinaDongmei Bai, Shanxi Academy of Agricultural Sciences, China
Copyright © 2023 Guo, Qi, Qin, Zhang, Sun, Li, Cui, Zhang, Li, Li, Zhao, Luo, Tian, Liu, Xu, Miao, Huang, Dong, Han and Zhang. This is an open-access article distributed under the terms of the Creative Commons Attribution License (CC BY). The use, distribution or reproduction in other forums is permitted, provided the original author(s) and the copyright owner(s) are credited and that the original publication in this journal is cited, in accordance with accepted academic practice. No use, distribution or reproduction is permitted which does not comply with these terms.
*Correspondence: Xinyou Zhang, aGFhc3pAMTI2LmNvbQ==; Suoyi Han, c3VveWlfaGFuQDEyNi5jb20=