 Dong Chen
 Yanjuan Li
- College of Electrical and Information Engineering, Quzhou University, Quzhou, China
The major histocompatibility complex (MHC) is a large locus on vertebrate DNA that contains a tightly linked set of polymorphic genes encoding cell surface proteins essential for the adaptive immune system. The groups of proteins encoded in the MHC play an important role in the adaptive immune system. Therefore, the accurate identification of the MHC is necessary to understand its role in the adaptive immune system. An effective predictor called PredMHC is established in this study to identify the MHC from protein sequences. Firstly, PredMHC encoded a protein sequence with mixed features including 188D, APAAC, KSCTriad, CKSAAGP, and PAAC. Secondly, three classifiers including SGD, SMO, and random forest were trained on the mixed features of the protein sequence. Finally, the prediction result was obtained by the voting of the three classifiers. The experimental results of the 10-fold cross-validation test in the training dataset showed that PredMHC can obtain 91.69% accuracy. Experimental results on comparison with other features, classifiers, and existing methods showed the effectiveness of PredMHC in predicting the MHC.
Introduction
As a large locus on vertebrate DNA, the major histocompatibility complex (MHC) contains a tightly linked set of polymorphic genes encoding cell surface proteins that are essential for immune surveillance. These cell surface proteins are called MHC molecules (Kubiniok et al., 2022). MHC molecules are classified into MHC class I, MHC class II, and MHC class III according to variation in molecular structure, function, and distribution (Marcoux et al., 2021). MHC class I molecules are expressed in all nucleated cells and platelets—essentially all cells except red blood cells, which display antigens to signal cytotoxic T lymphocytes, including clusters of differentiation (CD8+) (McShan et al., 2021). MHC class II molecules are expressed in antigen-presenting cells, such as B cells, dendritic cells, and macrophages, where they normally bind to CD4+ receptors on helper T cells to clear foreign antigens. MHC class III genes are interleaved with class I and class II genes on the short arm of chromosome 6, but their proteins play different physiological roles.
MHC molecules are cell surface glycoproteins with a three-dimensional structure and are of vital importance to infection, autoimmunity, transplantation, and tumor immunotherapy. MHC-binding prediction plays an important role in identifying potential novel therapeutic strategies. Mahoney et al. (2021) pointed out that MHC phosphopeptides can be considered potential immunotherapeutic targets for cancer and other chronic diseases. Therefore, many scholars carried out a lot of research work on MHC-binding prediction. The first computational method (Altuvia et al., 1995) to uncover the MHC-binding peptide was developed by Altuvia et al., which is based on protein structure and is further improved to distinguish candidate peptides that bind to hydrophobic binding pockets of the MHC molecules (Altuvia et al., 1997). The SVRMHC (Liu et al., 2006) is an MHC-binding peptide model which encoded peptides with physicochemical properties and trained support vector machines to construct a prediction model on mice. NetMHC-3.0 (Lundegaard et al., 2008) is a web server with high performance for predicting peptide binders based on artificial neural networks. Boehm et al. proposed a method named ForestMHC (Boehm et al., 2019) to identify immunogenic peptides. ForestMHC encoded a peptide sequence with physicochemical properties and trained a random forest classifier to construct an identification model. Saxena et al. (2020) predicted the binding potential of peptides to the MHC, which is critical for designing peptide-based therapeutics, using a deep learning model named OnionMHC. In consideration of the importance of structural information, the OnionMHC represents peptides with its sequence and structure-based features for peptide-HLA-A*02:01 binding predictions. (Lv et al., 2020) Jiang et al. (2021) gave a comprehensive review of the state-of-the-art literature on MHC-binding peptide prediction and an in-depth evaluation of feature representation methods, prediction models, and model training strategies on benchmark datasets. Based on the limitation of only handling peptide sequences with fixed length, Jiang et al. proposed a novel variable-length MHC-binding prediction model named BVLSTM-MHC. Experimental results on an independent validation dataset showed that BVLSTM-MHC has better performance than the ten mainstream prediction tools.
Scientists are devoted to discover MHC molecules in various vertebrate genomes. Hopkins et al. (1986) described a rat monoclonal antibody which can recognize MHC class II antigens in sheep and seems to recognize determinants which are nonpolymorphic. Moreover, based on the antibody, the distribution of sheep class II molecules is investigated, and the class II- expression variations by cells in efferent lymph and peripheral is also investigated. Westbrook et al. (2015) combined the SMRT sequencing technology and CCS and introduced and validated the technology of SMRT-CCS on identifying class I transcripts in Mauritian-origin cynomolgus macaques. Furthermore, SMRT-CCS was applied to characterize 60 new full-length class I transcriptional sequences expressed in the Chinese cynomolgus monkey population. By using pyrosequencing with high-resolution and Sanger sequencing technology, Shiina et al. (2015) genotyped 127 unrelated animals and identified 112 different alleles. Moreover, the International Society for Animal Genetics (ISAG) standardized the nomenclature and established the IPD-MHC database which is used to scientifically manage the MHC allele sequences and genes from nonhuman organisms (Giuseppe et al., 2017; Maccari et al., 2018; Ali et al., 2021; Burton et al., 2021; Karcioglu and Bulut, 2021; Roy et al., 2021; Safaei et al., 2021; Wang et al., 2021).
At early stages, the research studies related to the MHC are developed based on mice experiments. With the availability of a large amount of data and development of machine learning, developing a machine learning–based model to research the MHC was feasible. Li et al. (2019) proposed an identification method of the MHC based on an extreme learning machine algorithm. Although high accuracy has been achieved, there are still many aspects worthy of further investigation (Lv et al., 2019; Lv et al., 2021a; Lv et al., 2021b). In this study, we aim to propose a new MHC predictor, PredMHC, to further improve prediction performance.
Materials and Methods
Framework of PredMHC
In this study, we introduced a novel MHC predictor named PredMHC, the framework of which is shown in Figure 1. First, PredMHC encoded a protein sequence with mixed features including 188D, APAAC, KSCTriad, CKSAAGP, and PAAC. Second, three classifiers including SGD, SMO, and random forest were trained on the mixed features of protein sequence. Finally, the prediction result was obtained by the voting of the three classifiers. We will introduce the datasets, feature extraction, and classifiers in detail in the following section.
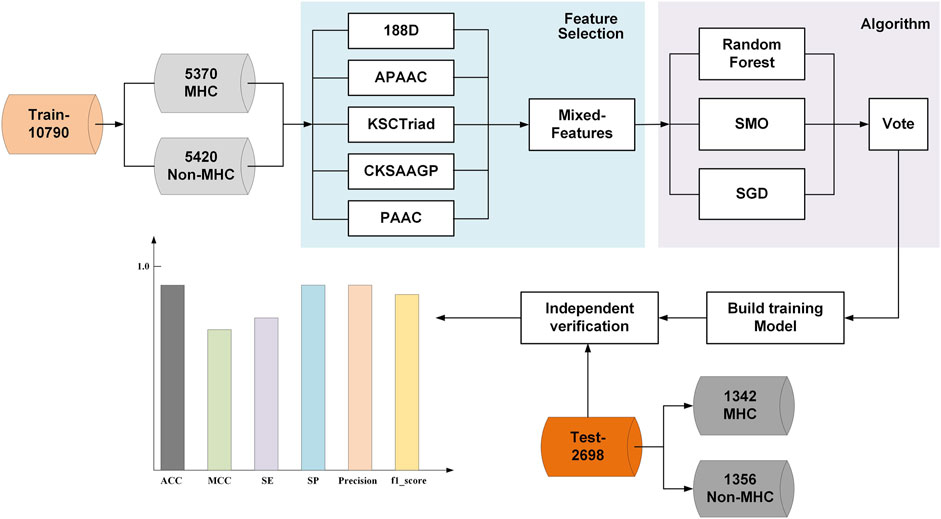
FIGURE 1. Framework of PredMHC.
Dataset
The dataset constructed by Li et al. (2019) is used in this study. A web server called ELM-MHC was developed by Li et al., from which the dataset can be downloaded. The reason that we used the same dataset as ELM-MHC is as follows. First, the dataset is constructed by searching for MHC sequences on the Uniprot database, and it is reliable. Second, the dataset is used cd-hit to de-duplication processing. The protein sequences are clustered based on the parameter setting, and the sequence with the maximum length in every cluster is used as a representative sequence. The redundant and homology-biased sequences are removed in this dataset. Finally, the most important inference was that we can fairly compare with the existing method by using the same dataset. The final dataset contained 13,488 protein sequences, which consists of 6,712 MHC protein sequences (positive examples) and 6,776 nonMHC protein sequences (negative examples). All protein sequences were divided into two groups: 10,790 sequences as a set of 10-fold cross-validation and 2,698 sequences as a set of independent validation. The training dataset (Train-10790) comprised 5,370 MHC protein sequences and 5,420 nonMHC protein sequences, all randomly selected from the set of positive and negative examples, respectively. They were then further randomly divided into five sets for the input of 10-fold cross-validation. The independent testing dataset (Test-2698) contained 1,342 positive and 1,356 negative examples.
Feature Extraction
To classify a protein sequence into different categories using the machine learning method, the first step is to encode the protein sequence with features. A feature that can effectively discriminate positive examples from negative examples can greatly improve the prediction performance of the model. In this study, we try to encode protein sequences with mixed features including 188D, APAAC, KSCTriad, CKSAAGP, and PAAC. The mixed features can represent a protein sequence from different prospectives; thus, it can better distinguish different protein sequences.
SVMProt-188D
SVMProt-188D is a feature extraction method based on the amino acid composition and physicochemical properties (Dubchak et al., 1995; Saxena et al., 2021). It encodes each protein sequence as a 188-dimensional feature vector. The first 20 features are the frequencies of the 20 amino acids (A, C, D, E, F, G, H, I, K, L, M, N, P, Q, R, S, T, V, W, and Y in alphabetical order) occurring in the sequence. The formula is defined as
where Ni denotes the number of the ith amino acid in the protein sequence and L denotes the length of a sequence. Obviously,
The latter dimensions are correlated with eight physicochemical properties, namely, hydrophobicity, normalized Van der Waals volume, polarity, polarizability, charge, surface tension, secondary structure, and solvent accessibility. Each physicochemical property consists of 21 numbers. In detail, each property consists of three descriptors, composition (C), transition (T), and distribution (D). C indicates the proportion of amino acids with specific physicochemical properties to all amino acids, and the dimension of C is 3; T represents the percentage frequency of amino acids with a specific property behind amino acids with another property, and its dimension is 3; and D represents the proportions of the chain length of 0, 25, 50, 75, and 100% amino acids with a specific property, and its dimension is 8. Therefore, after analyzing the composition and eight physicochemical properties of amino acids, we can obtain a total of 20+(3 + 5+8)×8 = 188 features.
Amphiphilic Pseudo Amino Acid Composition
The concept of amphiphilic pseudo amino acid composition (APAAC), originally proposed by Chou (Chou, 2005; Lv et al., 2021a; Awais et al., 2021; Naseer et al., 2021; Yan et al., 2021), is an effective protein descriptor and has been applied for diverse protein sequence analysis. APAAC is different from traditional AAC. It can incorporate a partial sequence-order effect by using the hydrophobicity and hydrophilicity of the constituent amino acids in a protein. For the convenience of the readers, we will briefly introduce the concept of APAAC. Let R1R2R3...RL be a protein sequence with length L, where R1 denotes the residue at position 1, R2 denotes the residue at positon 2, and so forth. According to the definition of APAAC, a protein can be denoted as a vector P with dimension (20+2λ). Vector P is defined as follows.
where P1, P2, … , P20 in Eq. 1 represent the classic AAC and the next 2λ discrete numbers describe the sequence correlation factor.
K-Spaced Conjoint Triad
The k-spaced conjoint triad (KSCTriad) (Chao et al., 2018; Zhen et al., 2020) is an effective protein descriptor and has been comprehensively applied for diverse biological sequence analyses. Different from the conjoint triad descriptor, KSCTriad not only calculates the number of three continuous amino acid units but also incorporates the continuous amino acid units that are separated by any k-residues.
Composition of K-Spaced Amino Acid Group Pairs
The composition of k-spaced amino acid pairs (CKSAAP) (Chen et al., 2010; Ahmad et al., 2021; Akbar et al., 2021; Al-Qazzaz et al., 2021; Alar and Fernandez, 2021; Alim et al., 2021; Buriro et al., 2021) method describes the order-related information of the protein sequence, which takes the occurrence frequency of two amino acids separated by k-residues in the sequence as a feature element. The protein contains 20 amino acids; thus, a 400-dimensional feature vector can be obtained for each interval. The composition of k-spaced amino acid group pairs (CKSAAGP) is a variation of the CKSAAP method. The 20 amino acids can be classified into five groups based on the chemical properties of their side chains: the aliphatic group, aromatic group, positive charged group, negative charged group, and uncharged group. The CKSAAGP method is based on the frequency of the two groups separated by a k-spaced amino acid.
Pseudo-Amino Acid Composition
The conventional amino acid composition is defined in a 20-D space, and each dimension represents the frequency of the occurrence of one of the 20 native amino acids. Different from the conventional amino acid protein composition, the pseudo-amino acid composition (Chou, 2001; Awais et al., 2021), which is a vector with 20+λ discrete components, will contain much more sequence-order and sequence-length information. According to the concept of pseudo-amino acid composition, the feature is given by
where the first 20 components are the occurrence frequencies of the 20 amino acids in the protein which is the same as in the conventional amino acid composition, while the additional components p20+1 … p20+λ are the sequence-order correlation factors of the different ranks.
Classifier
To obtain better classification results, we adopted the voting of three base classifiers as the final classification result. The three classifiers were, respectively, random forest, SMO, and SGD. The three classifiers are popular and have been successfully used in bioinformatics many times.
Random forest is an ensemble classifier based on the decision tree algorithm proposed by Breiman in 2001 (Breiman, 2001). To solve regression or classification tasks, random forests construct many decision trees by extracting subsets from all the samples through the bootstrap technique and obtain the prediction result by voting on these decision trees. Random forests are widely used in bioinformatics because of their low computational overhead and ability of handling unbalanced data.
The support vector machine (SVM) (Hearst et al., 1998) is a well-known machine learning algorithm that completes various classification tasks by constructing a separating hyperplane in the high-dimensional space. However, the training speed of support vector machines is heavily influenced by data size. To solve this problem, the sequential minimum optimization (SMO) (Platt, 1999) algorithm was proposed, which decomposes large quadratic programming problems (OPs) of an original SVM into a series of the smallest possible QP problems. Moreover, the solution process of SMO needs no additional matrix storage, thus saving both time and space costs.
The goal of the stochastic gradient descent (SGD) algorithm is to find a path that leads to optimal result. When using this algorithm, the parameter values are first initialized, and then these values are continuously changed until the target function converges. The SGD algorithm is widely used to process large-scale sparse data, such as text classification tasks.
Measurement
To evaluate the performance of the proposed method, we introduced four indicators commonly used in bioinformatics: sensitivity (SE), specificity (SP), accuracy (ACC), and Matthew’s correlation coefficient (MCC). The formulae of these indicators are as follows (Zhang et al., 2021a; Lv et al., 2021b; Zhang et al., 2021b; Zhang et al., 2021c; Zhang et al., 2021d; Zhang et al., 2021e; Zhao et al., 2021; Zhu et al., 2021; Zou et al., 2021; Zhao et al., 2022).
where TP is an abbreviation for true positives, representing the number of MHC proteins predicted in positive examples; FP is an abbreviation for false positives, representing the number of MHC proteins predicted in negative examples; TN is an abbreviation for true negatives, representing nonMHC proteins predicted in negative examples; and FN is an abbreviation for false negatives and indicates the number of predicted nonMHC proteins in positive examples. SE and SP represent the predictive accuracy of the model in positive and negative samples, respectively. Both ACC and MCC represent the overall performance of the model. For all the aforementioned metrics , the higher the score they get the better the performance of the model.
Result and Discussion
Cross-Validation Results of Train-10790
In many experiments, we tried a variety of methods to extract highly recognizable features from protein sequences in the training set and used several algorithms to train the model to achieve optimal accuracy. The experimental comparison results of different features are explained in Performance of Different Features on Cross-Validation, and the experimental comparison results of different classifiers are explained in Performance of Different Classifiers on Cross-Validation.
Performance of Different Features on Cross-Validation
Using the voting of random forest, SMO, and SGD as the classification model, we first tried 188D, APAAC, KSCTriad, CKSAAGP, PAAC, and their combinations. Table 1 shows the performance of the five single features and several combinations of features with good performance in the 10-fold cross-validation. As shown in Table 1, according to the indexes MCC and ACC, the mixed features proposed in this study have the highest score; thus, our method has better overall performance. According to the indicator of SE, the feature of APAAC has the highest score, whereas its value of ACC, MCC, and SP is lower; it verifies that the feature of APAAC was bias to classify a protein into the MHC protein. Similar to APAAC, PAAC also has higher value on the indicator SE and lower value on other indicators. Therefore, from the overall perspective, our method obviously performs better than all other methods.
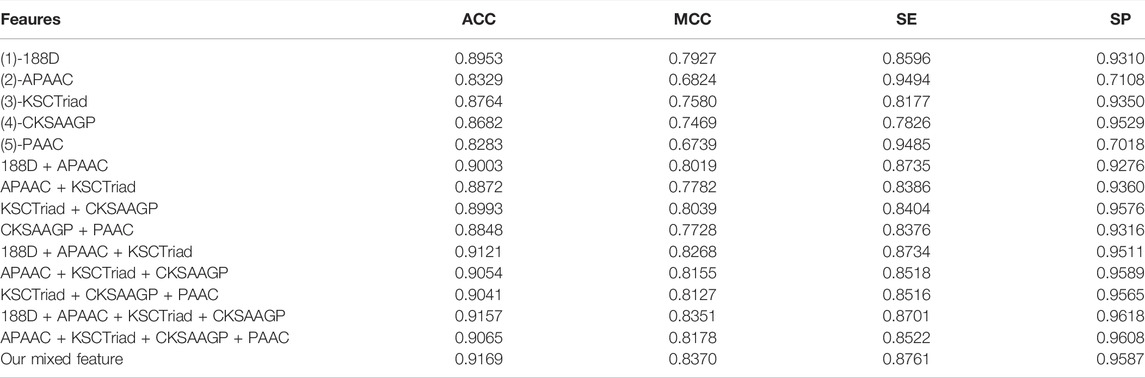
TABLE1. Result of different features on Train-10790.
Performance of Different Classifiers on Cross-Validation
To verify the performance of our used classifier, we compared the classifier used in this study with other classifiers. Table 2 shows the experimental results. As shown in Table 2, the voting of SGD, SMO, and random forest used in our identification system has better performance than other single classifiers. As shown in Table 2, our classification model has 0.9169% accuracy and 0.8370 MCC, which are higher than those of other classifiers. It verified that our classification model has better overall performance. According to the number of winning incidences, our classification wins on three indicators and has the highest number of wins. It is shown in Table 2 that the SE of our classification model was slightly lower than that of random forest. However, the values of ACC, MCC, and SP of our classification model are obviously higher than those of random forest. Therefore, from the overall perspective, our classification model obviously performs better than all other classifiers.
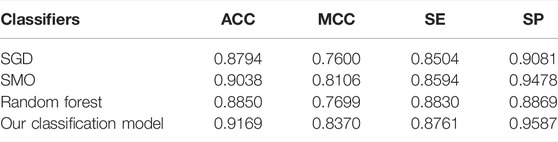
TABLE 2. Result of different classifiers on Train-10790.
Independent-Validation Results of Test-2698
To evaluate the generalization performance of the proposed model, we tested its performance on the Test-2698 dataset. In detail, we trained the model proposed in this study on the Train-10790 dataset and then computed its performance on the test-2698 dataset. The experimental results are shown in Tables 3, 4. As shown in Tables 3, 4, the feature extraction method and classifier used in this study have better performance than the other feature extraction methods and classifiers, respectively.
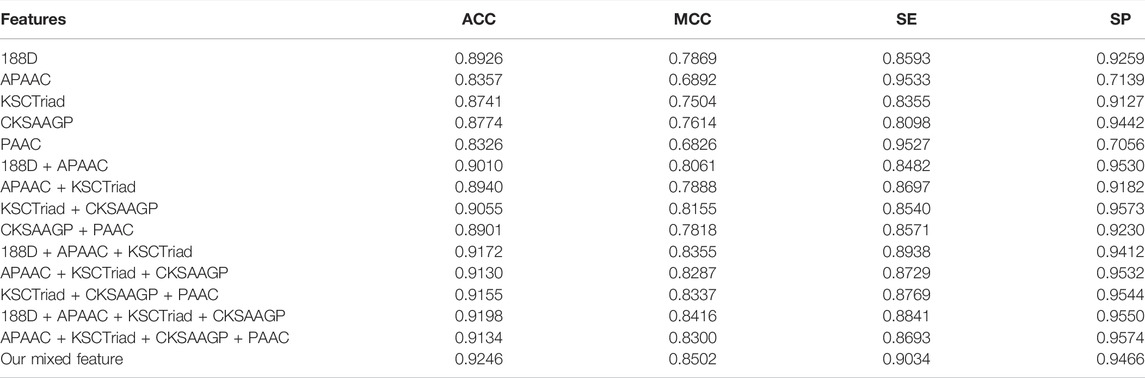
TABLE 3. Result of different features on Test-2698.
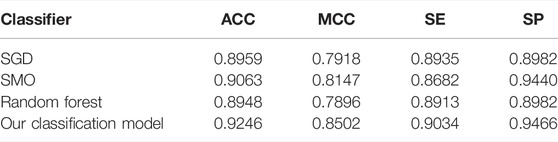
TABLE 4. Result of different classifiers on Test-2698.
Comparison With Other Predictors
To evaluate the performance of the classifier PredMHC, we compared it with ELM-MHC on the same dataset including Train-10790 and Test-2698. The comparison results on the 10-fold cross-validation are shown in Table 5. As we can see from Table 5, PredMHC has higher score than ELM-MHC on the indicators ACC, MCC, and SP. According to the number of winning incidence, PredMHC has better performance than ELM-MHC. According to ACC and MCC, PredMHC has better overall performance than ELM-MHC. Therefore, PredMHC is superior to the existing methods in the prediction of MHC protein.
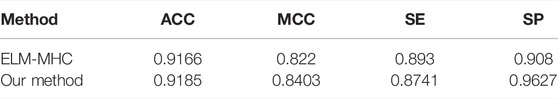
TABLE 5. Comparison of 10-fold cross-validation with the existing method on all data.
Conclusion
In this study, we proposed an efficient, reliable, and simple experimental model for predicting the MHC protein based on mixed features. After a large number of comparative experiments, we selected the mixed features of 188D, APAAC, KSCTriad, CKSAAGP, and PAAC, which showed global performance on the 10-fold cross-validation training dataset and independent test dataset. We then used the voting of SGD, SMO, and random forest to build a prediction model which also achieved the best performance on both training and test datasets. In terms of important indicators, our model obtained an MCC of 0.8370 and ACC of 0.9169 in the 10-fold cross-validation based on the Train-10790 dataset and MCC of 0.8502 and ACC of 0.9246 in the independent validation based on the Test-2698 dataset. In conclusion, we believe that our novel model provides an efficient and reliable method to screen MHCs from a large number of protein sequences. In the future, we will pay more attention to deep learning classifiers and evolution strategies (Tahoces et al., 2021; Tandel et al., 2021; Tavolara et al., 2021; Togacar, 2021; Tsiknakis et al., 2021; Turki and Taguchi, 2021; Usman et al., 2021; Vafaeezadeh et al., 2021; Wang et al., 2021; Watanabe et al., 2021; Yap et al., 2021; Yildirim et al., 2021).
Data Availability Statement
The original contributions presented in the study are included in the article/Supplementary Material, further inquiries can be directed to the corresponding author.
Author Contributions
Conceptualization, YL; data curation, DC; formal analysis, DC; project administration, DC; writing—original draft, YL; and writing—review and editing, DC.
Funding
This work was supported by the Research Start-up Funding Project of Quzhou University (BSYJ202112 and BSYJ202109), the National Natural Science Foundation of China (61901103 and 61671189), and the Natural Science Foundation of Heilongjiang Province (LH 2019F002).
Conflict of Interest
The authors declare that the research was conducted in the absence of any commercial or financial relationships that could be construed as a potential conflict of interest.
Publisher’s Note
All claims expressed in this article are solely those of the authors and do not necessarily represent those of their affiliated organizations, or those of the publisher, the editors, and the reviewers. Any product that may be evaluated in this article, or claim that may be made by its manufacturer, is not guaranteed or endorsed by the publisher.
References
Ahmad, F., Farooq, A., and Khan, M. U. G. (2021). Deep Learning Model for Pathogen Classification Using Feature Fusion and Data Augmentation. Cbio 16 (3), 466–483. doi:10.2174/1574893615999200707143535
Akbar, S., Ahmad, A., Hayat, M., Rehman, A. U., Khan, S., Ali, F., et al. (2021). iAtbP-Hyb-EnC: Prediction of Antitubercular Peptides via Heterogeneous Feature Representation and Genetic Algorithm Based Ensemble Learning Model. Comput. Biol. Med. 137, 104778. doi:10.1016/j.compbiomed.2021.104778
Al-Qazzaz, N. K., Alyasseri, Z. A. A., Abdulkareem, K. H., Ali, N. S., Al-Mhiqani, M. N., and Guger, C. (2021). EEG Feature Fusion for Motor Imagery: A New Robust Framework towards Stroke Patients Rehabilitation. Comput. Biol. Med. 137, 104799. doi:10.1016/j.compbiomed.2021.104799
Alar, H. S., and Fernandez, P. L. (2021). Accurate and Efficient Mosquito Genus Classification Algorithm Using Candidate-Elimination and Nearest Centroid on Extracted Features of Wingbeat Acoustic Properties. Comput. Biol. Med. 139, 104973. doi:10.1016/j.compbiomed.2021.104973
Ali, F., Akbar, S., Ghulam, A., Maher, Z. A., Unar, A., Talpur, D. B., et al. (2021). AFP-CMBPred: Computational Identification of Antifreeze Proteins by Extending Consensus Sequences into Multi-Blocks Evolutionary Information. Comput. Biol. Med. 139, 105006. doi:10.1016/j.compbiomed.2021.105006
Alim, A., Rafay, A., and Naseem, I. (2021). PoGB-pred: Prediction of Antifreeze Proteins Sequences Using Amino Acid Composition with Feature Selection Followed by a Sequential-Based Ensemble Approach. Cbio 16 (3), 446–456. doi:10.2174/1574893615999200707141926
Altuvia, Y., Schueler, O., and Margalit, H. (1995). Ranking Potential Binding Peptides to MHC Molecules by a Computational Threading Approach. J. Mol. Biol. 249 (2), 244–250. doi:10.1006/jmbi.1995.0293
Altuvia, Y., Sette, A., Sidney, J., Southwood, S., and Margalit, H. (1997). A Structure-Based Algorithm to Predict Potential Binding Peptides to MHC Molecules with Hydrophobic Binding Pockets. Hum. Immunol. 58 (1), 1–11. doi:10.1016/s0198-8859(97)00210-3
Awais, M., Hussain, W., Rasool, N., and Khan, Y. D. (2021). iTSP-PseAAC: Identifying Tumor Suppressor Proteins by Using Fully Connected Neural Network and PseAAC. Cbio 16 (5), 700–709. doi:10.2174/1574893615666210108094431
Boehm, K. M., Bhinder, B., Raja, V. J., Dephoure, N., and Elemento, O. (2019). Predicting Peptide Presentation by Major Histocompatibility Complex Class I: an Improved Machine Learning Approach to the Immunopeptidome. BMC Bioinformatics 20 (1), 7. doi:10.1186/s12859-018-2561-z
Buriro, A. B., Ahmed, B., Baloch, G., Ahmed, J., Shoorangiz, R., Weddell, S. J., et al. (2021). Classification of Alcoholic EEG Signals Using Wavelet Scattering Transform-Based Features. Comput. Biol. Med. 139, 104969. doi:10.1016/j.compbiomed.2021.104969
Burton, W. S., Myers, C. A., Jensen, A., Hamilton, L., Shelburne, K. B., Banks, S. A., et al. (2021). Automatic Tracking of Healthy Joint Kinematics from Stereo-Radiography Sequences. Comput. Biol. Med. 139, 104945. doi:10.1016/j.compbiomed.2021.104945
Chao, Z., Wang, C., Liu, H., Zhou, Q., Qian, L., Guo, Y., et al. (2018). Identification and Analysis of Adenine N6-Methylation Sites in the rice Genome. Nat. Plants 4 (8), 554–563. doi:10.1038/s41477-018-0214-x
Chen, K., Jiang, Y., Du, L., and Kurgan, L. (2010). Prediction of Integral Membrane Protein Type by Collocated Hydrophobic Amino Acid Pairs. J. Comput. Chem. 30 (1), 163–172. doi:10.1002/jcc.21053
Chou, K-C. (2001). Prediction of Protein Cellular Attributes Using Pseudo-amino Acid Composition. Proteins Struct. Funct. Bioinformatics 43 (3), 246–255. doi:10.1002/prot.1035
Chou, K.-C. (2005). Using Amphiphilic Pseudo Amino Acid Composition to Predict Enzyme Subfamily Classes. Bioinformatics 21 (1), 10–19. doi:10.1093/bioinformatics/bth466
Dubchak, I., Muchnik, I., Holbrook, S. R., and Kim, S. H. (1995). Prediction of Protein Folding Class Using Global Description of Amino Acid Sequence. Proc. Natl. Acad. Sci. 92 (19), 8700–8704. doi:10.1073/pnas.92.19.8700
Giuseppe, M., James, R., Keith, B., Guethlein, L. A., Unni, G., Jim, K., et al. (2017). IPD-MHC 2.0: an Improved Inter-species Database for the Study of the Major Histocompatibility Complex. Nucleic Acids Res. 45 (D1), D860. doi:10.1093/nar/gkw1050
Hearst, M. A., Dumais, S. T., and Osuna, E. (1998). Support Vector Machines: Training and Applications. IEEE Intel. Syst. App. 13 (4), 18–28.
Hopkins, J., Dutia, B. M., and Mcconnell, I. (1986). Monoclonal Antibodies to Sheep Lymphocytes. I. Identification of MHC Class II Molecules on Lymphoid Tissue and Changes in the Level of Class II Expression on Lymph-Borne Cells Following Antigen Stimulation In Vivo. Immunology 59 (3), 433
Jiang, L., Yu, H., Li, J., Tang, J., Guo, Y., and Guo, F. (2021). Predicting MHC Class I Binder: Existing Approaches and a Novel Recurrent Neural Network Solution. Brief. Bioinform. 22 (6), bbab216. doi:10.1093/bib/bbab216
Karcioglu, A. A., and Bulut, H. (2021). The WM-Q Multiple Exact String Matching Algorithm for DNA Sequences. Comput. Biol. Med. 136, 104656. doi:10.1016/j.compbiomed.2021.104656
Kubiniok, P., Marcu, A., Bichmann, L., Kuchenbecker, L., Schuster, H., Hamelin, D. J., et al. (2022). Understanding the Constitutive Presentation of MHC Class I Immunopeptidomes in Primary Tissues. Iscience 25 (2), 103768. doi:10.1016/j.isci.2022.103768
Li, Y., Niu, M., and Zou, Q. (2019). An Improved MHC Identification Method with Extreme Learning Machine Algorithm. J. proteome Res. 18 (3), 1392–1401. doi:10.1021/acs.jproteome.9b00012
Liu, W., Meng, X., Xu, Q., Flower, D. R., and Li, T. (2006). Quantitative Prediction of Mouse Class I MHC Peptide Binding Affinity Using Support Vector Machine Regression (SVR) Models. BMC Bioinformatics 7 (1), 182. doi:10.1186/1471-2105-7-182
Lundegaard, C., Lamberth, K., Harndahl, M., Buus, S., Lund, O., and Nielsen, M. (2008). NetMHC-3.0: Accurate Web Accessible Predictions of Human, Mouse and Monkey MHC Class I Affinities for Peptides of Length 8-11. Nucleic Acids Res. 36, W509–W512. doi:10.1093/nar/gkn202
Lv, Z., Ao, C., and Zou, Q. (2019). Protein Function Prediction: From Traditional Classifier to Deep Learning. Proteomics 19 (14), e1900119. doi:10.1002/pmic.201900119
Lv, Z., Cui, F., Zou, Q., Zhang, L., and Xu, L. (2021). Anticancer Peptides Prediction with Deep Representation Learning Features. Brief Bioinform 22 (5), bbab008. doi:10.1093/bib/bbab008
Lv, Z., Ding, H., Wang, L., and Zou, Q. (2021). A Convolutional Neural Network Using Dinucleotide One-Hot Encoder for Identifying DNA N6-Methyladenine Sites in the Rice Genome. Neurocomputing 422, 214–221. doi:10.1016/j.neucom.2020.09.056
Lv, Z., Wang, P., Zou, Q., and Jiang, Q. (2020). Identification of Sub-golgi Protein Localization by Use of Deep Representation Learning Features. Bioinformatics 36 (24), 5600–5609. doi:10.1093/bioinformatics/btaa1074
Maccari, G., Robinson, J., Bontrop, R. E., Otting, N., de Groot, N. G., Ho, C. S., et al. (2018). IPD-MHC: Nomenclature Requirements for the Non-human Major Histocompatibility Complex in the Next-Generation Sequencing Era. Immunogenetics 70 (10), 619–623. doi:10.1007/s00251-018-1072-4
Mahoney, K. E., Shabanowitz, J., and Hunt, D. F. (2021). MHC Phosphopeptides: Promising Targets for Immunotherapy of Cancer and Other Chronic Diseases. Mol. Cell Proteomics 20 (640), 100112. doi:10.1016/j.mcpro.2021.100112
Marcoux, G., Laroche, A., Hasse, S., Bellio, M., Mbarik, M., Tamagne, M., et al. (2021). Platelet EVs Contain an Active Proteasome Involved in Protein Processing for Antigen Presentation via MHC-I Molecules. Blood J. Am. Soc. Hematol. 138 (25), 2607–2620. doi:10.1182/blood.2020009957
McShan, A. C., Devlin, C. A., Morozov, G. I., Overall, S. A., Moschidi, D., Akella, N., et al. (2021). TAPBPR Promotes Antigen Loading on MHC-I Molecules Using a Peptide Trap. Nat. Commun. 12 (1), 3174–3218. doi:10.1038/s41467-021-23225-6
Naseer, S., Hussain, W., Khan, Y. D., and Rasool, N. (2021). NPalmitoylDeep-Pseaac: A Predictor of N-Palmitoylation Sites in Proteins Using Deep Representations of Proteins and PseAAC via Modified 5-Steps Rule. Cbio 16 (2), 294–305. doi:10.2174/1574893615999200605142828
Platt, J. C. (1999).Fast Training of Support Vector Machines Using Sequential Minimal Optimization, Advances in Kernel Methods. Support Vector Learning
Roy, S., Sharma, B., Mazid, M. I., Akhand, R. N., Das, M., Marufatuzzahan, M., et al. (2021). Identification and Host Response Interaction Study of SARS-CoV-2 Encoded miRNA-like Sequences: an In Silico Approach. Comput. Biol. Med. 134, 104451. doi:10.1016/j.compbiomed.2021.104451
Safaei, M., Sundararajan, E. A., Driss, M., Boulila, W., and Shapi'i, A. (2021). A Systematic Literature Review on Obesity: Understanding the Causes & Consequences of Obesity and Reviewing Various Machine Learning Approaches Used to Predict Obesity. Comput. Biol. Med. 136, 104754. doi:10.1016/j.compbiomed.2021.104754
Saxena, D., Sharma, A., Siddiqui, M. H., and Kumar, R. (2021). Development of Machine Learning Based Blood-Brain Barrier Permeability Prediction Models Using Physicochemical Properties, MACCS and Substructure Fingerprints. Cbio 16 (6), 855–864. doi:10.2174/1574893616666210203104013
Saxena, S., Animesh, S., Fullwood, M., and Mu, Y. (2020). OnionMHC: A Deep Learning Model for Peptide - HLA-A*02:01 Binding Predictions Using Both Structure and Sequence Feature Sets J. Micromech. Mol. Phys. 5 (03), 2050009.
Shiina, T., Yamada, Y., Aarnink, A., Suzuki, S., Masuya, A., Ito, S., et al. (2015). Discovery of Novel MHC-Class I Alleles and Haplotypes in Filipino Cynomolgus Macaques (Macaca fascicularis) by Pyrosequencing and Sanger Sequencing. Immunogenetics 67 (10), 563–578. doi:10.1007/s00251-015-0867-9
Tahoces, P. G., Varela, R., and Carreira, J. M. (2021). Deep Learning Method for Aortic Root Detection. Comput. Biol. Med. 135, 104533. doi:10.1016/j.compbiomed.2021.104533
Tandel, G. S., Tiwari, A., and Kakde, O. G. (2021). Performance Optimisation of Deep Learning Models Using Majority Voting Algorithm for Brain Tumour Classification. Comput. Biol. Med. 135, 104564. doi:10.1016/j.compbiomed.2021.104564
Tavolara, T. E., Gurcan, M. N., Segal, S., and Niazi, M. K. K. (2021). Identification of Difficult to Intubate Patients from Frontal Face Images Using an Ensemble of Deep Learning Models. Comput. Biol. Med. 136, 104737. doi:10.1016/j.compbiomed.2021.104737
Togacar, M. (2021). Detection of Segmented Uterine Cancer Images by Hotspot Detection Method Using Deep Learning Models, Pigeon-Inspired Optimization, Types-Based Dominant Activation Selection Approaches. Comput. Biol. Med. 136, 104659. doi:10.1016/j.compbiomed.2021.104659
Tsiknakis, N., Theodoropoulos, D., Manikis, G., Ktistakis, E., Boutsora, O., Berto, A., et al. (2021). Deep Learning for Diabetic Retinopathy Detection and Classification Based on Fundus Images: A Review. Comput. Biol. Med. 135, 104599. doi:10.1016/j.compbiomed.2021.104599
Turki, T., and Taguchi, Y. h. (2021). Discriminating the Single-Cell Gene Regulatory Networks of Human Pancreatic Islets: A Novel Deep Learning Application. Comput. Biol. Med. 132, 132. doi:10.1016/j.compbiomed.2021.104257
Usman, S. M., Khalid, S., and Bashir, S. (2021). A Deep Learning Based Ensemble Learning Method for Epileptic Seizure Prediction. Comput. Biol. Med. 136. doi:10.1016/j.compbiomed.2021.104710
Vafaeezadeh, M., Behnam, H., Hosseinsabet, A., and Gifani, P. (2021). A Deep Learning Approach for the Automatic Recognition of Prosthetic Mitral Valve in Echocardiographic Images. Comput. Biol. Med. 133, 104388. doi:10.1016/j.compbiomed.2021.104388
Wang, X., Wang, S., Fu, H., Ruan, X., Tang, X., and DeepFusion-Rbp, (2021). DeepFusion-RBP: Using Deep Learning to Fuse Multiple Features to Identify RNA-Binding Protein Sequences. Cbio 16 (8), 1089–1100. doi:10.2174/1574893616666210618145121
Watanabe, S., Sakaguchi, K., Murata, D., and Ishii, K. (2021). Deep Learning-Based Hounsfield Unit Value Measurement Method for Bolus Tracking Images in Cerebral Computed Tomography Angiography. Comput. Biol. Med. 137, 104824. doi:10.1016/j.compbiomed.2021.104824
Westbrook, C. J., Karl, J. A., Wiseman, R. W., Mate, S., Koroleva, G., Garcia, K., et al. (2015). No Assembly Required: Full-Length MHC Class I Allele Discovery by PacBio Circular Consensus Sequencing. Hum. Immunol. 76 (12), 891–896. doi:10.1016/j.humimm.2015.03.022
Yan, N., Lv, Z., Hong, W., and Xu, X. (2021). Editorial: Feature Representation and Learning Methods with Applications in Protein Secondary Structure. Front. Bioeng. Biotechnol. 20219 (822). doi:10.3389/fbioe.2021.748722
Yap, M. H., Hachiuma, R., Alavi, A., Brüngel, R., Cassidy, B., Goyal, M., et al. (2021). Deep Learning in Diabetic Foot Ulcers Detection: A Comprehensive Evaluation. Comput. Biol. Med. 135, 104596. doi:10.1016/j.compbiomed.2021.104596
Yildirim, K., Bozdag, P. G., Talo, M., Yildirim, O., Karabatak, M., and Acharya, U. R. (2021). Deep Learning Model for Automated Kidney Stone Detection Using Coronal CT Images. Comput. Biol. Med. 135, 104569. doi:10.1016/j.compbiomed.2021.104569
Zhang, J., Sun, Q., and Liang, C. (2021). Prediction of lncRNA-Disease Associations Based on Robust Multi-Label Learning. Cbio 16 (9), 1179–1189. doi:10.2174/1574893616666210712091221
Zhang, Q., Zhou, J., and Zhang, B. (2021). Computational Traditional Chinese Medicine Diagnosis: A Literature Survey. Comput. Biol. Med. 133, 104358. doi:10.1016/j.compbiomed.2021.104358
Zhang, S., Yuan, Z., Wang, Y., Bai, Y., Chen, B., and Wang, H. (2021). REUR: A Unified Deep Framework for Signet Ring Cell Detection in Low-Resolution Pathological Images. Comput. Biol. Med. 136, 104711. doi:10.1016/j.compbiomed.2021.104711
Zhang, Y., Duan, G., Yan, C., Yi, H., Wu, F.-X., and Wang, J. (2021). MDAPlatform: A Component-Based Platform for Constructing and Assessing miRNA-Disease Association Prediction Methods. Cbio 16 (5), 710–721. doi:10.2174/1574893616999210120181506
Zhang, Z., Yu, S., Qin, W., Liang, X., Xie, Y., and Cao, G. (2021). Self-supervised CT Super-resolution with Hybrid Model. Comput. Biol. Med. 138, 104775. doi:10.1016/j.compbiomed.2021.104775
Zhao, S., Ju, Y., Ye, X., Zhang, J., and Han, S. (2021). Bioluminescent Proteins Prediction with Voting Strategy. Cbio 16 (2), 240–251. doi:10.2174/1574893615999200601122328
Zhao, X., Du, Y., and Zhang, R. (2022). A CNN-Based Multi-Target Fast Classification Method for AR-SSVEP. Comput. Biol. Med. 141, 105042. doi:10.1016/j.compbiomed.2021.105042
Zhen, C., Pei, Z., Fuyi, L., Marquez-Lago, T. T., André, L., Jerico, R., et al. (2020). iLearn: an Integrated Platform and Meta-Learner for Feature Engineering, Machine Learning Analysis and Modeling of DNA, RNA and Protein Sequence Data. Brief. Bioinform. 21 (3), 1047–1057. doi:10.1093/bib/bbz041
Zhu, Q., Fan, Y., and Pan, X. (2021). Fusing Multiple Biological Networks to Effectively Predict miRNA-Disease Associations. Cbio 16 (3), 371–384. doi:10.2174/1574893615999200715165335
Keywords: protein classification, major histocompatibility complex, machine learning, feature extraction, identification
Citation: Chen D and Li Y (2022) PredMHC: An Effective Predictor of Major Histocompatibility Complex Using Mixed Features. Front. Genet. 13:875112. doi: 10.3389/fgene.2022.875112
Received: 13 February 2022; Accepted: 07 March 2022;
Published: 25 April 2022.
Edited by:
Quan Zou, University of Electronic Science and Technology of China, ChinaReviewed by:
Chunyu Wang, Harbin Institute of Technology, ChinaHaiying Zhang, Xiamen University, China
Copyright © 2022 Chen and Li. This is an open-access article distributed under the terms of the Creative Commons Attribution License (CC BY). The use, distribution or reproduction in other forums is permitted, provided the original author(s) and the copyright owner(s) are credited and that the original publication in this journal is cited, in accordance with accepted academic practice. No use, distribution or reproduction is permitted which does not comply with these terms.
*Correspondence: Yanjuan Li, bHlqdWFuNUAxNjMuY29t