 Duntao Su
 Zeyu Zhang
 Zhijie Xu
 Fada Xia
 Yuanliang Yan
- 1Department of General Surgery, Xiangya Hospital, Central South University, Changsha, Hunan, China
- 2Department of Clinical Laboratory, Xiangya Hospital, Central South University, Changsha, China
- 3Department of Pathology, Xiangya Changde Hospital, Changde, Hunan, China
- 4National Clinical Research Center for Geriatric Disorders, Xiangya Hospital, Central South University, Changsha, Hunan, China
Background: Emerging studies have shown the important roles of long noncoding RNAs (lncRNAs) in the occurrence and development of liver cancer. However, the exosome-related lncRNA signature in liver cancer remains to be clarified.
Methods: We obtained 371 tumor specimens and 50 normal tissues from the TCGA database. These samples were randomly divided into the training queue and verification queue. The exosome-related lncRNA risk model was verified by correlation analysis, Lasso regression analysis, and Cox regression analysis. The differences in the immune microenvironment in the two risk groups were obtained by analyzing the infiltration of different immune cells.
Results: Five exosome-related lncRNAs associated (MKLN1-AS, TMCC1-AS1, AL031985.3, LINC01138, AC099850.3) with a poor prognosis were identified and used to construct the signature. Receiver operating curve (ROC) and survival curves were used to confirm the predictive ability of this signature. Based on multivariate regression analysis in the training cohort (HR: 3.033, 95% CI: 1.762–5.220) and validation cohort (HR: 1.998, 95% CI: 1.065–3.751), the risk score was found to be an independent risk factor for patient prognosis. Subsequently, a nomogram was constructed to predict the 1-, 3-, 5-years survival rates of liver cancer patients. Moreover, this signature was also related to overexpressed immune checkpoints (PD-1, B7-H3, VSIR, PD-L1, LAG3, TIGIT and CTLA4).
Conclusion: Our study showed that exosome-related lncRNAs and the corresponding nomogram could be used as a better index to predict the outcome and immune regulation of liver cancer patients. This signature might provide a new idea for the immunotherapy of liver cancer in the future.
Background
Primary liver cancer is the sixth most diagnosed cancer and the third leading cause of death globally. Its incidence has been rising in recent years and it includes hepatocellular carcinoma (HCC) and intrahepatic cholangiocarcinoma (Sung et al., 2021). The treatment methods for liver cancer mainly include surgery, chemotherapy, and radiotherapy (Viveiros et al., 2019; Li and Chen, 2022). Although there have been breakthroughs in therapeutic strategies in recent years, the patient prognosis remains poor (Li et al., 2020). Therefore, we should classify liver cancer patients according to their specific conditions and risk score, which is more conducive to individualized precision medical treatment and improves the patient prognosis. A powerful predictor is needed to screen liver cancer patients to improve the effects of existing immunotherapy and to predict and improve the outcomes of patients.
Exosomes are microcapsules with an extracellular size of 30–100 nm released by various cells, including tumor cells and immune cells (Thakur et al., 2021). Exosomes have been proven to be related to various human diseases, including liver cancer. The latest studies showed that exosomes from HCC cells could provide favorable conditions for the proliferation, metastasis and drug resistance of HCC cells (Shen et al., 2020). In addition, liver cancer cell-derived exosomes can also be a new biomarker for the early diagnosis of HCC (Lee et al., 2019).
Long noncoding RNAs (lncRNAs) are RNAs whose length is not less than 200 nt that do not encode a protein but can regulate the level of gene expression. An increasing number of studies have shown that lncRNAs have a significant effect on the development and immune response of tumors (Zhang et al., 2021). LncRNAs are closely to liver cancer occurrence, development and prognosis (Ma et al., 2020; Xu et al., 2021). However, few studies on exosome-lncRNAs interactions in liver cancer have been reported. More importantly, constructing an exosome-related lncRNA signature could help us predict the outcome and therapeutic response of patients with liver cancer.
The aim of our study was to construct a predictive signature based on exosome-related lncRNAs. The signature could be used to explore the roles of exosome-lncRNAs in the regulation of the immune microenvironment and prognosis in liver cancer patients.
Materials and methods
Datasets and clinicopathological information acquisition
The liver cancer datasets containing RNA sequences were derived from TCGA (http://cancergenome.nih.gov/). Two patients were excluded because they did not have enough clinicopathological information. A total of 371 tumor and 50 normal tissue samples were included in our study.
Identification of exosome-related lncRNAs
According to previous studies, a total of 120 exosome related genes are shown in Supplementary Table S1 (Wang et al., 2021; Xu et al., 2022). Pearson correlation was used to explore the relationship between lncRNAs and exosome-related genes. The screening criteria for Pearson correlations were coefficient >0.5 and p < 0.001.
Development and validation of the prognostic exosome-related LncRNA signature
We randomly divided the samples into a training queue and verification queue at a ratio of 2:1. We first used the training cohort to construct a prognosis-related exosome-related lncRNA risk model, while the verification queue was used as a validation cohort. Univariate and multivariate Cox regression analyses were used to confirm the prognostic factors in HCC patients. Subsequently, least absolute shrinkage and selection operator (LASSO) regression was used to construct the exosome-related lncRNA signature. We got 5 exosome-related lncRNAs to construct the model through the “glmnet” R package. In this model, we used the following formula to calculate the patient’s risk score: risk score = expression of lncRNA1 × b1lncRNA1 + expression of lncRNA2×b2lncRNA2 +... expression of lncRNA × bnlncRNAn. We divided the two cohorts into high-risk and low-risk groups according to the median risk score. To compare the overall survival difference between the low- and highrisk groups, we used the “survminer” R package. To investigate the predictive ability of the prognostic model over time, we employed the “TimeROC” R package to show the time-dependent ROC curve. Kaplan‒Meier (K-M) survival analysis and receiver operating characteristic curve (ROC) were further used to verify the prognostic effect of the signature. A nomogram containing clinicopathological information was constructed based on the multivariate regression analysis. We used the “rms” R package to build the nomogram to predict the 1-, 3- and 5-years survival rates of HCC patients.
The mRNA‒lncRNA coexpression network
To better explain the relationship between exosome-related genes and exosome-related lncRNAs, we constructed a coexpression network to explain their potential relationship. A Sankey diagram further clarified the relationships among the lncRNAs, mRNAs, and risk types.
Gene set enrichment analysis and subsequent functional enrichment analyses
Differentially expressed genes between the groups were identified by the “limma” package with cutoff criteria of false discovery rate <0.05 and |log2foldchange| > 1. Subsequently, we uploaded differentially expressed genes to GSEA (http://www.broadinstitute.org/gsea) (Subramanian et al., 2005) for gene enrichment analysis. CIBERSORT (Barbie et al., 2009) was also used to illustrate the roles of the signature in the regulation of tumor-infiltrating immune cells in HCC tissues.
Statistical analyses
We used R version 3.30 and the R package for all statistical calculations. We used the t-test or Wilcoxon test for group comparisons. The “Rtsne” R package was used to analyze t-SNE. Univariate and multivariate Cox regression analysis was run by the “survival” R package. One-way analysis of variance (ANOVA) or Welch’s ANOVA was used to compare the two samples. Univariate and multivariate regression analyses evaluated the model’s predictive value. Generally, p < 0.05 was considered statistically significant.
Results
Screening of exosome-related prognostic lncRNAs in liver cancer
First, we randomly divided the 371 TCGA-HCC patients into a training cohort of 247 and a validation cohort of 124. Table 1 shows the clinicopathological information characteristics of the two cohorts. There was no significant difference in any clinicopathological features.
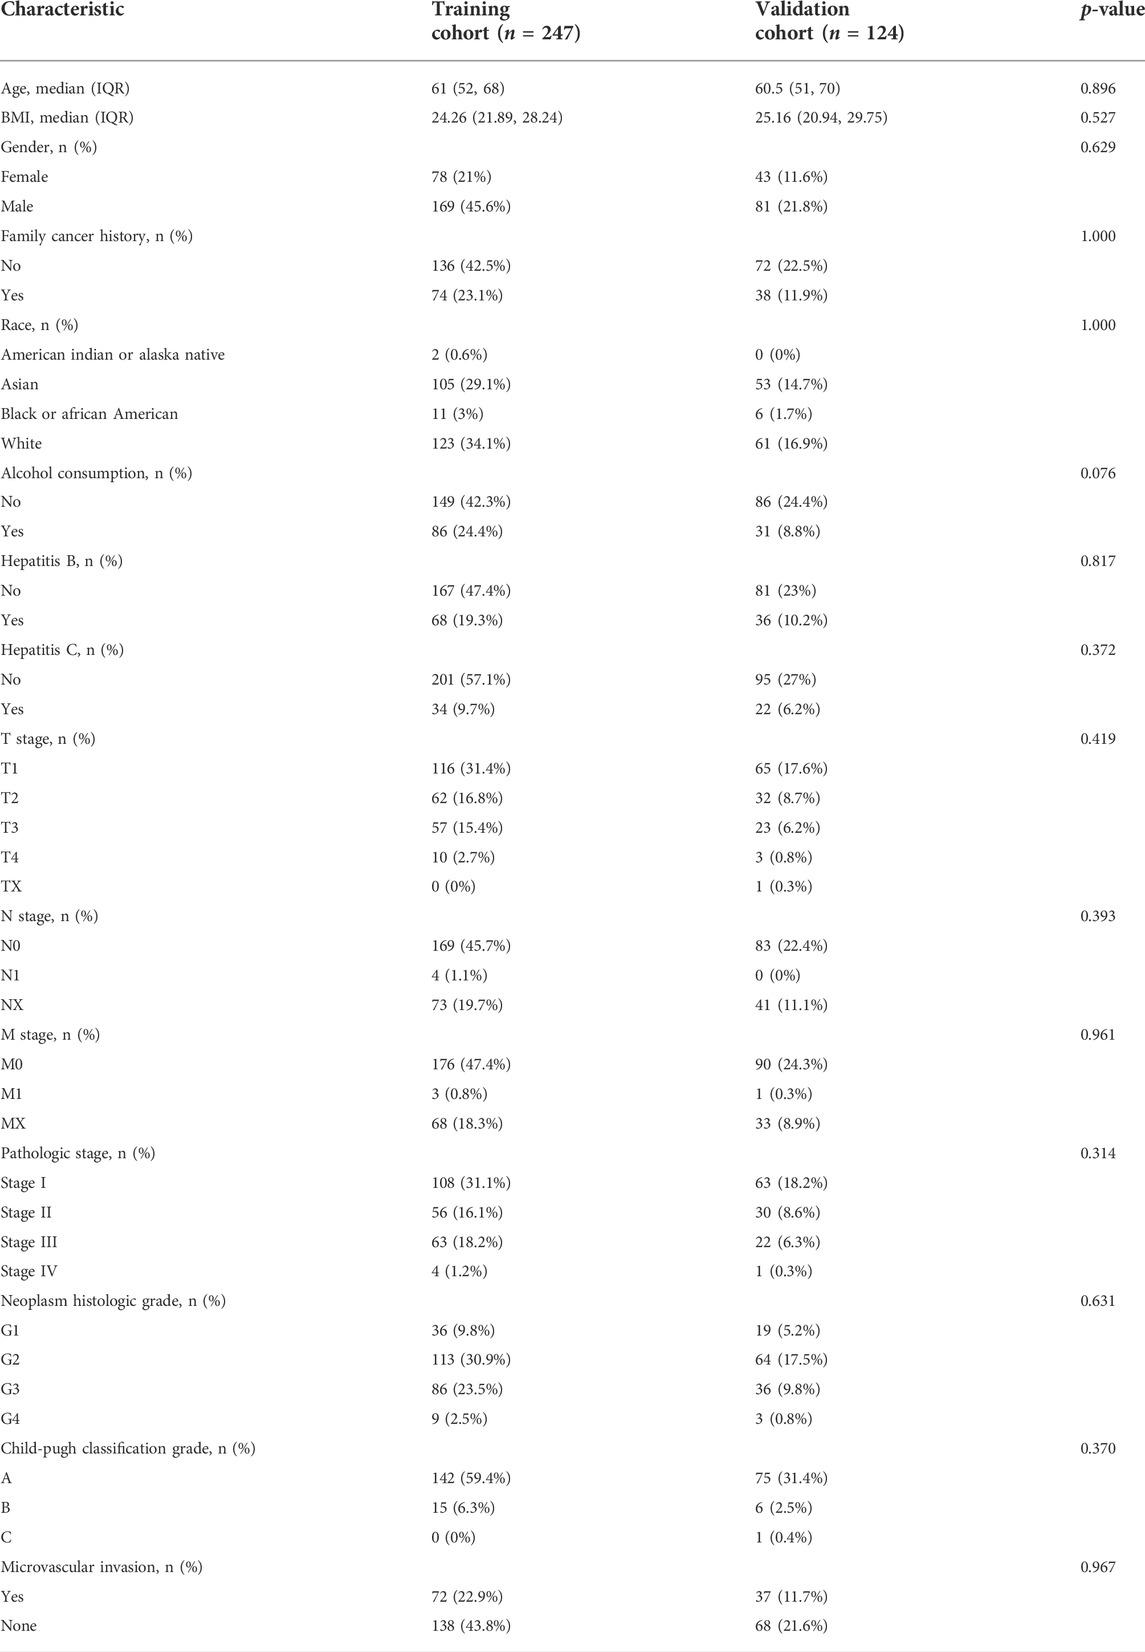
TABLE 1. The characteristics of liver cancer patients in the training cohort and validation cohort.
Based on previous studies, we obtained 120 exosome-related genes (Wang et al., 2021; Xu et al., 2022). We obtained 40 prognosis-related exosomal genes through univariate Cox regression analysis. After Pearson correlation analysis of RNA sequence information and prognosis-related exosomal genes from 371 patients, 871 exosomal lncRNAs were preliminarily obtained. Then, the roles of exosome-related lncRNAs in patients prognosis were identified with a Pearson correlation coefficient |R2| > 0.5. Through univariate Cox regression analysis, 114 lncRNAs involved in the prognosis of liver cancer patients were obtained. Among these lncRNAs, 110 exosomal lncRNAs were differentially expressed in liver cancer samples. LASSO regression analysis in the training cohort was used to reduce our candidate genes and build risk models. Finally, five prognostic-related exosomal lncRNAs were obtained by LASSO regression analysis in the training cohort. The research flow chart is shown in Figure 1A. The heatmap showed the upregulated expression of five candidate lncRNAs in liver cancer and surrounding normal tissues (Figure 1B). Similarly, Figure 1C shows the expression profiles of five lncRNAs in normal tissues and tumor tissues, and their expression was significantly different. Through univariate regression analysis, we identified these five lncRNAs as potential factors predictive of the outcomes of the patients (Figure 1D). The exosome-related genes and lncRNAs obtained by coexpression analysis are shown in Figure 2A. It is worth noting that AC099850.3 was associated with 15 exosome-related genes. In addition, the Sankey diagram illustrated the relationship between exosomal mRNAs, lncRNAs, and risk types (Figure 2B). All of these data support potential roles of the five candidate lncRNAs in liver cancer.
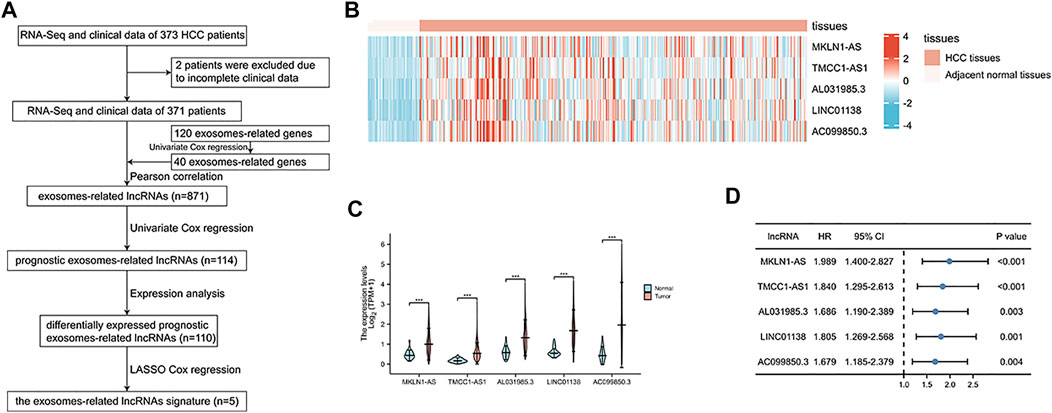
FIGURE 1. Identification of prognostic exosomes-associated lncRNAs in liver cancer patients. (A) The flow chart for the construction of exosome-related lncRNA signature. (B) Heatmap of 5 prognostic exosome-related lncRNAs in cancer tissues and adjacent normal tissues. (C) The expression of 5 prognostic exosome-related lncRNAs in normal and tumor tissues. (D) Univariate Cox regression of 5 prognostic exosome-related lncRNAs. *p < 0.05; **p < 0.01; ***p < 0.001; ****p < 0.0001.
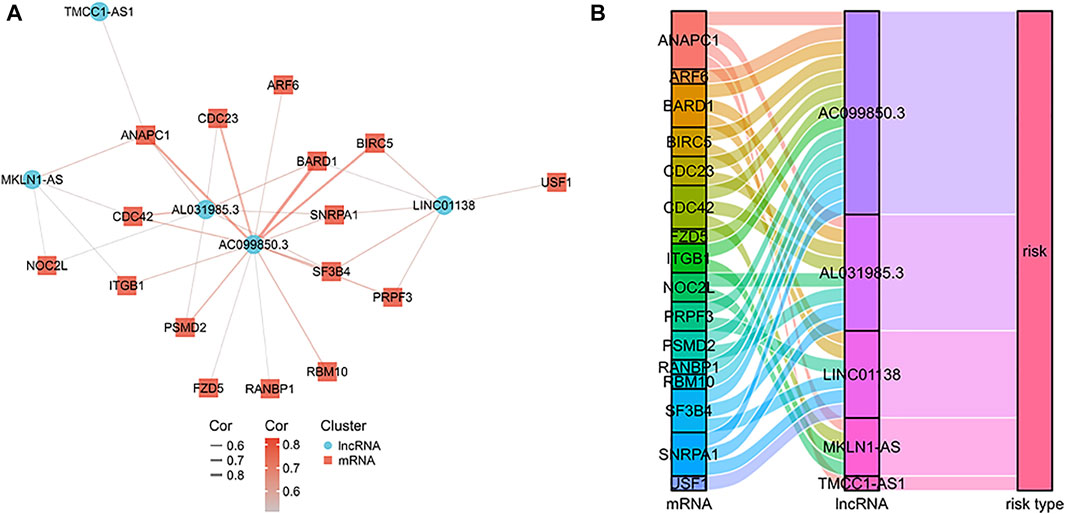
FIGURE 2. The mRNA-lncRNA co-expression network. (A) The co-expression network of the exosome-related genes and candidate lncRNAs. (B) Sankey diagram showing the connection degree between the exosome-related genes and candidate lncRNAs.
Construction and verification of the exosomes-related LncRNA signature
Using LASSO regression, we constructed a five exosomal lncRNA signature associated with the patient prognosis. We calculated our risk score according to the following formula: (0.19396×MKLN1-AS) + (0.20146×TMCC1-AS1) + (0.03562×AL031985.3) + (0.07893×LINC01138) + (0.0256×AC099850.3). To further verify the prognostic values of this risk model, we then divided all patients into high-risk and low-risk groups in the two cohorts according to their median risk score (Figure 3A,D). The signature and demographic characteristics of the two cohort samples are shown in Tables 2, 3. The survival analysis showed that the survival of high-risk patients in the two cohorts was worse than that of low-risk patients (Figure 3B,C). The ROC curve indicated that the area under the curve (AUC) reached 0.782 at 1 year, 0.718 at 3 years, and 0.723at 5 years in the training cohort and 0.776 at 1 year, 0.706 at 3 years, and 0.646 at 5 years in the validation cohort (Figure 3E,F). Subsequently, the multivariate and univariate regression analyses in the two cohorts suggested that this risk score could be an independent risk factor for the prognosis of liver cancer patients (Table 4, 5).
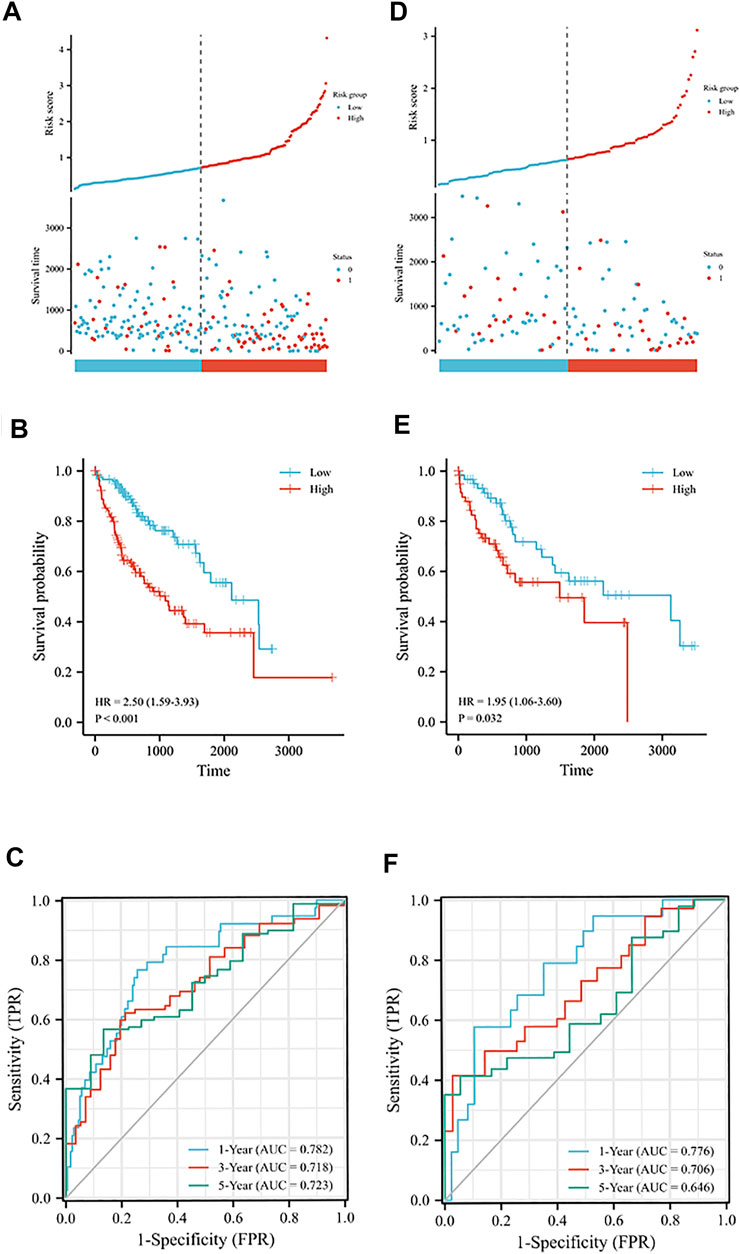
FIGURE 3. Prognostic analysis of exosome-related lncRNA signature in the training and validation cohorts. (A) Distribution of risk scores and overall survival status in the training cohort. (B) Kaplan-Meier curves for the overall survival of patients in the high- and low-risk groups in the training cohort. (C) The time-dependent ROC curves supporting prognostic accuracy of the risk score in the training cohort. (D) Distribution of risk scores and overall survival status in the validation cohort. (E) Kaplan-Meier curves for the overall survival of patients in the high- and low-risk groups in the validation cohort. (F) The time-dependent ROC curves supporting prognostic accuracy of the risk score in the validation cohort.
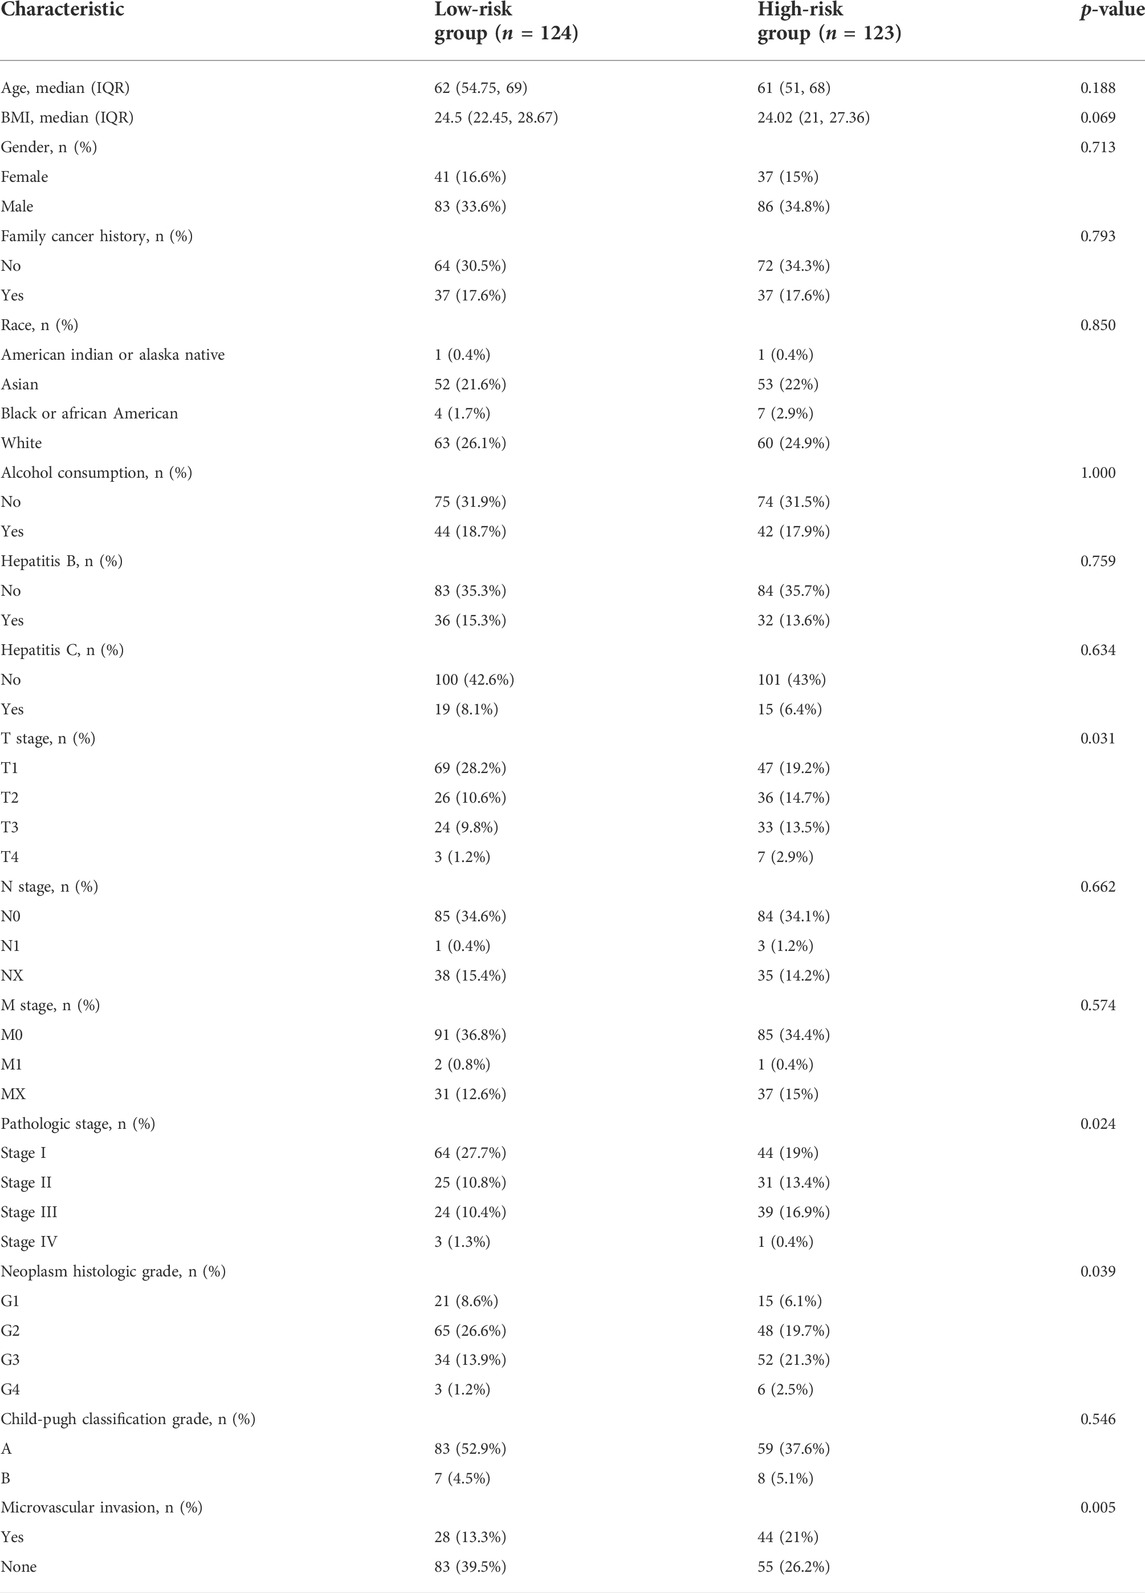
TABLE 2. Associations between the signature and patients’ characteristics in the training cohort.
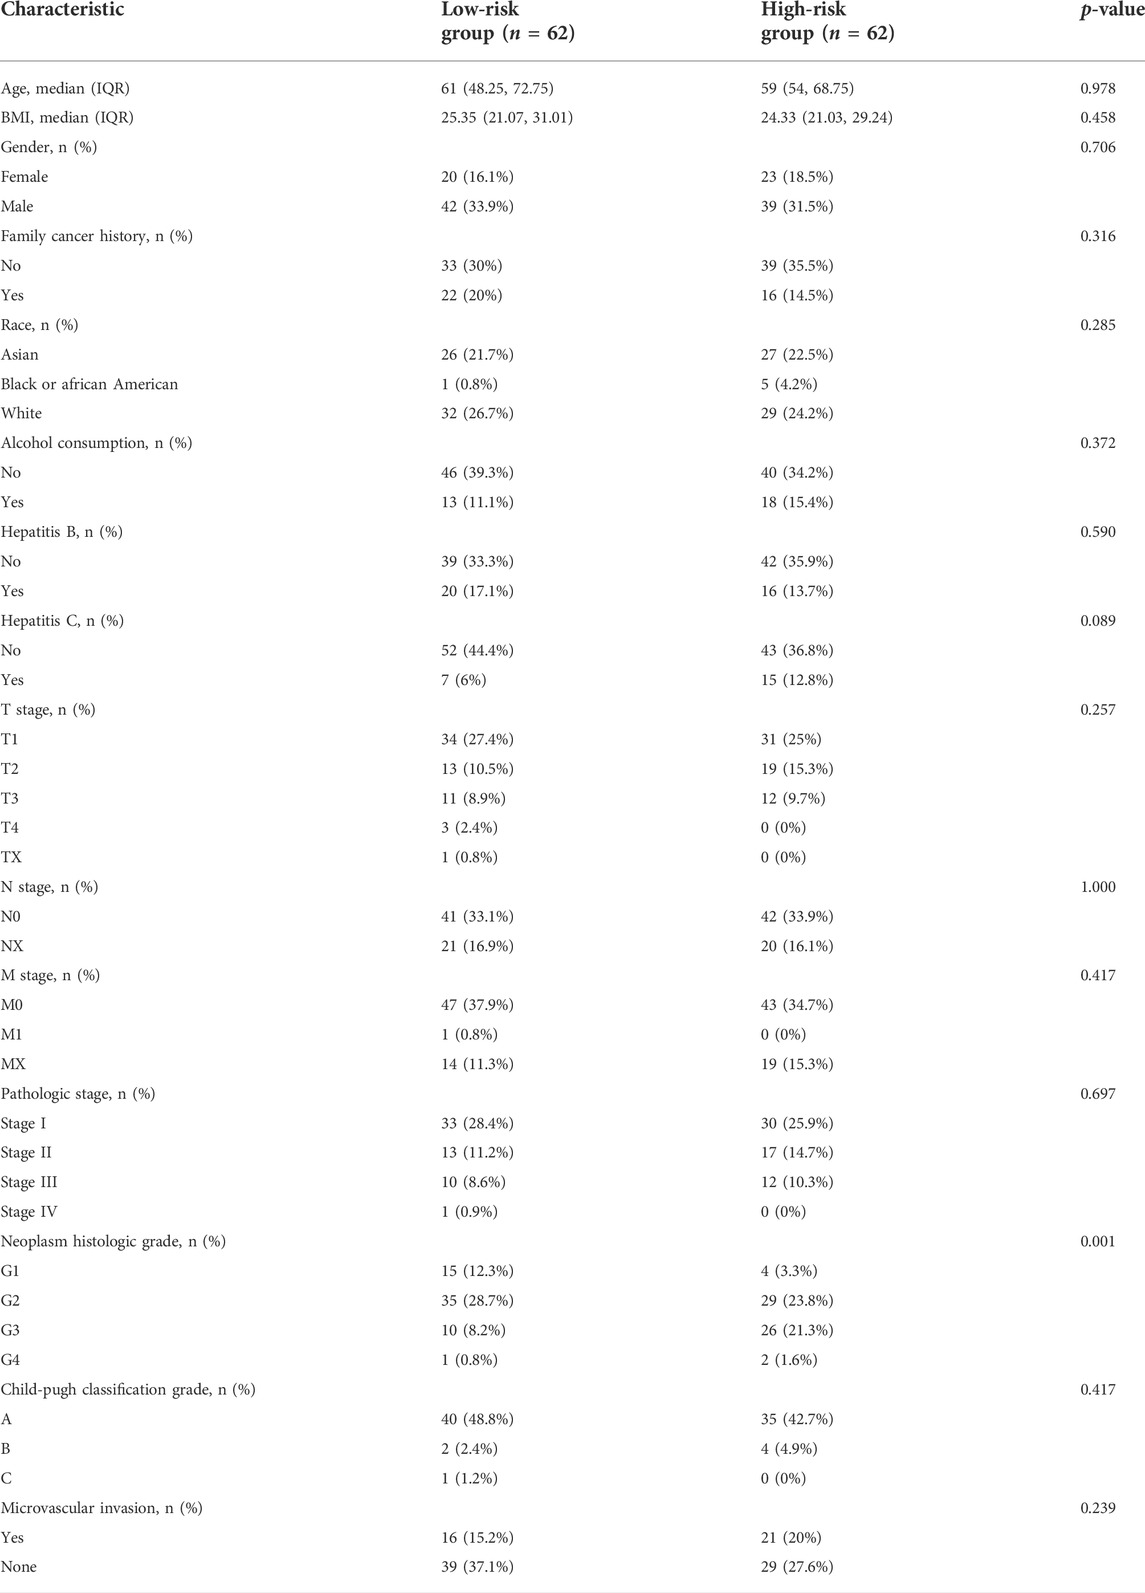
TABLE 3. Associations between the signature and patients’ characteristics in the validation cohort.
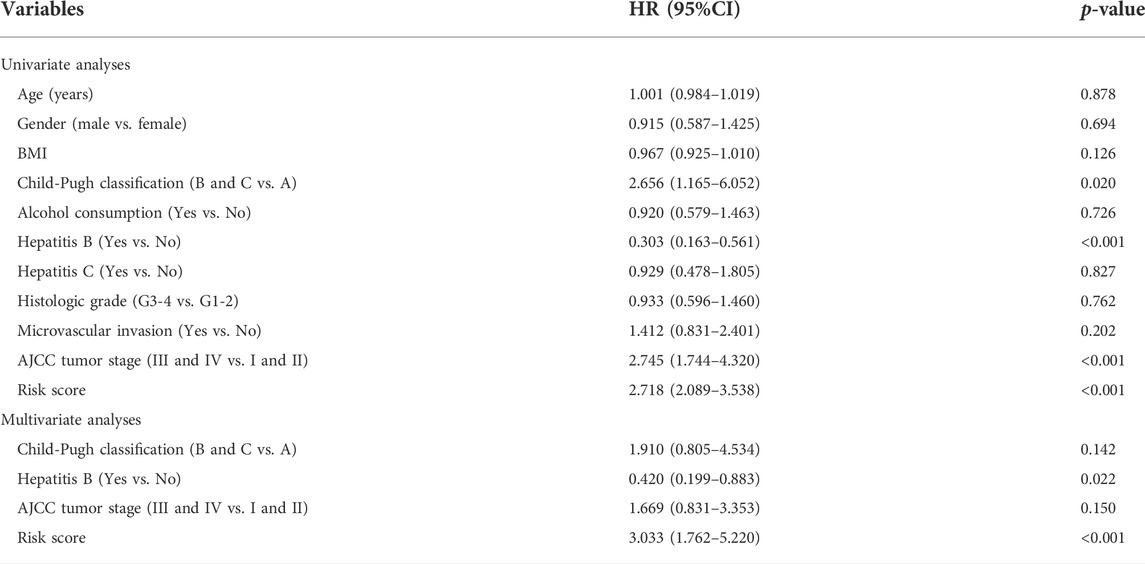
TABLE 4. Univariate and multivariate analyses of risk factors in the training cohort.
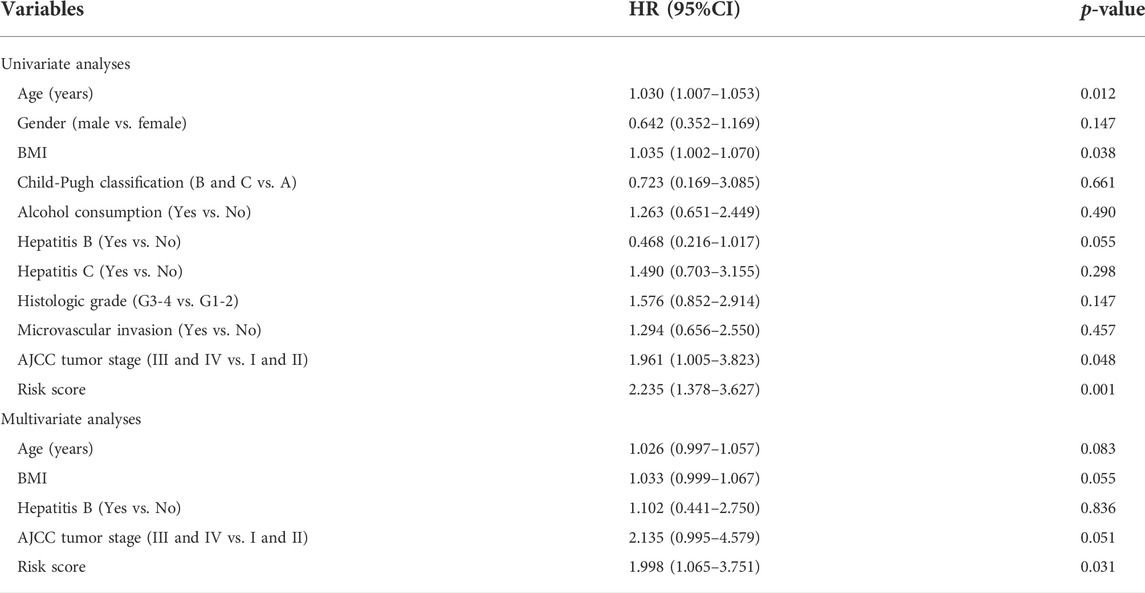
TABLE 5. Univariate and multivariate analyses of risk factors in the validation cohort.
Construction of a nomogram with clinicopathological information
Univariate regression analysis of all liver patients indicated that hepatitis B was a protective factor for the patients outcome, while the AJCC tumor stage and risk score were both risk factors for the outcome of HCC patients (Figure 4A). To further increase the clinical applicability of this model, a nomogram was constructed according to the multivariate regression analysis of patients’ prognostic factors. A nomogram including age, hepatitis B, clinical stage, and risk score was constructed to predict the 1-, 3-, and 5-years survival probability of liver patients with a C-index of 0.705 (Figure 4B).
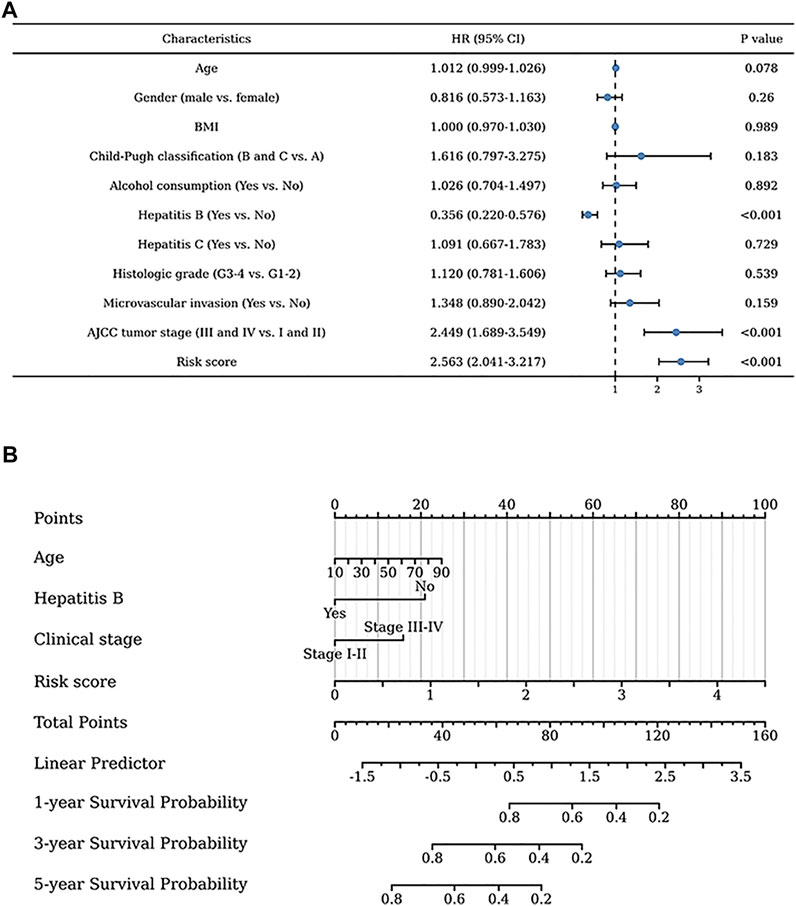
FIGURE 4. Clinical values of the exosome-related lncRNA signature. (A) The univariate regression analysis of clinical factors for the patients’ prognosis. (B) The nomogram was constructed to further identify the clinical applicability of this risk model.
The relationship between the signature and immune-related pathways
Gene set enrichment analysis (GSEA) revealed the underlying mechanisms of this signature in liver cancer (Supplementary Table S2). Figures 5A–I shows the nine immune-associated signaling pathways regulated by this risk model, such as the interaction between L1 and ankyrins, autoimmune thyroid disease, the recycling pathway of L1, the INFLAM pathway, antigen processing and presentation, the NK-cells pathway, the IL5 pathway, the CTLA4 pathway and TCR signaling. These results suggested the potential functional roles of the exosomes-related lncRNA signature in the regulation of the immune response in liver cancer patients.
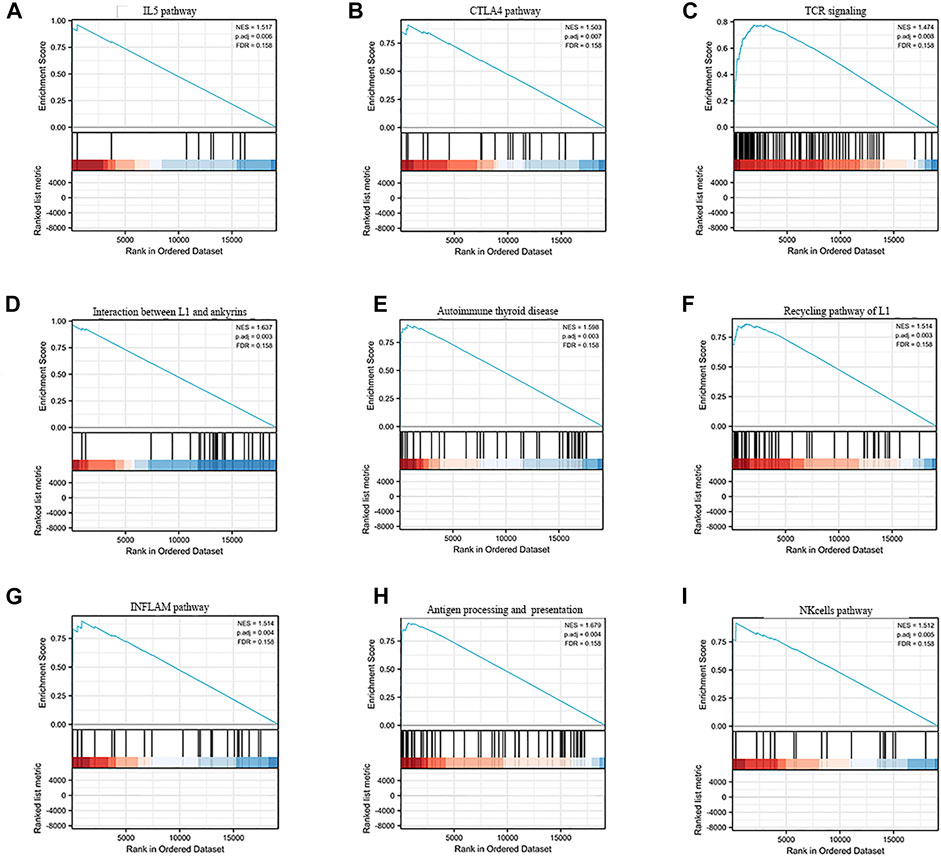
FIGURE 5. GSEA enrichment analysisof the exosome-related lncRNA prognostic signature. (A–I) The nine immune-associated signaling pathways regulated by this risk model, such as (A) IL5 pathway, (B) CTLA4 pathway, (C) TCR signaling, (D) Interaction between L1 and ankyrins, (E) Autoimmune thyroid disease, (F) Recycling pathway of L1, (G) INFLAM pathway, (H) Antigen processing and presentation and (I) NK cells pathway.
To better explore the relationship between this signature and the immune microenvironment, we used the CIBERSORT algorithm to evaluate the potential function of this signature in immune cell infiltration in liver patients. The distribution profiles of the tumor-infiltrating immune cells in liver cancer patients are shown in Figure 6A,B. T-cell CD4+ memory activation, M0 macrophages, resting myeloid dendritic cells, and neutrophils were highly expressed in patients with high risk scores. In addition, we explored the differential expression of several immune checkpoints in high-risk and low-risk HCC patients and found that Programmed death-1 (PD-1), Programmed cell death-ligand 1(PD-L1), Cytotoxic T-lymphocyte-associated protein 4 (CTLA4), B7 homolog 3 protein (B7-H3), V-Set Immunoregulatory Receptor (VSIR), Lymphocyte activation gene 3 (LAG3) and T-cell immunoreceptor with immunoglobulin and ITIM (TIGIT) were all highly expressed in high-risk patients (Figure 6C). Finally, the correlation analysis of different immune cells is shown in Figure 6D,E. These results might provide possible theoretical support for patients’ choice of immunotherapy methods and immunotherapy targets in the future.
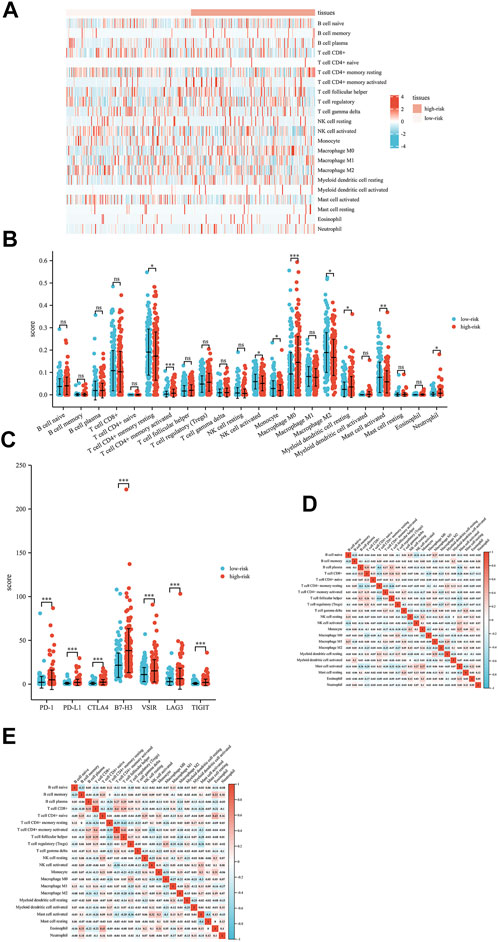
FIGURE 6. Interactions between the exosome-related lncRNA signature and immune regulation in liver cancer patients. (A) Heatmap of the tumor-infiltrating immune cell in low-risk and high-risk patients. (B) Comparisons of immune cells between the low-risk group and high-risk group. (C) Comparisons of multiple immune checkpoints between the low-risk group and high-risk group, including PD-1, PD-L1, CTLA4, B7-H3, VSIR, LAG3 and TIGIT. (D) Correlation matrix of immune cells in high-risk group patients. (E) Correlation matrix of immune cells in low-risk group patients. *p < 0.05; **p < 0.01; ***p < 0.001; ****p < 0.0001.
Discussion
At present, an increasing number of studies have shown that exosomes play a key role in the growth, metastasis, and drug resistance of various cancer cells (Cheng et al., 2019; Mai et al., 2021). Our study screened exosome-related lncRNAs related to prognosis and constructed a prognosis-related lncRNA risk model for liver cancer patients. We also constructed a nomogram combined with the patient’s risk score to predict the prognosis and survival possibility at 1, 3, and 5 years, which further increased the practicability of this model. Then, we analyzed GSEA and the immune microenvironment, which may reveal new targets for liver cancer treatment in the future. This study might provide a new perspective on risk stratification and immunotherapy in patients with HCC.
Exosome-associated RNAs have a unique expression profile reflecting tumor characteristics, and their role in tumor development and metastasis is gradually emerging (Liang et al., 2020; Shang et al., 2020). In recent years, studies have shown that an imbalance of exosomal lncRNAs participates in many pathological processes, including liver cancer (Verduci et al., 2019). However, the detailed effect of exosome-lncRNA interactions on the development and treatment of liver cancer is still unknown. The serum exosomal lncRNA FAL1 could significantly improve liver cancer cell proliferation and migration ability, proving that exosome-related lncRNA FAL1 is a novel diagnostic and therapeutic target for liver cancer (Li et al., 2018).
In our study, five upregulated exosome-related lncRNAs (MKLN1-AS, TMCC1-AS1, AL031985.3, LINC01138, and AC099850.3) were used to construct a prognosis-related risk model for liver cancer. To date, the lncRNA muskelin 1 antisense RNA (MKLN1-AS) has been proven to be a carcinogenic regulator in HCC, able to promote the growth of tumors (Pan et al., 2022). Other studies have shown that MKLN1-AS is regulated by SOX9 transcription and enhances the effect of SOX9 on the proliferation and epithelial-mesenchymal transition (EMT) of liver cancer cells (Guo et al., 2022). TMCC1-AS1 has been considered another oncogene in recent studies, and can promote the proliferation and migration of liver cancer cells (Chen et al., 2021). Genome-wide analysis of long noncoding RNAs in liver cancer indicated that TMCC1-AS1 was negatively associated with overall survival and recurrence-free survival (Cui et al., 2017).At the same time, some studies also found that TMCC1-AS1 can predict the response of HCC patients to chemotherapy and immunotherapy (Deng et al., 2020). In previous studies, lncRNA AL031985.3 has been shown to be related to the tumor microenvironment and the prognosis of liver cancer (Wu et al., 2021). LINC01138 promotes malignant behaviors by activating arginine methyltransferase 5 in liver cancer cells, revealing LINC01138/PRMT5 axis as an ideal target for liver cancer treatment (Lin et al., 2018). Many studies have found that lncRNA AC099850.3 can promote the malignancy degree of liver cancer (Zhong et al., 2022).
Previous studies have reported that the infiltration of T cells and B cells around tumors can improve the survival rate of liver cancer patients (Garnelo et al., 2017). Other studies have found that the infiltration of macrophages is related to a good prognosis in liver cancer patients. The lower infiltration of immune cells in hepatocellular carcinoma is related to the presence of neutrophils, NK cells, and resting mast cells (Rohr-Udilova et al., 2018). In our study, T-cell CD4+ memory activation, M0 macrophages, resting myeloid dendritic cells, and neutrophils are highly invasive in patients with high risk scores. These results suggested that the five-lncRNA signature might have an important impact on immune cell infiltration.
Due to the high degree of malignancy and postoperative recurrence rate of liver cancer, the five-year survival rate is still low (Peng et al., 2021; Yan et al., 2021). In recent years, the emergence of sorafenib and PD-1 inhibitors has greatly prolonged the survival of HCC patients. Our study found that liver cancer patients in the high-risk group had high expression of some immune checkpoints (PD-1, PD-L1, CTLA4, B7-H3, VSIA, LAG3 and TIGIT). In addition, this signature was significantly related to the tumor immune microenvironment, providing potential new immunotherapeutic targets for patients with liver cancer. Moreover, our signature also comprehensively evaluated the prognostic values of liver cancer patients by combining five exosomal lncRNAs, which might help clinicians better manage patients and choose more appropriate treatment methods.
Conclusion
In conclusion, we constructed a signature composed of five exosomal lncRNAs and proved the predictive value of this risk model for the outcome of liver cancer patients. This model is closely related to the immune cell microenvironment and provides a potential direction for research on liver cancer immunotherapy.
Data availability statement
The original contributions presented in the study are included in the article/Supplementary Material, further inquiries can be directed to the corresponding authors.
Ethics statement
Ethical review and approval was not required for the study on human participants in accordance with the local legislation and institutional requirements. Written informed consent for participation was not required for this study in accordance with the national legislation and the institutional requirements.
Author contributions
All authors made substantive intellectual contributions to this study. ZX conceived of the design of the study. DS and ZZ performed the study, collected the data, and contributed to the design of the study. DS, ZZ, and YY prepared the manuscript. ZX and FX edited the manuscript. All authors read and approved the final manuscript.
Funding
This study is supported by the grants from the Natural Science Foundation of Hunan Province (2020JJ5934).
Conflict of interest
The authors declare that the research was conducted in the absence of any commercial or financial relationships that could be construed as a potential conflict of interest.
Publisher’s note
All claims expressed in this article are solely those of the authors and do not necessarily represent those of their affiliated organizations, or those of the publisher, the editors and the reviewers. Any product that may be evaluated in this article, or claim that may be made by its manufacturer, is not guaranteed or endorsed by the publisher.
Supplementary material
The Supplementary Material for this article can be found online at: https://www.frontiersin.org/articles/10.3389/fgene.2022.965329/full#supplementary-material
References
Barbie, D. A., Tamayo, P., Boehm, J. S., Kim, S. Y., Moody, S. E., Dunn, I. F., et al. (2009). Systematic RNA interference reveals that oncogenic KRAS-driven cancers require TBK1. Nature 462 (7269), 108–112. doi:10.1038/nature08460
Chen, C., Su, N., Li, G., Shen, Y., and Duan, X. (2021). Long non-coding RNA TMCC1-AS1 predicts poor prognosis and accelerates epithelial-mesenchymal transition in liver cancer. Oncol. Lett. 22 (5), 773. doi:10.3892/ol.2021.13034
Cheng, S., Li, Z., He, J., Fu, S., Duan, Y., Zhou, Q., et al. (2019). Epstein-Barr virus noncoding RNAs from the extracellular vesicles of nasopharyngeal carcinoma (NPC) cells promote angiogenesis via TLR3/RIG-I-mediated VCAM-1 expression. Biochim. Biophys. Acta. Mol. Basis Dis. 1865 (6), 1201–1213. doi:10.1016/j.bbadis.2019.01.015
Cui, H., Zhang, Y., Zhang, Q., Chen, W., Zhao, H., and Liang, J. (2017). A comprehensive genome-wide analysis of long noncoding RNA expression profile in hepatocellular carcinoma. Cancer Med. 6 (12), 2932–2941. doi:10.1002/cam4.1180
Deng, X., Bi, Q., Chen, S., Chen, X., Li, S., Zhong, Z., et al. (2020). Identification of a five-autophagy-related-lncRNA signature as a novel prognostic biomarker for hepatocellular carcinoma. Front. Mol. Biosci. 7, 611626. doi:10.3389/fmolb.2020.611626
Garnelo, M., Tan, A., Her, Z., Yeong, J., Lim, C. J., Chen, J., et al. (2017). Interaction between tumour-infiltrating B cells and T cells controls the progression of hepatocellular carcinoma. Gut 66 (2), 342–351. doi:10.1136/gutjnl-2015-310814
Guo, C., Zhou, S., Yi, W., Yang, P., Li, O., Liu, J., et al. (2022). SOX9/MKLN1-AS Axis induces hepatocellular carcinoma proliferation and epithelial-mesenchymal transition. Biochem. Genet. doi:10.1007/s10528-022-10196-6
Lee, Y. R., Kim, G., Tak, W. Y., Jang, S. Y., Kweon, Y. O., Park, J. G., et al. (2019). Circulating exosomal noncoding RNAs as prognostic biomarkers in human hepatocellular carcinoma. Int. J. Cancer 144 (6), 1444–1452. doi:10.1002/ijc.31931
Li, B., Mao, R., Liu, C., Zhang, W., Tang, Y., and Guo, Z. (2018). LncRNA FAL1 promotes cell proliferation and migration by acting as a CeRNA of miR-1236 in hepatocellular carcinoma cells. Life Sci. 197, 122–129. doi:10.1016/j.lfs.2018.02.006
Li, S., and Chen, L. (2022). Exosomes in pathogenesis, diagnosis, and treatment of hepatocellular carcinoma. Front. Oncol. 12, 793432. doi:10.3389/fonc.2022.793432
Li, X., Li, C., Zhang, L., Wu, M., Cao, K., Jiang, F., et al. (2020). The significance of exosomes in the development and treatment of hepatocellular carcinoma. Mol. Cancer 19 (1), 1. doi:10.1186/s12943-019-1085-0
Liang, Y., Song, X., Li, Y., Chen, B., Zhao, W., Wang, L., et al. (2020). LncRNA BCRT1 promotes breast cancer progression by targeting miR-1303/PTBP3 axis. Mol. Cancer 19 (1), 85. doi:10.1186/s12943-020-01206-5
Lin, Y. T., Liu, W., He, Y., Wu, Y. L., Chen, W. N., Lin, X. J., et al. (2018). Hepatitis B virus X protein increases 8-oxo-7, 8-dihydro-2'-deoxyguanosine (8-oxodg) level via repressing MTH1/MTH2 expression in hepatocytes. Cell. Physiol. biochem. 51 (1), 80–96. doi:10.1159/000495166
Ma, T., Zhou, X., Wei, H., Yan, S., Hui, Y., Liu, Y., et al. (2020). Long non-coding RNA SNHG17 upregulates RFX1 by sponging miR-3180-3p and promotes cellular function in hepatocellular carcinoma. Front. Genet. 11, 607636. doi:10.3389/fgene.2020.607636
Mai, Z., Chen, H., Ye, Y., Hu, Z., Sun, W., Cui, L., et al. (2021). Translational and clinical applications of dental stem cell-derived exosomes. Front. Genet. 12, 750990. doi:10.3389/fgene.2021.750990
Pan, G., Zhang, J., You, F., Cui, T., Luo, P., Wang, S., et al. (2022). ETS Proto-Oncogene 1-activated muskelin 1 antisense RNA drives the malignant progression of hepatocellular carcinoma by targeting miR-22-3p to upregulate ETS Proto-Oncogene 1. Bioengineered 13 (1), 1346–1358. doi:10.1080/21655979.2021.2017565
Peng, B., Yan, Y., and Xu, Z. (2021). The bioinformatics and experimental analysis of AlkB family for prognosis and immune cell infiltration in hepatocellular carcinoma. PeerJ 9, e12123. doi:10.7717/peerj.12123
Rohr-Udilova, N., Klinglmüller, F., Schulte-Hermann, R., Stift, J., Herac, M., Salzmann, M., et al. (2018). Deviations of the immune cell landscape between healthy liver and hepatocellular carcinoma. Sci. Rep. 8 (1), 6220. doi:10.1038/s41598-018-24437-5
Shang, A., Gu, C., Wang, W., Wang, X., Sun, J., Zeng, B., et al. (2020). Exosomal circPACRGL promotes progression of colorectal cancer via the miR-142-3p/miR-506-3p- TGF-β1 axis. Mol. Cancer 19 (1), 117. doi:10.1186/s12943-020-01235-0
Shen, M., Shen, Y., Fan, X., Men, R., Ye, T., and Yang, L. (2020). Roles of macrophages and exosomes in liver diseases. Front. Med. 7, 583691. doi:10.3389/fmed.2020.583691
Subramanian, A., Tamayo, P., Mootha, V. K., Mukherjee, S., Ebert, B. L., Gillette, M. A., et al. (2005). Gene set enrichment analysis: a knowledge-based approach for interpreting genome-wide expression profiles. Proc. Natl. Acad. Sci. U. S. A. 102 (43), 15545–15550. doi:10.1073/pnas.0506580102
Sung, H., Ferlay, J., Siegel, R. L., Laversanne, M., Soerjomataram, I., Jemal, A., et al. (2021). Global cancer statistics 2020: GLOBOCAN estimates of incidence and mortality worldwide for 36 cancers in 185 countries. Ca. Cancer J. Clin. 71 (3), 209–249. doi:10.3322/caac.21660
Thakur, A., Ke, X., Chen, Y. W., Motallebnejad, P., Zhang, K., Lian, Q., et al. (2021). The mini player with diverse functions: extracellular vesicles in cell biology, disease, and therapeutics. Protein Cell 13, 631–654. doi:10.1007/s13238-021-00863-6
Verduci, L., Strano, S., Yarden, Y., and Blandino, G. (2019). The circRNA-microRNA code: emerging implications for cancer diagnosis and treatment. Mol. Oncol. 13 (4), 669–680. doi:10.1002/1878-0261.12468
Viveiros, P., Riaz, A., Lewandowski, R. J., and Mahalingam, D. (2019). Current state of liver-directed therapies and combinatory approaches with systemic therapy in hepatocellular carcinoma (HCC). Cancers 11 (8), E1085. doi:10.3390/cancers11081085
Wang, X., Chai, Z., Pan, G., Hao, Y., Li, B., Ye, T., et al. (2021). ExoBCD: a comprehensive database for exosomal biomarker discovery in breast cancer. Brief. Bioinform. 22 (3), bbaa088. doi:10.1093/bib/bbaa088
Wu, Z. H., Li, Z. W., Yang, D. L., and Liu, J. (2021). Development and validation of a pyroptosis-related long non-coding RNA signature for hepatocellular carcinoma. Front. Cell Dev. Biol. 9, 713925. doi:10.3389/fcell.2021.713925
Xu, Z., Cai, Y., Liu, W., Kang, F., He, Q., Hong, Q., et al. (2022). Downregulated exosome-associated gene FGF9 as a novel diagnostic and prognostic target for ovarian cancer and its underlying roles in immune regulation. Aging (Albany NY) 14 (4), 1822–1835. doi:10.18632/aging.203905
Xu, Z., Peng, B., Liang, Q., Chen, X., Cai, Y., Zeng, S., et al. (2021). Construction of a ferroptosis-related nine-lncRNA signature for predicting prognosis and immune response in hepatocellular carcinoma. Front. Immunol. 12, 719175. doi:10.3389/fimmu.2021.719175
Yan, Y., Liang, Q., Xu, Z., Huang, J., Chen, X., Cai, Y., et al. (2021). Downregulated ferroptosis-related gene STEAP3 as a novel diagnostic and prognostic target for hepatocellular carcinoma and its roles in immune regulation. Front. Cell Dev. Biol. 9, 743046. doi:10.3389/fcell.2021.743046
Zhang, Z., Xu, Z., and Yan, Y. (2021). Role of a pyroptosis-related lncRNA signature in risk stratification and immunotherapy of ovarian cancer. Front. Med. 8, 793515. doi:10.3389/fmed.2021.793515
Keywords: liver cancer, exosomes, lncRNAs, prognostic signature, tumor immune microenvironment
Citation: Su D, Zhang Z, Xu Z, Xia F and Yan Y (2022) A prognostic exosome-related LncRNA risk model correlates with the immune microenvironment in liver cancer. Front. Genet. 13:965329. doi: 10.3389/fgene.2022.965329
Received: 30 June 2022; Accepted: 01 August 2022;
Published: 23 August 2022.
Edited by:
Xiaofei Zhi, Columbia University, United StatesReviewed by:
Feijing Wu, Columbia University, United StatesXinzheng Guo, Columbia University, United States
Xiaomeng Yin, University of Massachusetts Medical School, United States
Copyright © 2022 Su, Zhang, Xu, Xia and Yan. This is an open-access article distributed under the terms of the Creative Commons Attribution License (CC BY). The use, distribution or reproduction in other forums is permitted, provided the original author(s) and the copyright owner(s) are credited and that the original publication in this journal is cited, in accordance with accepted academic practice. No use, distribution or reproduction is permitted which does not comply with these terms.
*Correspondence: Zhijie Xu, eHpqMTMyMjAwN0Bjc3UuZWR1LmNu; Fada Xia, eGlhZmFkYUBjc3UuZWR1LmNu
†These authors have contributed equally to this work and share first authorship